AERATION: Principles and Practice ( VOLUME 11 ) - Chapter 4 ppt
Bạn đang xem bản rút gọn của tài liệu. Xem và tải ngay bản đầy đủ của tài liệu tại đây (2.66 MB, 51 trang )
© 2002 by CRC Press LLC
Deep Tank Aeration with
Blower and Compressor
Considerations
4.1 INTRODUCTION
Typical depths of diffused aeration tanks vary over a range from 3.50 to 6.00 m.
This range is illustrated by an evaluation of 98 published performance tests in
Germany (Pöpel and Wagner, 1989) showing the following tank depth distribution:
• tank depths greater than 6.00 m: 10 percent
• tank depths 4.00 to 6.00 m: 50 percent
• tank depths less than 4.00 m: 40 percent
Greater tank depths, 20 to 30 m, equipped with special ejector systems for
oxygenation, have been used for treating industrial effluents only by applying the
so-called “tower-biology” (Bayer company; Diesterweg et al., 1978) and bio-high-
reactor (Hoechst company; Leistner et al., 1979). These systems produce very small
bubbles (micrometer range), which remain stable at the high salinity (some 20 g/l)
of the wastewater. However, at municipal wastewater conditions, these bubbles
would coalesce and lead to poor oxygen transfer performance.
There is, however, a strong tendency towards greater tank depths, probably due
to the following reasons:
• when upgrading wastewater treatment plants for biological nutrient
removal, especially for biological nitrogen removal, the required increase
of tank volume leads to much less area usage at greater depth;
• due to the higher oxygen transfer efficiency at greater tank depth, less air
is required, producing less off-gas and odor problems and leading to less
extensive gas cleaning equipment;
• in addition to the rise of the oxygen transfer efficiency, also an increase
of the aeration efficiency is expected, which would lead to energy savings.
Consequently, a number of activated sludge plants in Europe have been upgraded
for nutrient removal using significantly greater tank depths than stated above.
Table 4.1. (Wagner, 1998) gives more detailed information on this development. In
this context, deep diffused aeration tanks can be defined by having a depth of
(significantly) greater than 6.00 m.
4
© 2002 by CRC Press LLC
Possible disadvantages of deep aeration tanks have also been envisaged imme-
diately with the advent of greater tank depth (ATV-Arbeitsbericht, 1989). In each
case, these have to be carefully considered, and measures need to be taken to prevent
any process impairment, if required. The potential drawbacks are:
• decreased CO
2
stripping from the wastewater due to the required smaller
airflow rates, giving rise to a more intensive lowering of the pH-value,
especially at low alkalinity. This occurrence may impair or even terminate
nitrification unless countermeasures like addition of lime (pH) or soda
ash (pH and alkalinity) are taken;
• supersaturation of mixed liquor, with respect to all gases, due to the
high(er) water pressure. Whereas the oxygen is generally utilized, a seri-
ous supersaturation with respect to nitrogen may remain in the tank
effluent and lead to (partial) solids flotation in the secondary clarifier. This
problem can be solved by either limiting the tank depths to (not yet
precisely known) values to avoid excessive nitrogen supersaturation or by
installing special constructions for gas release between aeration tank and
secondary clarifier;
• the process of aeration and gas transfer in deeper tanks has been thor-
oughly investigated and modeled only recently (Pöpel and Wagner, 1994;
Pöpel et al., 1998). Hence, there was (is) much uncertainty with respect
to design of diffused aeration systems in deep tanks.
In this chapter, the process of oxygen transfer in deep tanks is characterized and
modeled, based on the involved physical mechanisms. Although these hold, obviously,
TABLE 4.1
Examples of Deep Aeration Tanks at
European Municipal Wastewater Treatment Plants
City
Water
Depth
m
Aeration Tank
Volume
m
3
Diffuser
Material
Type of
Blower
Bonn, D 12.90 135,100 di-m C + S
Bottropp, D 10.00 31,300 pl-m + do-c C
Frankfurt, D 8.00 57,600 di-rpp C
Heilbronn, D 7.80 45,000 di-m C
Helsinki, SF 12.00 60,000
*
di-m C
Stockholm, S 12.00 110,000
*
di-m C
diffuser submergence
≈
water depth – 0.25 m
*
= average of variable volume allotted to nitrification, i.e., under aeration
C = centrifugal blower pl = plate
S = crew compressor c = ceramic
di = disc m = membrane
do = dome rpp = rigid porous plastic
© 2002 by CRC Press LLC
for any water depth, some of them can be neglected for more shallow tanks without
greater inaccuracies. The model is then verified by an extensive investigation and
evaluation program leading to useful empirical relations for design. The application
of the model is outlined at the end of the first section.
The question of (higher) aeration efficiency in deep aeration tanks is covered in
the following section. First, the components of the air supply system and their energy
requirements are discussed, followed by an outline of different types of blowers and
their energy consumption as a function of diffuser submergence. The above model
is then applied to develop principles of blower selection for optimum aeration
efficiency and hence maximum energy savings.
4.2 OXYGEN TRANSFER IN DEEP TANKS
4.2.1 C
HARACTERIZATION
OF
THE
P
ROCESS
OF
O
XYGEN
T
RANSFER
IN
D
EEP
T
ANKS
In an aeration tank of
H
(m) of water depth, the bubbles are released at the depth of
diffuser submergence of
H
S
(m), generally 0.20 to 0.30 m less than the wastewater
depth
H
. The actual difference depends upon the height of the specific diffuser system
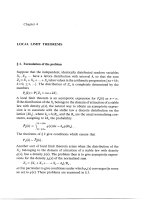
construction (see Figure 4.1). The water level is exposed to the atmospheric pressure,
P
a
. The total pressure,
P
t
, at the bubble release level (
h
= 0) is given as follows.
(4.1)
FIGURE 4.1
Schematic of deep tank.
P
a
SOTE(0) = 0
SOTE(h
2
)
SOTE(h
1
)SOTE
s
(h
1
)
∆h
o
course of bubbles h
water depth H
level of diffuser
bubble release
h
2
h
1
diffuser submergence H
S
PP gH
ta S
=+⋅⋅
ρ
© 2002 by CRC Press LLC
Because of this pressure, the bubble volume is reduced as is the interfacial area,
A
, through which gas transfer takes place. Secondly, the local saturation concentra-
tion of oxygen,
c
s
,
(and other gases contained in air) is increased proportional to this
pressure growth. This
c
s
-increase is especially remarkable because the air composi-
tion is still unchanged by gas transfer with 21 percent of oxygen. Thirdly, the oxygen
transfer coefficient,
k
L
, being a function of bubble size, is reduced accordingly.
Following the bubbles along their rise from
h
= 0 to
h
=
H
S
after bubble release,
the total pressure
P
t
is reduced, and the bubble volume expands. This occurrence
causes the interfacial area
A
to grow again and
k
L
to increase, eventually attaining
its “normal value”.
Also, by this pressure decrease, the saturation concentrations of all gases con-
tained in air are reduced again. With respect to oxygen utilized by activated sludge
or carbon dioxide liberated from it, the composition of the air is changed, which
also affects the local saturation concentration. The oxygen content of the air is
reduced due to the oxygen transfer efficiency from
h
= 0 to
h
=
h
(OTE(
h
) as indicated
in Figure 4.1). The CO
2
content is slightly decreased in clean water (tests) by some
stripping and significantly
increased
under operational conditions by biological CO
2
production. These processes also change the bubble volume (slightly), which is
normally neglected.
Consequently, despite the enlargement of the interfacial area,
A
, and the gas
transfer coefficient,
k
L
,
the specific oxygen transfer efficiency OTE
s
is continually
decreasing (see Figure 4.1). This decrease is mainly due to the reduction of
c
s
by
the changes of pressure and air composition.
When approaching the water level (
h
≈
H
S
), the bubbles reach characteristics
(with the exception of gas composition) they would have without any additional
water pressure, hypothetically at a tank depth of zero or in very shallow tanks. These
conditions of an aeration system of zero (or very small) depth and unchanged air
composition are indicated by a subscript of zero:
• bubble volume
V
B
:
V
B
0
(m
3
)
• bubble diameter
d
B
:
d
B
0
(m)
• interfacial area
A
:
A
0
(m
2
)
• specific interfacial area
a
:
a
0
(m
–1
)
• gas transfer coefficient
k
L
:
k
L
0
(m/h)
• saturation concentration
c
s
:
c
s
0
(g/m
3
), if air composition is not changed
These “standard values” are used as references in modeling the described mech-
anisms later.
Again, it is pointed out, that the above processes and changes of bubble and
transfer characteristics occur in aeration tanks of conventional or even shallow depth.
However, the consequences for the rate and efficiency of gas transfer are so small
that they can be neglected, and it is only in tanks of greater depth that they have to
be taken into account quantitatively.
With respect to oxygen transfer to the water, it should be noted that there is an
important oxygen concentration gradient in the rising bubbles. The highest oxygen
© 2002 by CRC Press LLC
content is present immediately after bubble release and the lowest when the bubbles
leave the water at the surface. In the technique of off-gas measurement, use is made
of this phenomenon. On the other hand, the (waste) water content of an aeration tank
is fully mixed in the vertical direction. This difference has been shown in the multitude
of oxygen transfer tests under clean and dirty water conditions with oxygen probes
placed at different depths within a tank. In other words, there is no oxygen gradient
present in the (waste) water. Finally, this means that transfer of oxygen takes place
only during the bubble rise from
h
= 0 to
h
=
H
S
, and this transferred oxygen is then
distributed over the full body of water or over the complete water depth
H
. In modeling
oxygen transfer, this has to be taken into account quantitatively. This influence is
strong in shallow tanks, where the difference between water depth and depth of
diffuser submergence is relatively large. It diminishes as the water depth increases.
4.2.2 M
ODELING
OF
THE
P
ROCESS
OF
O
XYGEN
AND
G
AS
T
RANSFER
IN
D
EEP
T
ANKS
4.2.2.1 Influence of Depth and Water Pressure on
the Transfer Parameters
To quantify the influence of atmospheric plus water pressure on the transfer of
oxygen, the pressure situation within the tank has to be thoroughly defined and
quantified. To this end, the hydraulic pressure (m water column, WC) within the
tank at depth
h
(see Figure 4.1) is converted into the standard unit
P
(Pa; N/m
2
) and
then related to the atmospheric standard pressure of
P
a
= 101 325 Pa = 101.325 kPa.
A bubble at depth
h
is exposed to an additional water pressure of
∆
P
(m WC) =
(
H
S
–
h
), or
∆
P
(Pa) = 9,810
⋅
(
H
S
– h
), and hence, to a total pressure of
P
a
+
∆
P
.
Relating this total pressure to the atmospheric standard pressure of
P
a
yields the
relative pressure
π
.
(4.2)
the conversion factor,
z
, being
z
= 9,810/101,325 = 0.0968
≈
0.1.
The rounded value of 0.1 reflects the rule of thumb, that 10 m of water column
will double the standard pressure. In the following, the relative pressure
π
is the
relevant pressure parameter for quantifying the influence of tank depth on oxygen
transfer via the influenced parameters
k
L
,
a
, and
c
s
. These parameters, together with
the water volume of the aeration tank,
V
, define the standard oxygen transfer rate
SOTR (kg/h).
(4.3)
π
=+ =+
⋅−
()
=+⋅ −
()
=+ ⋅ −
()
≈+ ⋅ −
()
11
9 810
101 325
1 1 0 0968 1 0 1
∆P
P
Hh
zH h H h H h
a
S
SSS
,
,
SOTR
kacV
Ls
=
⋅⋅ ⋅
1000
© 2002 by CRC Press LLC
The following definitions apply.
V
water volume of aeration tank [m
3
]
A total interfacial area [m
2
]
a specific interfacial area = A/V [m
–1
]
A
at
bottom area of aeration tank [m
2
]
k
L
liquid film coefficient [m/h] where k
L
·a is similar to K
L
a
20
in
Equation (2.42)
c
s
oxygen saturation concentration [mg/l] similar to in Equation (2.42)
G
s
standard airflow rate [m
N
3
/h at STP]
As pointed out when characterizing the process of oxygen transfer in deep tanks,
the first three parameters of Equation (4.3), k
L
, a, and c
s
, depend on water pressure
and c
s
, additionally on oxygen reduction within the bubble air. Since these effects
are normally neglected, this equation is actually applicable for very shallow tanks
(H → 0), only and should be written for these conditions with a subscript of zero.
(4.4)
This approach holds also for the standard oxygen transfer efficiency SOTE (–, %)
and its specific value SOTE
s
(m
–1
, %/m), based on the fraction or percent of oxygen
absorbed per meter water depth, H. It differs slightly from per meter of bubble rise
H
S
, although generally reported in this latter way. Both SOTE parameters will be
extensively applied in modeling. With an oxygen content of ambient air of 300
g/m
N
3
, the result is similar to Equation (2.51).
(4.5)
More accurately for shallow tanks (H → 0), the SOTE
0
is defined as follows
(4.6)
Similarly, the specific oxygen transfer efficiency SOTE
s
can be formulated. It
has to be noticed, however, that SOTE
s
is reduced during the bubble rise due to
pressure changes and oxygen reduction in the air, as will be shown quantitatively
later. Hence, the average value SOTE
sa
over the full bubble rise is calculated by
dividing SOTE by the water depth H (not by the depth of diffuser submergence H
S
).
(4.7)
C
∞20
*
SOTR
kacV
o
Lo o so
=
⋅⋅ ⋅
1000
SOTE
kacV
G
SOTR
G
Ls
ss
==
⋅⋅ ⋅
⋅
=
⋅
mass of O transferred
mass of O supplied
2
2
300 0 3.
SOTE
kacV
G
SOTR
G
o
Lo o so
s
o
s
=
⋅⋅ ⋅
⋅
=
⋅300 0 3.
SOTE
kacV
GH
SOTR
GH
sa
Ls
ss
=
()
⋅
()
=
⋅⋅ ⋅
⋅⋅
=
⋅⋅
average mass of O transferred
mass of O supplied water depth H of aeration tank
2
2
300 0 3.
© 2002 by CRC Press LLC
Again, this equation can be expressed for very shallow tanks (H → 0).
(4.8)
The process of oxygen transfer in deep tanks is modeled by expressing the
parameters varying with depth (k
L
, a, and c
s
) as functions of their value for shallow
tanks (k
L
0
, a
0
, and c
s
0
). These functions are derived based on the physical laws
governing the depths dependent processes as characterized in Section 4.2.1.
The pressure influence on the bubble size is modeled by the universal gas law
(P⋅V = m⋅R⋅T), to which the relative pressure π (Equation 4.2) is applied (π⋅V =
m⋅R⋅T/P
a
= constant). Hence, the product of the relative pressure π and the bubble
volume V
B
is constant, and the bubble volume V
B
0
is reduced inversely proportional
to the relative pressure π as defined in Equation 4.2.
(4.9)
Assuming geometrically similar deformation of the bubble by compression, the
bubble diameter d
B
0
is changed by the 1/3-power of the volume change.
(4.10)
Finally, the total area, A, and the specific area, a, are related by the second power
of the diameter. This relationship leads to the dependence of the interfacial area on
pressure and on depth H
S
– h.
(4.11)
Next to the area parameters, the liquid film coefficient, k
L
, is influenced by the
pressure-dependent bubble diameter, d
B
, as was shown by Mortarjemi and Jameson
(1978) and Pasveer (1955). Their findings are plotted in Figure 4.2. Already in 1935,
Higbie proposed the penetration theory for quantifying this interrelationship as given
in Equation 2.21.
(4.12)
SOTE
kacV
GH
SOTR
GH
so
Lo o so
s
o
s
=
⋅⋅ ⋅
⋅⋅
=
⋅⋅300 0 3.
V
VV
zH h
B
Bo Bo
S
==
+⋅ −
()
π
1
d
dd
zH h
B
Bo Bo
S
==
+⋅ −
()
[]
() ()
π
13 13
1
A
AA
zH h
a
aa
zH h
oo
S
oo
S
==
+⋅ −
()
[]
==
+⋅ −
()
[]
() ()
() ()
π
π
23 23
23 23
1
1
k
Dv
d
L
B
B
=
⋅
⋅
2
π
© 2002 by CRC Press LLC
Here, v
B
(m/h) is the rise or slip velocity of the bubble with respect to water. As
follows from Figure 4.2, this equation is valid only for bubbles greater than 2 mm.
Generally, fine bubbles have an equivalent diameter of some 2 mm, so that the Higbie
theory cannot yield correct results for compressed fine bubbles of smaller than 2 mm.
By combining the results of Mortarjemi, Jameson, and Pasveer [k
L
= f(d
B
)] with
Equation 4.10 [d
B
= f(d
B
0
, H
S
-h)], an empirical relation is developed relating the
liquid film coefficient to depth.
(4.13)
This function proceeds from a liquid film coefficient k
L
0
= 0.48 mm/s, typical for
an equivalent bubble diameter of d
B
= 3.0 mm. Figure 4.2 shows that the k
L
data are
fitted very well by Equation 4.13. It should be noted, however, that a bubble diameter
of 2 mm is reduced to only 1.55 mm in a 12 m deep tank. Hence, the liquid film
coefficient is influenced only slightly under practical conditions.
The last parameter influenced by pressure is the oxygen saturation concentration.
This effect is quantified by multiplication of c
s
0
, the standard saturation concentration
without water pressure, with the relative pressure π.
(4.14)
FIGURE 4.2 Liquid film coefficient as a function of the equivalent bubble diameter after
Mortarjemi and Pasveer, Higbie theory and empirical function. (From Pöpel and Wagner,
1994, Water Science and Technology, 30, 4, 71–80. With permission of the publisher, Perga-
mon Press, and the copyright holders, IAWQ.)
kk Hh
LLo S
=⋅ − ⋅ −
()
[]
exp .0 0013
cc c zHh
sso so S
=⋅=⋅+⋅ −
()
[]
π
1
© 2002 by CRC Press LLC
In this case, however, the parameter c
s
0
is also affected by the oxygen transfer
during bubble rise, decreasing the oxygen partial pressure in the bubble air. This
influence is quantified via the standard oxygen transfer efficiency SOTE(h) during
the bubble rise from h = 0 to h = h. In Figure 4.1, for instance, the SOTE-values
for h = h
1
and h = h
2
are depicted for the purpose of illustration; quantities, which
are yet unknown. With SOTE(h), as standard oxygen transfer efficiency from the
level of bubble release until depth h, the saturation concentration is decreased
correspondingly.
(4.15)
By combining Equations 4.14 and 4.15, the final expression for the saturation
concentration at any height above the diffusers, h, is obtained.
(4.16)
In summary, the influence of depth on the three basic transfer parameters, a, k
L
,
and c
s
, can be expressed by simple mathematical functions found in Equations 4.11,
4.13, and 4.16, respectively. They include the respective values without water pres-
sure, a
0
, k
L
0
, and c
s
0
, and the standard oxygen transfer efficiency during bubble rise
from the release level until h.
4.2.2.2 Development of the Model
To develop the transfer model for deep tanks, the pressure influenced transfer
parameters, Equations 4.11, 4.13, and 4.16, are inserted into Equations 4.7 and 4.8
to define the specific standard oxygen transfer efficiency as a function of depth.
(4.17)
(4.18)
(4.19)
c c SOTE h
sso
=⋅−
()
[]
1
c c z H h SOTE h
sso S
=⋅+⋅ −
()
[]
⋅−
()
[]
11
SOTE h
kacV
GH
SOTE h
zH h
Hh
s
Lo o so
s
S
S
()
=
⋅⋅ ⋅
⋅⋅
⋅−
()
[]
⋅
+⋅ −
()
[]
+⋅−
()
[]
()
300
1
1
0 0013
13
exp .
SOTE h SOTE SOTE h
zH h
Hh
SOTE SOTE h h
sso
S
S
so
()
=⋅−
()
[]
⋅
+⋅ −
()
[]
+⋅−
()
[]
=⋅−
()
[]
⋅
()
()
1
1
0 0013
1
13
exp .
Φ
Φ h
zH h
Hh
S
S
()
=
+⋅ −
()
[]
+⋅−
()
[]
()
1
0 0013
13
exp .
© 2002 by CRC Press LLC
Equations 4.18 and 4.19 state that the specific standard oxygen transfer efficiency
SOTE
s
at any depth position, h, within the tank depends on
• the specific standard oxygen transfer efficiency of the aeration system in a
very shallow tank, SOTE
so
. This parameter is further applied as a character-
istic for the effectiveness of the aeration system and is referred to as “basic
specific oxygen transfer efficiency” SOTE
so
;
• the standard oxygen transfer efficiency up to this position, and
• a (mathematical) function Φ(h) of this position h and the depth of sub-
mergence H
S
of the diffuser system.
The differential equation for the deep tank model is derived on the basis of this
approach and the transfer efficiencies depicted in Figure 4.1. The rise of the bubbles
from the release level to the tank depths h
1
and h
2
yields the respective standard
oxygen transfer efficiencies, SOTE(h
1
) and SOTE(h
2
). At depth h
1,
the specific
standard oxygen transfer efficiency amounts to SOTE
s
(h
1
). The increase of SOTE
over the reach from h
1
to h
2
is quantified by the product of the local specific standard
oxygen transfer efficiency [SOTE
s
(h
1
)] and the bubble rise ∆h.
(4.20)
with ∆h = h
2
– h
1
Equation 4.20 can be rearranged into a difference equation.
(4.21a)
Applying the limit of ∆h → 0 yields a differential equation.
(4.21b)
The last two lines of Equation 4.21 are obtained by inserting the derived Equation
4.18 for quantifying SOTE
s
(h) to give the final differential equation of the model.
Equation 4.21 is a nonhomogeneous linear differential equation of the first order,
which can only be solved numerically (e.g., by the Runge–Kutta Method) due to
the structure of Φ(h). The solution can also found by means of a PC spreadsheet.
The numerical integration has to proceed from h = 0 to h = H
S
.
SOTE h SOTE h SOTE h h
s21 1
()
=
()
+
()
⋅∆
SOTE h
SOTE h SOTE h
h
s
()
=
()
−
()
21
∆
SOTE h
d SOTE h
dh
SOTE SOTE h
zH h
Hh
SOTE SOTE h h
s
so
S
S
so
()
=
()
[]
=⋅−
()
[]
⋅
+⋅ −
()
[]
+⋅−
()
[]
=⋅−
()
[]
⋅
()
()
1
1
0 0013
1
13
exp .
Φ
© 2002 by CRC Press LLC
4.2.2.3 Model Results
By integration of the model, the influence of depth on oxygen transfer can be shown
for different conditions (depth H and SOTE
so
) via graphical presentation. The
progress of the standard oxygen transfer efficiency SOTE(h), as a function of bubble
rise, is the basic result of the integration. Additionally, the local specific standard
oxygen transfer efficiency (SOTE
s
(h) in %/m) along this lift is obtained as an
intermediate result. Due to interactions of pressure and oxygen uptake, as quantified
by Equations 4.11, 4.13, and 4.16, SOTE
s
(h) has its maximum value at the bubble
release level and is continuously decreasing thereafter. The standard oxygen transfer
efficiency SOTE(h), however, is increased correspondingly. These changes exhibit
an almost linear relation to the bubble rise in shallow tanks (where the slight influence
of pressure prevails). A more curved dependency exists in deeper tanks, where, along
with the total pressure, the decrease in oxygen partial pressure of the bubbles due
to the oxygen uptake becomes important.
This dependency is illustrated by the following examples for three different tank
depths (3.00, 6.00, and 12.00 m with a bubble release level of 0.30 m above the tank
bottom). These depths are combined with three different aeration systems, which are
identified by their basic specific oxygen transfer efficiency SOTE
so
(4, 6, and 9 %/m).
For each tank depth, the specific oxygen transfer efficiency SOTE
s
(h) and the standard
oxygen transfer efficiency SOTE(h) are depicted as a function of the bubble rise from
release (h = 0) until water level (h = H
S
= H – 0.3 m) in Figures 4.3 to 4.5.
As can be read from the figures, the function lines are almost straight in
Figure 4.3 (H = 3.00 m) and become increasingly curved when going to Figures 4.4
FIGURE 4.3 Specific (%/m) and standard (%) oxygen transfer efficiency in a tank of 3.00 m
water depth and a depth of diffuser submergence of 2.70 m. (From Pöpel and Wagner, 1994,
Water Science and Technology, 30, 4, 71–80. With permission of the publisher, Pergamon
Press, and the copyright holders, IAWQ.)
© 2002 by CRC Press LLC
FIGURE 4.4 Specific (%/m) and standard (%) oxygen transfer efficiency in a tank of 6.00 m
water depth and a depth of diffuser submergence of 5.70 m. (From Pöpel and Wagner, 1994,
Water Science and Technology, 30, 4, 71–80. With permission of the publisher, Pergamon
Press, and the copyright holders, IAWQ.)
FIGURE 4.5 Specific (%/m) and standard (%) oxygen transfer efficiency in a tank of 12.00 m
water depth and a depth of diffuser submergence of 11.70 m. (From Pöpel and Wagner, 1994,
Water Science and Technology, 30, 4, 71–80. With permission of the publisher, Pergamon
Press, and the copyright holders, IAWQ.)
© 2002 by CRC Press LLC
(H = 6.00 m) and 4.5 (H = 12.00 m). In this sequence, the standard oxygen transfer
efficiency of the three aeration systems is strongly increasing from shallow (11, 16,
and 22 percent) to greatest depth (41, 55, and 71 percent), and the local specific
oxygen transfer efficiency SOTE
s
(h) is reduced due to oxygen depletion in the air
bubble. In the deepest tank (Figure 4.5), the specific oxygen transfer efficiencies of
all three aeration systems are attenuated from 5.1 to 11.4 %/m at bubble release to
almost the same value, 2.3 to 2.7 %/m, near the water level.
The above information on SOTE
s
(h) and its characteristics illustrates very clearly
the changes of this parameter, as well as oxygen transfer, during bubble rise in tanks
of different depths. For practical application, however, the average value over the
full tank depth H, SOTE
sa
, as defined by Equation (4.7), is of more importance. It
can be calculated from the obtained values for SOTE(h = H
S
) = SOTE.
(4.22)
In the 12.00 m deep tank, for instance, SOTE
sa
is calculated from the above
SOTE values (41, 55 and 71 percent) of the three different aeration system as 3.4,
4.6, and 5.9 %/m. This figure is much lower than the three basic specific oxygen
transfer efficiencies of 4.0, 6.0 and 9.0 %/m, mainly due to oxygen depletion in the
air during bubble rise. In generalizing this information, the SOTE and the SOTE
sa
values for tanks from H = 0.00 m to H = 15.00 m depth are calculated and plotted
versus tank depth H in Figure 4.6. Six different aeration systems with basic specific
oxygen transfer efficiencies from SOTE
so
= 4 %/m to 9 %/m are used. The bubble
release level is assumed 0.30 m above the tank bottom, important only for the specific
oxygen transfer efficiency SOTE
sa
.
The characteristics of the SOTE
sa
lines near the bubble release level differ
considerably from the local SOTE
s
(h) lines in Figures 4.3 to 4.5 for the following
reason: in a tank with a depth equal to the bubble release level, no oxygen can be
transferred, and hence, SOTE(h = 0) = 0 and also SOTE
sa
= SOTE/H = 0 (Equation
4.22). When increasing the tank depth, the bubble rise (H
S
) is still very small as is
the SOTE. This little quantity is divided by H > H
S
, leading to an insignificant
average specific oxygen transfer efficiency SOTE
sa
. As can be seen from Figure 4.6,
SOTE
sa
reaches maximum values at tank depths close to H = 2.70 m (system with
SOTE
so
= 9 %/m) until H = 5.75 m (system with SOTE
so
= 4 %/m). Both depicted
functions, SOTE
sa
= f(H) and SOTE = f(h), will be applied later for designing aeration
systems in deeper tanks.
4.2.3 MODEL VERIFICATION
The derived model is verified in two ways. First, 98 published performance tests in
aeration tanks of different depth varying from 3.40 m to 12.00 m (Pöpel and Wagner,
1994) are evaluated, and the results verify the model qualitatively. Secondly, the
results of an extensive full-scale experiment with water depths from H = 2.50 m to
H = 12.50 are applied for a more rigorous certification of the model.
SOTE
SOTE h H
H
SOTE
H
sa
S
=
=
()
=
© 2002 by CRC Press LLC
4.2.3.1 Qualitative Verification
The oxygen transfer results from 98 published performance tests are presented in two
ways for comparison with the model. First, the data are depicted for six depth classes
as a function of the specific airflow rate (m
N
3
of air per hour per m
3
of aerated water
volume) in two figures (Figure 4.7 and 4.8). In Figure 4.7, the standard oxygen transfer
efficiency SOTE (%) is plotted on the ordinate, whereas in Figure 4.8, the average
specific oxygen transfer efficiency SOTE
sa
(%/m) is plotted. Secondly, the measured
FIGURE 4.6 Standard oxygen transfer efficiency SOTE (%) and average specific oxygen transfer
efficiency SOTE
sa
(%/m) as a function of water depth and of six aeration systems defined by their
basic SOTE
so
(%/m). (From Pöpel and Wagner, 1994, Water Science and Technology, 30, 4, 71–80.
With permission of the publisher, Pergamon Press, and the copyright holders, IAWQ.)
© 2002 by CRC Press LLC
FIGURE 4.7 Standard oxygen transfer efficiency [%] as a function of the specific airflow
rate [cbm/(cbm·h)] and of the water depth H [m]. (From Pöpel and Wagner, 1994, Water
Science and Technology, 30, 4, 71–80. With permission of the publisher, Pergamon Press,
and the copyright holders, IAWQ.)
FIGURE 4.8 Average specific oxygen transfer efficiency [%/m] as a function of specific
airflow rate [cbm/(cbm·h)] and of the water depth H [m]. (From Pöpel and Wagner, 1994,
Water Science and Technology, 30, 4, 71–80. With permission of the publisher, Pergamon
Press, and the copyright holders, IAWQ.)
© 2002 by CRC Press LLC
data are compared with the model calculated for basic specific oxygen transfer
efficiencies, SOTE
so
, from 4 %/m to 9 %/m in two Tables (4.2 and 4.3), referring to
the SOTE (%) and the SOTE
sa
(%/m), respectively.
With respect to SOTE, the significant increase of this parameter with increasing
tank depth can be seen in Figure 4.7. A quantitative comparison is possible via Table 4.2
in which the measured SOTE data range for the six depth classes is given together
with the model data calculated for 4 %/m, 6 %/m, and 9 %/m. The shaded areas of
Table 4.2 indicate that the data variation is very pronounced in the depth ranges up to
6 m. This is due to the great differences in diffuser densities (diffusers per m
2
) of the
investigated aeration tanks having moderate depths. In this depth range, the actual data
are covered by an SOTE-range from 4 to 9 %/m. In the deeper tanks, the actual data
are more stable and are theoretically represented by an SOTE-range from only 6 to 9
%/m. This can be attributed to the meagerness of data, on the one hand, and possibly
also to the more stable streaming patterns of the water in deeper tanks.
An identical qualitative evaluation of the model is obtained from the test data
with respect to the average specific oxygen transfer efficiencies, SOTE
sa
(%/m), in
Figure 4.8 and Table 4.3. In Figure 4.8, the regression lines show lower values as
the depth H increases, as predicted by the model in Figure 4.6 (bottom). This model
does not hold for the lowest depth range 3.5 to 4.0 m, for which the regression line
lies much lower than expected. Reasons for this behavior at very low depths could
be more unstable streaming patterns in very shallow tanks or greater construction
height of the air diffusion system leading to lower diffuser submergence. This data
behaves as predicted for tanks below 2.5 m water depth by the model (see Figure
4.6, bottom, near left ordinate). This behavior is also shown by the lowest values of
the data range in Figure 4.3, where the measured maximum values show a gradual
decrease with increasing depth class as predicted by the model.
TABLE 4.2
Comparison of Measured Data with Calculated Model Data for
the Standard Oxygen Transfer Efficiency, SOTE (%)
Tank Depth Range Data Range Measured
Data Calculated with SOTE
so
=
4 %/m 6 %/m 9 %/m
3.4–4.0 15–29
15 21 30
4.0–4.5 19–35 16 24 33
4.5–6.0 19–45 20 28 40
7.5 36–48 28 39 52
10.0 48–59 36 48 63
12.0 56–69 42 55 70
Reprinted from Pöpel and Wagner, 1994, Water Science and Technology, 30, 4,
71–80. With permission of the publisher, Pergamon Press, and the copyright hold-
ers, IAWQ.
© 2002 by CRC Press LLC
The comparison of the shaded model data in Table 4.3 with the measured data
range reveals the same information as concluded above for the SOTE.
4.2.3.2 Full-Scale Experimental Verification in Clean Water
A rigid quantitative verification of the deep tank model in clean water is carried out
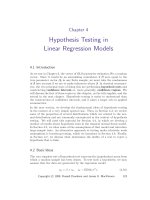
via a full-scale pilot program. The main parts of the pilot plant are the aeration tank,
a screw compressor, the air piping system and the distribution frame with membrane
disc diffusers (see Figure 4.9). Main element is the “deep tank,” a stainless steel
cylinder of 4.25 m diameter (area 14.2 m
2
) and a height of 13 m (volume 184.4 m
3
)
TABLE 4.3
Comparison of Measured Data with Calculated Model Data for
the Average Specific Oxygen Transfer Efficiency SOTE
sa
(%/m)
Tank Depth Range Data Range Measured
Data Calculated with SOTE
so
=
4 %/m 6 %/m 9 %/m
3.4–4.0 4.0–8.2
3.9 5.6 7.9
4.0–4.5 4.5–7.8
3.9 5.5 7.8
4.5–6.0 3.7–7.5
3.8 5.4 7.5
7.5 4.8–6.4 3.7 5.1 6.9
10.0 4.8–5.9 3.6 4.8 6.3
12.0 4.7–5.8 3.5
4.6 5.9
FIGURE 4.9 Schematic of the deep tank pilot plant.
SC
C
SVRG
© 2002 by CRC Press LLC
with five working platforms at different elevations. Diffuser mounting is performed
via a manhole near the tank bottom.
The water level is controlled by means of pneumatic valves for inlet and outlet
and a pressure gauge at the tank bottom, ensuring that the preset water depth is also
maintained at continuous through-flow of water or wastewater. The air supply is
controlled by a screw compressor (Aerzener, type VM 137 D) into the distribution
frame at two points. The diffuser frame allows different diffuser arrangements and
densities to be investigated. The construction height of the diffuser system, including
the necessary piping, amounts to 0.32 m. The disc diffusers are built from polypro-
pylene and equipped with slotted membranes from the Gummi Jäger Company
(Hanover). Altogether, four arrangements are investigated (9, 19, 36 and 55 discs),
leading to diffuser densities of 4.5, 9.5, 17.9, and 27.4 percent respectively. Deoxygen-
ation was performed with pure nitrogen gas during the clean water tests.
Experimental variables for determination of the influence of tank depth on
oxygen transfer are
• the water depth H or diffuser submergence H
S
;
depths of H = 2.50 m, 5.00 m, 7.50 m, 10.00 m, and 12.50 m are tested
with diffuser submergences H
S
of 0.32 m or less.
• the diffuser density DD, expressed as square meter of slotted membrane
area per square meter of tank bottom:
9, 19, 36 and 55 discs are investigated leading to diffuser densities DD
of 4.5, 9.5, 17.9, and 27.4 percent respectively.
• the airflow rate G
s
is varied over three steps so that the second rate yields
a volumetric standard oxygen transfer rate of about SOTR
V
= 100 g/(m
3⋅
h)
O
2
, leading to airflow rates G
s
of 35.5 m
N
3
/h, 71 m
N
3
/h, and 142 m
N
3
/h.
The test series with 19 discs (9.5 percent diffuser density) are repeated to reveal
the accuracy of the testing procedure. Altogether, therefore, the experimental program
comprises 5 water depths, 4 + 1 (repetition) = 5 diffuser densities, and 3 airflow rates,
i.e., 5⋅5⋅3 = 75 single tests. The wide range of diffuser densities and airflow rates
leads to some extraordinary combinations that are never applied in practice (great
depth and diffuser density combined with high airflow rate). They would also lead
to operational problems in practice as well as in testing (great diffuser density
combined with low airflow rates and consequently very low diffuser loading, espe-
cially at low water depth). The experimental results of these combinations were not
included in the data evaluation. Altogether, 18 runs are not included in the evaluation
due to this atypical behavior, leaving 75 – 18 = 57 data sets for final evaluation.
Clean water testing is performed according to the nonsteady state method after
deoxygenation with pure nitrogen gas N
2
, according to the German standard (ATV,
1996) (see also Figure 4.9), leading to an oxygen content of 0.3 mg/l only. The
increase of the oxygen content is measured on-line with seven probes (very accurate
“Orbisphere probes”, Giessen, Germany), arranged at different heights and positions
with respect to the reactor cross section.
In addition to the oxygen concentration, a number of other parameters are
determined: exact water depth at the start and end of each test; water temperature;
© 2002 by CRC Press LLC
conductivity and pH of the water; applied amount of nitrogen; temperature and
humidity of the applied air; airflow rate; temperature of the compressed air in the
piping system ahead of and behind the rotary gas meter; pressure difference at the
slide valve; pressure behind the slide valve and within the diffuser frame; and
atmospheric pressure.
The data of each probe are evaluated with a computer program developed
according to the U.S. standard (ASCE, 1991) with the aeration coefficient k
L
a
T
and the saturation concentration c
s,T
as a result. An optimum fit to the data is
accomplished by variation of the starting point and the number of data evaluated.
Results with more than five percent deviation from the average of all probes are
discarded (ATV, 1979). Finally, the aeration coefficients k
L
a and the saturation
concentration are reduced to (former German) standard conditions (T = 10˚C and
P
a
= 101.325 kPa). The present standard (20˚C) yields values some two percent
higher (OTR
20
/OTR
10
= θ
10
⋅c
s,20
/c
s,10
= 1.024
10
⋅9.09/11.29 = 1.0206). From both
parameters, k
L
a and c
s
, the standard oxygen transfer efficiency SOTE and the
average specific oxygen transfer efficiency SOTE
sa
, are calculated by means of
Equations 4.5 and 4.7 respectively.
If the obtained SOTE
sa
values are converted to the “basic specific oxygen transfer
efficiency” (SOTE
so
-values), the tested aeration system would have at a diffuser sub-
mergence of zero. This conversion is facilitated by the computer program, “O
2
-deep”,
developed on the basis of the derived model (Pöpel et al., 1997), as is explained in
more detail in Section 4.2.4. Whereas the first set of data (SOTE
sa
) is strongly
influenced by water depth, the depth-corrected data (SOTE
so
) cannot show any depth
influence, if the model by which the data were corrected, precisely allows for all
depth influences on SOTR and SOTE. A check on this property will be the final
validation of the model. The remaining effects (diffuser density and airflow rate) are
not affected by the depth correction.
A first impression of the results is given in Table 4.4, by presentation of the
average specific oxygen transfer efficiency SOTE
sa
and the depth corrected basic
specific oxygen transfer efficiency (SOTE
so
), averaged over the different parameters
tested, the diffuser density DD, the water depth H, and the airflow rate G
s
. From
Table 4.4, it is evident that both oxygen transfer efficiencies increase with increasing
diffuser density. With respect to water depth, the generally experienced decrease of
the average specific oxygen transfer efficiency (SOTE
sa
) at depths greater than 4 to
5 m (compare with Figure 4.6; lower part) can be seen. In contrast, the depth
corrected SOTE
so
values vary irregularly between 5.7 and 6.0 %/m, exhibiting a
lower influence of depth than SOTE
sa
. As usual, the highest specific oxygen transfer
efficiency is obtained at the lowest airflow rate. This fact holds for the raw and for
the depth corrected data.
A quantitative analysis of both specific oxygen transfer efficiencies (SOTE
sa
and
SOTE
so
) is performed by linear regression methods. The diffuser submergence H
S
(m), the diffuser density DD (m
2
/m
2
), and the airflow rate G
s
(m
N
3
/h) are independent
variables. The dependent variable (SOTE
sa
) is very difficult to treat with linear
regression; hence, not SOTE
sa
= SOTE/H is applied but rather SOTE/H
S
, which
decreases almost linearly with depth. Due to the slight increase of the specific oxygen
transfer efficiencies at high diffuser densities (see Table 4.4), the natural logarithm
© 2002 by CRC Press LLC
of DD (ln DD) is applied as the variable for regression. The analysis results in the
following equations:
original data as calculated from measurements
(4.23a)
correlation coefficient r = 0.922
standard deviation s = 0.0024 m
–1
= 0.24 %/m
From Equation 4.23a, the average specific oxygen transfer efficiency can be
calculated.
(4.23b)
This equation has the same correlation coefficient, however, with a slightly
smaller standard deviation (H
S
/H < 1), and hence, a slightly higher accuracy. A
graphical representation of the results is given in Figure 4.10. In the upper part, the
influence of water depth on SOTE
sa
at different diffuser densities is plotted using
the average airflow rate of the quoted values, 82.8 m
N
3
/h. The density of 27.4 percent
has not been evaluated but is plotted nevertheless to show that the greatest influence
of diffuser density occurs at low densities. The behavior of these lines is very similar
to the model calculations depicted in Figure 4.6.
The bottom part of Figure 4.10 shows the same depth influence, while combined
with the airflow rate, averaged over all applied diffuser densities, 10.6 percent. It is
evident that the influence of the airflow rate G
s
on the average specific oxygen
transfer efficiency and hence on the standard oxygen transfer efficiency is small
compared with the diffuser density effect.
TABLE 4.4
Average Values of the Average Specific Oxygen Transfer Efficiency
(SOTE
sa
) and the Basic Specific Oxygen Transfer Efficiency (SOTE
so
) at
Different Test Conditions (%/m)
Diffuser Density (%) Water Depth H (m) Airflow Rate G
s
(m
N
3
/h)
value SOTE
sa
SOTE
so
value SOTE
sa
SOTE
so
value SOTE
sa
SOTE
so
4.5 4.22 4.94 2.5 4.81 5.65 35.5 4.96 6.03
9.5 4.98 6.05 5.0 5.18 5.98 71.0 4.88 5.94
17.9 5.24 6.53 7.5 4.99 5.93 142.0 4.68 5.62
10.0 4.75 5.90
12.5 4.46 5.79
SOTE
H
HDDG
S
Ss
=⋅− ⋅⋅+⋅⋅
()
−⋅⋅
−− − −
8 24 10 1 171 10 8 28 10 2 77 10
23 3 5
.ln.
SOTE
H
H
HDDG
sa
S
Ss
=⋅ ⋅ − ⋅⋅+ ⋅ ⋅
()
−⋅⋅
()
−− − −
8 24 10 1 171 10 8 28 10 2 77 10
23 3 5
.ln.
© 2002 by CRC Press LLC
The final validation of the model is performed by analyzing the depth-corrected
data SOTE
so
for any depth influences. If these are removed correctly from the data by
the performed corrections with the program O
2
-deep, then the SOTE
so
-data should be
altogether independent of depth. The regression with all parameters of Equation 4.23
showed no statistically significant influence of depth. Hence, only diffuser density DD
and airflow rate are independent regression parameters.
(4.24)
correlation coefficient r = 0.904
standard deviation s = 0.0028 m
–1
= 0.28 %/m
FIGURE 4.10 Influence on the average specific oxygen transfer efficiency of water depth H
combined with diffuser density (top) and combined with airflow rate (bottom) according to
verification data.
SOTE DD G
so s
=⋅+ ⋅⋅
()
−⋅⋅
−− −
9 00 10 1 164 10 3 69 10
22 5
. . ln .
© 2002 by CRC Press LLC
The depth corrected SOTE
so
values (Equation 4.24) show good agreement with
measured data (high correlation coefficient, low standard deviation) and no signifi-
cant depth influence. This agreement shows that the model sufficiently corrects for
the influence of water depth on oxygen transfer. For practical purposes, it is appli-
cable to deep tanks using fine pore air diffusion with sufficient accuracy as indicated
by the standard deviations of Equations 4.23 and 4.24, ranging from 0.2 to 0.3 %/m.
To visualize the trend of the depth corrected data SOTE
so
, Equation 4.24 is
depicted in Figure 4.11 by plotting SOTE
so
versus the diffuser density for the three
applied airflow rates. Again, the small influence of the airflow rate is evident, whereas
the diffuser density (extrapolated to 27.4 percent) controls SOTE
so
very effectively.
This effect is similar to the results derived from 98 published performance tests
(Pöpel and Wagner, 1989), which are summarized in Figure 4.12 by plotting the
relative SOTR versus diffuser density. The intense data scattering is caused by the
additional influences of water depth and airflow rate on SOTR.
Altogether, the model can be applied for designing aeration systems in deep
tanks. The basic specific oxygen transfer efficiency SOTE
so
of an aeration system
is influenced by the airflow rate and primarily by the diffuser density, as is the
average specific oxygen transfer efficiency SOTE
sa
. Contrary to SOTE
sa
, however,
the basic value SOTE
so
is independent of diffuser submergence and water depth.
4.2.4 MODEL APPLICATIONS
The model can be applied in two ways:
(1) The main influences (depth, diffuser density, airflow rate) on oxygen
transfer parameters can be visualized and applied for a rough parameter
estimation (Figures 4.10 to 4.12). Additionally, this more qualitative infor-
mation can be used for interpolation within the second application.
(2) The SOTR or SOTE of a known aeration system of a certain water depth
can be used to calculate the corresponding parameters of this system at
any other water depth. Whereas the first type of application must be based
on sound engineering judgment of the applicant, the second use is eluci-
dated in more detail as follows.
This main application of the model is to calculate oxygen transfer data of fine
bubble air diffusion systems (to be) installed in deep tanks by applying the experience
gained from similar aeration systems in tanks of conventional or lower depth. The
similarity can be defined by quantifiable parameters, like airflow rate and diffuser
density, and by less quantifiable parameters, like arrangement of the diffusers and
hydraulic streaming patterns, both vertical and horizontal, within the tank. A diffuser
layout of the full floor grid type with almost equal diffuser density will produce
similar streaming patterns in the above sense and allow the model to be applied to
different airflow rates.
For a model application of reasonable accuracy, Figure 4.6 can be applied. High
accuracy is obtained when using the developed computer program, O
2
-deep (Pöpel
© 2002 by CRC Press LLC
FIGURE 4.11 Basic specific oxygen transfer efficiency SOTE
so
as a function of diffuser
density (%) and airflow rate (cum/h at STP).
FIGURE 4.12 Influence of diffuser density on the standard oxygen transfer rate expressed
as percentage of SOTR at 20% density. (Data from Pöpel and Wagner, 1989.)
© 2002 by CRC Press LLC
et al., 1997). The rationale of the approach is explained using Figure 4.6. In the top
figure, the standard oxygen transfer efficiency is depicted as a function of tank depth
H (and height of bubble release level: 0.30 m in this figure) and of the efficacy of
the aeration system expressed by its basic oxygen transfer efficiency SOTE
so
. When
the tank depth is increased, the SOTE is not increased linearly to tank depth but
rather along the curved line of the appropriate SOTE
so
. Similarly, the average specific
oxygen transfer efficiency SOTE
sa
(bottom part of Figure 4.6) follows the declining
line (H > 3.50 m) of the respective SOTE
so
line. A variation of the height of bubble
release level of 0.30 m in Figure 4.6 has little influence on the result, especially at
greater depths, but can accurately be taken care of by the computer program, O
2
-deep.
The model application is illustrated by the following example. An aeration tank
with a full floor coverage fine bubble aeration system has a volume of V = 1,725 m
3
,
a width of 15.00 m, a length of 25.00 m, and a water depth of H = 4.60 m. The
construction height of the aeration system amounts to 0.30 m to give a depth of
diffuser submergence of H
S
= 4.30 m. The manufacturer has performed three clean
water compliance tests at different airflow rates with the results contained in upper
part of Table 4.5.
The manufacturer intends to install the same aeration system at another loca-
tion having the same wastewater characteristics but twice the wastewater flow.
Because of very limited space, the same tank area has to be applied with twice
the tank depth, i.e., with H = 9.20 m. The depth of diffuser submergence amounts
to H
S
= 8.90 m. Because of the double plant loading, the required SOTR is twice
that of the earlier performed tests, viz. 100, 250, and 460 kg/h. The required airflow
rates have to be estimated.
The upper part of Table 4.5 refers to the depth of H = 4.60 m; the lower part
to H = 9.20 m. The first line (line 1) contains the airflow rates G
s
applied for the
three tests, from which the specific airflow rate (G
s
/V) is calculated (line 2) for
illustration purposes, only. Line 3 states the test results in terms of SOTR. The
SOTE (line 4) is determined by from G
s
(line 1) and the measured SOTR values
(line 3) by means of Equation (4.5) [SOTE = SOTR/(0.3⋅G
s
)]. The average specific
oxygen transfer efficiency is obtained from this value by dividing through the water
depth H (SOTE
sa
= SOTE/H).
From either SOTE or SOTE
sa
and the water depth H (and depth of diffuser
submergence H
S
), the basic specific oxygen transfer efficiency SOTE
so
is found either
via Figure 4.6 (upper part for SOTE, bottom part for SOTE
sa
) or by using the program
O
2
-deep. The results, valid for any water depth at the specified airflow rate, are given
in line 6. From Figure 4.6, not more than two significant digits can be read; the
stated results (three significant digits) are calculated with the program.
In test 1, for instance, a value of SOTE
so
= 7.87 %/m is found, very close to the
dotted lines for 8 %/m in Figure 4.6. The conditions with respect to SOTE and
SOTE
sa
for any other depth, H, can easily be estimated by just moving along a line
somewhat below the dotted one.
Although the deeper tank will require a bit higher airflow rate, reducing the
SOTE
so
values insignificantly, the above results are transferred to a water depth of
H = 9.20 m (lines 7 to 10) as a first estimate. In lines 7 and 8, the SOTE and the
SOTE
sa
are estimated applying Figure 4.6 or the model as indicated. Then, the
© 2002 by CRC Press LLC
required airflow rate under these conditions (line 10) is calculated from the new
standard oxygen transfer rates SOTR (line 9) and the obtained SOTE values (line 7),
again by using Equation 4.5 [SOTR = SOTE⋅0.3⋅G
s
]. The new airflow rates surpass
the rates from line 1 by only small amounts (line 11), reducing the SOTE
so
values
to a certain extent (compare Equation 4.24). This extent can be estimated from the
test differences in line 1 (G
s
) and line 6 (SOTE
so
) as follows.
The same approach is applied to calculate the SOTE
so
reduction for test 2 and
test 3 conditions. The results are summarized in line 12. The adjusted SOTE
so
is
TABLE 4.5
Example Data of a Full Floor Coverage Fine Bubble Aeration
System of H = 4.60 m and of H = 9.20 m Water Depth
Line Parameter Unit Test 1 Test 2 Test 3
Conditions at H = 4.60 m water depth
1 Airflow rate G
s
m
N
3
/h 550 1,500 3,000
2 Specific airflow rate m
N
3
/m
3
/h 0.32 0.87 1.74
3 SOTR kg/h 50 125 230
4 SOTE % 30.3 27.8 25.6
5SOTE
sa
%/m 6.59 6.04 5.56
6SOTE
so
%/m 7.87 7.09 6.44
Conditions at H = 9.20 m water depth and at same airflow rate
7 SOTE % 54.5 50.8 47.5
8SOTE
sa
%/m 5.92 5.52 5.16
9 SOTR (definition) kg/h 100 250 460
10 required airflow rate m
N
3
/h 612 1,640 3,228
Conditions at higher airflow rate
11 Additional ∆G
s
m
N
3
/h 62 140 228
12 Reduction of SOTE
so
%/m 0.05 0.08 0.10
13 Adjusted SOTE
so
%/m 7.82 7.01 6.34
14 Adjusted SOTE % 54.3 50.4 47.0
15 Adjusted SOTE
sa
%/m 5.90 5.48 5.10
16 Required airflow rate m
N
3
/h 614 1,653 3,262
17 Add to first estimate % 0.33 0.79 1.05
Comparison of tank depth results
18 Ratio of SOTR — 2 2 2
19 Ratio of G
s
— 1.12 1.10 1.09
∆
∆
SOTE SOTE SOTE
G
GG
m
so so so
s
ss
=−
()
⋅
−
=−
()
⋅
−
=−
,,
,,
,
.%
21
21
709 787
62
1 500 550
0 051