Integrated Assessment of Health and Sustainability of Agroecosystems - Chapter 4 ppt
Bạn đang xem bản rút gọn của tài liệu. Xem và tải ngay bản đầy đủ của tài liệu tại đây (984.12 KB, 36 trang )
91
4
Use of Systems Theory,
Directed Graphs, and
Pulse Process Models
in an Adaptive Approach
to Agroecosystem Health
and Sustainability
4.1 INTRODUCTION
Attempts to understand the interrelationships between, on the one hand, goals and
objectives of communities living in an agroecosystem and, on the other hand, their
planned actions, stated needs, and concerns require the understanding of a com-
plex system. Such a system involves many variables interacting with each other in a
dynamic process. Furthermore, the denition of these variables and their relation-
ships depend on how the communities perceive their world. In attempting to model
such a complex system, one faces a trade-off between the accuracy of the model’s
predictions and the ability to obtain the detailed information needed to build the
model (Roberts and Brown, 1975).
A system, better referred to as a holon to distinguish it from a real-world assem-
blage of structures and functions, is a representation of a situation and consists of an
assembly of elements linked in such a way that they form an organized whole (Flood
and Carson, 1993). An element is a representation of some phenomena by a noun
or a noun phrase. Links between elements represent a relationship between them.
A relationship can be said to exist between two elements if the behavior of one is
inuenced or controlled by the other (Flood and Carson, 1993). Behavior refers to
changes in one or more important attributes of an element. Systems thinking involves
formulating a holon and then using it to nd out about, gain insight into, or engineer
a part of the perceived world.
The difculty in formulating a holon to study the interrelationships among com-
munity values, community goals, planned actions, and perceived problems arises
from three predicaments. The rst is that values, goals, and problems are socially
constructed based on the perspectives of the stakeholders, and these are sometimes
divergent or conicting (Ison et al., 1997). No one such perspective is sufcient or
complete, and none can be said to be right or wrong. Furthermore, problems and
concerns in the agroecosystem are often part of what has been referred to as a mess
© 2009 by Taylor & Francis Group, LLC
92 Integrated Assessment of Health and Sustainability of Agroecosystems
(Ackoff, 1980). A mess is a complex of interrelated problems in which there is no
common agreement about the nature of the problems or potential solutions.
The second predicament stems from the fact that many of the relationships
between elements in the model reect human intentions (Caws, 1988), many of
which are characterized by a high degree of uncertainty. The third predicament is
that information and knowledge needed to build the model depend on human expe-
rience. Methods for eliciting experience-based knowledge are characterized by a
high degree of subjectivity. The question of how to analyze and interpret community
values, goals, and objectives in an agroecosystem is therefore one of how to formu-
late a problem holon as a composite of all stakeholder perspectives on the problem
situation. Such a problem holon must be a problem-determined system (rather than
a system-determined problem) that is a sociocultural construct based on the com-
munity’s perception of biophysical phenomena (Ison et al., 1997).
One way in which a problem-determined holon of an agroecosystem can be
derived is by generating a cognitive map of the community’s assertions with regard
to their collective values, goals, and problems. A cognitive map is a representation of
people’s assertions about a specied domain. It is derived by depicting how people
think an action will achieve their objectives (based on how they understand the world
to work) in a graphical form in which concepts are connected to each other by lines
and arrows (Ridgley and Lumpkin, 2000). The concepts are represented as words or
phrases referring to actions, contexts, quality, or quantities of things in the physical
world. The connections reect relationships thought to exist between the connected
concepts. Such relationships can be cause and effect, precedence, or even afnity.
Depending on their characteristics, the resulting depictions are variously referred to
as cognitive maps, inuence diagrams, or directed graphs (digraphs) (Ridgley and
Lumpkin, 2000).
The usefulness of cognitive maps depends on two questions (Axelrod, 1976a):
(1) Do processes in the modeled domain occur in accordance with the laws of cogni-
tive maps? (2) If they do, is it possible to measure accurately assertions and beliefs of
a community in such a way that a model can be applied? Several techniques for elicit-
ing people’s assertions have been applied (Axelrod, 1976b), including questionnaire
surveys and open-ended interviews. To elicit assertions on factors inuencing agro-
ecosystem health and sustainability from communities, the methods should satisfy
three requirements. First, the derivation should not require a priori specication of the
concepts a particular community may use in its cognitive map. Second, the options,
goals, ultimate utility, and relevant intervening concepts should all be included in
the cognitive map for it to be useful in evaluating different management options
(Axelrod, 1976b). Last, the map should be an accurate representation of the collective
assertions (and relationships among them) of the community. Such a cognitive map
is better perceived as a signed directed graph, simply known as a digraph (Axelrod,
1976a), with points representing each of the named concepts and arrows representing
the relationships between concepts. The arrows are drawn from the “cause” variable
to the “effect” variable, with either a positive sign to indicate a direct (or positive)
relationship or a minus sign to indicate an inverse (or negative) relationship.
Visual inspection is not a reliable way of analyzing digraphs. A mathematical
framework is essential to identify the underlying properties of the digraphs and to
© 2009 by Taylor & Francis Group, LLC
Use of Systems Theory, Directed Graphs, and Pulse Process Models 93
enable comparisons between graphs (Sorensen, 1978). There are several mathematical
approaches for analyzing signed digraphs based mostly on graph theory, matrix alge-
bra, and discrete and dynamic system models (Harary et al., 1965). The approaches
fall into two broad categories: arithmetic and geometric (Roberts, 1976b).
The aim of geometric analysis is usually to analyze the structure, shape, and pat-
terns that may impart important characteristics to the system. A typical geometric
conclusion is that some variable will grow exponentially or that some other variable
will oscillate in value. The numerical levels reached are not considered important in
such predictions (Roberts, 1976b). Geometric analysis of a signed digraph includes
(1) tracing out the different causal paths (Axelrod, 1976a), (2) identication of feed-
back loops (Roberts, 1976b), (3) detection of path imbalance (Nozicka et al., 1976),
(4) assessment of stability (Roberts, 1976a), (5) calculation of the strong components,
(6) assessment of connectedness (Roberts, 1976b), and (7) assessment of the effects
of different strategies (a change in the structure of the system) on system character-
istics (Roberts, 1976a).
Arithmetic analyses proceed from the perception of the signed digraph as a
dynamic system in which an element obtains a given value with each unit change
in time (or space) of another. The values obtained depend on previous changes in
other variables. The simplest assumption about how changes of value are propagated
through the system is the so-called pulse process (Roberts, 1971). By assuming that
change in values in the model follows a specied change-of-value process (such as
the pulse process), (1) stability can be assessed even for path-imbalanced digraphs,
(2) the effect of outside events on the system can be studied, and (3) forecasts can
be made. Roberts (1976a) cautioned that results from arithmetic analyses should be
regarded as suggestive and veried by further analysis since digraphs—as models of
a complex system—are not precisely correct due to oversimplications made in the
modeling process.
This chapter describes the formulation of a problem-determined holon for an
agroecosystem and its analysis using graph theory and dynamic modeling tech-
niques. The overall objective was to gain an insight into the communities’ denition
of health and to identify the factors they considered to be the most inuential in
terms of the health and sustainability of their agroecosystems. This analytic frame-
work served as a basis for selecting indicators and in interpreting them. Specically,
the objectives were (1) to assess how communities in the agroecosystem perceived the
interrelationships between problems, goals, values, and other factors; (2) to evaluate
what the communities perceived to be the overall benets of various agroecosystem
management strategies; (3) to determine what would be the most relevant measures
of change in the problem situation; and (4) to nd what would be the long-term
effects of various strategies and management policies, assuming that the communi-
ties’ assertions were reasonably accurate depictions of the problem situation.
4.2 PROCESS AND METHODS
Cognitive maps (also known as loop models, inuence or spaghetti diagrams) were
dened as models that portrayed ideas, beliefs, and attitudes and their relationship to
one another in a form amenable to study and analysis (Eden et al., 1983; Puccia and
© 2009 by Taylor & Francis Group, LLC
94 Integrated Assessment of Health and Sustainability of Agroecosystems
Levins, 1985; Ridgley and Lumpkin, 2000). Cognitive maps were developed, one for
each intensive study site (ISS), in 1-day participatory workshops, using principles
of participatory mapping described in Chapter 3. The maps were analyzed using
graph theory as described by Harary et al. (1965), Jeffries (1974), Roberts and Brown
(1975), Roberts (1976a, 1976b), Perry (1983), Puccia and Levins (1985), Klee (1989),
Ridgley and Lumpkin (2000), and Bang-Jensen and Gutin (2001).
4.2.1 pA r t i C i pAt o r y Co g n i t i v e mA p p i n g
Cognitive maps, in the form of signed directed graphs (digraphs), were constructed
for each ISS. These mapping activities were carried out in October and November
1997, subsequent to the initial village workshops. Details of the selection of study
sites are provided in Chapter 2. A 1-day workshop was held in each study site. Each
household in the study site was represented by at least one person. Although work-
shop participants from the ISS communities were not necessarily experts in any
relevant technical discipline, they were considered “lay” experts (Roberts, 1976a)
due to their unique experiential knowledge of the agroecosystem. Local participants
were taken to be “synthetic experts” (Dalkey, 1969).
To facilitate group discussions and to provide opportunities for each local partic-
ipant to give an opinion, the local participants were divided into groups of 6–10. The
number (ranging from 4 to 10) of groups depended on the number of participants and
therefore the size of the village. A facilitator and a recorder were provided for each
of the groups. Facilitators consisted of researchers and divisional team members as
described in Chapter 2. Each group was asked to discuss how various problems and
concerns in the study site interacted with each other, thus precipitating changes in
the health and sustainability of the agroecosystem. A whiteboard, index cards, and
large sheets of paper were used to plot the graphs. Each group was shown, using an
abstract example, of how they could represent their views in the form of a digraph
using the materials provided. Participants were asked to record the concepts on index
cards (making it easier to move concepts in a diagram) or directly on a whiteboard.
The concepts were then to be linked using the rules described for cognitive maps
and signed digraphs. Each group presented its diagram to the rest of the workshop
participants. Diagrams were compared and contrasted and a composite diagram
developed. This composite diagram included only those concepts and relationships
in which there was consensus about their existence. The rationale for this was that
collective action was likely to follow only if consensus existed. Further, consensus
was assumed to indicate a collective agreement that the concepts and relationships
operated in the manner depicted.
Participants described relationships among concepts in terms of the direction
of inuence (for example, A inuences B), the sign (positive if positively correlated
and negative if negatively correlated), as well as the perceived impact on the system
(positive if benecial and negative if detrimental). In the cognitive map, correlations
were denoted by the line form (solid if positive and dashed if negative). The impact
was denoted by the color; red arrows denoted negative impact, while blue lines
denoted positive impact. A solid red arrow, for example, represented a positive cor-
relation with a negative impact on the agroecosystem. Conversely, a dashed blue line
represented a negative correlation with a positive impact.
© 2009 by Taylor & Francis Group, LLC
Use of Systems Theory, Directed Graphs, and Pulse Process Models 95
At all the study sites, participants began by listing categories of concepts needed
to explain the relationships between, on the one hand, agroecosystem problems and
concerns and, on the other, its health and sustainability. A metaphor in the local
language was used to equate categories of related concepts to pots and the thought
process as cooking. Categories, and eventually the concepts themselves, were gen-
erated using declarative statements of the form, “You cannot cook (think about) x
without (including the concept of) y.” Concepts belonging to the same “pot”—those
seen to be related in some ways—were circled if on a chalkboard or put in one pile
if on cards. Relationships between pots were then added to the diagram, followed by
relationships within.
4.2.2 ge o m e t r i C An A l y s e s
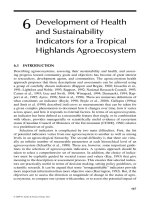
A signed digraph D = (V, A) was dened as consisting of a set (V) of points (v
1
, v
2
,
…, v
n
) called vertices and another set (A) of dimensions n × n called the adjacency
matrix (Figure 4.1). The adjacency matrix of a digraph D = (V, A) consists of ele-
ments a
ij
, where a
ij
= 1 if the arc (v
i
, v
j
) exists and 0 if the arc (v
i
, v
j
) does not exist,
with i and j = {1, 2, 3, …, n}. The in-degree of a vertex (v
i
) is the sum of the column
(i) in the adjacency matrix corresponding to that vertex. Conversely, the out-degree
of a vertex (v
i
) is the sum of the row (i) in the adjacency matrix corresponding to that
vertex. The sum of the in-degree and the out-degree of a vertex is the total degree
(td) and is a measure of the cognitive centrality of the vertex (Nozicka et al., 1976).
A vertex with an in-degree of 0 was described as a source, while one with an out-
degree of 0 was described as a sink.
A path was dened as a sequence of distinct vertices (v
1
, v
2
, …, v
t
) connected by
arcs such that for all i = {1, 2, , t} there is an arc (v
i
, v
i+1
). The sign (or effect) of a
path was the product of the signs of its arcs, and the length of a path was the number
of arcs in it. The impact of a path from vertex v
i
to another vertex v
j
was calculated
as the effect of the path multiplied by the sign of vertex v
j
. The sign of a vertex was
4
3110
00000
11000
21100
21010
v4
v3
v2
v1
v1 v2 v3 v4
ID
OD
V
1
V
2
V
4
V
3
A
D
Sgn(A)
–1
0001
–1000
1100
000
FIGURE 4.1 Example of a digraph and its adjacency (A) and signed adjacency (sgn(A))
matrices. See CD for color image.
© 2009 by Taylor & Francis Group, LLC
96 Integrated Assessment of Health and Sustainability of Agroecosystems
positive if all positive-effect arcs leading to it had a positive impact and negative if
otherwise. The sign of a source vertex was the sum of the impacts of all arcs leading
from it. In contrast to a path, a cycle was dened as a sequence of vertices (v
1
, v
2
,
…, v
t
) such that for all i = {1, 2, …, t} there is an arc (v
i
, v
(i+1)
), and where v
1
= v
t
,
while all other vertices are distinct. The sign, length, and impact of a cycle were as
dened for paths. The diagonal elements (a
ii
) of the matrix A
t
gave the number of
cycles and closed walks from a given vertex (v
i
). The off-diagonal elements gave the
number of walks and paths from one vertex (v
i
) to another (v
j
). A walk was similar to
a path with the exception that the vertices forming the sequence were not distinct.
The total effect (TE) of a vertex (v
i
) on another vertex (v
j
) is the sum of the effects
of all the paths from v
i
to v
j
. If all such effects are positive, then the total effect is
positive (+); if all are negative, the total effect is negative (−); if two or more paths
of the same length have opposite effects, the sum is indeterminate (#), and if all the
paths with opposite effects are of different lengths, the sum is ambivalent (±). A
digraph with at least one indeterminate or ambivalent total effect is said to be path
imbalanced. One that has no indeterminate or ambivalent total effect is path bal-
anced. The signed adjacency matrix (also called the incidence matrix, direct effects
matrix, or valency matrix) is used to compute the total effect. The impact of vertex v
i
on another vertex v
j
is calculated as the total effect of v
i
on v
j
multiplied by the sign
of vertex v
j
.
The reachability matrix R is a square n × n matrix with elements r
ij
that are 1 if
v
j
is reachable from v
i
and 0 if otherwise. By denition, each element is reachable
from itself, such that r
ii
= 1 for all i. The reachability matrix can be computed from
the adjacency matrix using the formula R = B[(I + A)
n−1
]. B is a Boolean function
where B(x) = 0 if x = 0, and B(x) = 1 if x > 0. I is the identity matrix. The digraph
D = (V, A) is said to be strongly connected (i.e., for every pair of vertices v
i
and v
j
, v
i
is reachable from v
j
and v
j
is reachable from v
i
) if and only if R = J, the matrix of all
1’s. D is unilaterally connected (i.e., for every pair of vertices v
i
and v
j
, v
i
is reachable
from v
j
or v
j
is reachable from v
i
) if and only if B[R + R′] = J. The strong component
(i.e., a subdigraph of D where all the vertices are maximally connected) to which a
vertex (v
i
) is a member is given by the entries of 1 in the ith row (or column) of the
elementwise product of R and R′. The number of elements in each strong component
is given by the main diagonal elements of R
2
.
4.2.3 pu l s e pr o C e s s mo D e l s
A weighted digraph is one in which each arc (v
i
, v
j
) is associated with a weight (a
ij
).
The signed adjacency matrix (in this case referred to as a weighted adjacency matrix)
of a weighted digraph therefore consists of the signed weights (a
ij
) of all the arcs
(v
i
, v
j
) in the digraphs and is 0 if the arc does not exist. Under the pulse process, an
arc (v
i
, v
j
) was interpreted as implying that when the value of v
i
is increased by one
unit at a discrete step t in time or space, v
j
would increase (or decrease depending
on the sign of a
ii
) by a
ij
units at step t + 1. Initially, the arcs in each digraph were
considered to be equal in weight and length. The models therefore assumed that a
pulse in vertex v
i
at time t was related in a linear fashion to the pulse in v
j
at time
© 2009 by Taylor & Francis Group, LLC
Use of Systems Theory, Directed Graphs, and Pulse Process Models 97
t + 1 if there was an arc (v
i
, v
j
) in the digraph. The value (v
it
) of vertex v
i
at time t was
calculated as:
vv PvvP
it it it
o
ji jt
j
n
=++
−− −
=
∑
() () ()
sgn( ,)
11 1
1
P
it()−1
0
is a vector of external pulses or change in vertices v
1
, v
2
, …, v
n
at step (t − 1);
sgn(v
i
, v
j
) is the sign of arc (v
i
, v
j
); P
j(t−1)
is referred to as a pulse and is the jth element
of the pulse vector P at the (t − 1)th row. P
jt
is given by the difference v
jt
− v
j(t−1)
for
t > 0 and 0 otherwise.
A pulse process of a signed digraph D was dened by a vector of the starting
values at each vertex given by V
s
= {v
1s
, v
2s
, …, v
ns
} and a vector of the initial pulses
at each of the vertices given by
P
0
0
= P
0
= {P
10
, P
20
, …, P
n0
}. Thus, the value at vertex
v
i
at step t = 0 was calculated as u
i0
= u
is
+ p
i0
.
A pulse process is autonomous if
pt
i
0
()
= 0 for all t > 0, that is, no other external
pulses are applied after the initial pulse P
0
at step t = 0. In an autonomous pulse pro-
cess in a digraph, D = (V, A), P
t
= (P
0
* A
t
). Further, a pulse process starting at vertex
v
i
is described as simple if P
0
has the ith
entry equal to 1 and all other entries equal
to 0; that is, the system receives the initial pulse from a single vertex. Under a simple
autonomous pulse process, a unit pulse is propagated through the system starting at
the initial vertex v
i
. Under this process, the value of vertex v
i
at time t is given by
vv vvP
it it ji jt
j
n
=+
−−
=
∑
() ()
sgn( ,)
11
1
From this, it can be shown that in a simple autonomous pulse process starting at
vertex v
i
, the value at vertex v
j
at step t is given by u
j
(t) = u
j
(0) + e
ij
, where e
ij
is the
i,jth element of a matrix T = (A + A
2
+ … + A
t
), where A is the weighted adjacency
matrix.
The effect of a vertex v
i
on another v
j
was positive if all pulses at v
j
resulting
from a simple autonomous pulse at v
i
were always positive, ambivalent if they were
oscillating, and positive if they were always negative. The impact was calculated as
described in the geometric analysis.
Based on the work of Klee (1989), a digraph was described as stable, value (or
quasi-) stable, semistable, or unstable under a given pulse process. A digraph was
stable under a pulse process if the values at each vertex converged to the origin as
t → ∞. It was described as value stable if the values at each vertex were bounded,
that is, there were numbers B
j
so that •v
jt
• < B
j
for all j and 0 ≤ t ≤ ∞. A digraph was
semistable if the values at each vertex changed at a polynomial rather than an expo-
nential rate. It was unstable if the converse was true. A digraph was described as
pulse stable under a pulse process if the pulses at each vertex were bounded for 0 ≤
t ≤ ∞, that is, •
p
jt
• < B
j
for all t. Stability properties of a digraph are related to the
eigenvalues of the weighted adjacency matrix. A digraph was stable under all pulse
processes if and only if each eigenvalue had a negative real part (Klee, 1989). If all
nonzero eigenvalues of A were distinct and at most 1 in magnitude, then the digraph
© 2009 by Taylor & Francis Group, LLC
98 Integrated Assessment of Health and Sustainability of Agroecosystems
was pulse stable under all simple pulse processes (Roberts and Brown, 1975). A
digraph was value stable under all simple pulse processes if it was pulse stable and
1 was not an eigenvalue of D (Roberts and Brown, 1975). A digraph was semistable
under all pulse processes if and only if each eigenvalue had a nonpositive real part
(Klee, 1989).
4.2.4 Ap p l i C A t i o n o f sy s t e m th e o r y to o l s i n vi l l A g e s
Sources in a digraph were seen as representing those factors requiring external inter-
vention. Perceived impacts and expected outputs of community goals were assessed
in two ways. The rst was through geometric analysis of the cognitive maps, which
involved examination of the total impacts of vertices corresponding to each of the
goals. The total number of positive impacts was used to rank community goals, and
this was compared to the ranking done by communities during the participatory
workshops. Presence of indeterminate effects was considered a result of path imbal-
ance. Path imbalances were seen as those relationships in which the outcome could
be either negative or positive depending on the weight and time lags placed on the
arcs of the various paths linking the vertices. These were considered important as
they represented aspects for which trade-offs and balances were critical to the over-
all outcome of community goals. Presence of ambivalent impacts was seen as an
indication of the system’s increased amplitude instability.
The second method of assessing the impact of community goals was simple
autonomous pulse processes initiated at each of the vertices corresponding to a
community goal. The impact was assessed based on (n − 1) iterations, equivalent
to the longest path in the digraph. The usefulness of this approach was in assessing
the importance of path imbalance in the outcome of community goals. Digraphs in
which community goals had only positive impacts were said to be in regenerative
spirals. Those in which there was a preponderance of negative impacts were said to
be in degenerative spirals.
Two kinds of value-stabilizing strategies were assessed. First was where the
signs of arcs in the digraph were changed either individually or as a group. Stabiliz-
ing strategies involving the fewest changes were considered the simplest. The other
type of stabilizing strategies was where the weights associated with the arcs were
altered—with the simplest strategies—those that involved the fewest changes. The
importance of assessing value stability was to evaluate the key relationships on which
the impacts of community goals were predicated. Existence of many simple stabiliz-
ing strategies was considered an indication of increased system inertia. Absence of
stabilizing strategies was considered an indication not only of cognitive imbalance
but also as possible trajectory stability.
4.3 RESULTS
Three groups of concepts were common to cognitive maps of the six communi-
ties. These were problems, outputs, and institutions. For ease of analysis, the com-
mon categories were retained, while the rest of the concepts were placed into one
general category: system-state (Figure 4.2). The number of concepts depicted in the
© 2009 by Taylor & Francis Group, LLC
Use of Systems Theory, Directed Graphs, and Pulse Process Models 99
cognitive maps from the different communities was similar. Mahindi had the most
(38), while Thiririka and Gitangu had the least (31) (Table 4.1). The cognitive map
by the Kiawamagira community had the most (66) arcs, followed by that by Githima
(Table 4.1). The cognitive map drawn by the Thiririka community had the lowest
average number of relationships per concept (1.5), followed by Mahindi (1.6), and
then Gikabu (1.7). Githima and Gitangu had the highest (1.9) number of relationships
per concept.
In all villages, relationships with negative impacts were the most preponder-
ant, comprising between 60% and 70% of all the arcs in the digraphs. Mahindi and
Thiririka villages had the highest proportion of negative-impact relationships (71.2%
and 70.8%, respectively). Mahindi and Gitangu each showed only one institution in
their inuence diagrams despite having mentioned several of them in the institu-
tional analysis.
4.3.1 gi t h i m A
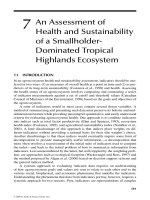
The cognitive map depicting the perceptions of the residents of Githima village is
shown in Figure 4.2. Vertex 3, with a total degree of 12, has cognitive centrality.
Other vertices with high total degree are 13, 9, and 23 with total degrees of 11, 6, and
6, respectively. Vertex 20 is the only sink (out-degree = 0), while vertices 7, 15, 26,
32, and 33 are sources (in-degree = 0).
FIGURE 4.2 A cognitive map depicting perception factors inuencing agroecosystem
health and sustainability in Githima intensive survey site, Kiambu District, Kenya, 1997.
AI, articial insemination. (KTDA = Kenya Tea Development Authority) See CD for color
image.
1. Lack of AI services
7. Poor roads
16. Fuel shortage
4. Te a production
2. Dairy production
8. Coffee production
17. Deforestation
18. Less land
per capita
5. KTDA centers
11. Coffee factories
15. Electricity committee
14. Less rainfall
6. Agrochemical use
Githima
9. Poor human health
32. Poor healthcare system
31. Illiteracy
28. Ignorance
10. Komothai co-op
30. School committee
24. Schools
29. Komothai water project
26. Hilly terrain
33. Changing lifestyle
27. Poor farming
techniques
25. Poor hygiene
13. Income
21. Labor export
3. Farm productivity
12. Soil erosion
and infertility
23. Water not accessible
19. Intergenerational
inequity
22. High population
20. Insecurity
34. High birth rate
© 2009 by Taylor & Francis Group, LLC
100 Integrated Assessment of Health and Sustainability of Agroecosystems
The impacts of Githima community’s goals, based on a geometric analysis of
their cognitive map of factors inuencing agroecosystem health and sustainability, are
shown in Table 4.2. Roads, knowledge, and illiteracy had indeterminate impacts on
most vertices. These result from two imbalanced paths from vertex 6 (agrochemical
use) to vertex 13 (income). All goals had negative impacts on agrochemical use. This
is because it is a negative vertex but with positive impact on farm productivity.
All goals except roads had a negative impact on vertex 30 (school committee),
caused by the positive-impact negative-feedback loop linking it to the negative vertex
28 (ignorance). All goals except articial insemination (AI) and security had indeter-
minate impacts on vertex 12 (soil erosion and infertility). The indeterminate impacts
of roads, knowledge, and literacy on the soil vertex were due to the path imbalance
between vertices 6 and 13. The indeterminate impacts of health and health care on
the soil vertex resulted from path imbalance between vertices 13 and 12 (the positive
path passes through vertex 16, while the negative one passes through vertex 27).
When arc [6, 9] is negative or absent, the overall positive impacts of commu-
nity goals increase to 154 with only 16 negative impacts. This results mostly from
an increase in the positive impacts of roads and literacy. Removing the arc [8, 6]
increases the overall impact of community goals to 134 while reducing negative
impacts to 8. Setting arc [13, 24] to either negative or zero reduces positive impacts
of community goals to 45 and 73, respectively, while increasing the negative impacts
to 60 and 16, respectively. Similarly, inverting or removing the arc [24, 31] results in
reduced positive impacts (50 and 78, respectively). Inverting the arc increases nega-
tive impacts to 55, but removing the arc reduces negative impacts to 10.
The digraph consists of 25 feedback loops, only 4 of which are negative feed-
back. The longest of all the feedback loops are of length nine. There are two strong
components. The rst has two vertices (tea production and tea centers) in a positive-
feedback loop. The other strong component includes all the other vertices except AI
services, dairy production, roads, electricity committee, security, population, ter-
rain, health care, lifestyle, and birth rate.
TABLE 4.1
A Comparison of the Number of Concepts and Relationships in Cognitive Maps
Drawn by Six Communities in Kiambu District, Kenya, Depicting Community
Perceptions of Factors Influencing Agroecosystem Health and Sustainability
Village
Number of Concepts Number of Arcs
Total Problems Outputs States Institutions Total
% with
Negative Effect
Githima 34 8 4 15 7 63 63.5
Gitangu 31 11 4 15 1 59 64.4
Kiawamagira 37 10 4 16 7 66 69.7
Mahindi 38 6 3 28 1 59 71.2
Gikabu 33 10 3 13 7 57 66.7
Thiririka 31 10 3 15 3 48 70.8
© 2009 by Taylor & Francis Group, LLC
Use of Systems Theory, Directed Graphs, and Pulse Process Models 101
TABLE 4.2
Impact of Githima Community’s Goals Based on Geometric Analysis
Vertex
Community Goals
Artificial
Insemination
Roads
Health
Fuel
Security
Water
Knowledge
Literacy
Health Care
1 (AI) + + . . . . . . .
2 (Dairy) + + . . . . . . .
3 (Productivity) + ± + + . + # # +
4 (Tea) . + . . . . . . .
5 (Tea centers) . + . . . . . . .
6 (Chemicals) − − − − . − − − −
7 (Roads) . + . . . . . . .
8 (Coffee) + # + + . + + + +
9 (Health) ± # + # . ± # # +
10 (Co-op) + # + + . + + + +
11 (Factories) + # + + . + + + +
12 (Soil) ± # # # . # # # #
13 (Income) + # + + . + # # +
14 (Rainfall) + # + + . + # # +
15 (Electricity) . . . . . . . . .
16 (Fuel) + # + + . + # # +
17 (Forest) + # + + . + # # +
18 (Land size) + # + + . + # + +
19 (Inequity) + # + + . + # + +
20 (Security) + # + + + + # # +
21 (Labor) + # + + . + # + +
22 (Population) . . . . . . . . .
23 (Water) + # + + . + # # +
24 (Schools) + # + + . + # # +
25 (Hygiene) + # + + . + # # +
26 (Terrain) . . . . . . . . .
27 (Techniques) + # + + . + + + +
28 (Ignorance) + # + + . + + + +
29 (Water project) + # + + . + + + +
30 (School committee) − # − − . − − − −
31 (Illiteracy) + # + + . + # + +
(continued on next page)
© 2009 by Taylor & Francis Group, LLC
102 Integrated Assessment of Health and Sustainability of Agroecosystems
The digraph is unstable under all simple autonomous pulse processes if all arcs are
assumed to have equal weights and time lags, the highest eigenvalue being 2.26. Sim-
ple positive autonomous pulses representing community goals (except security, which
is a sink) lead to negative impacts at vertices 6 (agrochemical use), 12 (soil erosion
and infertility), and 30 (school committee) (Table 4.3). In addition to these, improved
access roads produces ambivalent impacts at vertex 9, while increased knowledge
produces ambivalent impacts at most of the other vertices (Figure 4.3). Ambivalent
impacts also occur at vertices 18, 19, and 21, resulting from increased literacy.
The arcs with a change in weight that results in changes in the number of posi-
tive impacts of community goals are shown in Appendix 2. Of the 193 impacts of
community goals, 165 are sensitive to changes in the weights of at least one arc in
the digraph (Table 4.3). The only indirect and nonambivalent impacts that are not
sensitive to weight changes are those of roads and AI on vertices 2, 4, and 5. Impacts
of community goals were most sensitive to increases in the weight of arcs [3, 12] and
[12, 3]. Increases in the weight of any one of these arcs increase the number of oscil-
lating impacts of community goals. A weight of 10 resulted in oscillations of all but
nine of the impacts of community goals. Of all the arcs, [31, 21] produced the most
changes in the impact of community goals when the weight of each was reduced to
values below 1 and above 0.
TABLE 4.2 (continued)
Impact of Githima Community’s Goals Based on Geometric Analysis
Vertex
Community Goals
Artificial
Insemination
Roads
Health
Fuel
Security
Water
Knowledge
Literacy
Health Care
32 (Health care) . . . . . . . . +
33 (Lifestyle) . . . . . . . . .
34 (Birth rate) . . . . . . . . .
Totals
+ 122 21 5 20 19 1 19 6 10 21
− 15 2 1 2 2 0 2 2 2 2
Problem ranking
a
6 4 2 5 7 1 8 3 2
Goal status
b
0 2 0 0 3 3 0 1 0
+ Positive impact; − negative impact; ± ambivalent; . no impact; # indeterminate
a
Ranking by communities during the initial village workshops
b
Goal status as ranked by communities in January 2000 (0, no change; 1, slight improvement; 2, mod-
erate improvement; 3, improved a lot)
© 2009 by Taylor & Francis Group, LLC
Use of Systems Theory, Directed Graphs, and Pulse Process Models 103
TABLE 4.3
Impact of Githima Community’s Goals Based on a Pulse Process Analysis
Vertex
Community Goals
Artificial
Insemination
Roads
Health
Fuel
Security
Water
Knowledge
Literacy
Health Care
1 (AI) +
a
+
a
. . . . . . .
2 (Dairy) +
a
+
a
. . . . . . .
3 (Productivity) + + + + . + + + +
4 (Tea) . +
a
. . . . . . .
5 (Tea centers) . +
a
. . . . . . .
6 (Chemicals) − − − − . − ±
a
− −
7 (Roads) . +
a
. . . . . . .
8 (Coffee) + + + + . + ±
a
+ +
9 (Health) + ±
a
+ + . + + + +
10 (Co-op) + + + + . + ±
a
+ +
11 (Factories) + + + + . + ±
a
+ +
12 (Soil) − − − − . − ±
a
± −
13 (Income) + + + + . + + + +
14 (Rainfall) + + + + . + + + +
15 (Electricity) . . . . . . . . .
16 (Fuel) + + + + . + + + +
17 (Forest) + + + + . + + + +
18 (Land size) + + + + . + ±
a
± +
19 (Inequity) + + + + . + ±
a
± +
20 (Security) + + + + +
a
+ + + +
21 (Labor) + + + + . + ±
a
± +
22 (Population) . . . . . . . . .
23 (Water) + + + + . + + + +
24 (Schools) + + + + . + ±
a
+ +
25 (Hygiene) + + + + . + + + +
26 (Terrain) . . . . . . . . .
27 (Techniques) + + + + . + ±
a
+ +
28 (Ignorance) + + + + . + ±
a
+ +
29 (Water project) + + + + . + ±
a
+ +
30 (School committee) − − − − . − ±
a
− −
(continued on next page)
© 2009 by Taylor & Francis Group, LLC
104 Integrated Assessment of Health and Sustainability of Agroecosystems
4.3.2 gi t A n g u
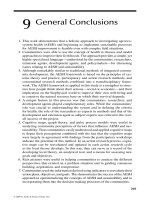
Figure 4.4 is a cognitive map depicting Gitangu community’s perception of factors
inuencing agroecosystem health and sustainability. Vertices 6 and 11 had cognitive
centrality, each with a total degree of 10, followed by vertices 4, 3, and 1, which had
total degrees of 9, 8, and 7, respectively. The digraph has no sinks, but six of the
vertices (5, 10, 17, 18, 20, and 21) are sources.
The impacts of community goals—based on a geometric analysis—are shown in
Table 4.4. All goals except health, security, and secondary schools had indeterminate
impacts on vertices 11, 14, 15, and 16. This results from the presence of three equal-
length (three arcs in each) paths from vertex 6 to vertex 11, with two positive in effect
and one negative. Ambivalent impacts occur at vertices 13, 16, and 27, indicating
the presence of counteracting paths. The total number of positive impacts of com-
munity goals increases to 147 if arc [12, 27] is inverted and to 137 if it is removed.
In both cases, the negative impacts reduce to zero. Positive impacts also increase if
arc [27, 11] is removed (136) or inverted (128), but the negative impacts remain 10.
Removing arc [6, 12] increases positive impacts (to 113), but negative impacts are
reduced to 1. The number of positive impacts of community goals reduces to 70 or
less if any one of arcs [13, 4], [2, 3], [3, 8], and [3, 7] are inverted.
The digraph is unstable under all simple autonomous pulse processes if all arcs
are taken as having unit weight and time lag. The largest eigenvalue is 2.29. The
impact of community goals under a simple autonomous pulse process is shown in
Table 4.5. All impacts are positive or ambivalent except at vertex 27, where eight of
the goals have negative impact. Most (165/193) of the impacts of community goals are
TABLE 4.3 (continued)
Impact of Githima Community’s Goals Based on a Pulse Process Analysis
Vertex
Community Goals
Artificial
Insemination
Roads
Health
Fuel
Security
Water
Knowledge
Literacy
Health Care
31 (Illiteracy) + + + + . + ±
a
+ +
32 (Health care) . . . . . . . . +
a
33 (Lifestyle) . . . . . . . . .
34 (Birth rate) . . . . . . . . .
Totals
+ 154 22 24 20 20 1 20 9 17 21
− 20 3 3 3 3 0 3 0 2 3
+ Positive impact; − negative impact; ± ambivalent; . no impact
a
Impacts that are not sensitive to weight changes
© 2009 by Taylor & Francis Group, LLC
Use of Systems Theory, Directed Graphs, and Pulse Process Models 105
sensitive to increase in the weight of at least one arc in the digraph (Table 4.5). Of the
28 impacts that are not sensitive to increases in the weight of arcs, only 8 are indirect
and nonambivalent. The ambivalent impacts of soil fertility on vertices 12, 27, and 31
stabilize as a result of increases in the weights of some of the arcs in the digraph.
The digraph consists of two main (with more than two vertices) strong compo-
nents. The rst strong component comprises vertices 3, 4, 7, 8, and 13 linked by two
positive- and one negative-feedback loops. The second consists of vertices 6, 11, 12,
14, 15, 16, 27, 28, and 31 joined into 15 feedback loops, 3 of which are negative. The
rst strong component is pulse stable. Inverting any one of arcs [3, 7], [4, 3], and
[7, 13] makes this strong component value stable under all simple autonomous pulse
processes. The second strong component is unstable. Among the simplest strategies
that produce value stability are (1) removal of arc [11, 16] accompanied by inversion of
arc [15, 11] and (2) removal of arc [14, 11] accompanied by inversion of arc [15, 11].
Iteration
Iteration
Agrochemical Use Coffee Production
121110987654321
121110987654321
12
11
10
9
8
7
6
5
4
3
2
1
0
–1
4
3
2
1
0
–1
>|< >|< >|< >|< >|< >|<
>|<>|<
>|<
>|<
>|<
>|<
>|<
>|<
>|<
>|<
>|<
>|<
>|<>|<>|<>|<>|<
>|<
FIGURE 4.3 Oscillating impacts of knowledge at vertices 6 (agrochemical use) and 7 (cof-
fee production) in a pulse process analysis of Githima digraph.
© 2009 by Taylor & Francis Group, LLC
106 Integrated Assessment of Health and Sustainability of Agroecosystems
TABLE 4.4
Impact of Gitangu Community’s Goals Based on Geometric Analysis
Vertices
Community Goals
Pests and
Diseases
Feed Quality
Roads
Employment
Soil
Productivity
Water
Availability
Human
Health
Crime Rate
Market
Extension
Secondary
Schools
1 (Diseases) + . . . . . . . + + .
2 (Poultry) + + . . . . . . + + .
3 (Dairy) + + + . + . . . + + .
4 (Food crops) + + + . + . . . + + .
5 (Feed quality) . + . . . . . . . . .
6 (Productivity) + + + # + + + + + + +
7 (Manure) + + + . + . . . + + .
FIGURE 4.4 A cognitive map depicting perception of factors inuencing agroecosystem
health and sustainability in Gitangu intensive survey site, Kiambu District, 1997. See CD for
color image and key.
5. Poor quality feeds
2. Poultry production
18. Climatic
change
19. Agrochemicals
-high cost
-not available
-not effective
Gitangu
1. Pests and diseases
17. Low seed
quality
29. Farmland inadequate
15. Poor human health
10. Poor roads
16. Increasing
crime rate
3. Dairy production
27. Labor export
30. Intergenerational
inequity
6. Farm productivity
4. Crop and fodder
production
20. Lack of market
and shopping center
8. Limuru Dairy
co-operative
9. Credit
availability
28. Inadequate
nutrition
26. Small-scale
enterprises
21. Inadequate
extension
Services
13. Soil erosion
and infertility
14. Water not
accessible
12. Unemployment
31. Drug abuse
11. Income
23. Hilly terrain
25. Lack of secondary
school and polytechnic
24. Lack of unity and
organization
22. Poor farming
techniques
7. Use of manure
© 2009 by Taylor & Francis Group, LLC
Use of Systems Theory, Directed Graphs, and Pulse Process Models 107
TABLE 4.4 (continued)
Impact of Gitangu Community’s Goals Based on Geometric Analysis
Vertices
Community Goals
Pests and
Diseases
Feed Quality
Roads
Employment
Soil
Productivity
Water
Availability
Human
Health
Crime Rate
Market
Extension
Secondary
Schools
8 (Co-op) + + + . + . . . + + .
9 (Credit) + + + . + . . . + + .
10 (Roads) . . + . . . . . . . .
11 (Income) # # # # # # + + # # +
12 (Employment) + + + + + + + + + + +
13 (Soil) ± + + . + . . . # ± .
14 (Water) # # # # # + + + # # +
15 (Health) # # # # # # + + # # +
16 (Security) # # # ± # # + + # # +
17 (Seed quality) . . . . . . . . . . .
18 (Climate) . . . . . . . . . . .
19 (Chemicals) . . . . . . . . + . .
20 (Market) . . . . . . . . + . .
21 (Extension) . . . . . . . . . + .
22 (Techniques) . . . . . . . . . + .
23 (Terrain) . . . . . . . . . . .
24 (Organization) . . . . . . . . . . .
25 (School) . . . . . . . . . . +
26 (Enterprises) . . . . . . . . . . +
27 (Labor) − − − − − − − − − − ±
28 (Nutrition) + + + # + + + + + + +
29 (Farmland) . . . . . . . . . . .
30 (Inequity) . . . . . . . . . . .
31 (Drug abuse) + + + + + + + + + + +
Totals
+ 103 11 12 11 2 10 5 8 8 13 13 10
− 10 1 1 1 1 1 1 1 1 1 1 0
Problem ranking 6 7 2 4 8 1 3 4 9 10 5
Goal status 0 1 0 0 1 1 0 3 0 3 0
+ Positive impact; − negative impact; ± ambivalent; . no impact; # indeterminate
© 2009 by Taylor & Francis Group, LLC
108 Integrated Assessment of Health and Sustainability of Agroecosystems
TABLE 4.5
Impact of Gitangu Community’s Goals Based on Pulse Process Analysis
Vertex
Community Goals
Pests and
Diseases
Feed Quality
Roads
Employment
Soil Fertility
Water
Availability
Human
Health
Security
Market
Extension
Secondary
Schools
1 (Diseases) +
a
. . . . . . . +
a
+
a
.
2 (Poultry) +
a
+
a
. . . . . . +
a
+
a
.
3 (Dairy) + + + . + . . . + + .
4 (Food crops) ±
a
+ + . ±
a
. . . ±
a
±
a
.
5 (Feed quality) . +
a
. . . . . . . . .
6 (Productivity) + + + + + + + + + + +
7 (Manure) + + + . + . . . + + .
8 (Co-op) + + + . + . . . + + .
9 (Credit) + + + . + . . . + + .
10 (Roads) . . +
a
. . . . . . . .
11 (Income) + + + + + + + + + + +
12 (Employment) + + + ±
a
± + + + + + +
13 (Soil) ±
a
+ + . ±
a
. . . ±
a
±
a
.
14 (Water) + + + + + + + + + + +
15 (Health) + + + + + + + + + + +
16 (Security) + + + ± + + + + + + +
17 (Seed quality) . . . . . . . . . . .
18 (Climate) . . . . . . . . . . .
19 (Chemicals) . . . . . . . . +
a
. .
20 (Market) . . . . . . . . +
a
. .
21 (Extension) . . . . . . . . . +
a
.
22 (Techniques) . . . . . . . . . +
a
.
23 (Terrain) . . . . . . . . . . .
24 (Organization) . . . . . . . . . . .
25 (School) . . . . . . . . . . +
a
26 (Enterprises) . . . . . . . . . . +
a
27 (Labor) − − − ±
a
± − − − − − ±
a
28 (Nutrition) + + + + + + + + + + +
29 (Farmland) . . . . . . . . . . .
30 (Inequity) . . . . . .
. . . . .
31 (Drug abuse) + + + ±
a
± + + + + + +
© 2009 by Taylor & Francis Group, LLC
Use of Systems Theory, Directed Graphs, and Pulse Process Models 109
4.3.3 ki AwA m A g i r A
Figure 4.5 is a cognitive map depicting relationships among factors inuencing
health and sustainability as perceived by residents of Kiawamagira village. Vertex 2
has cognitive centrality, with a total degree of 15, followed by vertices 1, 17, and 24,
each with a total degree of 7. None of the vertices is a sink, but nine of them (3, 8,
15, 16, 20, 33, 34, 35, 37) are sources. Vertex 35 was ambivalent, being a source and
having both positive (providing employment and manure) and negative (contributing
to the pollution of the stream) impacts.
The digraph is balanced with reference to community goals, producing no
indeterminate or ambivalent impacts (Table 4.6). The impacts of community goals
increase to 107 if the arc [31, 30] is inverted. This also reduces the negative impacts
to 0. Removing arcs [2, 29], [24, 2], and [28, 2] reduces the positive impacts of com-
munity goals to 79, 81, and 83, respectively, while reducing the negative impacts to
1, 8, and 8, respectively. Inverting the arcs [24, 2], [1, 2], [2, 5], and [12, 2] reduces
the positive impacts of community goals to 75, 79, 81, and 82, respectively, while
increasing the negative impacts to 23, 21, 19, and 16, respectively. It is unstable under
all simple pulse processes if all arcs are given unit weight and time lag. The largest
eigenvalue under this process is 2.58. Simple autonomous pulses, with equal weights
and time lags on each arc, result in impacts similar to those determined through
geometric analysis since the digraph is balanced. Because of this, no impacts are
sensitive to changes in the weight.
There are two main strong components. The rst consists of vertices 1, 2, 5, 25,
27, 28, 29, 30, and 31 interlinked into 7 two-arc and 2 three-arc positive-feedback
loops. The second component comprises vertices 6, 7, and 24. Among the simplest
stabilizing strategies for the rst strong component is inverting any 3 two-arc cycles
linked to vertex 2. The second strong component is pulse stable under all simple
autonomous pulse processes. This component becomes value stable if arc [6, 24] or
arc [24, 6] is removed.
TABLE 4.5 (continued)
Impact of Gitangu Community’s Goals Based on Pulse Process Analysis
Vertex
Community Goals
Pests and
Diseases
Feed Quality
Roads
Employment
Soil Fertility
Water
Availability
Human
Health
Security
Market
Extension
Secondary
Schools
Totals
+ 126 14 16 15 5 10 8 8 8 16 16 10
− 8 1 1 1 0 0 1 1 1 1 1 0
+ Positive impact; − negative impact; ± ambivalent; . no impact
a
Impacts that are not sensitive to weight changes
© 2009 by Taylor & Francis Group, LLC
110 Integrated Assessment of Health and Sustainability of Agroecosystems
4.3.4 mA h i n D i
The cognitive map depicting perceptions of the Mahindi community is shown in
Figure 4.6. With a total degree of 12, vertex 4 has cognitive centrality. Other ver-
tices with high total degrees are 33, 19, and 26, with total degrees of 7, 6, and 6,
respectively. There are 12 sources (1, 3, 13, 15, 16, 17, 22, 23, 27, 32, 35, and 36)
and 3 sinks (5, 30, and 37). Of the six key community goals, employment, water
availability, and nursery schools show no impact on other vertices in the digraph
(Table 4.7).
Water quality, health care, and roads have ambivalent impacts on vertices 7 and 8
owing to the perceived negative impacts of the arc [6, 7] and path imbalance between
vertices 4 and 8. Inverting or removing arc [6, 8] increases the positive impacts
of community goals to 40. Similar results are obtained with removal of arc [8, 7].
Removing arcs [9, 4], [18, 33], and [4, 18] reduces the positive impacts of community
goals to 21, 26, and 26, respectively. Inverting arcs [9, 4], [18, 33], [4, 18], and [32, 19]
reduces the positive impacts to 21, 22, 22, and 26, respectively, while increasing
negative impacts to 17, 16, 16, and 4.
Assuming unit weight and time lags on each arc, the digraph is unstable under all
simple autonomous pulse processes, with 1.25 the highest eigenvalue. The impacts
of community goals based on these processes are shown in Table 4.8. Employ-
ment, water availability, and nursery schools have no impacts other than on their
FIGURE 4.5 A cognitive map depicting perceptions of factors inuencing health and sus-
tainability in Kiawamagira intensive survey site, Kiambu Village, Kenya, 1997. See CD for
color image. AI, articial insemination.
11. Low crop
productivity
24. Low dairy
productivity
7. Inadequate AI
services
37. Inadequate and expensive
Health services
3. Distance
to schools
14. Predisposition
to swamping
36. Manure
6. Private vets
16. Railway
13. Run-off
20. High
population
23. Land
subdivision
19. No crop
rotation
10. Soil erosion and
land degradation
21. Selling land
to “outsiders”
18. Small land
sizes
8. No extension
services
9. Low fodder
production
15. Public works
(roads)
1. Human health
22. Non-participation
in village activities
17. Poor access road
5. Water shortage
29. Firewood
shortage
28. Inadequate
security
33. No telephones
35. Dagoretti market and
slaughter houses
26. Off-farm
employment
4. Pollution of
Kabuthi Stream
34. University
campus
27. Small-scale
enterprises
12. Kale production
2. Income
Kiawamagira
25. Rental
houses
30. Forest
control
31. Deforestation
32. Electricity
committee
© 2009 by Taylor & Francis Group, LLC
Use of Systems Theory, Directed Graphs, and Pulse Process Models 111
TABLE 4.6
Impact of Kiawamagira Community’s Goals Based on Geometric
Analysis
Vertex
Community Goals
Distance to
schools
Water
availability
AI services
Crop
productivity
Roads
Dairy
productivity
Security
Fuel
Telephones
Healthcare
1 (Health) + + + + + + + + + +
2 (Income) + + + + + + + + + +
3 (Schools) + . . . . . . . . .
4 (Streams) . . . . . . . . . .
5 (Water) + + + + + + + + + +
6 (Vets) . . + . + + . . . .
7 (AI) . . + . + + . . . .
8 (Extension) . . . . . . . . . .
9 (Fodder) . . . . . . . . . .
10 (Soil) . . . . . . . . . .
11 (Crops) . . . + . . . . . .
12 (Kale) . . . + + . . . . .
13 (Runoff) . . . . . . . . . .
14 (Swamping) . . . . . . . . . .
15 (Public works) . . . . . . . . . .
16 (Railway) . . . . . . . . . .
17 (Roads) . . . . + . . . . .
18 (Land) . . . . . . . . . .
19 (Crop rotation) . . . . . . . . . .
20 (Population) . . . . . . . . . .
21 (Land sale) . . . . . . . . . .
22 (Participation) . . . . . . . . . .
23 (Subdivisions) . . . . . . . . . .
(continued on next page)
© 2009 by Taylor & Francis Group, LLC
112 Integrated Assessment of Health and Sustainability of Agroecosystems
corresponding vertices. The impacts of the rest of the goals are predominantly
ambivalent, with roads having negative impacts on vertices 29 and 30 and positive
impacts on vertices 5, 19, 20, 31, and 32. Of the 48 impacts of community goals, 21
are not sensitive to increases in weights, but only 7 of them are nonambivalent and
TABLE 4.6 (continued)
Impact of Kiawamagira Community’s Goals Based on Geometric
Analysis
Vertex
Community Goals
Distance to
schools
Water
availability
AI services
Crop
productivity
Roads
Dairy
productivity
Security
Fuel
Telephones
Healthcare
24 (Dairy) . . + . + + . . . .
25 (Rentals) + + + + + + + + + +
26 (Off-farm) . . . . + . . . . .
27 (Enterprises) + + + + + + + + + +
28 (Security) + + + + + + + + + +
29 (Fuel) + + + + + + + + + +
30 (Forest) – – – – – – – – – –
31 (Deforestations) + + + + + + + + + +
32 (Electricity) . . . . . . . . . .
33 (Telephones) . . . . . . . . + .
34 (University) . . . . . . . . . .
35 (Abattoirs) . . . . . . . . . .
36 (Manure) . . . . . . . . . .
37 (Healthcare) . . . . . . . . . +
Totals
+ 97 9 8 11 10 14 11 8 8 9 9
- 10 1 1 1 1 1 1 1 1 1 1
Problem ranking
?
a
2 6
3?
b
1 3?
b
5 4 8 7
Goal status 0 0 0 1 1 1 2 0 0 1
Key: + Positive impact; – Negative impact; ± Ambivalent; . No impact; # Indeterminate
a
Not ranked/identied in the initial workshop
b
Problem stated as low farm productivity during initial workshop
© 2009 by Taylor & Francis Group, LLC
Use of Systems Theory, Directed Graphs, and Pulse Process Models 113
indirect (Table 4.8). The impacts are most sensitive to increases in the weights of any
of the arcs in the two-arc cycles linking vertex 4 to vertices 11 and 9.
The digraph consists of two main strong components. The rst has 12 vertices
(4, 6, 7, 8, 9, 10, 11, 12, 18, 20, 33, and 34) in six negative- and eight positive-feedback
loops. The second has two (19 and 20) vertices in a positive-feedback loop. The rst
strong component is pulse stable. The simple value-stabilizing strategies for this
component include removing arc [18, 33] and then either arc [20, 33] or [34, 33]. The
second component is pulse stable as well and can be value stabilized by inverting
any one of the two arcs.
4.3.5 gi k A b u
The cognitive map produced by participants from Gikabu is shown in Figure 4.7.
Vertex 9 has cognitive centrality, with a total degree of 14, followed by vertices 26,
29, and 18, with total degrees of 7, 7, and 6, respectively. Nine of the vertices (1, 10,
16, 19, 20, 21, 22, 32, 33) are sources, but there are no sinks. Table 4.9 shows the
impacts of community goals in Gikabu village based on a geometric analysis of
the digraph. Tea markets had indeterminate effects on most other vertices due to the
presence of 2 three-arc paths from vertex 3 to 9. It had negative impacts on vertex 5
and 6. Inverting or removing arc [6, 7] increases the positive impacts of community
goals to 130, while removing arc [7, 9] increases the impacts to 129. Inverting any
one of arcs [15, 9], [9, 26], [26, 29], and [13, 14] reduces the positive impacts of
FIGURE 4.6 A cognitive map depicting perceptions of factors inuencing the health and
sustainability in Mahindi intensive survey site, Kiambu District, Kenya, 1997. See CD for
color image and key.
Mahindi
32. Poor access road
Unemployment
27. High birth
rate
28. Increasing
population
29. Migration
31. Labor
export
38. Flower
production
3. Expert advice
20. Private vets
19. Dairy
production
23. Livestock
diseases
22. Lack of
Knowledge
21. Poor
management
14. Water
shortage
17. Storage
tanks
16. Dry season
15. Distant and expensive
health services
12. Water not
potable
4. Income
11. Fuel
shortage
10. Use of coffee
husks
7. Malnutrition
8. Buying
food
18. Leasing
land
33. Low food-crop
production
34. Soil erosion
and infertility
26. Irrigating/cultivating
along river banks
37. Lack of nursery
school
36. Lack of public
land within
6. Inadequate
food
9. Human
diseases
25. Over-cultivation
2. Income generating
activities
1. Lack of
licenses
13. Lack of treating
chemicals
24. Small farm
sizes
30. Loss of contact
between relatives
35. Few employment
opportunities
© 2009 by Taylor & Francis Group, LLC
114 Integrated Assessment of Health and Sustainability of Agroecosystems
TABLE 4.7
Impact of Mahindi Community’s Goals Based on Geometric Analysis
Vertex
Community Goals
Employment
Water
Quality
Water
Availability
Health
Care Roads
Nursery
School
1 (Licenses) . . . . . .
2 (Activities) . . . . . .
3 (Experts) . . . . . .
4 (Income) . + . + + .
5 (Employment) + . . . + .
6 (Food) . + . + + .
7 (Nutrition) . ± . ± ± .
8 (Buying food) . ± . ± ± .
9 (Diseases) . + . + ± .
10 (Husks) . + . + + .
11 (Fuel) . + . + + .
12 (Water quality) . + . + + .
13 (Chemicals) . . . . . .
14 (Water) . . + . . .
15 (Health care) . . . + . .
16 (Season) . . . . . .
17 (Tanks) . . . . . .
18 (Leasing) . + . + + .
19 (Dairy) . . . . + .
20 (Vets) . . . . + .
21 (Management) . . . . . .
22 (Knowledge) . . . . . .
23 (Livestock diseases) . . . . . .
24 (Farm size) . . . . . .
25 (Cultivation) . . . . . .
26 (Riverbanks) . + . + + .
27 (Birth rate) . . . . . .
28 (Population) . . . . . .
29 (Migration) . . . . − .
30 (Contact) . . . . − .
31 (Labor) . . . . + .
32 (Roads) . . . . + .
33 (Crops) . + . + + .
34 (Soil) . + . + + .
35 (Jobs) . . . . . .
© 2009 by Taylor & Francis Group, LLC
Use of Systems Theory, Directed Graphs, and Pulse Process Models 115
TABLE 4.7 (continued)
Impact of Mahindi Community’s Goals Based on Geometric Analysis
Vertex
Community Goals
Employment
Water
Quality
Water
Availability
Health
Care Roads
Nursery
School
36 (Public land) . . . . . .
37 (School) . . . . . +
38 (Flowers) . . . . + .
Total
+ 36 1 9 1 10 14 1
− 2 0 0 0 0 2 0
Problem ranking 2 ? 3 4 1 5
Goal status 0 0 0 0 1 0
+ Positive impact; − negative impact; ± ambivalent; . no impact; # indeterminate
TABLE 4.8
Impact of Mahindi Community’s Goals Based on Pulse Analysis
Vertex
Community Goals
Employment
Water
Quality
Water
Availability
Health
Care Roads
Nursery
School
1 (Licenses) . . . . . .
2 (Activities) . . . . . .
3 (Experts) . . . . . .
4 (Income) . ± . ± ± .
5 (Employment) +
a
. . . +
a
.
6 (Food) . ± . ± ± .
7 (Nutrition) . ±
a
. ±
a
±
a
.
8 (Buying food) . ±
a
. ±
a
±
a
.
9 (Diseases) . ± . ± ± .
10 (Husks) . ± . ± ± .
11 (Fuel) . ± . ± ± .
12 (Water quality) . ± . ± ± .
13 (Chemicals) . . . . . .
14 (Water) . . +
a
. . .
15 (Health care) . . . +
a
. .
(continued on next page)
© 2009 by Taylor & Francis Group, LLC