BASIC HAZARDOUS WASTE MANAGEMENT - CHAPTER 8 ppt
Bạn đang xem bản rút gọn của tài liệu. Xem và tải ngay bản đầy đủ của tài liệu tại đây (2.17 MB, 26 trang )
Pollution Prevention,
Waste Minimization,
Reuse, and Recycling
OBJECTIVES
At completion of this chapter, the student should:
• Understand the basic operational approaches to waste minimization, i.e.,
product changes, source controls, use and reuse, and reclamation.
• Be familiar with the principles, process, and practice of waste reduction
assessment.
• Understand the imperatives of waste minimization, reduction, reuse, and
recycling.
• Be familiar with the RCRA regulatory mechanisms and program incen-
tives to achieve waste minimization, the national policy aspects, and the
local impediments.
• Be similarly familiar with the objectives of the Pollution Prevention Act
and the implementing mechanisms.
INTRODUCTION
We now take up the most important issue in the study of hazardous waste manage-
ment — the elimination or reduction in the quantity of waste generated. Throughout
the previous chapters, we have emphasized the fact that much of what has passed
for hazardous waste management ultimately came to little more than moving it
around, transferring it from one environmental medium to another, changing its
form, or hiding it.
Great strides have been made in the sophistication of regulatory programs,
treatment and destruction technology, and secure disposal. The thrust of industries
and government, until recently, has been toward ever-tightening pollution control
rather than pollution prevention. Politicians (and others) are fond of referring to this
traditional sanitary engineering approach as the “end-of-the-pipe mentality.”
The legislate-regulate-treat-dispose approach has three primary roots:
8
L1533_frame_C08 Page 197 Tuesday, May 1, 2001 12:40 PM
© 2001 by CRC Press LLC
1. As hazardous wastes became a more serious aspect of industrial manage-
ment, they were initially handled in a manner similar to the handling of
sewage and refuse. There is little that can be done to reduce the amount
of sewage generated, so we taught ourselves to treat it to make it less
threatening to our health and aesthetic sensibilities and to our environ-
ment. Refuse management was based upon similar thought processes, but
with somewhat less validity. Sanitary engineers did not advocate adding
hazardous wastes to our sewerage systems and had little to do with the
dumping of hazardous wastes into whatever refuse management systems
were in use. The sewers, atmosphere, and dumping grounds were there,
and our use of them was dictated by the politics and the economics of
the free enterprise system.
2. During and after the Vietnam War, former President Lyndon Johnson and
his Secretary of Defense Robert McNamara, were criticized for their
failure to mobilize the nation and vigorously prosecute the war. The policy
was referred to as “gradualism,” meaning that the resources (men and
materials) were added in small increments, to which the enemy was able
to accommodate. The parallel with the nation’s approach to hazardous
waste management is unmistakable. When hazardous wastes began to
require our attention, we did not mobilize to deal with them. We did not
examine the sources to determine their necessity; or whether there might
be alternative processes, raw materials, or end products; or even good
operating practices that might
reduce
quantities or strengths of wastes.
The feeble impact of the resurrected 1899 Rivers and Harbors Act and the
early efforts of environmentalists led us to put in equally feeble “treatment”
schemes to transfer pollutants between environmental “media” or to hide
our dumping more carefully. As regulatory pressures increased, we added
new treatment units, upgraded existing ones, and created the treatment,
storage, and disposal industry. With the advent of the Hazardous and Solid
Waste Amendments (HSWA), we pushed innovative treatment and destruc-
tion and tried to reduce our dependence upon disposal. Only recently have
we begun to seriously consider new approaches.
3. The third of these roots is, of course, economics. The economic pressures
upon U.S. industry have ranged over the ever-escalating labor-wage demands
of the 1960s and 1970s; the profit greed of the 1970s and 1980s; the overseas
competition of the late 1980s; and the siren calls of minimal or no environ-
mental controls and cheap labor in “developing” countries. Industry repre-
sentatives and lobbyists have been highly effective in softening
environmental legislation and regulatory issue. Fears of job losses, reces-
sions, stockholder demands, and debt have been the dominant themes. Indus-
trial decision makers tended to opt for the least expensive option of the
moment and in hazardous waste management that frequently translated into
the purchase of a
treatment
unit or a new contract with a
disposal
facility.
Until recently, there have been few, if any, economic incentives to examine major
changes in products, raw materials, materials handling, or process controls to elim-
L1533_frame_C08 Page 198 Tuesday, May 1, 2001 12:40 PM
© 2001 by CRC Press LLC
inate a waste stream or reduce it in volume or strength. The economic incentives of
poor corporate image, Superfund nomination, tort filings, and criminal penalties
have much to do with the newly found interest in waste minimization. Ever-dimin-
ishing availability of space for disposal services; public resistance to siting of any
kind of hazardous waste management facility; and increasingly stringent regulation
add further pressures to rethink our traditional approaches. More pointedly, the
Pollution Prevention Act of 1990 (PPA) intensifies requirements for reporting of
releases and analysis of progress in achieving waste minimization goals. The new
Act and the EPA’s implementation program have stopped just short of
mandated
reductions of releases. The agency refers to the waste minimization, source reduction,
and recycling/reuse program emphasis implemented immediately after enactment of
the PPA as “Phase I” of the pollution prevention programs.
“Phase II” of the PPA implementation has been embodied in a flurry of initiatives,
strategies, and policy statements that are designed to persuade, coerce, and/or require
industries and hazardous waste managers to “virtually eliminate,” reduce generation
of, or find environmentally safe substitutes for hazardous wastes.
1
These new thrusts
are discussed in a later section of this chapter. The new initiatives are well meant
and some are, or will be, effective. Nevertheless, many of the traditional and more
mundane waste minimization, reuse, and recycling measures and technologies
remain valid, useful, and necessary. Accordingly, we will attempt to provide the
reader/student/practitioner with a balanced overview of the proven waste minimiza-
tion, reuse, and recycling techniques and practices, along with the more recent
approaches that the EPA is emphasizing.
H
AZARDOUS
W
ASTE
M
INIMIZATION
T
ECHNIQUES
As noted earlier, the statutory authorities for waste minimization programs and for
pollution prevention strategies do not include mandatory controls or mechanisms to
regulate waste minimization programs. In lieu thereof, the EPA developed a large
number of good “how-to” publications that deal with program organization and
management, as well as technical approaches. The “Phase I” pollution prevention
programs were, and continue to be, focused upon extensive reporting requirements,
goal setting, and performance evaluation. The U.S. Congress’ Office of Technology
Assessment produced an informative critique of the program, entitled “Serious
Reduction of Hazardous Waste.” We now borrow from these publications, and others,
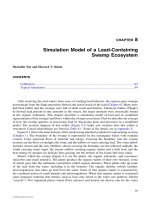
to provide some structure to the topic. Figure 8.1 diagrams an organized way to
think about the
waste minimization
techniques. We then follow with examples of
each of the diagrammed techniques.
Source Reduction
In the previous chapter, we offered Dr. George Combs’ version of the hierarchy of
preferable waste management options and priorities. Following enactment of the
HSWA in 1984, the EPA waste minimization program offered a similar hierarchy
1
Particularly for priority persistent, bioaccumulative, and toxic (PBT) pollutants, as will be seen later herein.
L1533_frame_C08 Page 199 Tuesday, May 1, 2001 12:40 PM
© 2001 by CRC Press LLC
FIGURE 8.1
Waste minimization techniques. (From the U.S. Environmental Protection Agency.)
L1533_frame_C08 Page 200 Tuesday, May 1, 2001 12:40 PM
© 2001 by CRC Press LLC
© 2001 by CRC Press LLC
that may be helpful in thinking about approaches to hazardous waste reduction, or
minimization:
1.
Waste Reduction
: Reduce the amount of waste at the source through
changes in industrial processes.
2.
Waste Separation and Concentration
: Isolate wastes from mixtures in
which they occur.
3.
Waste Exchange
: Transfer wastes through clearinghouses so that they can
be recycled in industrial processes.
4.
Energy/Material Recovery
: Reuse and recycle wastes for the original or
some other purpose, such as for materials recovery or energy production.
5.
Incineration/Treatment
: Destroy, detoxify, and neutralize wastes into less
harmful substances.
6.
Secure Land Disposal
: Deposit wastes on land using volume reduction,
encapsulation, leachate containment, monitoring, and controlled air and
surface/subsurface water releases.
This hierarchy was the rationale for EPA waste minimization, recycling, and reuse
policies and directives from enactment of HSWA in 1984 until the 1990 PPA was passed.
Product Changes
Product Substitution.
Changes in the design, composition, or specifications of end-
products that allow fundamental changes in the manufacturing process or in the use
of raw materials can directly lead to waste reduction. Such changes are also the
most difficult approach to waste reduction for several reasons, including
• Concerns on the part of the manufacturer regarding customer acceptance,
cost of the conversion, cost of the new product, and quality control
• Concerns on the part of the customer regarding acceptability of the prod-
uct, quality control, and changes in application made necessary by the
substitution, general uncertainty, and fear of the unknown
• Concerns on the part of both manufacturer and customer regarding regu-
latory and liability impacts
For example, Monsanto (St. Louis, MO) reformulated a specialized industrial adhe-
sive so that hazardous particulates remained in the product, thus eliminating the
need to use and dispose of filters and particulates as waste. The company then had
to convince its customers that the particulate matter formerly removed by the filters
could remain in the product without affecting its adhesive qualities. From the time
the idea of reformulating the product was originated, 2 years of effort by Monsanto’s
Research and Marketing Division was required before the reluctance of the purchaser
to accept a different product was overcome and the change could be made (Office
of Technology Assessment 1986, p. 83).
Product Conservation.
One of the most fruitful areas of waste minimization
through product conservation is the effective management of inventory having spe-
L1533_frame_C08 Page 201 Tuesday, May 1, 2001 12:40 PM
© 2001 by CRC Press LLC
cific shelf-lives. Holston Army Ammunition Plant reduced waste pesticide disposal
from 440 kg to 0 kg in 1 year by better management of stocks (Mills 1988).
Changes in Product Composition.
Dow Chemical Company changed the way
it packaged a product and achieved waste reduction in doing so. A wettable powder
insecticide, widely used in the landscape maintenance and horticulture business, was
originally sold in 2-lb metal cans that had to be decontaminated prior to disposal,
thereby creating a hazardous waste. Dow now packages the product in 4-oz water-
soluble packages which dissolve when the product is mixed with water for use
(Office of Technology Assessment 1986, p. 83).
Source Control
Input Material Changes
Material Substitution.
A classic issue of material substitution is the question of
disposable wipes or reusable towels in thousands of industrial facilities using mil-
lions of shop towels daily. The shop towels come in contact with a variety of
chemicals, some of which are hazardous materials; thus, disposal of the towels may
bring the user under RCRA regulation. The EPA has deferred making decisions on
the regulatory status of reusable textile wipes to the EPA regional offices and states.
Reusable towels are usually rented from industrial towel services (“… a contrac-
tual/closed loop cleaning service”). Most of the state agencies have either exempted
or limited the scope of RCRA regulation, where reusable shop towels are contam-
inated with listed or characteristically hazardous solvents. However, the states and
EPA regional offices granting exemptions require that specific reusable shop towel
management criteria be followed. The criteria vary from state to state, but most
require that (1) the laundry be in compliance with its wastewater discharge permit
and (2) the towels not contain any free liquids. These arrangements reduce the
customer RCRA liability and the substantially larger volume of hazardous waste
created by the use of disposable wipes (Smith, 1998, pp. 36ff).
Material Purification.
A U.S. Air Force facility annually generated about 6500
gal of waste 1,1,1-trichloroethane (TCA) from vapor degreasing operations. Chem-
ical laboratory personnel discovered that the TCA was being disposed of because it
did not meet an acid acceptance value of 0.10 wt% NaOH. Oil contamination levels
were less than 10% at the time of disposal, far less than the expected 30% level. To
restore acid acceptance levels, 1,2-butylene oxide was added to the solvent. No
adverse reactions or detectable problems were observed when the butylene oxide
was added to the vapor degreasers. This example of purification of input material
is expected to enable reduction of disposal volumes by 4000 gal (60%) and savings
of $30,000/year (EPA 1989, p. 19).
Technology Changes
Process Changes.
An example of a classic process change, resulting in reduced
waste generation, is staged use of solvent. An electronics firm switched from using
three different solvents — mineral spirits for degreasing machine parts; perchloro-
ethylene for computer housings; and a fluorocarbon-methanol blend for printed
circuit boards — to a single solvent system. Fresh solvent is used for the printed
L1533_frame_C08 Page 202 Tuesday, May 1, 2001 12:40 PM
© 2001 by CRC Press LLC
circuit boards, is then reused to degrease the computer housings, and last is reused
to degrease the machine parts. This practice not only reduced solvent consumption
and waste, it eliminated potential cross contamination of solvents; generated a single
waste stream that can be recycled; simplified safety and operating procedures; and
increased purchasing leverage (EPA 1989, p. 17).
Equipment, Piping, or Layout Changes.
Equipment changes can be equally
beneficial in waste reduction programs. In an electronic circuit manufacturing plant,
flexible electronic circuits are made from copper sheeting which must be cleaned
before use. Cleaning had been accomplished by spraying with ammonium persulfate,
phosphoric acid, and sulfuric acid. This cleaning operation created a hazardous waste
stream that required special handling and disposal. Equipment for cleaning by
chemical spraying was replaced by a specially designed machine with rotating
brushes which scrubbed the copper sheet with pumice. The resulting pumice slurry
was not hazardous and could be disposed in a sanitary landfill. Savings of $15,000
in raw material, disposal, and labor costs were achieved in the first year. This process
change also eliminated 40,000 lb of hazardous liquid wastes per year (Dupont et al.
2000, p. 357).
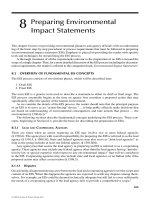
Automation.
Process automation assists or replaces human employees with
automatic devices. Automation can include the monitoring and subsequent adjusting
of process parameters by computer or mechanical handling of hazardous substances.
Minimizing the probability of employee error (which can lead to spills or “off-spec”
products) and increasing product yields through the optimum use of raw materials
can reduce waste. Bar-coded labels (Figure 8.2) can link containers and materials
to a computer through all stages of a container’s life. This improves the accuracy
of material tracking and inventory accounting. Bar codes allow material monitoring
during use and can prevent materials from being lost or becoming outdated.
Good Operating Practices
Procedural Measures.
The Occupational Safety and Health Administration (OSHA)
requires businesses to maintain files of Material Safety Data Sheets (MSDS) for all
hazardous materials. The sheets contain the manufacturer’s information regarding:
• Identity of the chemical and the Chemical Abstracts Service (CAS) number
• Physical characteristics
• Physical and health hazards
• Primary routes of entry
• Exposure limits
• Precautions
• Controls
• Emergency and first aid procedures
• Name of the manufacturer or importer
A major industrial facility uses MSDS to screen all material coming into their plant.
Before the material is requisitioned, medical and hazardous materials experts must
approve it. This approval ensures that a substance has been researched and evaluated
L1533_frame_C08 Page 203 Tuesday, May 1, 2001 12:40 PM
© 2001 by CRC Press LLC
for its hazardous characteristics prior to its use. This potentially reduces generation
of hazardous wastes by eliminating their use.
2
Material Loss Prevention.
Loss prevention programs are designed to reduce
the chances of spilling a product. The key point is that a hazardous
material
becomes
a RCRA hazardous
waste
when it is spilled, and all cleanup material and cleaned-
up material must be managed as hazardous waste. A long-term, slow-release spill
is often difficult to find and when found may have caused the creation of a large
amount of hazardous waste. A material loss prevention program may include the
following procedures:
• Use properly designed tanks and vessels only for their intended purpose.
• Pressure-test underground piping.
• Install overflow alarms for all tanks and vessels.
• Reduce dragout from process/cleaning baths.
• Maintain physical integrity of all tanks and vessels.
• Set up written procedures for all loading, unloading, and transfer operations.
• Install sufficient secondary containment areas.
• Forbid operators to bypass interlocks, alarms, or significantly alter set-
points without authorization.
FIGURE 8.2
Bar-coding as a process tracking tool. (From ROMIC Chemical Corporation,
2081 Bay Road, Palo Alto, CA 94303.)
2
This practice may also apply to the category of product substitution.
L1533_frame_C08 Page 204 Tuesday, May 1, 2001 12:40 PM
© 2001 by CRC Press LLC
• Install electrolysis (anode and cathode) to recover metallic components
in wastewater.
• Isolate equipment or process lines that leak or are not in service.
• Have interlock devices to stop flow to leaking sections.
• Use seal-less pumps.
• Use bellows-seal valves and a good valve layout.
• Pressure-test valves and fittings.
• Document all spillage.
• Perform overall material balances and estimate the quantity and dollar
value of all losses.
• Install leak detection systems for underground storage tanks according to
RCRA Subtitle I.
• Use floating-roof tanks for VOC control.
• Use conservation vents on fixed-roof tanks.
• Use vapor recovery systems.
Management Practices.
Good operating practice involving management is
exemplified by a large consumer product company which adopted a corporate policy
to minimize the generation of hazardous waste. The company mobilized quality
circles made up of employees representing areas within the plant that generated
hazardous waste. The company experienced a 75% reduction in the amount of wastes
generated by instituting proper maintenance procedures suggested by the quality
circle teams. Since the team members were also line supervisors and operators, they
made sure the procedures were followed (EPA 1988, p. 16).
Segregating Waste Streams.
Hazardous waste sent off-site to be disposed of
often includes a mixture of two or more different wastes. Segregating materials and
wastes can decrease the amount of wastes to be disposed. Good operating practices
for successful waste segregation include the following program ingredients:
• Prevent mixing of hazardous wastes with nonhazardous wastes.
• Isolate hazardous wastes by contaminant.
• Isolate liquid wastes from solid waste.
These measures can result in lower volumes of waste haulage and easier disposal
of the hazardous waste. Recyclers and waste exchanges are more receptive to wastes
not contaminated with other substances. One company altered dust collection equip-
ment to collect waste streams from different processes separately. Each collection
can now be recycled back to the process from which it originates. The firm has
eliminated over $9000/year in disposal costs and recovered useable material worth
$2000/year.
Material Handling Improvement.
A major national company has reduced
organics in wastewater by 93% through 4 separate changes in its handling of phenol
and urea resins, as follows:
1. The company altered its method of cleaning the filters which remove large
particles of resinous material as the resin product is loaded into tank cars.
L1533_frame_C08 Page 205 Tuesday, May 1, 2001 12:40 PM
© 2001 by CRC Press LLC
They began collecting the rinse water instead of sending it down the floor
drains and into the company’s on-site wastewater treatment plant. This
rinse water can be reused as an input in the next batch of phenolic resin.
2. When loading urea resin, they began reversing the loading pump at the
end of each load so that resin on the filters would be sucked back into
the storage tank and would not be rinsed out as waste.
3. The company revised rinsing procedures for reactor vessels between
batches. Previously, 11,000- to 15,000-gal chambers had been cleaned by
filling them with water, heating and stirring the water to remove resin
residues, and then draining the rinse water into the plant’s wastewater.
The plant now has a two-step process. A small, first rinse of 100 gal of
water removes most of the residue from the containers. Then a second,
full-volume rinse is used to complete cleaning. The first 100 gal of rinse
water is reused as input material for a later batch of resin. Water from the
second rinse is discharged as wastewater, but has a lower phenol concen-
tration than the previous volume of wastewater.
4. Procedures for transferring phenol from tank cars to storage tanks have
been altered. Formerly, when the hose used to transfer the phenol from
car to tank was disconnected, a small amount of phenol dripped down the
drain — enough to cause problems given the strict regulatory limitation
of phenol. Now, the hose is flushed with a few gallons of water to rinse
the last bit of phenol into the storage tank.
In addition to greatly reducing wastewater volumes, these fairly simple changes have
eliminated most of the hazardous solid wastes generated by the resin manufacturing
processes because the company was able to discontinue use of the on-site evaporation
pond to treat these wastewaters (Office of Technology Assessment 1986, p. 81).
Production Scheduling.
Management should, wherever possible, devise and
incorporate good operating practices to improve production scheduling and planning.
Improved production techniques may include maximizing batch size, dedicating
equipment to a single product, or altering batch sequencing to reduce cleaning
frequency. Production runs of a given formulation should be scheduled together to
reduce the need for equipment cleaning between batches. Careful examination of
workload distribution may reveal opportunities for waste reduction. Dense loading
may result in localized instability of the process solution. In other situations, max-
imizing batch size may minimize waste generated. Optimizing production schedules
can greatly reduce waste in a production facility. Such options may offer easy
implementation and immediate evidence of results.
Hazardous Waste Recycling
In hazardous waste management practice and in the RCRA regulations, “recycling”
refers to the effective use or reuse of a waste as a substitute for a commercial product
or use of a waste as an ingredient or feedstock in an industrial process. It also refers
to reclaiming useful constituent fractions within a waste material or removing con-
taminants from a waste to allow it to be reused. The traditional EPA definition of
L1533_frame_C08 Page 206 Tuesday, May 1, 2001 12:40 PM
© 2001 by CRC Press LLC
recycling
implies
use, reuse,
or
reclamation
of a waste, either on-site or off-site,
3
after it is generated by a particular process [40 CFR 261.1(c)].
One of the most basic and frequent applications of hazardous waste recycling
is the distillation of spent solvents. Large numbers of companies are engaged in the
solvent reclamation business and much of the solvent in use has been reclaimed.
Figure 8.3 diagrams the process. Figure 8.4 is of typical distillation columns. Figure
8.5 illustrates “before and after” appearance of spent and reclaimed solvent (
see
also:
Allen and Rosselot 1997, Chapter 6).
Use and Reuse
Return of a Waste to the Original Process.
A printer of newspaper advertising
purchased an ink recycling unit to produce black newspaper ink from its various
waste inks. The unit blends the different colors of waste ink together with fresh
black ink and black toner to create the black ink. This mixture is then filtered to
remove flakes of dried ink and is used in lieu of fresh black ink. The need for
shipment of waste ink to off-site disposal is eliminated. The price of the recycling
unit was recovered in 9 months, based upon savings in fresh ink purchases and costs
of disposal of the waste ink (EPA 1988, p. 17).
In the microelectronics industry, the high purity requirements for wafer fabrica-
tion make recycling and reuse of the solvents difficult. However, waste solvents can
be recycled and used for the steps in which ultrahigh purity is not required. Examples
FIGURE 8.3
The distillation process.
3
As will be seen shortly hereafter, the Pollution Prevention Act and the EPA implementing initiatives
now exclude “out-of-process” recycling as a form of pollution prevention.
L1533_frame_C08 Page 207 Tuesday, May 1, 2001 12:40 PM
© 2001 by CRC Press LLC
of those steps are the wafer-washing step before wafer lapping and the washing step
after etching and before polishing (Dupont et al. 2000, p. 356).
Substitution for Raw Material in Another Process.
A U.S. Air Force solvent
reclaiming operation is successfully reclaiming polyurethane paint thinners. The
original material contains 40% cellusolve acetate, 12% toluene, 30% methyl ethyl
ketone (MEK), and 10%
n
-butyl acetate. The distillate, which contains only toluene
and MEK, is used for wipedown and cleanup of painting equipment (Harris 1988).
FIGURE 8.4
Distillation columns. (From ROMIC Chemical Corporation, 2081 Bay Road,
Palo Alto, CA 94303.)
FIGURE 8.5
Before and after — spent solvent and reclaimed solvent. (From ROMIC Chem-
ical Corporation, 2081 Bay Road, Palo Alto, CA 94303.)
L1533_frame_C08 Page 208 Tuesday, May 1, 2001 12:40 PM
© 2001 by CRC Press LLC
(For discussion and references on solvent recovery and reuse in laboratories,
see:
Reinhardt et al. 1996).
Reclamation
Processing Hazardous Waste for Product Recovery.
Sand used in the casting
process at foundries contains residues of heavy metals such as copper, lead, and
zinc. If these concentrations exceed Toxicity Characteristic Leaching Procedure
(TCLP) standards, the sand is a hazardous waste and must be managed as such.
Researchers are investigating various techniques for reclaiming the metal values
from the sand. Recent experiments demonstrated that 95% of the copper could be
precipitated and recovered in minutes (McCoy and Associates 1989, pp. 1–23). Sand
may also be processed in smelters to recover metal values.
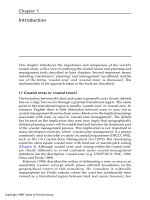
A printed wiring board (PWB) operation uses ammoniacal etchants to etch pat-
terns on PWBs. The spent etchant is sent back to the chemical supplier, where the
copper is extracted with an organic solvent to create a copper-rich organic layer and
copper-lean aqueous solution. The aqueous phase is regenerated by the addition of
ammonia and other additives to create fresh etchant. The organic layer is treated with
sulfuric acid to remove the copper from the organic solvent. Regenerated solvent is
fed back into the process, and the copper in the aqueous stream is recovered as copper
sulfate pentahydrate via crystallization or as copper metal via electrowinning. Copper
sulfate recovered by this process can be used to manufacture other copper-based
chemicals or used directly in applications such as wood preservatives or algicide. A
simplified schematic is shown in Figure 8.6 (Milliman and Luyten 1999, pp. 32–35).
FIGURE 8.6
Alkaline ammonia etchant cycle. (Copyright ©1999, by Kevin E. Milliman and
Henry C. Luyten, “Waste Not Want Not,” published in
Environmental Protection,
May 1999.
All rights reserved by Stevens Publishing Corporation. Reprinted with permission.)
L1533_frame_C08 Page 209 Tuesday, May 1, 2001 12:40 PM
© 2001 by CRC Press LLC
Processing Hazardous Waste As a By-Product.
Some classic uses of hazardous
waste as a by-product, raw material, or feedstock have been mentioned. The most
common include wastewaters used for irrigation and oil field pressurization; sludges
used as fertilizers or soil matrix; lime generated by the carbide process for acetylene
production used and routinely marketed for many purposes; and sulfuric acid from
smelters used for a variety of purposes. These uses have stimulated entrepreneurs
to the development of the “waste exchange.”
The waste exchange serves as a clearinghouse for data on available wastes and
raw materials needed. When the exchange identifies a match between an available
waste commodity and a need, the parties are notified and allowed to consummate
an arrangement suitable to both. Waste exchanges became numerous in the U.S. and
Canada during the early and mid-1980s.
In practice, the exchange has enjoyed only limited acceptance. The potential
participants tend toward secrecy, fearing compromise of trade secrets by their com-
petitors. The liability implications of transferring control to other than a permitted
treatment, storage, and disposal facility are also significant impediments to accep-
tance of exchanges. The EPA initially supported several exchanges, through grant
programs, but some of these operations had not gained sufficient momentum and
failed when the grant support was discontinued (Hild 1988) (
see also:
Higgins 1989,
Chapters 1 to 8; Breen and Dellarco 1992; Alexander 1992; U.S. EPA 1997); Dupont
et al. 2000, pp. 306–308).
M
ULTI
-C
ONCEPTUAL
A
PPROACHES
Significant source reduction can be achieved through combinations of the concepts
sampled herein. For examples of prevention of fugitive and secondary emissions,
see Allen and Rossellot, 1997. For a wide range of techniques and concepts for
source reduction that are present in laboratory design, operations, and management,
see Reinhardt et al. 1996. A rigorous “multi-media” pollution prevention assessment
using four categorical checklists to identify fundamental causes of emission and
waste generation, rather than simply addressing symptoms, is described by Chada
1997. Chada uses lists of 100 pollution prevention strategies, based upon changes
in engineering design, process chemistry, operating procedures and maintenance
practices for “brainstorming ideas and developing options.” A corporate waste
accounting system, described by Nizolek et al. 1997, “… consistently collects,
evaluates, and documents essential waste generation and disposal data, and manage-
ment costs,” enabling management to make sound pollution prevention and waste
management decisions (
see also:
Wentz 1989, Chapter 6; Wrieden 2000, Chapter
13; DuPont et al. 2000, Chapters 15 to 21; Shen 1999, pp. 219ff).
T
HE
RCRA H
AZARDOUS
W
ASTE
M
INIMIZATION
P
ROGRAM
As noted, RCRA/HSWA do not put forth a mandatory hazardous waste minimization
program. Early RCRA implementation reflected Congressional sentiment that impo-
sition of specific hazardous waste reduction requirements would amount to an
L1533_frame_C08 Page 210 Tuesday, May 1, 2001 12:40 PM
© 2001 by CRC Press LLC
unacceptable intervention in business and industrial practice. Nevertheless, in Sec-
tion 1003 of RCRA, the Congress stated succinctly:
The Congress hereby declares it to be the national policy of the U.S. that,
wherever feasible, the generation of hazardous waste is to be reduced or elim-
inated as expeditiously as possible. Waste that is nevertheless generated should
be treated, stored, or disposed of so as to minimize the present and future threat
to human health and the environment.
This national policy was, and continues to be, implemented through three specific
activities which were mandated by the 1984 RCRA amendments (HSWA). These
specific requirements apply to generators who manage their wastes on-site or those
who ship wastes off-site and to permitted facilities:
•
Reporting Procedures:
Generators subject to reporting requirements were
to include in their annual or biennial reports “… efforts undertaken during
the year to reduce the volume and toxicity of waste generated; and … the
changes in volume and toxicity of waste actually achieved during the year
… in comparison to previous years … .”
•
Manifest System:
A section on waste minimization was added to require
a generator’s certification on the manifest for all regulated off-site ship-
ments to state that “the generator of the hazardous waste has a program
in place to reduce the volume or quantity and toxicity of such waste to
the degree determined by the generator to be economically practicable;
and … the proposed method of treatment, storage, or disposal is that
practicable method currently available to the generator which minimizes
the present and future threat to human health and the environment.”
•
Permits:
Effective September 1, 1985, any permit issued for the treatment,
storage, or disposal of hazardous waste on the premises where the waste
was generated required that the permittee certify no less often than annu-
ally that “the generator of the hazardous waste has a program in place to
reduce the volume or quantity and toxicity of such waste to the degree
determined by the generator to be economically practicable; and … the
proposed method of treatment, storage, or disposal is that practicable
method currently available to the generator, which minimizes the present
and future threat to human health and the environment.”
The biennial reports of generators who ship their wastes off-site, and of permitted
and interim status TSD facilities, are the only data collection mechanisms by which
the effectiveness of the waste minimization program can be judged. Until recently,
efforts to aggregate this information did not produce good results, due to absence
of consistent definitions, procedures, and measurements, among states. The quality
L1533_frame_C08 Page 211 Tuesday, May 1, 2001 12:40 PM
© 2001 by CRC Press LLC
of the reporting and aggregation has improved since 1989, and the later data reflects
new rigor in the process.
The EPA thus continued the RCRA
hazardous waste minimization
program in the
nonmandatory format. Nevertheless, the agency intensified its efforts toward greater
achievement in waste minimization by a series of pronouncements and initiatives:
• In May 1993, the Administrator announced the Draft Hazardous Waste
Minimization and Combustion Strategy and placed a “temporary capacity
freeze” on new incinerators and other combustion units
4
as discussed in
the previous chapter.
• In November 1993, the Administrator sent letters to 22,000 large quantity
generators that were required to certify that they had a waste minimiza-
tion program in place in 1991. Letters were also sent to 12,000 chief
executives of the parent corporations of those generators. The letters
referenced current requirements for waste minimization programs and
encouraged the companies to make response information available to the
public (EPA 1994b).
• In May 1994, the EPA released a Draft RCRA Hazardous Waste Mini-
mization National Plan which generally incorporated the thrust of the
Hazardous Waste Minimization and Combustion Strategy (EPA 1994d).
The final “Waste Minimization National Plan” was released by the EPA
in November 1994. The goals of the plan are summarized in a later section
of this chapter.
The Combustion Strategy is translated, in the final plan, to the setting of … “initial
national priorities for metals contained in hazardous wastes treated by combustion
facilities and metals in releases from combustion facilities” (EPA 1994a, p. ES-1).
The Biennial RCRA Hazardous Waste Report (EPA 1994c) shows that “thermal
treatment” accounted for 1.1% of the 306 million tons of hazardous waste generated
in 1991. As noted earlier, the rationale for this high profile focus on 1.1% of the
hazardous waste generated (in 1991) was apparently never made clear.
RCRA R
EGULATION
OF
R
ECYCLING
As emphasized in Chapter 1 and elsewhere in this text, the Congress and the EPA
have justifiably focused upon the accumulation of hazardous waste as an activity
rich with potential for mismanagement. At the date of this writing, nearly three
decades after enactment of RCRA, unscrupulous operators continue to attempt to
convince the EPA and state inspectors that the stack of drums or the pile of waste
4
The EPA, the regional offices, and the states thereupon began an intensive inspection and enforcement
campaign directed toward combustion facilities, requiring permit applicants to perform full risk assess-
ments, including assessment of the risk of indirect exposure to emissions through the food chain, as part
of all new combustion facility permits. As this scenario unfolded, 27 incinerator and 22 boiler/industrial
furnace facilities withdrew permit applications, abandoned interim status, or otherwise capitulated regard-
ing their plans or efforts to incinerate hazardous wastes (EPA 1994a,b).
L1533_frame_C08 Page 212 Tuesday, May 1, 2001 12:40 PM
© 2001 by CRC Press LLC
on the back lot or in the shed are destined for recycling. Sham recycling of “haz-
ardous waste fuel” remains a problem. The EPA continues the quest for the regulatory
definitions and formulae which will finally end deceptive activity and questionable
practice, without imposing still heavier record keeping and reporting burdens. Sig-
nificant progress has been made in this regard, but the regulatory scheme is complex,
contorted, and ambiguous. Representatives of regulated industry chafe at the ambi-
guity of the regulations and the interpretations thereof. These regulations continue
to occupy target lists of industry focus groups, trade associations, and political office
holders and candidates. The recycling regulations also incur the opposition of envi-
ronmental activists, some of whom look upon the combustion of hazardous waste
as a major threat to public health.
Part 266 of the 40 CFR originally provided much of EPA’s regulatory program
for recycling of hazardous wastes. Perusal of the table of contents for Part 266 will
reveal that Subparts A, B, D, and E
5
are now “reserved” and that Subparts C, F, and
G deal with relatively simple issues. Subpart H houses the very complex and
controversial regulations for “Hazardous Waste Burned in Boilers and Industrial
Furnaces.” Over time, the EPA has vacated much of the language of Part 266 and
has increasingly relied on the definitions of solid and hazardous waste, as set forth
in 40 CFR 261, and on the Land Disposal Restrictions of Part 268 to regulate the
recycling of wastes.
The Subpart H standards were published on February 21, 1991 (56 FR 7208).
In Subpart H, the EPA attempted to deal with the issue of hazardous wastes being
burned in boilers and industrial furnaces (BIFs) for fuel content vs. destruction of
hazardous waste constituents. Although HSWA requires the EPA to develop technical
standards for burning of hazardous wastes in BIFs for heat recovery, the agency had
not, prior to this date, promulgated the regulation. “Sham recycling” had been
commonplace and Subpart H was intended to meet the HSWA requirement and gain
control of the sham recycling problem. The regulation establishes standards for
controlling emissions of organic compounds, metals, and HCL from BIFs that burn
hazardous waste irrespective of the purpose of the burning, but a significant grouping
of burners remain exempt from the standards.
The complexities of the Subpart H standards,
including
12 appendices,
greatly
exceed the scope of this text, and it must be left to the student or practitioner to
examine the details of the standards according to his/her needs.
EPA I
MPLEMENTATION
OF
T
HE
P
OLLUTION
P
REVENTION
A
CT (PPA)
OF 1990
The most notable feature of the PPA is a Congressional restatement of the national
goals regarding waste minimization:
5
The Used Oil Management Standards, formerly found at 40 CFR 266, Subpart E, were
published as 40 CFR 279 on September 10, 1992 (57 FR 41612)
.
L1533_frame_C08 Page 213 Tuesday, May 1, 2001 12:40 PM
© 2001 by CRC Press LLC
The Congress hereby declares it to be the national policy of the U.S. that
pollution should be prevented or reduced at the source whenever feasible;
pollution that cannot be prevented should be recycled in an environmentally
safe manner, whenever feasible; pollution that cannot be prevented or recycled
should be treated in an environmentally safe manner whenever feasible; and
disposal or other release into the environment should be employed only as a
last resort and should be conducted in an environmentally safe manner [PPA
§ 13101(b)].
Congress also redefined the term source reduction to exclude “out-of-process” recy-
cling and “any practice which alters the physical, chemical, or biological character-
istics or the volume of a hazardous substance, pollutant, or contaminant through a
process or activity which itself is not integral to and necessary for the production
of a product or the providing of a service” [PPA § 13102(5)(B)]. In other words, a
waste that has been released cannot be prevented — a highly controversial redefi-
nition. Stated another way, “in-process” or “closed-loop” recycling, the direct rein-
troduction of a waste into the same process, apparently qualifies as source reduction
or pollution prevention. The text of the Act may be accessed at
< (see: Phipps 1995, p. 2).
In “Phase II” of the EPA implementation of the PPA, the agency has left standing
most of the “Phase I” policy instruments and has brought forth and/or embraced a
new generation of initiatives, policy statements, and programs. These instruments
have a common thread, the deemphasis of the earlier waste minimization/recy-
cling/reuse rubric, and nearly total emphasis on Pollution Prevention (P2). The more
significant initiatives, in summary form, are
• The Waste Minimization National Plan: The Plan is described by the EPA
as a long-term national effort to reduce the quantity and toxicity of
hazardous wastes. The goals of the plan are
1. To reduce, as a nation, the presence of the most persistent, bioaccu-
mulative, and toxic constituents by 25% by the year 2000 and by 50%
by the year 2005
2. To avoid transferring these constituents across environmental media
3. To ensure that these constituents are reduced at their source whenever
possible or, when not possible, that they are recycled in an environ-
mentally sound manner (EPA 1994a; a summary outline of the Plan
may be accessed at < />mize/waste.txt>)
• Toxics Release Inventory: The TRI originated with the implementation of
the Emergency Planning and Community Right-to-Know Act (EPCRA)
in 1986. Congress specifically required manufacturing facilities having
Standard Industrial Codes 20 through 39 to report annually the quantities
of toxic chemicals they release into the environment. The EPA acted upon
L1533_frame_C08 Page 214 Tuesday, May 1, 2001 12:40 PM
© 2001 by CRC Press LLC
the increased reporting requirements of the PPA by lowering selected TRI
reporting thresholds and requiring greater detail in reporting on recycling
and progress on source reduction. In 1999, the EPA published a final rule
(40 CFR 372) under EPCRA § 313 lowering the reporting thresholds for
persistent, bioaccumulative, toxic (PBT)
6
chemicals then subject to the
TRI reporting requirements and added other PBT chemicals to the TRI
(EPA 1999a; 64 FR 58665). The TRI can be accessed at a variety of sites
and in a variety of formats. The user may access the EPA homesite and
use the search or publications tab.
• Common Sense Initiative: The CSI is an attempt by the EPA to reach
consensus with representatives (“stakeholders”) of industrial categories
(“sectors”) on … “opportunities to change complicated and inconsistent
environmental policies into comprehensive sector environmental strate-
gies for the future” (EPA 1999b). The objective is to eventually revamp
environmental regulation from a pollutant or environmental media focus
to an industry sector focus, in the belief that this strategy would lead to
less costly, less adversarial way of regulating industry. Stakeholders from
six industry sectors
7
have been organized into sector teams and work
groups which meet frequently to work on projects, policy considerations,
and other issues. Output of these groups, in the form of reports, decisions,
issues, and data are forwarded to the CSI Council, which includes high-
level decision makers from the stakeholder groups and industries. In
addition to sector-specific innovations, the teams explore solutions to
common issues, including alternative flexible regulatory systems, pollu-
tion prevention as a standard business practice, improved reporting for
public consumption, and enhanced compliance and public participation
in the permitting process. A concise explanation of the initiative can be
accessed at <monsense/bckgrd.htm>.
• Multimedia Strategy for Priority Persistent, Bioaccumulative, and Toxic
Pollutants: The PBT strategy is intended to … “overcome the remaining
challenges in addressing priority PBT pollutants … . Due to a number of
adverse health and ecological effects linked to PBT pollutants — espe-
cially mercury, PCBs, and dioxins — it is key for EPA to aim for further
reductions in PBT risks” (EPA 1999, ES). This strategy reinforces and
builds on existing EPA commitments to priority PBTs, i.e., the 1997
Canada-U.S. Binational Toxics Strategy (BNS). The EPA approach to the
PBT Strategy is summarized as follows:
1. Develop and Implement National Action Plans for Priority PBT Pol-
lutants. The EPA is initially focusing on 12 BNS Level 1 substances:
aldrin/dieldrin, benzo(a)pyrene, chlordane, DDT, hexachlorobenzene,
alkyl-lead, mercury and compounds, mirex, octachlorostyrene, PCBs,
dioxins and furans, and toxaphene. The agency plans to focus initially
6
See: Multimedia Strategy for PBTs below.
7
Automobile manufacturing, computers and electronics, iron and steel, metal finishing, petroleum refin-
ing, and printing.
L1533_frame_C08 Page 215 Tuesday, May 1, 2001 12:40 PM
© 2001 by CRC Press LLC
on achieving reductions in mercury releases, as an element of a pre-
viously initiated mercury reduction plan. Elements in progress or
planned include
a. Conduct process-specific and (P2) projects under the mercury action
plan, including regulatory actions and voluntary reductions.
b. Focus enforcement and compliance assistance activities on PBTs.
c. Develop or revise water quality criteria for mercury and other priority
PBTs and revise methodology for mercury water quality criteria.
d. Conduct research and analyses on PBTs, especially on mercury
emission controls for coal-fired utility boilers, and on the transport,
fate, and risk management of mercury.
e. Continue active participation in international efforts beyond the
BNS to reduce PBT risks.
2. Screen and Select Additional Priority PBT Pollutants for Action.
3. Prevent Introduction of New PBTs. The agency is acting to prevent
new PBT chemicals from entering commerce by a variety of testing
and restriction proposals, rulemaking to control reintroduction of out-
of-use PBTs, incentives for development of lower-risk substitutes, and
monitoring screening criteria for new and re-registering pesticides.
4. Measure Progress. The EPA is defining measurable objectives and
instruments, such as human health and environmental indicators; sur-
veys and studies of chemical residues in fish; chemical release, waste
generation and use indicators; and program activity measures such as
compliance and enforcement data (EPA 1998, ES). The EPA Strategy
can be accessed at < (and
/pbt/pbtstrat.htm).
• The 33/50 Program: In 1991, in concert with the PPA, the Clean Air Act
Amendments of 1990, and the RCRA waste minimization program, the EPA
established the “33/50 Program.” The program targeted 17 priority chemicals
and set a goal of 33% reduction in releases and transfers of these chemicals
by 1992 and a 50% reduction by 1995, measured against a 1988 baseline.
The intent was to demonstrate that voluntary partnerships with industry
could augment the agency’s traditional command-and-control approach by
bringing about targeted reductions more quickly than would regulations
alone. The EPA reported that toxic releases were reduced by about 40% by
1992 and more than 55% by 1995 (EPA 1999c).
8
The 33/50 program can
be accessed at < (see also:
Bolstridge 1992, Chapter 12).
• The Virtual Elimination Project: Programs to “virtually eliminate” priority
persistent, bioaccumulative, and toxic (PBT) and other “selected” pollut-
ants are another EPA approach to reduction of risks to human health and
8
The Government Accounting Office (GAO), in two September 1994 reports to Congress, is
critical of the fact that the program embodied no means for the EPA to verify the reported
quantities or even that the reductions are attributable to the 33/50 Program. The reader wishing
further detail may obtain the reports by contacting GAO. The reports are
GAO/RCED-94-93
and GAO/RCED-94-207
.
L1533_frame_C08 Page 216 Tuesday, May 1, 2001 12:40 PM
© 2001 by CRC Press LLC
the environment. This initiative seeks to prevent any new releases into the
environment, from all pathways (land, air, and water), and to eliminate
the use of these target compounds wherever possible, thereby minimizing
future releases. The EPA states in the source document; “This approach
create (sic) opportunities for immediate reductions, without the need for
additional research or regulatory action.”
9
The concept of virtual elimi-
nation has been endorsed by the governments of Canada and the U.S. The
1994 Biennial Report of the International Joint Commission (IJC) iden-
tified three stages of virtual elimination: (1) controlling releases, (2)
preventing use or generation, and (3) developing sustainable industry and
product/material use (EPA 1998b). The EPA can be expected to seek P2
measures in permits, TRI and Biennial reporting by generators, enforce-
ment decrees and settlements, interagency agreements, etc.
• Other P2 Linkages: Federal and state governments, departments and agen-
cies, corporations, non-governmental organizations, interest groups, and
environmental advocacy groups have formed an array of inter- and intra-
agency programs, partnerships, and other linkages which have as their focus
the promotion and implementation of P2 concepts, plans, and programs.
Their numbers and operating mechanisms are too numerous and diverse to
attempt an organized presentation. Most are accessible on the internet, and
most are eager to provide information and recruit participants and/or sup-
port. These resources are listed in the EPA Office of Solid Waste publication
“Waste Minimization/Pollution Prevention Resource Directory” (EPA
1999c), which can be accessed at < />waste/minimize/p2.htm>.
Other sources of P2 information, concepts, and linkages are provided in Appendix
B (see also: Phipps 1995; Shen 1999; Dupont et al. 2000).
TOPICS FOR REVIEW OR DISCUSSION
1. The text refers to a classic process change — the use of a single solvent for
several purposes, reusing the solvent in succeeding processes which require
decreasing purity. Name at least three advantages of such a modification.
2. There are apparently several reasons why many hazardous waste
exchanges have not prospered. What are three of the reasons?
3. What format could be used to make a regulatory distinction between
burning of hazardous waste for the fuel value and incinerating to destroy
the hazardous constituents?
4. The EPA waste minimization program embodies a hierarchy of preferable
options for hazardous waste management. Proceeding from most desirable
to least desirable, list those options.
9
Thus, the EPA apparently interprets the language of the PPA to provide authority to impose new exposure
criteria without awaiting the findings of exposure research and to add new permitting discretion to that
previously provided by the omnibus authorities of RCRA § 3005(c)(3).
L1533_frame_C08 Page 217 Tuesday, May 1, 2001 12:40 PM
© 2001 by CRC Press LLC
APPENDIX A
State Agency P2 Linkages and Resources
AL Department of Environmental
Management
205-250-2779
AK Department of Environmental
Conservation, P2 Office
907-269-7582 www.state.ak.us
AZ Department of Environmental
Quality, P2 Unit
602-207-4235 www.adeq.state.az.us
AR Department of P2 and Ecology,
HazWaste Division
501-570-0018 www.adeq.state.ar.us
CA EPA, Department of Toxic Substance
Control, OP2
916-322-3670 www.dtsc.ca.gov/txpollpr
CO Department of Public Health and
Environment, P2 Unit
303-692-3003 www.sni.net/light/p3/
CT Department of Environmental
Protection, Bureau of Waste
Management
203-566-5217 dep.state.ct.us/deao/ca/assist
DE Department of Natural Resources and
Environmental Controls, P2 Program
302-739-5071 www.dnrec.state.de.us
FL Department of Environmental
Protection, P2 Program
904-488-0300 www.dep.state.fl.us/waste/programs/p2
GA Department of Natural Resources, P2
Division
404-651-5120 www.ganet.org/dnr/p2ad/
HI Department of Health, Environmental
Management Division, Office of SW
Management
808-586-8143 www.state.hi.us/doh/eh
ID Department of Environmental Quality,
P2 Program
208-373-0502 www.state.id.us/deq/ptwo.htm
IL Environmental Protection Agency,
Office of P2
217-782-8700 www.epa.state.il.us/p2/index.html
IN Department of Environmental
Management, Office of P2 and
Technical Assistance
317-232-8172 www.ai.org/idem/oppta/
IA Department of Natural Resources,
Waste Management Assistance Division
515-281-8927 www.iwrc.org/programs.html
KS Department of Health and
Environment, Division of Environment,
P2 Program
785-296-0669 www.ink.org/public/kdhe
KY Division of Waste Management, P2
Program
502-564-6716 www.state.ky.us/agencies/nrepc/programs/p2
LA Department of Environmental
Quality, Technical Program Support
225-765-0720 www.deq.state.la.us/osec/latap.htm
ME Department of Environmental
Protection, P2 Office
207-287-3811 www.state.me.us/dep/p2home.htm
MD Department of the Environment 410-631-4119 www.mde.state.md.us.permit/p2prog.html
MA Department of Environmental
Protection, Bureau of Waste Prevention
508-767-2775 www.state.ma.us/dep/bwp/dhm
L1533_frame_C08 Page 218 Tuesday, May 1, 2001 12:40 PM
© 2001 by CRC Press LLC
MI Department of Comm. & Natural
Resources, Office of Waste Red Services
517-373-1871 www.deq.state.mi.us
MN Pollution Control Agency,
Environmental Assessment Office
612-296-8643 www.pca.state.mn.us/programs/p2_p
MO Department of Natural Resources,
Division of Environmental Quality
573-526-6627 www.dnr.state.mo.us/deq/tap
MS Department of Environmental
Quality, Waste Min Unit
601-961-5321 www.deq.state.ms.us/domino/erowb
MT Department of Environmental
Quality, P2 Bureau
888-678-6822 www.montana.edu/wwwated
NE Department of Environmental
Control, Hazardous Waste Section
402-471-4217
NV Division of Environmental
Protection, Bureau of Waste
Management
702-667-4870 www.scs.unr.edu/nsbdc/bep.htm
NH Department of Environmental
Service, Waste Management Division,
P2 Program
603-271-2902 www.state.nh.us/des/nhppp/
NJ Department of Environmental
Protection, P2 Office
609-292-1122 E:
NM Environmental Department, P2
Program
505-827-0197
NY State Department of Environmental
Conservation, P2 Unit
518-457-7267 www.dec.state.ny.us/website/ppu/
NC Division of Pollution Prevention and
Environmental Assisstance
919-715-6500 www.p2pays.org
ND Department of Health,
Environmental Health Section, P2
Program
701-328-5153 E:
OH Environmental Protection Agency,
Office of P2
614-644-3469 www.epa.ohio.gov/opp/oppmain.html
OK Department of Environmental
Quality, P2 Technical Assisstance
405-271 1400 www.deq.state.ok.us/p2intro.htm
OR Department of Environmental
Quality, P2 Coordinator
503-229-5458 www.deq.state.or.us/hub/p2.htm
PA Department of Environmental
Resources, Office of Air & Waste
Management
717-783-0540 www.dep.state.pa.us/dep/
RI Department of Environmental
Management, P2 Supervision
401-222-6822 www.state.ri.us/dem/org/otca.htm
SC Department of Health &
Environmental Control, Center for
Waste Management
803-734-4715 www.state.sc.us/dhec/
SD Department of Environmental &
Natural Resources, P2 Coordination
605-773-4216
APPENDIX A (Continued)
State Agency P2 Linkages and Resources
L1533_frame_C08 Page 219 Tuesday, May 1, 2001 12:40 PM
© 2001 by CRC Press LLC
TN Department of Environment &
Conservation, P2 Division
605-741-3657 www.state.tn.us/environment/p2.htm
TX Water Commission, Office of P2 &
Conservation
512-239-3166 www.tnrcc.state.tx.us/exec/oppr/index
UT Department of Environmental
Quality
801-536-4480 www.eq.state.us/eqoas/p2/p2_home.htm
VT Department of Environmental
Conservation, P2 Division
802-241-3629
VA Department of Environmental
Quality, Office of P2
804-371-3712 www.deq.state.va.us/opp.html
WA Deptartment of Ecology, P2 Services 360-407-6702 www.wa.gov/ecology/pie/98overvu/98aohwtr
WI Department of Natural Resources,
Haz P2 Audit
608-267-3125 www.dnr.state.wi.us/org/caer/cea
WY Department of Environmental
Quality, SW Management Program
307-777-7752 www.deq.state.wy.us/outreach1.htm
APPENDIX B
P2 Information, Concepts, and Linkages
Pollution Prevention Information Clearinghouse
(PPIC)
/>Design for the Environment (DfE) />Incorporation of Pollution Prevention Principles
into Chemical Science Education
/>chemabstract.html
EPA/OSW Waste Minimization Products and
Documents
/>docs.htm
EPA Waste Minimization National Plan />waste.txt
EPA Meeting the Challenge: A Summary of
Federal Agency Pollution Prevention Strategies
/>p2.html
Strategic Environmental Management List />SEM.html
Voluntary Standards Network (including ISO
14000 series)
/>Life Cycle Analysis/Life Cycle Assessment
(LCA)
/>lca_brief.htm
ISO 12001: A Discussion of Implications for
Pollution Prevention
/>APPENDIX A (Continued)
State Agency P2 Linkages and Resources
L1533_frame_C08 Page 220 Tuesday, May 1, 2001 12:40 PM
© 2001 by CRC Press LLC
5. RCRA requires hazardous waste generators who treat on-site or transport
off-site to certify that they have waste minimization programs in place.
How is this certification accomplished?
6. How would you expect the EPA or a state environmental regulatory
authority to state a regulatory requirement that RCRA facilities reduce
the quantities of hazardous waste generated?
REFERENCES
Alexander, Henry, P. E. 1992. “Source Reduction and Waste Minimization for Hazardous
Wastes,” in Environmental Management. May/June, 1992:37ff.
Allen, David T. and Kirsten Sinclair Rosselot. 1997. Pollution Prevention for Chemical
Processes. John Wiley & Sons, NY.
Bolstridge, June C. 1992. EPCRA Data on Chemical Releases, Inventories, and Emergency
Planning. Van Nostrand Reinhold, NY.
Breen, Joseph J. and Michael J. Dellarco. 1992. Pollution Prevention in Industrial Processes
— The Role of Process Analytical Chemistry. American Chemical Society, Washington,
D.C.
Chada, Nick. 1997. “Develop Multimedia Pollution Prevention Strategies,” in Environmental
Management and Pollution Prevention, Gail F. Nalven, Ed., American Institute of Chem-
ical Engineers, NY.
Dupont, R. Ryan, Louis Theodore, and Kumar Ganesan. 2000. Pollution Prevention The Waste
Management Approach for the 21st Century. CRC Press, Boca Raton, FL.
Harris, Margaret. 1988. “In-House Solvent Reclamation Efforts in Air Force Maintenance
Operations,” in Hazardous Waste Minimization within the Department of Defense,
Joseph A. Kaminski, Ed., Office of the Deputy Assistant Secretary of Defense (Environ-
ment), Washington, D.C.
Higgins, Thomas E. 1989. Hazardous Waste Minimization Handbook. Lewis Publishers,
Chelsea, MI.
Hild, Nicholas R. 1988. Professor, Information and Management Technology, Arizona State
University East, Personal Communication.
Milliman, Kevin E. and Henry C. Luyten. 1999. “Waste Not, Want Not,” in Environmental
Protection. May, 1999:32ff. Stevens Publishing, Waco, TX.
Mills, Michael B. 1988. “Hazardous Waste Minimization in the Manufacture of Explosives,”
in Hazardous Waste Minimization within the Department of Defense, Joseph A. Kamin-
ski, Ed., Office of the Deputy Assistant Secretary of Defense (Environment), Washington,
D.C.
McCoy and Associates. 1989. “Detoxifying Foundry Waste,” in The Hazardous Waste Con-
sultant March/April, 1989, McCoy and Associates, Inc., Lakewood, CO.
Nizolek, Donald C., W. Corey Trench, and Mary E. McLearn. 1997. “Set Up a Waste
Accounting System to Track Pollution Prevention,” in Environmental Management and
Pollution Prevention, Gail F. Nalven, Ed., American Institute of Chemical Engineers, NY.
Phipps, Erica. 1995. Pollution Prevention Concepts and Principles. National Pollution Pre-
vention Center for Higher Education, University of Michigan, Ann Arbor.
Reinhardt, Peter A., K. Leigh Leonard, and Peter C. Ashbrook. 1996. Pollution Prevention
in Laboratories. CRC Press, Boca Raton, FL.
Shen, Thomas T. 1999. Industrial Pollution Prevention. Springer-Verlag, Berlin.
Smith, J. D. 1998. “Once Is Not Enough,” in Environmental Protection. October, 1998:36ff.
L1533_frame_C08 Page 221 Tuesday, May 1, 2001 12:40 PM
© 2001 by CRC Press LLC