Biological Risk Engineering Handbook: Infection Control and Decontamination - Chapter 2 docx
Bạn đang xem bản rút gọn của tài liệu. Xem và tải ngay bản đầy đủ của tài liệu tại đây (1.21 MB, 31 trang )
© 2003 BY CRC PRESS LLC
CHAPTER 2
Industrial Hygiene Sampling
Dennis W. Day, Martha J. Boss, R. Vincent Miller, and Chris Wrenn
CONTENTS
2.1 Sampling: Biologicals and General Air Quality
2.1.1 Regulatory and Industry Guidance Reviews
2.1.2 Sampling Scope
2.2 Health and Safety Precautions
2.3 Data Gathering
2.3.1 Document Review
2.3.2 Sample Initial On-Site Investigation
2.3.3 Sampling Areas
2.4 Recordkeeping
2.5 Industrial Hygiene Measurements
2.6 Aerosols
2.6.1 Particulates
2.6.2 Solid-Particle Aerosols
2.6.3 Liquid-Droplet Aerosols
2.6.4 Solid/Liquid Particle Aerosols
2.6.5 Suspended Particulate Matter
2.7 Air Sampling: Methods for General Particulates
2.7.1 Gravimetric Filter Weighing Procedure
2.7.2 Total Dust
2.7.3 Respirable and Inhalable Dust
2.7.4 Silica Respirable Dust: Cyclone Collection
2.7.5 Direct-Reading Dust Monitors
2.8 Biologicals: Viable vs. Nonviable
2.9 Mold Sampling: Industrial Hygiene Protocols
2.9.1 Direct Detection
2.9.2 Interior Wall Sampling
2.9.3 Contact and Grab Sampling
2.9.4 Air Sampling: Bioaerosols
2.9.5 Example of Reuter Centrifugal Sampler (RCS) or SAS Sampling Sequence
2.9.6 Example of Exit Requirements
2.10 Volatile Screening
© 2003 BY CRC PRESS LLC
2.10.1 Photoionization Detectors
2.10.2 Photoionizaton Detectors and Indoor Air Quality
2.11 Summa Canister and Mini-Can
2.12 Adsorbent Media Followed by GC/MS Lab Analysis
2.12.1 Solid Sorbent Tubes
2.12.2 Detector Tubes
2.12.3 Colorimetric Sorbent Packed Tubes
2.12.4 Vapor Badges
2.12.5 Formaldehyde
2.13 Pesticides, Polyaromatic Hydrocarbons, and Polyurethane Foam
2.14 Acid Gases or Caustics
2.14.1 Impingers
2.14.2 Sorbent Tubes
2.14.3 Detectors
2.15 Indicator Papers or Meters
2.16 Ventilation Adequacy
2.16.1 Smoke Tubes
2.16.2 Anemometers
2.16.3 Static Pressure in the Hood
2.16.4 Pressure Gauges
2.16.5 Duct Velocity
2.16.6 Carbon Dioxide as an Indicator of Ventilation
2.16.7 Oxygen/Combustible Gas Indicators (O
2
/CGI) and Toxin Sensors
2.16.8 Toxic Gas Meters
2.17 Moisture Meters and Photography
References and Resources
Sampling may not always be required in order to determine biological risk. Still, knowledge
of sampling methods available will enable investigators and concerned parties to sample when
required. Sampling includes both sampling for infective agents and sampling to determine other
ambient air conditions.
2.1 SAMPLING: BIOLOGICALS AND GENERAL AIR QUALITY
Investigative sampling may be needed to determine biological quantitative levels caused by an
amplifier that is problematic but difficult to identify visually. Examples include mold growth in
heating, ventilation, and air conditioning (HVAC) systems and behind walls. Common indications
for characterization and remediation of the discovered amplifiers are:
• Occurrence of symptoms consistent with adverse reaction to indoor molds
• Building management or administrative concerns that the amplifiers might cause symptoms in the
future
• Indications of exacerbate materials degradation
• Noxious odors
• Cosmetic, esthetic, psychological, or political disadvantages of conspicuous decay
Sampling may be required before, during, and after decontamination efforts. Acceptable sam-
pling methods and contamination levels must be determined by a competent person prior to the
onset of either investigative or decontamination events. A sampling plan should be developed and
reviewed by all parties.
© 2003 BY CRC PRESS LLC
Biocide application, if required, may also require sampling to determine the airborne, residual,
and contact levels of the biocides. When pH-altering chemicals are used, sampling to determine
the persistence of the pH-altering chemicals may be needed.
Only experienced samplers should be assigned this type of work. Experience may be through
documented training with supervised on-site work (initially) or by virtue of education. All standard
operating procedures (SOPs) should be reviewed with the project team. If field conditions warrant,
the project team leader should make the decisions regarding any alteration in SOPs.
2.1.1 Regulatory and Industry Guidance Reviews
Because some states, including New York and California, now have or are developing regulatory
requirements or guidelines for certain biological agents, a regulatory review is appropriate. Other
state and local government agencies are rapidly developing acceptable criteria statements for indoor
air investigations, including those that involve biological contaminants.
2.1.2 Sampling Scope
Sampling for aerosolized biologicals usually should be done in coordination with surface contact
sampling. Photographs of investigative locations, sampling events, and incubated cultures may be
included in the report. The sampling report may include only interpretation of the sampling results,
with no conclusions as to required follow-up activities. Other reports include both the sampling
information and such conclusions as the need for decontamination, engineering analysis, or reha
-
bilitation of building areas. The scope of work must clearly define the ultimate report expectations
and the distinction between these report types.
2.2 HEALTH AND SAFETY PRECAUTIONS
In some cases a site safety and health plan similar to that required by 29 CFR 1910.120 will
be required. Uncontrolled biological risk agents are considered in the same way as uncontrolled
chemical risk agents. When dealing with biological risk agents for which limited information as
to human health risk is available, a risk assessment should be done incorporating all known human
health information needed to adequately communicate hazards to samplers and to the client.
2.3 DATA GATHERING
The following sample data gathering routines may be required prior to any sampling:
• Walk-through investigation. The objective of this investigation is to note the current building status.
• Interviews with affected parties (nonemployees). An example would be clients or visitors to
facilities.
• Employee interviews. Representative employees are made available for interview. These interviews
are conducted to gather information regarding the interior building conditions and subsequent
changes noted in the building interior environs. The company human resources office should
provide each employee with company program documents related to the interviews for information
gathering and release forms so that information gathered can be used in subsequent reports.
The purpose of these interviews is to gather historical information to compare with the current
building status.
© 2003 BY CRC PRESS LLC
2.3.1 Document Review
Examples of documents to be reviewed include those associated with water leakage events,
spill containment measures, maintenance activities, and employee complaints. This review will be
used to refine the study criteria and project expectations and to provide the discussion and conclusion
elements that address the impact of these occurrences given the current observed building status.
All available drawings, including as-built drawings and drawings that illustrate any renovation
activities, should be provided, preferably electronically as computer-aided design drawings
(CADDs), which can be generated in custom sizes. If paper copies are provided, half and quarter
sizes are usually preferred to full-size drawings, as the samplers can more easily carry these from
place to place during sampling efforts.
Maintenance records for the HVAC equipment, including those associated with cooling tower
usage, should be reviewed. Water treatment chemical usage and results of testing to determine the
effectiveness of this treatment should also be reviewed.
2.3.2 Sample Initial On-Site Investigation
The following is a sample statement of work for an investigation that will include interior air
spaces and the HVAC system:
An initial meeting at the XYZ plant will be held to familiarize proposed project staff with the plant
and processes. Company XYZ will provide plant escorts, who are authorized to provide access to all
building system locations that are to be assessed. The plant escorts will accompany the investigative
personnel.
In order to complete the initial investigation of the air handling units (AHUs), Company XYZ will
provide facility maintenance personnel, who will disassemble the access panels on each AHU. Fans
will be shut down and locked or tagged out by Company XYZ personnel. In the event that fans cannot
be shut down during first shift activities, Company XYZ’s facility maintenance personnel and the
investigative team will conduct the air handling investigations after shift two. All equipment will be
reassembled by Company XYZ personnel at the conclusion of the investigative effort for each air
handling unit. The current assumption is that fourteen (14) AHUs will be inspected.
Ductwork associated with the AHUs is accessible through panels at seven (7) locations. These panels
will be removed by Company XYZ facility maintenance personnel. All panels are located on the
vertical face of the ductwork; prior to the removal of these panels, a sheet of 6-mil polyethylene (poly)
will be placed by the contractor on the floor to receive these panels and any debris generated during
panel removal. This poly sheet will be bagged by the investigative team for subsequent sanitary
disposal by Company XYZ at the conclusion of the investigation for each ductwork area.
Flexible ductwork will be opened by removing the air outflow ceiling grids. Because these grids are
located on the horizontal lower face of the duct, removal may thus cause debris spillage in the nearby
area. The investigative team will position a poly sheet beneath each grid location, and the flexible
ductwork grid and faceplate will be lowered into a receiving 6-mil poly bag during disassembly.
Obviously soiled ductwork grids and faceplates will be cleaned or bagged for disposal and replaced
by Company XYZ personnel. The investigative team will collect all poly sheeting and bags for sanitary
disposal by Company XYZ.
Cooling water systems will be observed at the cooling tower rooftop locations, sump pump vaults,
and in the water treatment area. No purging of the system will occur during this investigative effort.
No valves will be opened in interior building locations. The investigative team will observe all system
components that contain waters; however, plumbing lines that run within wall or floor interiors will
not be examined. Current mechanical integrity will be determined based on visual evidence such as
© 2003 BY CRC PRESS LLC
the presence of leaks and status of plumbing line materials; however, mechanical integrity will not
be physically tested. All rooftop units are located in the center of a flat roof and no personnel will
be within six (6) feet of a roof edge at anytime.
Documentation of the current status of these systems will be shown on the inspection checklists. All
spaces to be entered have been evaluated as not being confined spaces or as no-permit-required
confined spaces. In the event that permit-required confined spaces are identified and entry is required,
the investigative team will initiate the protocols required by the Confined Space Program. These
protocols include informing Company XYZ of a changed condition and the initiation of contract
option one.
2.3.3 Sampling Areas
Air monitoring is accomplished in coordination with contact sampling, which may involve any
of the following:
• Collecting bulk samples
• Collecting water samples
• Swabbing surfaces
• Applying agar plates to surfaces
• Vacuuming of small areas
• Tape sampling
All contact sampling requires consistent sampling techniques and, ultimately, either microscopic
analysis or incubation of samples followed by microscopic analysis. Sampling events should
document the following areas:
• Outdoors
• Indoor control areas assumed to be uncontaminated and at safe levels
• Indoor areas where contamination is suspected and where decontamination is required
• Ventilation systems suspected of either exhausting or supplying contaminated air to the indoor area
• Downwind of negative, high-efficiency particulate air (HEPA) filtration units used to exhaust
decontamination areas
• Clean rooms used during decontamination for personnel decontamination access
Other areas may need to be sampled depending on the zoning of work and the activity in the
building. Samples may be collected for total viable and nonviable airborne components. Summa
canisters or sorbent tubes are used when microbe-produced volatiles are to be documented. Real-
time instrumentation for microbial volatiles is also available that measures volatiles in the parts-
per-billion range. Wall cavity checking may be required by probing and drawing air from wall
cavity spaces, infrared photography, and/or moisture metering.
2.4 RECORDKEEPING
The daily monitoring log should contain the following information for each sample:
• Sampling and analytical method used
• Date sample collected
• Sample number
•Sample type
• Location/activity/name where sample collected
© 2003 BY CRC PRESS LLC
For air samples:
• Sampling pump manufacturer, model, and serial number; beginning flow rate; end flow rate;
average flow rate (L/min)
• Calibration date, time, method, location, name of calibrator, signature
• Sample period (start time, stop time, elapsed time in minutes)
• Total air volume sampled (liters)
• Sample results
• Laboratory name, location, analytical method, analyst, and confidence level
• Printed name and a signature and date block for the industrial hygienist who conducted the sampling
and for the certified industrial hygienist who reviewed the daily air monitoring log verifying the
accuracy of the information
Sample results are time dependent. Thus, background sampling performed during a hot, humid
day will not be consistent with interior results collected later during a rainstorm. Seasonal and
climatic changes must be considered when comparing samples. The relative temperature and
humidity should be recorded for the days on which sampling occurred, particularly if successive
sampling days are required.
2.5 INDUSTRIAL HYGIENE MEASUREMENTS
In addition to the laboratory microscopy or incubation data, industrial hygiene measurements
may need to be considered, particularly in the interpretation of air samples. Many industrial hygiene
measurements are only understood in terms of ratios. The most common ratios are:
• Weight to weight
• Weight to volume
• Weight to area
To simplify matters, one (1) gravity is assumed and weight is commonly thought of as a measure
of mass. So, the weight-to-weight ratio is expressed as grams or pounds. For solids and liquids
that are assumed to be noncompressible, the weight-to-weight ratio makes sense. Gases are a state
of matter that is very compressible and expandable, so weight-to-volume measures must be used.
In order to standardize air measures, the temperature and pressure measurements may be
required. For normal temperature and pressure (NTP),
the temperature is defined as approximately
room temperature, 25°C (77°F). Industrial hygienists prefer NTP, while chemists prefer a cooler
version known as standard temperature pressure (STP) for which the temperature is 21°C (70°F).
Both NTP and STP use a pressure of one atmosphere, which is equivalent to 14.45 pounds per
square inch (psi). One atmosphere is also described as 760 mmHg, because one atmosphere will
push mercury up a barometer column 760 mm.
When measuring for biological risk, the following states and their measurement conventions
must be considered:
• Gases expressed as a relative percentage of each to the total gases or to each other
• Liquids suspended in gases, mists, and vapors
• Liquids in liquids, mixtures, and miscible solutions
• Solids suspended in gases, fibers, fumes, dusts, and particulates
• Solids in liquids, mixtures, and emulsions
• Solids in solids — adsorption or absorption to particulates and mixtures
© 2003 BY CRC PRESS LLC
Mists are smaller than vapors. Essentially, mists are tiny droplets of liquid riding on a cushion
of air. For solids in gases, various sizes of solids may ride on a cushion of air. Solids range in size,
from smallest to largest, as fumes, dusts, and particulates.
For both liquids and solids in air, weight-to-volume measurements are used, and the most
common units are milligrams per cubic meter (mg/m
3
). If we know the molecular weight of the
compounds of interest, we can convert mg/m
3
to parts per million (ppm), which is a weight-to-
weight ratio. In some cases, calculating the volume in a weight-to-volume measurement is not
possible. A good example of this is in wipe sampling. For wipe sampling, a standard area (usually
100 cm
2
) is wiped down. The contaminant from that area is suspended during analysis in a liquid.
So, for this liquid suspension, a weight-to-volume and a weight-to-weight ratio can be obtained;
however, this weight-to-volume ratio cannot be converted back to the original wipe sample con
-
taminant load as weight to volume, because the only known dimension for the wipe sample is
weight to area.
2.6 AEROSOLS
Sampling that involves air transmission vectors for biologicals is termed bioaerosol sampling.
Aerosol dynamics must be understood in order to plan the appropriate sampling types and locations.
The general properties of aerosols are presented in this section.
Aerosols are suspensions of solid or liquid particles in a gas (usually air). The particulate portion
of an aerosol is referred to as particulate matter (PM). Particulate matter is a generic term applied
to chemically heterogeneous discrete liquid droplets or solid particles. The size and electrostatic
properties of an aerosol may determine its residency time in an airstream and subsequent availability
for inhalation.
The metric unit used for describing PM is the micron or micrometer (µm; 1e
–6
meters). The
PM in an aerosol can range in size from 0.001 to > 100 µm in diameter. The following general
information about particulates and any variance from this information should be considered when
planning sampling routines:
• Visible particles constitute only about 10% of indoor air.
• Particle visibility depends on the eye itself — in other words, on the light intensity and quality,
as well as background and particle type.
• Particles on furniture and those in a shaft of light are approximately 50 µm or larger.
• Particles as small as 10 µm may be seen using normal vision under favorable conditions.
• Approximately 98 to 99% of all particles by count are in the size range of 5 µm or less. These
particles tend to remain in suspension or settle out so slowly that only quality electronic air cleaners
and HEPA air cleaners are effective in removing these particles.
• The majority of harmful particles are 3 µm or less in size.
• Particles of 1 µm or less adhere to surfaces by molecular adhesion. Scrubbing is generally the
only way to remove them.
• Larger particles tend to settle out of the atmosphere due to weight.
• Smaller, respirable particles remain virtually suspended in the air until breathed in.
• The average person breathes in about 16,000 quarts of air per day. Each quart contains some 70,000
visible and invisible particles. Thus, our lungs filter over a billion particles per day.
• The average home collects about 2 pounds of dust per week.
•A 9 × 12-ft carpet or rug will collect an average of about 10 pounds of dust per year.
2.6.1 Particulates
Particulates are generally categorized based on size:
© 2003 BY CRC PRESS LLC
• Coarse particles are > 2 µm in diameter.
• Fine particles are between 0.1 and 2 µm in diameter.
• Ultrafine particles are < 0.1 µm.
Most aerosol particles are polydisperse — they have a wide range of particle sizes that must
be characterized by statistical measures. In some cases, such as for an inkjet printer, it is desirable
to have a monodisperse aerosol with particles of equal size.
2.6.2 Solid-Particle Aerosols
Dust is formed by mechanical disintegration of a parent material; dust sizes range from less
than 1 µm to visible. A fume is produced by the condensation of vapors or gaseous combustion
products and are < 1 µm in size.
2.6.3 Liquid-Droplet Aerosols
Mist is formed by condensation or atomization; sizes range from < 1 µm to 20 µm. Fog is a
visible mist with a high particle concentration.
2.6.4 Solid/Liquid Particle Aerosols
Smoke is a visible aerosol resulting from incomplete combustion and is < 1 µm in size. Smog
is a photochemical reaction product, usually combined with water vapor, and is < 2 µm in size.
2.6.5 Suspended Particulate Matter
Suspended particulate matter (SPM) is a complex mixture of small and large particles of
varying origin and chemical composition. PM10 particles range in size up to 10 µm in diameter,
and PM2.5 particles range in size up to 2.5 µm in diameter. SPM varies in chemical composition,
as particles can be made up of many components, including sulfates, nitrates, elemental carbon,
organic compounds, metals, and soil dust. This variation in composition reflects the many sources
of SPM.
2.7 AIR SAMPLING: METHODS FOR GENERAL PARTICULATES
Sampling for particulates requires that the particulates be filtered out or removed from the air
stream by impaction (Figures 2.1 and 2.2).
Because particulates that are suspended in the air
stream come in many sizes, the first question is whether exposure standards are based on the
respirable fraction or the total particulate levels. Total particulates are often analyzed by gravi
-
metric methods.
2.7.1 Gravimetric Filter Weighing Procedure
The step-by-step procedure for weighing filters depends on the make and model of the balance.
Consult the manufacturer’s instruction book for directions. In addition, follow these guidelines:
• Smoking and/or eating must not take place in the weighing area; both generate extraneous partic-
ulate matter in the airstream.
• All filters are handled with tongs or tweezers; do not handle the filters with hands.
© 2003 BY CRC PRESS LLC
• Desiccate all filters at least 24 hours before weighing and sampling, and change desiccant before
the desiccant completely changes color (i.e., before the blue desiccant turns pink). Evacuate the
desiccator with a sampling or vacuum pump.
• Zero the balance prior to use.
• Calibrate the balance prior to use and after every 10 samples.
• Immediately prior to placement on the balance, pass all filters over an ionization unit to remove
static charges. (After 12 months of use, return the unit to the distributor for disposal.) When
weighing the filter after sampling, desiccate first and include any loose material from an overloaded
filter and cassette.
• Weigh all filters at least twice.
• If a difference of > 0.005 mg is found between the two weighings, zero the balance again,
recalibrate, and reweigh.
• If a difference of < 0.005 mg is found between the two weighings, average the weights for the
final weight.
Note: At all times take care not to exert downward pressure on the weighing pans, as such
action may damage the weighing mechanism. When reassembling the cassette assembly, remember
to add the unweighed backup pad. Record all the appropriate weighing information (in ink) in the
weighing log.
2.7.2 Total Dust
Various filtration options for collecting particulates are available. Sampling options are defined
based on the regulatory requirements and sampling environment. For example, one option is to
collect total dust on a preweighed, low-ash polyvinylchloride (PVC) filter at a flow rate of about
2 liters per minute (L/min), depending on the rate required to prevent overloading, as evidenced
by loose particulate in the filter cassette housing. The PVC filters are weighed
before an
d after
taking the sample. Personal sampling pumps must be calibrated before and after each day of
sampling using a bubble meter method (electronic or mechanical) or the
precision rotameter method
(calibrated against a bubble meter) (Figure 2.3).
Figure 2.1 Filter used for particulate collection.
(Courtesy of SKC, Inc., Eighty Four, PA.)
Figure 2.2 Filter used for particulate collection.
(Courtesy of SKC, Inc., Eighty Four, PA.)
© 2003 BY CRC PRESS LLC
Figure 2.3 Placement of dust monitoring equipment for personnel sampling.
Figure 2.4 Cyclone adaptation for collection of respi-
rable dust. (Courtesy of SKC, Inc., Eighty
Four, PA.)
Figure 2.5 Cyclone adaptation for collection of respi-
rable dust. (Courtesy of SKC, Inc., Eighty
Four, PA.)
© 2003 BY CRC PRESS LLC
2.7.3 Respirable and Inhalable Dust
Respirable dust is the component of particulate in the airstream that may deposit within the
gaseous exchange areas of the lung (see Figures 2.4 and 2.5). Respirable particles are just the right
size to travel with inspired air down into the alveoli of the lung. Once in the alveoli, these particles
may be a simple irritant or they may dissolve and provide chemicals in suspension with tissue
fluids. These suspended chemicals are then available to exert toxic and carcinogenic effects
(Figure
2.6).
Respirable dusts that do not go into solution pose another danger. These insoluble dusts and
particulates and the fibers associated with respirable dusts are easy to breathe in; they move with
ease deep into the lungs and once in the lungs may stay in the tissue bed forever.
For total particulate sampling results, usually the best guess is that 60% of the particles available
in the airstream are ultimately respirable. The cut point
for these particles is 50% at 4 µm, which
means that 50% of the 4 µm particles are captured. When health effect and exposure limits are based
on respirable dusts, either the 60% of total assumption must be made or special instrumentation must
be used to segregate out just the respirable fraction of total dust. Inhalable dusts include all of those
dusts from the general airstream that normal humans can bring into their respiratory tracts, which
includes everything from the nose to the base of the lungs.
Inhalable dusts have a 50% cut point of 100 µm. Special inhalable-dust samplers are used to
collect only inhalable dusts, and these samplers may vary as to the size of particulate collected.
Cyclones of various types (aluminum, plastic) are used to collect respirable dust factions. Plastic
cyclones are the only choice in acid gas-contaminated atmospheres. Respirable dust can be collected
using a clean cyclone equipped with a preweighed low-ash PVC filter with a flow rate of 1.5 to
1.9 L/min.
2.7.4 Silica Respirable Dust: Cyclone Collection
When sporulated bacteria are purposely disbursed, chemicals such as silica may be added to
facilitate the residence time of the bacteria spores in the air. Essentially the silica reduces the
clumping sometimes associated with sporulated bacteria. Silica and other minerals also enhance
the electrostatic neutrality necessary to potentiate airborne spore dispersal. Singular spores have
the right size and electrostatic properties to float in the air and are thus available as respirable
particulates. For these reasons, measurement of silica dust may be warranted as an indirect measure
of disbursed sporulated
bacteria.
Silica is collected only as a respirable dust. Aluminum cyclones are recommended to ensure
that the cyclone material does not interact or become part of the sample; silica at sufficient velocity
may etch a plastic cyclone. A bulk sample should also be submitted to provide a basis for comparing
silica levels in stock to ultimate respirable levels of dust. All filters used must be weighed before
and after sampling.
2.7.5 Direct-Reading Dust Monitors
Direct-reading dust monitors may be used to provide real-time data to predict room or area
particulate loading. These instruments may also be necessary to quantitate respirator effectiveness
and particulate loading in contained air spaces (such as those present within equipment housings),
and for particulate shedding and component tests.
2.7.5.1 Condensation Nuclei Counters
Condensation nuclei counters are based upon a miniature, continuous-flow condensation nucleus
counter that takes particles too small to be easily detected, enlarges them to a detectable size, and
© 2003 BY CRC PRESS LLC
counts them. Submicrometer particles are grown to supermicrometer alcohol droplets by first
saturating the particles with alcohol vapor. Particles in the sample pass through a saturator tube,
where alcohol evaporates into the sample stream. The sample flow becomes saturated with alcohol
vapor. The sample then passes into a cooled condenser tube, where the alcohol vapor supersaturates
and condenses onto virtually all particles larger than 10 nm in diameter. The resulting droplets exit
the condenser.
As the droplets pass through the sensing volume, the particles scatter the light. The light passes
through a thin ribbon of laser light. It is then collected by an optical system and focused by the
optical system. The scattered light is focused onto a photodetector or a photodiode, which generates
an electrical pulse from each droplet. The concentration of particles is determined by counting the
number of pulses generated. Individual airborne particles from sources such as smoke, dust, and
exhaust fumes are counted. These instruments are insensitive to variations in size, shape, compo
-
sition, and refractive index. The particle size and concentration range vary.
Isopropyl alcohol must be added to these units according to the manufacturer’s instructions.
Under normal conditions, a fully charged battery pack will last for about 5 hours of operation. Low
battery packs should be charged for at least 6 hours, and battery packs should not be stored in a
discharged condition.
2.7.5.2 Photodetection
Photodetectors operate on the principle of detecting scattered electromagnetic radiation in the
near infrared and can be used to monitor total and respirable particulates. These devices measure
the concentration of airborne particulates and aerosols, including dust, fumes, smoke, fog, and mist.
Certain instruments have been designed to satisfy the requirements for intrinsically safe operation
in methane–air mixtures. When the photodetector is not being operated, it is placed in the plastic
storage bag, which should then be closed to minimize particle contamination of the inner surfaces
of the sensing chamber.
After prolonged operation in or exposure to particulate-laden air, the interior walls and the two
glass windows of the sensing chamber may become contaminated with particles. Repeated updating
of the zero reference following the manufacturer’s procedure will correct errors resulting from such
particle accumulations; however, this contamination could affect the accuracy of the measurements
as a result of excessive spurious scattering and significant attenuation to the radiation passing
through the glass windows of the sensing chamber.
Figure 2.6 Schematic of lung areas. (Courtesy of SKC, Inc., Eight Four, PA.)
+
+
+
INHALABLE
THORACIC
RESPIRABLE
© 2003 BY CRC PRESS LLC
2.8 BIOLOGICALS: VIABLE VS. NONVIABLE
Mold spores are microscopic (2 to 10 µm) and are naturally present in both indoor and outdoor
air. Some molds have spores that are easily disturbed and waft into the air and settle repeatedly
with each disturbance. Other molds have sticky spores that will cling to surfaces and are dislodged
by brushing against them or by other direct contact. Spores may remain capable of producing
vegetative growth for years. In addition, whether or not the spores are alive, the allergens in and
on them may remain allergenic for years. Analysis is based on recognizing the synecological
assemblage of isolates consistent with the presence of indoor mold amplifiers. Locating and
examining any mold amplifiers not detected in preliminary inspection is a logical follow-up step
once sampling has revealed that these amplifiers are present.
2.9 MOLD SAMPLING: INDUSTRIAL HYGIENE PROTOCOLS
The following is a step-by-step procedure for mold sampling:
1. Assemble materials and equipment to be used. Segregate materials and equipment to be taken
inside the building or area of concern. Use impermeable plastic bags whenever possible to con-
tainerize materials and equipment to be taken into the building. Do not use cardboard or other
porous containers that cannot be readily decontaminated.
2. Mark each contact sample or strip agar blister pack with a unique sample number using a permanent
marker (for example, a Sharpie
®
pen). Allow the ink to air dry before placing the blister pack in
a plastic bag.
3. Use a large (quart or more), resealable, plastic freezer bag to package each contact sample or strip agar.
4. Assemble at least 10 of each type of sampling media in a large plastic bag. Package no more than
10 agar blister packs together for transfer to a contaminated area.
5. Assemble another bag to contain extra impermeable gloves (latex, 6-mil, or neoprene) and alcohol
wipes. Alcohol wipes can be purchased in individual packets or made on site using paper towels
and isopropyl alcohol. The alcohol-soaked paper towels are more effective for larger decontami
-
nation areas. Double bag all sources of alcohol and avoid direct alcohol contact with the agar
blister packs.
6. Establish a staging area and set up a decontamination area in a biologically neutral location away
from potential biological amplification sites.
Put on the personal protective equipment (PPE) in the following order:
1. First hooded Tyvek
®
2. Boots
3. First and second layer of gloves (double gloving is optional in some situations), followed by duct
taping boot and glove openings at the ankles and wrists (optional in some situations)
4. Respirator
5. Second hooded Tyvek
®
(optional in some situations)
Begin the sampling routine. Sample outside and in all assumed uncontaminated or amplified
areas first. Then sample into progressively more contaminated areas. Use the same protocols for
all sampling events, including the same pressure and motion when using contact plates and the
same walking routines or static placement when using dynamic sampling devices carried with you.
2.9.1 Direct Detection
Procedures for the direct detection of mold amplifiers may be used either after an air sample
has predicted the presence of amplifiers or as a preliminary survey. Common places where
© 2003 BY CRC PRESS LLC
significant amplifiers can be visually identified are on, in, or under water-damaged walls; wallpaper
or wallboard paper (whether painted over or not); backings of water-damaged carpets; HVAC
coils, pans, and vanes; damp papers; walk-in refrigerators and incubators; windowsills; shower
stalls; washroom fixtures; and moist organic materials, including any moist objects composed of
cellulose. Exposed insulation may be visibly discolored with mold, as may the inner or outer
surface of its covering paper. Paint, ceramic, grouting, or plastic may also support mold growth.
Tape, swab, contact, and grab samples may expose many normally settled elements that may
not be significantly present in the air. Dust samples may reveal a long-term fungal deposition and
negate air-current bioaerosol variability as seen in short-duration air samples.
2.9.2 Interior Wall Sampling
By making a small hole in wall planar surfaces or at baseboards, the interior wall area can be
investigated. An air-sampling pump can be used to draw the air toward filter cassettes or mini-can
Summa canisters.
2.9.3 Contact and Grab Sampling
The vial contact or specimen grab sampling routine (see Figure 2.7) typically is as follows:
1. Open the swab or contact plate blister pack over bag at first location to be sampled.
2. Sample mold by applying the contact plate to the area with gentle pressure or by swabbing.
(Note: Obtaining a small sample of contaminated building (or other) material may also be required.)
3. Place the mold-contaminated contact plate into the blister pack or into the swab vial.
4. Place sample into another plastic container (Ziplock
®
bag). Seal the bag.
5. Dispose of gloves if contaminated by direct contact or if the presence of pathogenic fungi is
suspected.
6. Place decontaminated gloves into a small waste bag.
7. Decontaminate any other tools used.
8. Decontaminate the outside of the sealed sample bag with alcohol wipes if it has been contaminated
by direct contact or if the presence of pathogenic fungi is
suspected.
Figure 2.7 Direct contact plates are momentarily applied to surfaces. (Courtesy of Biotest Diagnostic Corpo-
ration, Denville, NJ.)
© 2003 BY CRC PRESS LLC
2.9.4 Air Sampling: Bioaerosols
Air sampling is used to determine the bioaerosol type and concentration in the airstream of the
sampled area. Air sampling for fungi and total particulates is used to identify types of culturable
and nonculturable bioaerosols and bioaerosol concentrations. For direct air sampling, a designated
flow of air is used. The air is either drawn toward a vacuum pump through a filter or past a staging
assembly that may include impeller blades. When bioaerosols must be collected, extremely high
flow rates may be required. The rule in general is that sonic flow requires a 0.5-atmosphere pressure
drop. As with all pumps, the greater the pressure drop, the faster the intake of air toward that
pressure void area.
Air samples for fungi and total particulates are taken by using a high-flow pump calibrated at
a flow rate of 15 L/min and a collection time of 5 min for both room (ambient air) and outdoor
reference samples. A collection time of up to 2 min may be used for samples collected inside wall
cavities (e.g., WallChek
samples). The air samples are collected in a sterile manner, sealed, labeled,
and submitted to a microbiological laboratory for microbial identification. The laboratory uses
direct microscopic examination of the cassettes and/or growth media to identify the type and
concentration of culturable and nonculturable bioaerosols in the air. Any airborne fungi, as well as
any other airborne particulates (e.g., pollen, fibers, skin cell fragments, or insect parts) will be
collected during the sampling period.
Detecting general fungal materials such as chitin, glucan, and ergosterol may not allow dis-
crimination of fungal elements from indoor and outdoor sources. Interpretable single-case results
(as opposed to multi-case statistical trends) might be obtained only in cases where an extreme
indoor buildup has occurred or the indoor accumulation of outdoor fungal material is otherwise
known to be insignificant.
Air sampling is not appropriate for quantitative evaluation of Stachybotrys or certain other fungi
that are poorly culturable from airborne spores because in heavily contaminated environments the
sample may be overexposed, multiple spores may be counted as one after impaction, subsequent
colony overgrowth may occur, or correction factors may be needed. Reducing the sampling time
may result in correctly exposed media; however, results may be skewed if the sampling time effect
is not factored into the ultimate sampling report conclusions. Contact and liquid dip agar plates
are used to compare airborne levels to those present on surfaces or in liquid pools.
2.9.5 Example of Reuter Centrifugal Sampler (RCS) or SAS Sampling Sequence
RCS sampling routines are as follows (see Figures 2.8 and 2.9):
1. Open sample over a bag at first location to be sampled.
2. Insert agar strip or plate. Do not directly touch the agar media at any time. In the event that the
agar is touched, discard that agar
strip.
3. Sample for mold by running the instrument for the approved time duration.
4. Remove the agar. Do not directly touch the agar media at any time. In the event that the agar is
touched, discard that agar strip.
5. Place the agar into the original sample bag.
6. Seal the bag.
7. Dispose of gloves if contaminated by direct contact or if the presence of pathogenic fungi is
suspected.
8. Place decontaminated gloves into small waste bag.
9. Decontaminate the outside of sealed sample bag with alcohol wipes if contaminated by direct
contact or if the presence of pathogenic fungi is suspected.
10. Place the alcohol wipes into a small waste bag.
© 2003 BY CRC PRESS LLC
The sampling instruments, in some circumstances, may need to be decontaminated between
sampling events. In the field the impeller assembly can be cleaned with isopropyl alcohol and
thoroughly air-dried in a biologically neutral location. If further decontamination is required, it
should be done at the issuing laboratory. In some circumstances, pathogenic sleeves must be used.
Do not take the carrying case or battery charger into a contaminated environment. A remote control
is provided to initiate the sampling event. At the conclusion of a sampling event, at a minimum,
wipe down the sampling instrument’s exterior with alcohol wipes. Use equipment decontamination
pads to decontaminate temporary lighting and any other large equipment used. (Note: Lights are
turned off prior to decontamination; the last set of lights may be decontaminated using handheld
flashlights.)
2.9.6 Example of Exit Requirements
When exiting the area:
1. Place all used alcohol wipes into a small waste bag and seal the waste bag.
2. Exit area.
3. Decontaminate outer Tyvek
and respirator with alcohol wipes.
4. Remove outer Tyvek
.
5. Place used Tyvek
into a large waste bag.
6. Decontaminate inner Tyvek
, gloves, and boots.
7. Place decontaminated items into a waste bag.
8. Remove duct tape from wrists/ankles.
9. Remove boots, gloves, and Tyvek
.
10. Place used boots, gloves, and Tyvek
into a large waste bag.
11. Seal the large waste bag.
12. Decontaminate the respirator again prior to removal; place used alcohol wipes into a (new) small
waste bag.
13. Remove respirator.
14. Use alcohol wipes to decontaminate hands.
15. Place all used decontamination pads into a small waste bag.
16. Bag all disposable equipment and dispose of it in an appropriate manner.
17. Bag all nondisposable equipment for further decontamination off-site.
2.10 VOLATILE SCREENING
Volatile screening may be needed to determine levels of microbial volatile organic compounds
(mVOCs) or to monitor the biocides being used. For indoor air quality assessments, photoionization
Figure 2.8 SAS air sampler and viable impactor.
(Courtesy of Bioscience International,
Rockville, MD.)
Figure 2.9 Two versions of the RCS are available;
the newer version has digital air flow pro
-
gram capability.
© 2003 BY CRC PRESS LLC
detectors (PIDs) or adsorbent media followed by gas chromatography/mass spectroscopy (GC/MS)
lab analysis can be used to measure volatile organic compounds at low levels.
2.10.1 Photoionization Detectors
Time studies have repeatedly shown that in industrialized societies people spend very little time
outdoors. While it is dependent on a number of factors, the proportion of time spent outdoors is
often no more than 5%. The drive for greater HVAC efficiency has led to buildings that are sealed
more tightly than ever, so less fresh air is admitted to dilute any airborne contaminants. Because
people are spending upwards of 95% of their time inside sealed, high-efficiency buildings, com
-
plaints of sick building syndrome (SBS) are on the rise. According to the American Lung Associ-
ation, the top five indoor air pollutants are:
• Carbon monoxide
• Formaldehyde
• Microbial contaminants (mold spores)
• Second-hand tobacco smoke
• Volatile organic compounds
To limit occupant exposure to these compounds, sources must be identified and either eliminated
or controlled. A PID measures VOCs and other toxic gases in low concentrations from parts per
billion (ppb) up to 10,000 parts per million (ppm, or 1% by volume). A PID is a very sensitive
broad-spectrum monitor.
Photoionization detectors measure 0 to 10,000 ppm with resolution down to 1 ppb and therefore
are a very appropriate means of measuring VOCs (and other toxic gases and vapors) at extremely
low levels. The advantage of the PID is that, while it is not selective, it is a small, continuous
monitor that can provide instantaneous feedback (less than 3 seconds). This instant feedback is
critical because it provides users with the ability to deal with an indoor air quality problem instantly
rather than letting the problem build while waiting for laboratory results.
A PID uses an ultraviolet (UV) light source (photo, light) to break down chemicals to
positive and negative ions (ionization) that can easily be counted with a detector. Ionization
occurs when a molecule absorbs the high-energy UV light, which excites the molecule and
results in the temporary loss of a negatively charged electron and the formation of a positively
charged ion. The gas becomes electrically charged. In the detector, these charged particles
produce a current that is then amplified and displayed on the meter in parts per million or
even in parts per billion. The ions quickly recombine after exposure to the electrodes in the
detector to reform their original molecule. PIDs are not destructive; they do not burn or
permanently alter the sample gas.
All elements and chemicals can be ionized, but they differ in the amount of energy required.
The energy required to displace an electron and ionize a compound is called the ionization potential
(IP), which is measured in electron volts (eV). The light energy emitted by a UV lamp is also
measured in electron volts. If the IP of the sample gas is less than the electron-volt output of the
lamp, then the sample gas will be ionized
(Figure 2.10).
Photoionization detectors provide a direct means of detecting mVOCs. This makes PIDs an
excellent choice for both portable indoor air quality surveys and permanent IAQ subsystems of an
HVAC system. Recent advances in PID technology provide parts-per-billion resolution, thus pro
-
viding immediate insight and diagnostics that have never been possible before in indoor air quality
surveys. Innovations such as self-cleaning optics reduce long-term PID drift to a manageable level
and can provide the means for HVAC total volatile organic compound (tVOC) control used alone
or in an array of indoor air quality sensors (Figures 2.11 and 2.12).
© 2003 BY CRC PRESS LLC
2.10.2 Photoionizaton Detectors and Indoor Air Quality
Photoionization detectors provide a direct means of quickly assessing indoor air quality. The
urgency and complexity associated with sick building syndrome (SBS) have triggered a search for
a practical (time- and cost-effective) assessment method using tVOC levels as practical standards
(Godish, 1995). Such a total component concept has already gained acceptance in other health-
related disciplines, such as using total suspended particles (TSPs) and total decibels (TdBs) as
screening standards for particle and sound pollution, respectively. Pioneer work on using the tVOC
level as a practical overall standard is not complete (Seifert, 1990; Molhave, 1990) and require
further epidemiological research. Even so, measuring tVOCs is emerging as a more direct approach
of surveying indoor environments for contamination.
2.10.2.1 Total Volatile Organic Compounds
Preliminary data indicate that tVOCs are good indicators not only for traditional contaminants
(off-gassing products) but also for microbial actions (chemical releases from molds, fungi.). Recent
studies on the chemistry of VOCs in indoor air (secondary emission and reactive species) and the
effects of microbiological VOCs (Hess, 2001; Salthammer, 2000; Wolkhof, 2000) call for a need
for further research. Until complete understanding is reached, researchers (Hara, 2000; Salthammer,
2000; Seifert, 1999) are refining the tVOC approach as practical screening method for exposure
risk assessment to total VOCs in working and living environments.
2.10.2.2 General Guidelines
Isobutylene elicits a PID responsiveness about midpoint in the range of PID sensitivity; con-
sequently, isobutylene is typically used to calibrate the PID. Because PIDs are calibrated to
isobutylene, correction factors (CFs) are expressions of PID
sensitivity to a chemical relative to
isobutylene; EL
Chemical
is the exposure limit in chemical units (ppm). Unless otherwise indicated,
the EL is typically an 8-hour time-weighted average (TWA):
Figure 2.10 Photoionization detector lamp operation. (Courtesy of RAE Systems, Sunnyvale, CA.)
+
+
-
-
+
+
-
-
Sample out
Sample in
RAE
lamp
UV
Sensor
O-ring
Sample Flow
(X axis)
100.0 ppm
Gas enters the
instrument
It passes by
the UV lamp
It is now
“ionized”
Charged gas ions
flow to charged
plates in the
sensor and
current is produced
Current is measured
and concentration is
displayed on the
meter
+
+
-
-
+
+
-
-
+
+
-
-
+
+
-
-
+
+
-
-
An optical system using
ultraviolet lamp to breakdown
vapors and gases for
measurement
CF =
PID Isobutylene Response Concentration of gas (ppmv)
Conc. of isobutylene (ppmv) Response of gas on PID
EL
ELchemical (ppmv)
CF Chemical
Isobutylene
×
×
=
© 2003 BY CRC PRESS LLC
Thus, the exposure limit in units of isobutylene is the exposure limit in chemical units divided
by the ratio of chemical units to isobutylene units.
Global consensus has resulted in the emergence of preliminary guidelines for tVOC standards
for indoor air quality (Australian NHMRC, 1993; Finnish Society of Indoor Air Quality and
Climate, 1995; Hong Kong EPA, 1999; Japan Ministry of Health, 2000; Seifert, 1999). Depending
on location (home, school, workplace), recommended levels range from 200 to 1300 µg/m
3
, or
about 50 to 325 ppb toluene units, or approximately 100 to 650 ppb isobutylene units. The indoor
air quality tVOC threshold for normal environments should not exceed 500 ppb (0.5 ppm) toluene
units, which is equivalent to 1000 ppb (1 ppm) isobutylene units. Field experience suggests the
following guidelines for the use of PIDs to assess indoor environments:
• <100 ppb isobutylene units for normal outdoor air
• 100 to 400 ppb isobutylene units for normal indoor air
• 500+ ppb isobutylene units for potential indoor air quality contaminants
Figure 2.11 ppbRAE capable of continuous detection
down to 1 ppb for volatile organic com
-
pounds (VOCs). Comparator circuitry in
the sensor of the ppbRAE is used to zero-
out background VOCs. (Courtesy of RAE
Systems, Sunnyvale, CA.)
Figure 2.12 MultiRAE combines a PID with O
2
, LEL,
CO and other toxic sensors. (Courtesy of
RAE Systems, Sunnyvale, CA.)
© 2003 BY CRC PRESS LLC
2.10.2.3 Exposure vs. Time
Adsorptive tests may show that workers have been safe on average over an 8-hour day, yet
elevated levels of chemical may be missed by the averaging affects of adsorptive testing. For
example, consider an office building with a small print shop in the basement. During the winter,
the building manager decides to save money by decreasing the amount of outside fresh air introduced
into the HVAC system so that the air in the building is recirculated. Over the course of a work day,
the mold odors build up and reach high levels. Workers in the building do not smell the vapors
because these workers have grown accustomed to the odors through olfactory fatigue. Low solvent
exposure in the morning coupled with the high exposure in the afternoon provides an average
exposure that is acceptable; however, exposure vs. time data logging with a PID shows a trend of
VOCs being absent in the morning with high levels in the afternoon. By adding the morning
concentrations to the afternoon concentrations, adsorptive techniques missed this situation. If we
were to plot the time vs. exposure for adsorptive tests, a straight line for the 8-hour work day would
incorrectly indicate a static situation of little concern.
2.11 SUMMA CANISTER AND MINI-CAN
The Summa canister and mini-can can be preset to draw in a known volume of gas. The mini-
can is worn by a worker or placed in a static location. Sample collection occurs without the use
of an additional air-sampling pump. Another application is to use these devices during wall checking
to determine mVOC levels
(Figure 2.13).
2.12 ADSORBENT MEDIA FOLLOWED BY GC/MS LAB ANALYSIS
Various containers may be used to collect gases for later release into laboratory analytical
chambers or sorbent beds. The remote collection devices include bags, canisters, and evacuation
chambers. Remote collection refers to the practice of collecting the gas sample (intact chemically)
at a site remote from the laboratory, where analysis will occur. This method of sample collection
must always take into account the potential for the matter of the collecting vehicle to react with
the gaseous component collected during the time between collection and analysis. For this reason,
various plastic formulations and stainless steel compartments have been devised to assure that
reactions with the collected gases are minimized. When bags are used, the fittings for the bags to
the pumps must also be relatively inert and are usually stainless steel. Multiple bags may be collected
and then applied to a gas chromatograph column using multiple bag injector
systems.
Low-flow pumps are used to pull a sample through an adsorbent tube, or an evacuated stainless
steel cylinder draws in the air to be sampled to provide continuous monitoring over an entire
day or portion of day. These samples are sent to a laboratory. After analysis of these samples
with gas chromatography/mass spectroscopy (GC/MS) one can tell exactly what the average
concentration of chemical exposure was at the time the pump was used. To approximate the
concentration vs. the time of exposure, multiple tubes or cylinders must be run through the pump
during the working day. This leads to greater complication and cost. While these tubes and
cylinders may be specific, adsorbent tubes and cylinders are reactive rather than proactive. Results
can take days or weeks to return from the lab. Sampling followed by GC/MS testing is like a
35-mm camera. While they both produce excellent results, you must wait for the film to be
developed. In addition, laboratory analysis is expensive
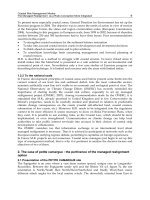
(Figure 2.14). In his study, Hara (2000)
found significant correlation between samples tested with a Tenax TA thermal desorption GC/MS
and a RAE Systems ppbRAE.
© 2003 BY CRC PRESS LLC
2.12.1 Solid Sorbent Tubes
Organic vapors and gases may be collected on activated charcoal, silica gel, or other adsorption
tubes using low-flow pumps. Tubes may be furnished with either caps or flame-sealed glass ends.
If using the capped version, simply uncap during the sampling period and recap at the end of the
sampling period. Multiple tubes can be collected using one pump. Flow regulation for each tube
is accomplished using critical orifices and valved regulation of airflow. Calibration of parallel or
multiple Y-connected tube drawing stations must be done individually for each tube even in cases
where the pump is drawing air through more than one tube in a parallel series. In instances where
tubes are connected in series, only one calibration draw is done through the conjoined tubes that
empty air directly into the other.
Sorbent tubes may be used simply to collect gases and vapors or to collect and react with the
collected chemicals. Some of the reactions may produce chemicals that, when off-gassed, could
harm the pumps being used to pull air through the sorbent media bed. In these cases, either filters
or intermediate traps must be used to protect the
pumps.
The following protocols should be followed:
• Immediately before sampling, break off the ends of the flame-sealed tube to provide an opening
approximately half the internal diameter of the tube. Take care when breaking these tubes, as
shattering may occur. A tube-breaking device that shields the sampler should be used.
• Wear eye protection when breaking ends.
• Use tube holders, if available, to minimize the hazards of broken glass.
• Do not use the charging inlet or the exhaust outlet of the pump to break the ends of the tubes.
• Use the smaller section of the tube as a back up and position it near the sampling pump.
• The tube should be held or attached in an approximately vertical position with the inlet either up
or down during sampling.
• Draw the air to be sampled directly into the inlet of the tube. This air is not to be passed through
any hose or tubing before entering the tube. A short length of protective tape, a tube holder, or a
short length of tubing should be placed on the cut tube end to protect the worker from the jagged
glass edges.
• Cap the tube with the supplied plastic caps immediately after sampling and seal as soon as possible.
• Do not ship with bulk material.
• For organic vapors and gases, low-flow pumps are required. With sorbent tubes, flow rates may
have to be lowered or smaller air volumes (half the maximum) used when humidity is high (above
90%) in the sampling area or relatively high concentrations of other organic vapors are present.
Figure 2.13 Mini-can Summa canister. (Courtesy of Aerotech Laboratories, Phoenix, AZ.)
© 2003 BY CRC PRESS LLC
2.12.2 Detector Tubes
Detector tubes and pumps are screening instruments which may be used to measure more than
200 organic and inorganic gases and vapors or for leak detection (Figure 2.15). Some aerosols can
also be measured. Detector tubes use the same media base (silica gel or activated charcoal) as do
many sorbent tubes. The difference is that the detector tubes change color in accordance with the
amount of chemical reaction occurring within the media base. The media base has been treated
with a chemical that effects a given color change when certain chemicals are introduced into the
tube and reside for a time in the media. The residence time for the reaction to occur and the volume
of air that must be drawn through the detector tubes varies with the chemical and anticipated
concentration. All detector tube manufacturers supply the directions for using their detector tubes
as an insert sheet with the tubes.
Detector tube pumps are portable equipment that, when used with a variety of commercially
available detector tubes, are capable of measuring the concentrations of a wide variety of compounds
in industrial atmospheres. Each pump should be leak-tested before use and calibrated for proper
volume at least quarterly or after 100
tubes.
Operation consists of using the pump to draw a known volume of air through a detector tube
designed to measure the concentration of the substance of interest. The concentration is then
determined by a colorimetric change of an indicator that is present in the tube contents. Detector
tubes of a given brand are to be used only with a pump of the same brand; the tubes are calibrated
specifically for the same brand of pump and may give erroneous results if used with a pump of
another brand.
A limitation of many detector tubes is the lack of specificity. Many indicators are not highly
selective and can cross-react with other compounds. Manufacturers’ manuals describe the effects
of interfering contaminants. Another important consideration is sampling time. Detector tubes give
only an instantaneous interpretation of environmental hazards. This may be beneficial in potentially
dangerous situations or when ceiling exposure determinations are sufficient. When long-term
assessment of occupational environments is necessary, short-term detector-tube measurements may
not reflect time-weighted average levels of the hazardous substances present.
Detector tubes normally have a shelf life of one to two years when stored at 25°C. Refrigeration
during storage lengthens the shelf life. Outdated detector tubes (i.e., beyond the printed expiration
Figure 2.14 Graph of volatile monitoring to parts-per-billion level. (Courtesy of RAE Systems, Sunnyvale, CA.)
house rooms
outdoors
office rooms
1000
500
0
0 500 1000 1500 2000 2500 3000 3500 4000
PID-ppb monitor (ppb)
absorbed on Tenax TA-GC/MS analysis (ppb)
y = 0.184 x + 43.2; r^2 = 0.870
© 2003 BY CRC PRESS LLC
date) should never be used. The specific tubes are designed to cover a concentration range that is
near the permissible exposure limit (PEL). Concentration ranges are tube dependent and can be
anywhere from 1 one-hundredth to several thousand ppm. The limits of detection depend on the
particular detector tube. Accuracy ranges vary with each detector tube. The pump may be handheld
during operation (weight, 8 to 11 ounces) or may be an automatic type (weight, about 4 pounds)
that collects a sample using a preset number of pump strokes. A full pump stroke for either type
of short-term pump has a volume of about 100 mL. In most cases, where only one pump stroke is
required, sampling time is about one minute. Determinations for which more pump strokes are
required take proportionately longer.
Multiple tubes can be used with newer microcapillary detector tube instruments. Computer
chips are programmed to draw preselected air volumes across these detector tubes. Levels are
measured based on changes in light absorption across the microcapillary tubes.
2.12.3 Colorimetric Sorbent Packed Tubes
A variation on the detector tube technology is the use of sorbent packed tubes that change color
in response to ambient airflow. The application of reactive adsorbing and/or absorbing chemicals
onto test strips is also used to provide a general indication of airborne contaminant levels. An
example is the ozone test strip used to monitor both outdoor and indoor ozone levels. Absorbent
tubes respond slowly to changes in concentration and can miss or grossly underestimate some
exposures. These transient exposures may affect people, but the slow response of adsorptive
sampling techniques, coupled with their averaging, could underestimate or miss the volatile off-
gassing. A PID can log these quick, high transient responses.
2.12.4 Vapor Badges
Passive-diffusion sorbent badges are useful for screening and monitoring certain chemical
exposures, especially vapors and gases. Badges are available from the laboratory to detect mercury,
nitrous oxide, ethylene oxide, and formaldehyde. Interfering substances should be noted. A variation
on the vapor badge is available as a dermal patch. These dermal patches can also be used in the
detection of semivolatiles such as pesticide residuals (Figure
2.16).
Figure 2.15 Detector tubes. (Courtesy of RAE Systems, Sunnyvale, CA.)
© 2003 BY CRC PRESS LLC
2.12.5 Formaldehyde
Formaldehyde sampling can be accomplished using both passive and active (use of a pump)
techniques (Figure 2.17). When long-duration sampling is required in indoor air investigations,
passive sampling tubes may be the method of choice. Vapor badges can be used to monitor personnel
exposures. Neither of these methods is recommended for acute exposure scenarios, as the sampling
media will quickly become overloaded. In acute exposure scenarios, sampling with a sorbent tube
attached to an air sampling pump or a detector tube attached to a pump/bellows is recommended.
Attachment implies that the pump will be used to draw a known volume of air quickly into the
media. This air will be at a concentration anticipated to provide information but below that which
would overload the
media.
Figure 2.16 Dermal patches may be used on skin, personal protective equipment, or equipment surfaces.
(Courtesy of SKC, Inc., Eighty Four, PA.)
Figure 2.17 Vapor badge. (Courtesy of SKC, Inc., Eighty Four, PA.)
© 2003 BY CRC PRESS LLC
2.13 PESTICIDES, POLYAROMATIC HYDROCARBONS,
AND POLYURETHANE FOAM
Both pesticides and polyaromatic hydrocarbons (PAHs) can be collected in polyurethane foam
(PUF) tubes (Figure 2.18). PUF tubes are available for both high- and low-volumes sampling. The
sampling volume requirement is determined by the regulatory requirements and the chemical
properties of the anticipated sample.
2.14 ACID GASES OR CAUSTICS
Volatile acid gases may be an inappropriate designation. Acid gases are often generated during a
reaction, and the latent volatility of the acid gas is really not the issue. In these cases, thermal
volatilization based on boiling point predictions and mechanical dispersion may be of less importance
than the rate of the reaction generating the acid gas or caustic. However, in addition to this reaction
phenomenon, acid gases such as chlorine are given off when the liquid solution is distributed around
an area. This is a classic case of the liquid–gas interface seeking an equilibrium. If air currents sweep
the generated gas concentration away from this equilibrium site, the liquid will again yield molecules
to the gas phase to achieve another equilibrium.
Acid gases and caustics, with their corrosive or caustic properties, can have health effects that
include both toxicological and physical acute manifestations such as watering eyes and respiratory
tract irritation. Because of these effects, sampling for acid gases and caustics must begin upon
approaching the area of concern. Sampling for acid gases and caustics may use all of the techniques
specified for any volatile. In addition, some acid gases and caustics are dispersed when precipitated
out or adsorbed onto particulates; therefore, particulate sampling techniques are applicable. The
reaction phenomena must always be considered during any sampling of acid gases or caustics. Any
real-time instrumentation with unprotected metal sensors, lamp filaments, or sensor housings will
often be rendered useless as the acid gases or caustics interact with the metals through reduc
-
tion–oxidation (RedOx) reactions.
2.14.1 Impingers
Impingers may be used to bring acid/caustic-laced particulates into solutions that are retained
within the impinger’s vessel. Vapors, mists, and gases may also be introduced into the impinger
Figure 2.18 High-volume polyurethane foam sam-
pler. (Courtesy of SKC, Inc., Eighty Four,
PA . )
Figure 2.19 Impinger (liquid media) attached to a
personal air sampling pump. (Courtesy
of SKC, Inc., Eighty Four, PA.)