Ultraviolet Light in Water and Wastewater Sanitation - Chapter 5 pps
Bạn đang xem bản rút gọn của tài liệu. Xem và tải ngay bản đầy đủ của tài liệu tại đây (319.02 KB, 13 trang )
© 2002 by CRC Press LLC
Use of Ultraviolet
Light for Sanitation
of Wastewater
Ultraviolet (UV) light is a valuable alternative for disinfection of treated wastewater,
because it forms no or very low levels of disinfection by-products. Among the negatives
of the method that have been considered is the potential reactivation of organisms after
exposure, whether or not in relation to shielding of organisms by suspended solids.
At present, no general rules exist for the necessary (high) UV doses that could promote
formation of by-products. Pilot investigations are advisable for each particular case.
The potential toxicity of the treated effluent must be evaluated.
In contrast with drinking water treatment, a wastewater method is better estab-
lished in the United States than in Europe. A survey made for the U.S. EPA [1986]
found more than 600 utilities using UV for disinfection of secondary effluent, with
the period of experience more than 20 years [Martin, 1994]. This development still
is in progress, with the growing importance of the issue of disinfection by-products,
but 1200 stations were mentioned to be in operation in the United States and Canada
in 1995 [Blatchley and Xie, 1995]. No clear report is available on the number of
European applications in wastewater treatment.
5.1 REGULATIONS AND GUIDELINES FOR
DISINFECTION OF TREATED WASTEWATER
Concerning wastewater reuse for the purpose of irrigation of crops, the World Health
Organization (WHO) recommends a maximum limit of 100 total coliforms per 100 mL,
in 80% of the samples collected at regular intervals.
The Council Directive of the European Union concerning urban wastewater
treatment (91/271/European Economic Community [EEC]) (O.J. 25-05-1991) does
not require specific disinfection of treated wastewater as it is discharged into the
environment. The member stated or the local authorities can lay down specific require-
ments as a function of reuse of treated water (recreation, shellfish culture, irrigation
of crops
…
).
The directive of the (European) council of December 8, 1975 lays down the
following bacteriological criteria for swimming water. They can be a good starting
5
© 2002 by CRC Press LLC
point to evaluate disinfected wastewater:
•
Total coliforms
—Guide number less than 500 per 100 mL for 80% of the
samples at a given site, and imperatively less than 10,000 per 100 mL for
95% of the determinations at a given sampling site
•
Fecal coliforms
—Guide number less than 100 per 100 mL for 80% of the
determinations and imperative criterion of less than 2000/100 mL for 95%
of the determinations
•
Fecal streptococci
—At least 90% of the samples in compliance with the
guide number of less than 100 per 100 mL
The directive is the basis of national regulations.
In France, general conditions of discharge and reuse of treated wastewater are
defined by the Décret 94-469 of June 3, 1994. For specific reuse, permits remain
case-dependent. For example, in the sea bathing station of Deauville, France, local
criteria applicable (using chlorine dioxide) for discharge of secondary effluent during
the summer period is less than 2000 total coliforms per 100 mL, with the effluent
discharged at 2 km into the sea [Masschelein, CEFIC, 1996].
Another example involves Dieppe, France: Requirements have been set (for 95%
of minimum 24 analyses) at total coliforms
<
10,000 per 100 mL, fecal coliforms
<
10,000 per 100 mL,
Streptococcus faecalis
<
1000 per 100 mL [Baron et al., 1999].
ATV [1993], for example, also gives some general national recommendations.
In South Africa, the standards applicable to treated sewage specify the absence of
fecal coliforms per 100 mL sample (see South African General and Special Standards
[1984]).
In the United States, requirements are formulated by the U.S. EPA Design Manual
on Municipal Wastewater Disinfection [Haas et al., 1986]. Again, the individual
states can set specific requirements. Typical examples are cited next.
California regulations according to Title 22, Division 4, Chapter 3 of the California
Code of Regulations follow:
• If used for spray irrigation of crops the median is less than 2.2 total coliforms
per 100 mL (maximum allowed exception: less than 23 per 100 mL once a
month) [Braunstein et al., 1994].
• The Contra Costa Sanitary District requires less than 240 total coliform
bacteria per 100 mL [Heath, 1999]. At other locations, the local permit for
total coliforms most probable network (MPN) is 23 per 100 mL as a
monthly median with an allowable daily maximum of 500 per 100 mL.
• Gold Bar Wastewater Treatment of secondary effluent permits less than
200 total coliforms per 100 mL; tertiary effluent, less than 2.2 (MPN)
total coliforms per 100 mL.
• Mt. View Sanitary District allows a 5-d median limit of 23 (MPN) total
coliforms per 100 mL with a wet weather maximum of 230 per 100 mL.
In Florida, State Rule 62-600.400 of the Florida Administrative Code permits
an annual average of less than 200 fecal coliforms per 100 mL, and no single sample
containing more than 800 per 100 mL. In Massachusetts, the standard for average
© 2002 by CRC Press LLC
fecal coliforms for swimming water is less than 200 per 100 mL; in open shellfish
areas, median total less than 70 per 100 mL (10% not exceeding 230 per 100 mL).
In Israel, the bacteriological criteria for reuse of treated wastewater in agriculture
(and related applications) have been reviewed extensively [Narkis et al., 1987]. On
the basis of 80% of the collected samples and per 100 mL, the limits for total coliforms
for irrigation are set as:
• Less than 250 for vegetables to be cooked, fruits, football fields, golf courses
• Less than 12 for unrestricted irrigation of crops
• Less than three for irrigation of public parks and lawn areas (in 50% of
the samples)
(In this context, the EEC Directive 75/440 on quality of surface water sources in-
tended to be treated to obtain drinking water, recommends the following for the lowest
quality allowable: total coliforms 500,000 per liter; fecal coliforms 200,000 per liter;
fecal streptococci 100,000 per liter. The AWWA recommendations [AWWA, 1968] are
less tolerant: total coliforms
<
200,000 per liter, fecal coliforms
<
100,000 per liter.
Most requirements in force concern enterobacteria (mostly coliforms). Counting
of fecal coliforms is sometimes considered as an extended test. Some alternative tests
have been considered, however, without general limits of tolerance. Proposed test
organisms are bacteriophage f-2 (or MS-2) [Braunstein, 1994], and poliovirus seeded
into the effluent [Tree, 1997].
Clostridium perfringens
spores were also taken as an
indicator for more resistent organisms (e.g., viruses) [Bission and Cabelli, 1980].
The estimated fecal coliform concentrations per 100 mL of undisinfected effluents
are as follows (according to U.S. EPA): primary effluent, 10
6
to 10
7
; secondary
effluent, 10
4
to 10
5
; and tertiary effluent, 10
3
to 10
5
.
Figure 99 is a photo of UV disinfection of wastewater at the wastewater treatment
plant at Gwinnett County, Georgia.
5.2 GENERAL CHARACTERISTICS OF EFFLUENTS
IN RELATION TO DISINFECTION
BY ULTRAVIOLET LIGHT
Dominant parameters to be considered are UV transmittance (UVT) and total sus-
pended solids (TSS). As for the UVT, the wavelength of 254 nm is generally
considered in the published articles. (This holds for the low-pressure Hg lamps;
appropriate correction factors apply in the use of other lamp technologies [e.g., by
the 5-nm histogram approach discussed earlier for drinking water disinfection].) The
percentage of transmission is expressed for a layer thickness of 1 cm, and in terms
of Beer–Lambert law on Log base 10 scale (sometimes not explicitly defined).
The unfiltered transmittance of a secondary-treated effluent is reported [Lodge
et al., 1994] to be in the range of 35 to 82% (average 60%). From other literature
sources, a range from 58 to 89% is observed and an average of 72% is probably
suited in design [Appleton et al., 1994]. Acceptance of a value of 69.5% (to be
© 2002 by CRC Press LLC
confirmed on-site) means an extinction value of
E
=
0.4 cm
−
1
and an absorbance
value of
A
=
0.15 cm
−
1
, which are generally the first approximation values considered.
Suspended particles can exert several effects on the application of UV:
• Increase of optical pathway by scattering [Masschelein et al., 1989]
• Shielding of microorganisms
• Occlusion of microorganisms into the suspended material
The turbidity of unfiltered urban wastewater usually ranges between 1.5 and 6 units
nephelometric turbidity units (NTU), but sudden surges can occur during run-off
periods. The values for filtered wastewater range between 1 and 2 units (NTU). For
wastewater, no general correlation exists between turbidity and suspended solids
[Rudolph et al., 1994].
In domestic wastewater, the instant concentration of suspended solids usually is
in the range of 600 to 900 g/m
3
. After 1-h static settling, it is in the range of 400 to
600 g/m
3
(again, surges can occur, e.g., in the Brussels area up to 1000 g/m
3
).
Globally, in urban sewage one can estimate the total suspended solids by 600 g/m
3
on an average basis. About two-thirds are settleable (1 h). Of the remaining (average)
200 g/m
3
, about two-thirds are organic and one-third is mineral suspended solids.
Suspended solids in untreated wastewater usually present a bimodel distribution
(Figure 100) with a maximum for particle diameters of submicron size and another
maximum at 30 to 40
m
m. With membrane filtration (1-
m
m pore size), the first
maximum remains practically unchanged, whereas the second is lowered, however,
FIGURE 99
Disinfection of wastewater at Gwinnett County, Georgia. Total flow
=
1580 m
3
/h,
T
10
=
74%. Each of four reactors is equipped with 16 medium-pressure lamps.
© 2002 by CRC Press LLC
FIGURE 100
(a) Particle size distribution in secondary effluents; (b) effect of turbidity on
the required dose (1, without prefiltration; 2, after prefiltration).
0
1
2
3
4
5
6
−0.50 0.00 0.50 1.00 1.50 2.00
Volumetric distribution of particles ∆V/∆ log dp
log dp (dp in µm)
Curve 1: without prefiltration
Curve 2: after prefiltration
(= change)
Curve 2
Curve 1 = 2
(no change by
prefiltration)
for <1 µm
Curve 1
(a)
(b)
0
200
400
600
800
1000
1200
1400
1600
123456789
Dose J/m
2
NTU
“flocculated”
(not “settled”)
wastewater
“Settled”
wastewater
Clarified
surface water
Potable water
© 2002 by CRC Press LLC
not completely removed. With intense mechanical mixing (estimated velocity gradient,
G
=
≥
1000 sec
−
1
) or ultrasonication, the large particle size material (1.5
−
1.6
m
m)
of the initial bimodel distribution can be partially destroyed as well as agglomerated
to develop a trimodal distribution with secondary maxima at d
b
at 0.1 to 0.2, 0.8 to
0.9, and 1.4 to 1.7
m
m. This point might be important in laboratory experiments.
More literature on particle-associated coliforms has been reported extensively by
Parker and Darby [1994].
Overall, according to the data of Geesey and Costerson [1984], 76% of the bacteria
are free-swimming and 24% are particle-associated. It is also reported that fecal
bacteria adsorbed on sediments [Roper and Marshall, 1978], are more resistant to
aggressions than free-swimming bacteria (e.g., irradiation by sunlight). Particle-
associated bacteria are mostly found on suspended solids of particle diameter size
larger than 10
m
m [Ridgway and Olson, 1981, 1982].
It is not easy to establish a clear difference between adsorbed microorganisms,
shielded microorganisms, and embedded microorganisms. A recommended proce-
dure as published by Parker and Darby [1994] follows:
• Blend the sample (either wastewater or made-up sample) with an ampho-
teric detergent (e.g., Zwittergent) to make the concentration 10
−
6
M
.
• Add a complexing agent (e.g., ethylenediaminetetraacetic acid [EDTA])
to make the sample at 3 to 12
×
10
−
3
M
.
• Make it 0.01% (wt) in
tris
-peptone buffer.
• Adjust to pH 7 by phosphate buffering.
• Stir, operating at 19,000 r/min (about 320 r/sec) for 5 to 17 min. (The
description is too vague to define a strict velocity gradient for the mixing
conditions. From general methods of evaluation [Masschelein, 1991, 1996],
the velocity gradient must have been higher than 5000 sec
−
1
.) Under such
conditions of mechanical mixing, an apparent increase in total coliform
counts by a factor of 4.0 to 7.7 could be observed. This means that the app-
arent direct numeration in the raw water can be a considerable underestima-
tion of the total number if no vigorous agitation is applied on sampling.
Under static conditions (i.e., without mechanical mixing but by dosing the blending
solutions only in static conditions) no significant apparent increase in counts of total
coliforms was observed.
5.3 AFTERGROWTH AND PHOTOREPAIR AFTER
EXPOSURE TO ULTRAVIOLET DISINFECTION
OF WASTEWATER
It is difficult to distinguish between aftergrowth and photorepair in treated waste-
water. In the first case, residual undamaged bacteria develop in the wastewater, which
remains a nutrient medium. In the second case the schematic is as described in
Chapter 3.
Note:
In experimental work using artificial irradiation to promote photorepair,
the mechanism is most often termed
photoreactivation
.
© 2002 by CRC Press LLC
The generally proposed hypothesis is that a photoreactivating enzyme forms a
complex with the pyrimidine dimer, the latter complex subject to photolysis by UV-
A photons and restoring the original monomer as reported [Lindenauer and Darby,
1994; Harm, 1980; Jagger, 1967]. Visible light from UV up to 490 nm is also reported
as able to promote photorepair. In other interpretations, enzymatic repair is consid-
ered to be possible in the dark [Whitby et al., 1984].
Many organisms have been found able to photorepair UV-damaged DNA, includ-
ing total and fecal coliforms,
Streptococcus feacalis, Streptomyces, Saccharomyces,
Aerobacter, Micrococcus, Erwinia, Proteus, Penicillium
, and
Neurospora
. On the
other hand, some organisms have been reported not to be subject to photorepair:
Pseudomonas aeruginosa, Clostridium perfringens, Haemophilus influenzae,
Dipli-
coccus pneumoniae,
Bacillus subtilis
,
and
Micrococcus radiodurans
. Literature is
extensively reviewed by Lindenauer and Darby [1994].
There are several ways to quantify the photorepair:
N
=
concentration of organisms surviving UV disinfection
N
o
=
concentration of organisms prior to UV disinfection
N
pr
=
concentration of organisms after photorepair
Kelner [1951] defines the degree of photorepair by (
N
pr
−
N
)/(
N
o
−
N
). To evaluate
the possible photorepair in wastewater treated by UV-C, a log-increase
approximation
is more often used:
log(
N
pr
/
N
o
)
−
log(
N
/
N
o
)
=
Log[(
N
pr
/
N
o
)
/
(
N
/
N
o
)]
=
log(
N
pr
/
N
)
According to literature, photoreactivation (in the log expression) could range
between 1 and 3.4. However, photorepair and photoreactivation are related to the
initial UV-C disinfecting dose. If the disinfecting UV dose is not sufficiently high,
repair is greater. In the log approximation, no clear relation between the initial UV
disinfecting dose and the yield of repair is obvious. By analyzing the data and
expressing them in terms of degree of photorepair, however, a clear correlation is
obtained (Figure 101).
No reported standardized testing procedures exist for evaluating photorepair
or photoreactivating in water treatment. The use of white-light sources has been
described by Lindenauer and Darby [1994] (e.g., a 40-W Vitalight source was used
[Durolight Corp.]), placed at 75 cm over a layer of 1 cm of wastewater. The exposure
was estimated at the exposure of 1 h sunlight at 12 noon (in the Californian sky).
The present conclusions on photorepair include:
• In wastewater disinfection by UV, a more careful analysis indicates that
the photorepair is related to the UV exposure dose for disinfection,
although in some publications, no relation between disinfection exposure
dose and potential photorepair has been claimed.
• In practical conditions, the apparent regrowth as counted could also result
from embedded organisms in the suspended solids.
• As indicated, some organisms are more subject to repair than others.
© 2002 by CRC Press LLC
• Indications exist that germs in nitrified effluents are more able to photo-
repair than germs in unnitrified effluents.
• Practically all investigations concern the effects of low-pressure Hg lamps
on DNA. In case of more general cellular destruction, probably occurring
with high-intensity, medium-pressure Hg lamps, repair is less probable
and not merely confined to DNA alone (see also Chapter 3, Section 3.2.3).
5.4 APPLIED ULTRAVIOLET DOSES IN WASTEWATER
DISINFECTION
Most reported experiences thus far concern low-pressure Hg lamps, but the appli-
cation of multiwave medium-pressure lamps is on the move. Because wastewaters
are not constant in characteristics, the general recommendation is to make a sufficient
pilot plant evaluation. Generally proposed exposure doses are 1000 to 1700 J/m
2
for
general secondary effluent and 3000 J/m
2
for a nitrified effluent [Heath, 1999;
Braunstein, 1994; Te Kippe et al., 1994]. The precise exposure doses are often not
reported in a way that could allow generalizations. Some empiricism (or commer-
cially restricted communication of know-how) remains in published information.
The permanent control of the doses still relies on relative indications of a detector
(generally a photocell), which also needs periodic calibration.
Besides the general quality of the wastewater, the necessary dose depends on
the required level of organisms authorized by regulations, and the type of steering
organism selected; and also in all this context, it must be remembered that the linear
decay law usually applies only at high initial concentration of germs in the effluent.
A tail-off occurs in the decay, as illustrated in Figure 102(a) and (b).
FIGURE 101
Photorepair after 1 h exposure to sunlight 40 W (total) on 1-cm thickness
(based on data recalculated from measurements of Harris et al. [1987]).
E. coli
S. fecalis
0
2
4
6
8
10
12
14
16
200 400 600 800 1000 1200 1400
Dose UV J/m
2
log (N
pr
− N)/(N
o
− N)
© 2002 by CRC Press LLC
FIGURE 102
Example of fecal coliform abatement as a function of UV dose (medium-
pressure Hg lamp). y1
=
UV followed by solar illumination; y2
=
solar illumination followed
by UV. (a) Upper curves: nonnitrified, nonfiltered secondary effluent; (b) lower curves:
nitrified, nonfiltered secondary effluent.
500
−6
−5
−4
−3
−2
−1
0
600 700 800 900 1000 1100 1200
Log N/N
o
Dose J/m
2
y1
y2
0
−4.5
−4
−3.5
−3
−2.5
−2
−1.5
−1
−0.5
0
500 1000 1500 2000 2500 3000 3500
Log N/N
o
Dose J/m
2
y1
y2
(a)
(b)
© 2002 by CRC Press LLC
An empirical design model has been proposed as follows by Appleton et al.
[1994]:
N
=
(
f
)D
n
where
N
=
bacterial concentration
D
=
active UV dose
f
and
n
=
empirical coefficients
The dose is estimated to be the average germicidal UV intensity (
I
)
×
irradiation
time. The water quality factor
f
is approached by
f
=
A
×
(TSS)
a
×
(UVT)
b
, where
A
,
a, and b are again empirical coefficients.
The whole is combined in an empirical model in which e is the random error
of the model:
logN = log A + a log(TSS) + b log(UVT) + n log I + n logt + (e)
As for the average germicidal UV intensity again, an empirical binomial approach
is considered:
I = −3.7978 + 0.36927 (UVT) − 0.0072942 (UVT)
2
+ 0.0000631 (UVT)
3
in which UVT is the UV transmittance in percentage of the unfiltered effluent. This
approach was obtained for the Discovery Bay WWTP, California. It is not entirely
established yet to what extent it can be of general value. However, the whole
approach, based on the requirements for admissible limits for N and historical
knowledge of TSS and UVT, ends in the choice of values for N and t.
The general structure of the method gives satisfactory results as reported; how-
ever, the essential parameters of the model can remain case-dependent. For the rest
of design remaining determinants include hydraulic conditions, quality standards to
be met and lamp technologies, intensity vs. irradiation time [Zukovs et al., 1986],
maintenance, and performance control.
Numerous publications report on the installation of the lamps in the longitudinal
mode (i.e., horizontal length in the same direction of the water flow [see Baron et al.,
1999]), in the vertical mode (i.e., lamps up-down in the water flow [see Chu-Fei, H.
Ho et al., 1994]). For low-pressure Hg lamps, these options appear not to be determi-
nant in terms of efficiency. The choice parameters are related to both preexisting
hardware to be retrofitted and general facilities for maintenance.
The Morrill index in comparable arrangements is about the same: between 1.15
and 1.35 in existing reactors [Blatchley et al., 1994]. The aspect ratio is usually
higher in the horizontal lamp arrangement than in the vertical one. The aspect ratio
A
R
is defined by the following relation [Soroushian et al., 1994]:
A
R
= X/L = X/4R
H
= (X × A
W
)/4V
v
where
X = length of the reactor-contact basin into the direction of water flow
L = cross section of the UV lamps module perpendicular to the water flow (L = 4R
H
)
© 2002 by CRC Press LLC
R
H
= hydraulic radius = (V
v
/A
w
)
V
v
= net wetted volume that contains the lamps
A
w
= total wetted horizontal surface of the module that contains the lamps
In existing plants with low-pressure Hg lamp technologies, the aspect ratio
generally is between 15 and 40. The higher the value of A
R
, the closer plug-flow
conditions are approached. It is important to consider this parameter in designing
pilot experiments, particularly for retrofitting plants in which existing basins will be
used to install UV units for disinfection.
For high UV emission intensity technologies such as medium-pressure lamps,
installation of the lamps in the vertical or traverse mode orthogonal to the water flow
is preferred, both for facility of maintenance and for compact hardware. Mixing
conditions and intensity distribution patterns are illustrated in Chapter 3 (Figures 80,
81, 82).
5.5 CHOICE OF LAMP TECHNOLOGY
IN WASTEWATER DISINFECTION
In wastewater treatment, most present and existing applications are based on low-
pressure lamp technologies. These are a result of historical factors related to tech-
nologies available at the time. From investigations [Kwan, 1994], medium-pressure
high emission intensity systems can be more economical than the more conventional
low-pressure lamp systems in both capital investment and lifetime costs (see also
Soroushian [1994]). The number of plants making use of medium-pressure lamps
is increasing rapidly. Until now, the use of excimer lamps and pulsed Xenon lamps
in the field of wastewater disinfection remains experimental (e.g., for disinfection
of agricultural wastewater [Hunter et al., 1998]).
A rule of thumb is to install 40 to 60 low-pressure lamps per 150 m
3
/h of
wastewater with an electrical power requirement of 65 to 80 W each. The electrical
cost thus amounts to about 17 to 32 W/m
3
. In some advanced installations, it can
go up to nearly one lamp of 65 W(e)/m
3
/h [Baron et al., 1999]. Low-pressure mercury
lamps used in this application usually have a length between 1.2 and 1.5 m.
Note: Low-pressure mercury lamps operate only on an all-or-nothing on–off basis
vs. the nominal emission capacity.
As described before, the output of medium-pressure lamps currently can be
monitored between 60 and 100% of nominal emission capacity. This makes them
attractive for treatment of variable water flows.
As for drinking water treatment, the lamps are installed in a quartz enclosure,
which usually is mechanically cleaned with a to-and-fro wiper operated continuously
or in an automated mode actioned as a function of a drop in light intensity as
continuously measured.
Note: In the case of wastewater it is also necessary to clean the photocells and
occasionally to recalibrate the system.
© 2002 by CRC Press LLC
This mechanical cleaning procedure is more complex in the case of low-pressure
Hg lamps, so that chemicals usually are required. A general cleaning procedure is
to remove the lamps + enclosures per entire modules of several lamps and to dip
them into an acid solution. The generally recommended solution is composed of
phosphoric acid at 10% by weight. Air bubbling can accelerate the procedure.
An alternative is to use 10% citric acid and a water spray, although the latter
method has been reported to fail in some cases [Chu-Fei, H. Ho et al., 1994]. Detergents
can be associated in the cleaning mixture and alternatives are also vinegar or ammonia
[Martin, 1994]. In all cases, washing with a clear water bath or spray is recommended
at the end of the procedure. Cleaning of the window of the photocells usually needs
an additional mechanical brushing (softly, however, so as not to damage the window
material). Calibration of the cell after cleaning the window is required.
5.6 TOXICITY AND FORMATION OF BY-PRODUCTS
At the UV doses applied for wastewater disinfection (with some exceptions), pre-
existing potentially toxic compounds are not significantly removed. For synergistic
technologies, see Chapter 4.
Formation of aldehydes has been observed both with low-pressure lamps [Awad
et al., 1993] and medium-pressure lamps [Soroushian et al., 1994]. In summary, at
irradiation doses of 1000 and 2000 J/m
2
:
• Volatile and semivolatile compounds (EPA 8270) such as chloroform and
other chlorinated by-products, 2-hexanone at parts per billion levels are
removed by the general treatment without evidence of impact of UV.
• Carboxylic acids (acetic, formic, oxalic, haloacetic acids) at subparts per
billion levels are unchanged with UV.
• Aldehydes (formaldehyde, acetaldehyde, glyoxal, m-glyoxal) are poten-
tially formed at parts per billion levels.
• Alcohols (butanol, pentanol) are nondetectable in the UV-treated effluent.
• Propanol and substituted propanols—2-(2-hydroxypropoxy)-1-propanol,
1-(2-ethoxypropoxy)-2-propanol, 1-(2-methoxypropoxy)-1-propanol—at
parts per billion levels appear unchanged at the preceding UV irradiation
doses.
Toxicity to fish of UV-treated wastewater tested both in laboratory and at full
scale did not show any additional toxicity vs. that of the effluent before UV treatment
[Cairns and Conn, 1979; Oliver and Carey, 1976; Whitby et al., 1984].
5.7 PRELIMINARY CONCLUSIONS ON WASTEWATER
DISINFECTION WITH ULTRAVIOLET
1. UV light technologies certainly are a valuable alternative for the disin-
fection of conventionally treated wastewater.
2. A wide choice of alternatives exists for lamp technologies and reactor
designs.
© 2002 by CRC Press LLC
3. Due to the variability of wastewater, an inventory of essential properties
(at least bacterial counts in the effluent, TSS, and UVT, but also temper-
ature, pH, etc.) is required to define design concepts.
4. Targets to be reached are also very variable as a function of local regu-
lations. Therefore, targets must be clearly defined at a stage preceding the
design.
5. When possible and for reaching particular targets, a pilot investigation is
recommended.
6. How UV units can be installed in retrofitting of preexisting basins is
described in a very documented way.
7. At conventional doses for disinfection, the formation of by-products is
very marginal and no additional toxicity for fish life has been reported.
8. Elimination of preexisting potentially toxic compounds, in particular efflu-
ents (see Chapter 4), may need a point-of-use evaluation.
5.8 EXAMPLE
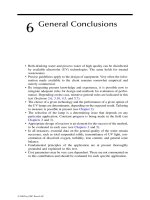
Figure 103 shows the UV installation at the Newcastle, Indiana wastewater treatment
plant.
FIGURE 103 Plant at Newcastle, Indiana. This plant (designed by Berson) can treat 1570 m
3
/h
of a treated effluent with a transmittance of T
10%
of 60. Two chambers are each equipped by
24 lamps mounted in the transverse mode. The equipment has been installed in preexisting
buildings.