LANDSCAPE ECOLOGY in AGROECOSYSTEMS MANAGEMENT - CHAPTER 5 pdf
Bạn đang xem bản rút gọn của tài liệu. Xem và tải ngay bản đầy đủ của tài liệu tại đây (468.85 KB, 33 trang )
CHAPTER
5
Control of Diffuse Pollution by Mid-Field
Shelterbelts and Meadow Strips
Lech Ryszkowski, Lech Szajdak, Alina Bartoszewicz,
and Irena yczy ska-Ba oniak
CONTENTS
Introduction
Environment of the Turew Agricultural Landscape
Nitrogen Compounds in the Drainage System of the Turew Landscape
Control of Mineral Nitrogen Pollution by Shelterbelts and Meadows
Processing of Mineral Nitrogen in the Biogeochemical Barriers
Landscape Management Guidelines for Efficient Control of Nitrogen
Pollution
Prospects for Control of the Diffusion Pollution through Management of
Landscape Structure
References
INTRODUCTION
Water quality is one of the fundamental requisites for sustainable development
of agriculture, and it constitutes the survival determinant of rich plant and animal
assemblages. Interactions among physical, chemical, and biological processes char-
acteristic of a watershed determine discharged water quality; alteration of any one
of these processes will affect one or more water quality properties. This fact was
recently learned by scientists and the public when growing problems of water
contamination were unsuccessfully tackled with only technical measures (water
purification plants). Activities aiming at water pollution control in the 1970s and up
to the mid-1980s focused on treating urban and industrial sewage effluents — that
·
Z
´
nl
0919 ch05 frame Page 111 Tuesday, November 20, 2001 6:25 PM
© 2002 by CRC Press LLC
is, on the control of point sources of pollution by construction of water purification
plants (Vollenweider 1968). Success was achieved in some reservoirs, such as Lake
Constance, but eutrophication problems could not be totally eliminated, and, in
addition, such problems started to appear even in water bodies located far away from
point sources of pollution (Halberg 1989, Kauppi 1990).
As agricultural production intensified, land-use changes caused by agriculture
became more apparent. Enlargement of farm sizes was linked to more efficient use
of machines, which decreased costs of the cultivation of large fields not segmented
by shelterbelts (mid-field rows of trees), open drainage ditches, and other obstacles
to fast and powerful agricultural equipment. This trend of agricultural development
resulted in homogenizing the countryside structure. For example, in France the
average farm size increased from 19 to 28 ha in the period from 1970 to 1990. In
the same time span, the average farm size in the U.K. increased from 54 to 68 ha,
in West Germany from 13 to 18 ha, and in Belgium from 8 to 15 ha (Stanners and
Bourdeau 1995). Consolidation and expansion of cultivated fields led to eradication
of field margins, hedges, shelterbelts, small mid-field ponds or wetlands, and other
nonproductive elements of the landscape. Thus, for example, 22% of hedgerows in
the U.K. were eliminated by the mid-1980s (Mannion 1995). The disappearance rate
of wetlands in the European Union, excluding Portugal, has amounted to 0.5%
annually since 1973 (Baldock 1990). In Denmark, 27% of small water reservoirs
disappeared from 1954 to 1984 (Bülow-Olsen 1988).
By intensifying production, farmers interfere with patterns of element cycling
in landscapes using fertilizers and pesticides, and they are changing water regimes
by drainage or irrigation. Feedback of the agricultural measures of production as
well as induced changes in land use brought environmental problems, such as
impoverishment of biological diversity or nonpoint (diffuse) water pollution. In the
1980s, it was recognized that control of point sources of pollution could not alone
solve the problems of water quality. The water pollution, especially with nitrates,
was detected in streams or lakes located far from urban or industrial point sources
(Omernik et al. 1981, OECD 1986, Halberg 1989, Ryszkowski 1992). The diffuse
water pollution problems were recognized worldwide in the 1990s.
Nonpoint water pollution is attributed to human-induced, above-natural-rate
inputs of chemical compounds into subsurface and surface water reservoirs. At
present, agriculture is undoubtedly the main reason for diffuse pollution problems
(OECD 1986, Rekolainen 1989, Kauppi 1990, Ryszkowski 1992, Flaig and Mohr
1996, Johnsson and Hoffmann 1998). High concentrations of nitrates exceeding
50 mg per liter of soil solution were detected in Germany, northern France, eastern
England, northwestern Spain, northern Italy, and Austria. Very high nitrate concen-
trations were detected in Denmark, the Netherlands, and Belgium (Stanners and
Bourdeau 1995). So, at the beginning of the 1990s, it appeared that modern intensive
agriculture practices were threats to the environment and that the Common Agri-
cultural Policy (CAP) of the European Union should be changed by introduction of
more environmentally friendly technologies (Stern 1996).
Simultaneous with growing concerns about diffuse pollution were studies show-
ing that permanently vegetated land strips could control inputs of chemicals from
cultivated fields to waterbodies (Pauliukevicius 1981, Lowrance et al. 1983, Peterjohn
0919 ch05 frame Page 112 Wednesday, November 21, 2001 1:50 PM
© 2002 by CRC Press LLC
and Correll 1984, Pinay and Decamps 1988, Ryszkowski and Bartoszewicz 1989,
Muscutt et al. 1993, Hillbricht-Ilkowska et al. 1995, and others). The majority of
the studies concerned riparian plant buffer zones and their efficiency for the control
of diffuse pollution. A thorough review of the riparian-strip functions for controlling
diffuse pollution, both via surface and subsurface fluxes, published by Correll (1997)
in proceedings of the 1996 buffer zone symposium, provides a review of studies on
various aspects of diffuse pollution control (Haycock et al. 1997). A recent book
edited by Thornton et al. (1999) addresses primarily the nonpoint pollution impacts
on lakes and reservoirs, stressing the practical aspects of the control.
As stated above, most studies concerned protection of surface water reservoirs from
diffuse pollution by riparian vegetation strips. Field studies have shown, for example,
that nitrates are efficiently removed from shallow ground water passing through the root
system of plants in a buffer zone. Mechanisms responsible for that process are still
elusive (Correll 1997), but it is generally assumed that the following processes are
important: ion exchange capacities of soil, plant uptake, and denitrification.
Long-term studies on the function of shelterbelts and stretches of meadows
within the Turew agricultural landscape, carried out by the Research Centre for
Agricultural and Forest Environment, Polish Academy of Sciences, provided infor-
mation on control of diffuse pollution in upland parts of drainage areas, which
enriched knowledge on control of nonpoint pollution outside riparian zones. Those
studies also disclosed some mechanisms for a ground water pollution control, which
can be useful for developing a strategy of water resource protection. Review of these
studies will be used to evaluate the prospect for diffuse pollution control in agricul-
tural landscapes.
ENVIRONMENT OF THE TUREW AGRICULTURAL LANDSCAPE
The Turew landscape (about 17000 ha) has been the object of long-term studies
on agricultural landscape ecology (Ryszkowski et al. 1990, 1996), and detailed
characteristics of climate, soils, hydrology, and land-use forms can be found in those
publications. The landscape is identified by the adjacent village, Turew. The terrain
consists of a rolling plain, made up of slightly undulating ground moraine. Differ-
ences in elevation do not exceed a few meters. In general, light soils are found on
the higher parts of the landscape with favorable infiltration conditions (glossudalfs
and hapludalfs). Endoaquolls and medisaprists occur in small depressions. The
infiltration rates of upland soils range from a few to several cm·h
–1
and can be
classified as having moderate or moderately rapid infiltration rates. Thus, the water
from rain or snow thaw can easily infiltrate beyond the depth of plant roots and then
transport dissolved chemical compounds to ground water; however, in layers below
60 cm (argillic and parent material horizons) infiltration rates are slowed due to
higher clay content. The content of organic carbon in the ochric horizon (upper
horizon of soil) of upland soils ranges from 0.5 to 0.8%, total nitrogen amounts
from 0.05 to 0.08%, and the ratio of C:N changes from 8:1 to 11:1 (Table 5.1). Soil
reaction in the ochric and luvic horizons varies generally between 4.5 and 5.5 pH
KCL
.
In deeper parts of the soil profile, soil reaction approaches neutral or slightly alkaline
0919 ch05 frame Page 113 Tuesday, November 20, 2001 6:25 PM
© 2002 by CRC Press LLC
Table 5.1
Means of Physical and Chemical Characteristics of Hapludalfs and Glossudalfs
Soil Horizon
Thickness
(cm)
Organic C
(%) N Total (T)
Contents
of Clay
Below
0.002 mm (%)
CEC
mmol (+)·kg
–1
S
mmol (+)·kg
–1
BS
(S:CEC)
(%)
Ochric
Luvic
Argillic
Parent material
30.8 ± 3.1
26.9 ± 7.4
37.8 ± 12.6
—
0.62 ± 0.14
0.21 ± 0.12
n.d.
n.d.
0.075 ± 0.019
0.025 ± 0.012
n.d.
n.d.
3.1 ± 1.2
2.7 ± 0.9
14.2 ± 3.7
11.9 ± 3.3
49.2 ± 1.2
34.8 ± 0.9
95 ± 1.7
81.2 ± 1.9
30.4
24.6
71.7
66.8
61.8
70.7
75.2
82.3
CEC — cation exchange capacity; S — sum of bases; BS — percent of saturation with bases
n.d. — not determined
Source:
Bartoszewicz 2000.
0919 ch05 frame Page 114 Tuesday, November 20, 2001 6:25 PM
© 2002 by CRC Press LLC
values of pH
KCL
. The alkaline reaction is caused by the presence of calcium carbon-
ates in the boulder loam.
The low values of cation exchange capacities of the soil, as well as small amounts
of clay fractions and organic matter, indicate that with fast percolation of water there
is intensive leaching of chemical solutes. Thus one can infer that sorption of ammonia
ions as well as other cations is rather low in the upper horizons of soils located in
the upland parts of the landscape and moderately low in deeper layers. The opposite
situation is observed in endoaquolls and medisaprists situated in the depressions of
the landscape. These soils are characterized by much higher contents of organic
carbon (2.7 to 43.4%) and are poor or very poorly drained. Their adsorptive capacities
for passing cations depends mainly on the content of organic matter because clay
minerals are poorly represented. Pokojska (1988) has found positive correlation
(r = 0.72) between values of cation exchange capacities and the percentage of organic
carbon content in those soils. Thus endoaquolls and medisaprists of the Turew
landscape have high potential to adsorb cations (Pokojska 1988, Marcinek and
Komisarek 1990).
The area, from a Polish perspective, is warm, with an annual mean temperature
of 8°C. Thermal conditions are favorable for vegetation growth. The growing season,
with air temperatures above 5°C, lasts 225 days. On average, it begins March 21
and ends October 30. Mean corrected annual precipitation (1881–1985) amounts to
590 mm (uncorrected value to 527 mm). Although the amount of precipitation in
the spring-summer period is more than twice that in winter, a water shortage often
occurs in the summer. The annual evapotranspiration rate averages about 500 mm
and runoff is 90 mm. Since a majority of the soils are characterized by high rates
of infiltration, their water storage is not of great importance in dry summers. Water
deficits are further intensified by drainage of a considerable part of the area.
The most advantageous component of the landscape is its shelterbelts (rows or
clumps of trees), which were planted in Turew due to the initiative of Dezydery
Ch apowski in the 1820s. In addition to shelterbelts, small afforestations are found
in the landscape. Shelterbelts and afforestations cover 14% of the entire area and
are composed of
Pinus sylvestris
(65.5% of total afforested area),
Quercus petraea
and
Q. robur
(14.5%),
Robinia pseudoaccacia
(5%),
Betula pendula
(4.3%) and
others, totaling 24 tree species. But in shelterbelts oaks, false acacias, maples,
lindens, larch, and poplars prevail. Oaks and larches have very deep root systems,
while maples (especially sycamore maples) and lindens have moderately deep roots
with broad root systems. The mix of the tree species creates a better screen to the
seeping solutes in ground water than would a shelterbelt composed of one species
(Prusinkiewicz et al. 1996). Cultivated fields cover 70% of the area. During the last
10 years, there has been a tendency for increased cereals (wheat, barley, rye, oats)
in the crop rotation pattern, and it presently comprises 70% of arable land. Decreased
row crops and pulse crops are also characteristic. Meadows and pastures located in
depressions close to channels, ponds, and lakes and among cultivated fields cover
12% of the area. Hay forms the largest component of grasslands, but other important
associations are made by sedge meadows in wetlands. The rest of the land is
l
0919 ch05 frame Page 115 Tuesday, November 20, 2001 6:25 PM
© 2002 by CRC Press LLC
composed of lakes and mid-field ponds and channels, waterlogged areas, roads, and
villages. The density of small reservoirs varies from 0.4 to 1.7/km
2
. Mineral fertil-
ization varied from 220 to 315 kg NKP/ha but since 1991 about a 40 to 50% decrease
or greater in mineral fertilization was observed on some small farms because of the
economic crisis associated with the change of the political system. Yields are high
for cereals (rye, wheat, barley and oats), ranging from 3.2 t·ha
–1
to about 4 t·ha
–1
.
The level of mechanization of field labor is high, amounting on the average to 1
tractor per 17 ha of cultivated fields.
In studies on the impact on ground water chemistry from the mid-field affores-
tations and shelterbelts or strips of meadows (called biogeochemical barriers), the
dominant direction of subsurface water pathways was estimated by measurement of
ground water table elevation in wells located in fields and adjoining shelterbelts,
small forests, or meadows. The samples for nitrogen compound concentration meas-
urements were collected from wells, drainage pipes, ditches, small ponds, and main
drainage canals of the landscape over different periods but never during a time span
shorter than 1 year.
Over the last 200 years, there were important habitat changes connected with
land reclamation activities leading to drying of the area. The effects are observed
not only in the drop in the ground water level but also in soil degradation caused
by drainage. So, for example, fertile endoaquolls have been converted in many places
into glossudalfs or hapludalfs with low carbon content. Thus, drying of the region
is expressed in soil changes; although appearing slowly, the nature of the trend can
be clearly recognized.
NITROGEN COMPOUNDS IN THE DRAINAGE SYSTEM
OF THE TUREW LANDSCAPE
The Turew landscape is drained by a canal about 4 m wide with an average long-
term water depth of 0.6 m. The annual mean concentrations of N-NO
3
–1
varied
irregularly from 0.5 mg·dm
–3
to 3.4 mg·dm
–3
. Almost the same range of variation
in N–NH
4
+
concentration was observed (Figure 5.1).
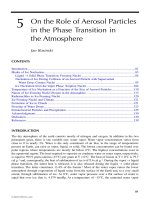
At the beginning of the 1990s, there was a decline in the use of fertilizers due
to the economic crisis, amounting to a drop in application of 40 to 50%. But despite
decreased input of fertilizers, the level of inorganic ion concentrations of nitrogen
did not change, showing irregular cycles with a peak in 1993 and 1994, followed
by a drop and then increasing since 1997 (Figure 5.1). Mean concentrations of the
mineral forms of nitrogen in the canal water during the period 1973–1991, when
higher doses of fertilizers were applied, were 1.40 mg·dm
–3
for N–NO
3
–
and
1.70 mg·dm
–3
for N–NH
4
+
. In the period 1992–2000 when fertilizer use dramatically
decreased, the mean concentration increased to 2.04 mg·dm
–3
in the case of
N–NO
3
–
and to 1.81 mg·dm
–3
for N–NH
4
+
. Thus, the relationship between input of
fertilizer and output of nitrogen ions from the watershed is not linear and is sub-
stantially modified by the buffering capacities of the total drainage area. The storage
capacities of various elements in the landscape for nitrogen, as well as options for
0919 ch05 frame Page 116 Tuesday, November 20, 2001 6:25 PM
© 2002 by CRC Press LLC
Figure 5.1
Mean annual concentration in main drainage canal of the Turew landscape.
0
0.5
1
1.5
2
2.5
3
3.5
1
973
1974
1975
1976
1977
1978
1979
1980
1
981
1982
1983
1984
1985
1986
1
987
198
8
19
89
1
99
0
1
99
1
1
99
2
1
99
3
19
94
1
995
19
96
19
97
19
98
199
9
2
000
Concentration [mg·dm
-3
]
N – NO
3
-
N – NH
4
+
0919 ch05 frame Page 117 Tuesday, November 20, 2001 6:25 PM
© 2002 by CRC Press LLC
diverting nitrogen compounds into various routes of discharge (water runoff, vola-
tilization), not only condition lag responses but also obscure the relationships
between fertilizer input and their concentrations in water of the drainage system.
The long-term (28 years) average concentration of both mineral forms of nitrogen
was the same in the main canal of the Turew landscape — 1.69 mg·dm
–3
in the case
of N–NO
3
–
and 1.74 mg·dm
–3
for N–NH
4
+
. Analysis of changes of N–NO
3
–
and
N–NH
4
+
ions over 28 years showed that the changes are independent (correlation
coefficient r = –0.06 is not statistically significant), which is another indication of
the complex transformation of nitrogen in the landscape. When the concentrations
of nitrogen forms were analyzed with respect to the monthly changes during the
year, distinct seasonal differences were found between the cold and growth seasons
(Bartoszewicz 1994). During the winter (December–February), the monthly mean
nitrate concentration was highest, reaching 2.79 mg·dm
–3
(Table 5.2) while its value
during the full plant growth season (May–September) was lowest. When the plant’s
transpiration processes decreased in October and November (leaf shedding by decid-
uous trees, drying of grasses, and only small plants of winter crops present in
cultivated fields), nitrate concentration increased so as to reach the highest values
when biological activity is retarded in winter.
Concentrations of N–NH
4
+
cations did not show such distinct changes in the
course of seasons although some drop during the plant growth season can be easily
observed (Table 5.2). In the course of the entire year, nitrates show much higher
variance of concentrations than ammonium. It seems the reason for this difference
is connected with the fact that biological activity is in “full swing” during the warm
season, although pinpointing the specific process responsible (plant uptake, denitri-
fication, assimilatory or dissimilatory nitrate reduction) requires additional studies.
In the plant growing season (end of March until the end of October), average
precipitation reaches 410 mm out of an annual total of 590 mm (Wo and Tamulewicz
1996). Despite high precipitation rates in summer, the concentrations of nitrates in
water of the canal were low in this period, although N–NO
3
–
anions are easily leached
from soil. Thus, effects of mineral nitrogen leaching caused by rainfall are modified
by influences exerted by plants on migrating nitrogen ions in the watershed. (This
conclusion is confirmed by special studies carried out in small watersheds, the results
of which are discussed later in this chapter.)
The differences between nitrate concentrations in ground water under cultivated
fields and their concentrations in water of the main drainage canal clearly show
modification effects exerted by the landscape structure on dispersion of chemical
Table 5.2 Mean Monthly Long-Term (1973–2000) Concentrations
(mg·dm
–3
) of Inorganic Nitrogen Forms in Main
Drainage Canal of the Turew Landscape in
Consecutive Periods of the Year
Period Dec.–Feb. March–April May–Sept. Oct.–Nov.
N–NO
3
–
2.79 ± 1.01 2.50 ± 0.71 0.88 ± 0.15 1.11 ± 0.48
N–NH
4
+
1.98 ± 0.30 1.92 ± 0.44 1.68 ± 0.19 2.10 ± 0.37
´
s
0919 ch05 frame Page 118 Tuesday, November 20, 2001 6:25 PM
© 2002 by CRC Press LLC
compounds. Analyses of mineral nitrogen distribution in the unsaturated zone below
the cultivated field showed that in the spring large amounts are leached into the
ground water. In ground water of some fields, high concentrations of N–NO
3
–
, reach-
ing 60 mg·dm
–3
, can be found when fertilizers were applied during spring (Rysz-
kowski et al. 1997). But despite the fact that such situations occur in some fields,
each spring the monthly concentrations of nitrates in the main canal draining the
total area are very low, which again indicates strong modification effects of landscape
structure on the control of diffuse pollution.
CONTROL OF MINERAL NITROGEN POLLUTION BY
SHELTERBELTS AND MEADOWS
When ground water carrying nitrates is within direct and indirect (capillary
ascension) reach of the root system, nitrate concentrations are substantially
decreased. Knowing that the NO
3
–
anion is practically not exchanged by soil colloids,
these differences result mainly from the action of a complex set of biological factors
involving the plant’s uptake, denitrification processes, and release of gaseous prod-
ucts including NO, N
2
O, and N
2
. In addition, nitrates may undergo reduction to NH
4
+
,
which could be volatilized. The regulation of those processes under field conditions
is poorly understood (Correll 1997).
The reduction of nitrates when ground water is seeping under shelterbelts,
afforestations, or grasslands is pronounced, and under the Turew landscape condi-
tions such reduction varied from 63 to 98% for shelterbelts and afforestations
(Table 5.3). In the case of meadow strips, the reduction varied from 79 to 97%.
Table 5.3 Mean Concentrations of N–NO
3
–
(mg·dm
–3
) in Ground Water under
Cultivated Fields, Shelterbelts, Small Forests, and Meadows
in the Turew Agricultural Landscape
Period of
Sampling
Cultivated
Field (a)
Shelterbelt
or Forest
Patch (b)
Meadow
(b)
Reduction
(a-b):a (%) Reference
1982–1986
1982–1986
1972–1973
1984–1986
1994
1995
1986–1989
1987–1989
1987–1991
1993
1993
1994
1994
1995
22.2
37.6
12.6
33.1
52.4
13.1
48.3
15.9
13.1
18.7
22.1
19.1
13.4
18.3
1.0
1.1
0.3
8.1
2.7
4.9
—
—
—
—
—
—
—
—
—
—
—
—
—
—
6.5
0.7
2.8
1.4
2.0
1.2
2.4
0.6
95
97
98
75
94
63
87
95
79
92
91
94
82
97
Bartoszewicz and
Ryszkowski 1996
Bartoszewicz and
Ryszkowski 1996
Margowski and
Bartoszewicz 1976
Ryszkowski et al. 1997
Ryszkowski et al. 1997
Ryszkowski et al. 1996
Bartoszewicz 1990
Bartoszewicz 1990
Szpakowska and
yczy ska-Ba oniak 1994
Ryszkowski et al. 1996
Ryszkowski et al. 1996
Ryszkowski et al. 1996
Ryszkowski et al. 1996
Ryszkowski et al. 1996
·
Z
´
n
l
0919 ch05 frame Page 119 Tuesday, November 20, 2001 6:25 PM
© 2002 by CRC Press LLC
Thus, both kinds of biogeochemical barriers (shelterbelts and meadow stretches)
showed similar efficiency of nitrate reduction. Results are similar to the estimates
gathered from various literature sources by Muscutt et al. (1993).
One can argue that changes in concentrations do not fully show the effects of
nitrate limitation exerted by the biogeochemical barriers. The control effects depend
on both the changes in concentrations and the rate of N–NO
3
–
flux through the barrier.
Low concentration inflow can provide a large amount of chemicals if the rate of
water flux is high. But the hydraulic conductivity of soils (up to 1.0 m·day
–1
) as
well as hydraulic gradients of ground water tables that determine flux are small in
the landscape studied, which should render good approximations of nitrate fluxes
by changes in their concentrations. This situation was confirmed by studies of the
hydrology of water seeping under biogeochemical barriers (Ryszkowski et al. 1997).
Estimated N–NO
3
–
ratios for output-input of annual flux estimates for birch mid-field
forests amounted to 0.22, 0.25, and 0.28 in three consecutive years (Ryszkowski
et al. 1997). The average for the 3 years was 0.25, which corresponds well with the
estimate based on concentration changes, which was also 0.25.
In the case of the pine mid-field forest, both estimates also match very well
(Ryszkowski et al. 1997). Thus, in an area where the slope of the ground water table
is not too steep, the differences in concentrations of chemical compounds between
an input and output characterize well the flux control efficiency of the barrier. Studies
(Ryszkowski and K dziora 1993) indicate that, as the steepness of slope increases,
the shelterbelt and meadow are less efficient in regulating ground water flow and
chemicals transported.
A great influence of plant cover structure on output of elements from watersheds
was shown by Bartoszewicz (1994), and Bartoszewicz and Ryszkowski (1996).
These studies were carried out in two small watersheds. The first was a uniform
watershed (174 ha) covered 99% by cultivated fields and 1% by small afforestation.
The second watershed (117 ha) was mosaic; cultivated fields made up 84% of the
area, meadows 14%, and riparian afforestation 2%. During the 3-year period, the
mean annual water output was 102.0 dm
3
·m
–2
from the uniform watershed and 70.2
dm
3
·m
–2
from the mosaic watershed. The mean annual precipitation for both water-
sheds was the same, amounting to 514 dm
3
·m
–2
, so the lower water runoff from the
mosaic watershed was due to higher evapotranspiration rates characteristic of affor-
estations and grasslands (Ryszkowski and K dziora 1987). This is clearly seen when
water outputs are analyzed from both watersheds in summer (Table 5.4).
The water runoff from both watersheds during the hydrological years
1988/1989–1990/1991 differed by 32 mm on average. However, the water runoff
during the winter half-years was almost the same from either watershed, whereas
during the growing season water outputs from the uniform watershed (per unit of
area) were three times higher than those from the mosaic watershed (Bartoszewicz
1994). Thus, shelterbelts and meadows making up 16% of the mosaic watershed
area very effectively controlled output of water from the catchment area into the
drainage canal during the plant growing season (Table 5.4).
From a uniform arable watershed, 20.4 kg of inorganic nitrogen had leached out
from 1 ha annually, 20% of which was in the form of ammonium ions. Thus the
˛e
˛e
0919 ch05 frame Page 120 Tuesday, November 20, 2001 6:25 PM
© 2002 by CRC Press LLC
preponderance of nitrates over ammonium is clearly evidenced in water output from
the uniform agricultural drainage area.
When the migration of mineral components from a mosaic watershed was ana-
lyzed, a low leaching rate of nitrogen constituents and a different ratio of nitrates
to ammonia ions were observed. The annual leaching rates of mineral N from 1 ha
of this watershed amounted to about 2 kg (ten times less than in the uniform
watershed), and both ionic forms of N were represented by almost identical shares.
Even more striking were the differences between the uniform arable watershed and
the mosaic one with respect to seasonal variations in the migration of nitrogen. The
majority of both nitrogen ion forms (86%) had leached from the mosaic watershed
in the winter half-year, while during the plant growth period the leaching of either
nitrogen form (particularly of nitrates) was negligible (Table 5.4).
The study of nitrogen leaching from the small watersheds with different plant
cover structures supports the conclusion that shelterbelts, strips of meadows, and
other biogeochemical barriers located both in upland and riparian parts of the Turew
landscape effectively control the discharge of nitrogen from the drainage area. This
conclusion explains the low concentrations of its mineral forms in the main canal
(Figure 5.1). The smaller variability of ammonium cations in contrast to nitrates
during the course of the year observed in the main Turew canal (Table 5.2) as well
as the dissimilarity of these compound shares in discharge from the uniform and
mosaic small watersheds (Table 5.4) indicate differentiated impacts of plant cover
structures on dissemination of these inorganic forms of nitrogen in the landscape.
Contrary to nitrates, the concentrations of ammonium cations usually do not
decrease when ground water is passing under shelterbelts or meadows. Comparing
concentrations of N–NH
4
+
in ground water under cultivated fields and shelterbelts or
grass strips one observes increased rather than decreased amounts of N–NH
4
+
(Table 5.5).
Because some ammonium ions incoming with ground water from fields are
absorbed by plants, the lack of a decrease in their concentrations under shelterbelts
or meadows certainly indicates that N–NH
4
+
cations are released from the internal
cycle of nitrogen in the biogeochemical barrier.
The influence of precipitation on leaching of nitrogen forms from litter and soil
into ground water is a well-known phenomenon. Both the precipitation intensity and
Table 5.4 Annual Mean Water Output (mm) and Nutrient Loss (g·m
–2
·year
–1
)
from Two Small Watersheds, Nov. 1988–Oct. 1991
Season
Precipitation
(mm)
Uniform Watershed
Mosaic Watershed
Water
Output
(mm) N–NO
3
–
N–NH
4
+
Water
Output
(mm) N–NO
3
–
N–NH
4
+
Winter
Nov.–April
220.7 60.8 12.3 3.0 56.8 0.90 0.95
Summer
May–Oct.
292.9 41.2 4.0 1.1 13.4 0.05 0.25
Whole year 513.6 102.0 16.3 4.1 70.2 0.95 1.20
Source:
Bartoszewicz 1994.
0919 ch05 frame Page 121 Tuesday, November 20, 2001 6:25 PM
© 2002 by CRC Press LLC
annual distribution are of considerable significance. In studies of mosaic and uniform
small watersheds in the hydrological years of 1989/90 and 1990/91, during which
the sums of precipitation were at the level of 550 mm·year
–1
, the losses of nitrogen
forms were much higher (in some instances twice as high) than in the hydrological
year 1988/1989, during which the annual precipitation was 110 mm lower. In the
case of nitrates, the pattern of annual precipitation distribution rates plays a signif-
icant role. When intensive rains occurred during the late autumn and winter of
1990/91 — i.e., at a time when appreciable amounts of nitrates were being released
from the decomposing post-harvest plant remnants (Ryszkowski 1992) — the leach-
ing of nitrates was 6 kg higher than in 1989/90 when precipitation was lower by
40 mm.
PROCESSING OF MINERAL NITROGEN
IN THE BIOGEOCHEMICAL BARRIERS
In order to study the distribution of mineral forms of nitrogen in the unsaturated
zone of the soil profile, the method of moisture saturation extracts was used (Jackson
1964). According to this method, soil samples are treated with distilled water to
saturation and then centrifuged to obtain extracts from which the concentration of
chemical compounds is determined. Then, using conversion equations, one can
estimate the content of chemicals in the unsaturated layer of soil. In the pine
afforestation and adjoining cultivated field located on hapludalf soils in the upland
Table 5.5 Mean Concentrations of N–NH
4
+
(mg·dm
–3
) in Ground Water under
Cultivated Fields, Shelterbelts, Small Forests, and Meadows
in the Turew Agricultural Landscape
Period of
Sampling
Cultivated
Field (a)
Shelterbelt
or Forest
Patch (b)
Meadow
(b)
Reduction
(a–b):a (%) Reference
1982–1986
1982–1986
1972–1973
1984–1986
1994
1986–1989
1987–1989
1987–1991
1993
1993
1994
1994
1995
2.5
2.1
1.4
1.7
1.3
1.8
1.8
1.8
2.4
2.5
2.6
3.9
2.5
2.0
4.5
2.7
1.7
1.1
2.2
2.1
—
—
—
—
—
—
—
—
—
—
2.2
2.4
2.4
3.0
7.1
4.0
25
114
a
–92
0
15
–22
–16
–22
0
4
–15
–82
–60
Bartoszewicz and
Ryszkowski 1996
Bartoszewicz and
Ryszkowski 1996
Margowski and
Bartoszewicz 1976
Ryszkowski et al. 1997
Ryszkowski et al. 1997
Bartoszewicz 1990
Bartoszewicz 1990
Szpakowska and
yczy ska-Ba oniak 1994
Ryszkowski et al. 1996a
Ryszkowski et al. 1996a
Ryszkowski et al. 1996a
Ryszkowski et al. 1996a
Ryszkowski et al. 1996a
a
Minus values mean increase of concentration under the biogeochemical barrier.
·
Z
´
n
l
0919 ch05 frame Page 122 Tuesday, November 20, 2001 6:25 PM
© 2002 by CRC Press LLC
part of the watershed, soil samples were tak en at different depths of soil profile
during the 1986–1987 period (Ryszkowski et al. 1997). Almost 10 years later, again
in the same place, soil samples were collected for moisture saturation extracts
(Bartoszewicz 2001a). Comparing the distribution of inorganic nitrogen in soil
profiles at various seasons in afforestation and adjoining fields, one can find higher
concentrations of ammonium cations in the soil profile under afforestation than under
the cultivated field. In the case of nitrates, the opposite situation was found (Table 5.6)
as a result of more intensive nitrification processes due to the better soil aeration
caused by tillage. The input of fertilizers resulted in higher concentrations of nitrogen
mineral forms in the soil of the cultivated field. Applied nitrogen fertilizers consisted
mainly of ammonium nitrate (NH
4
NO
3
), so the same amounts of both nitrogen forms
were introduced into soil. Domination of nitrates indicated, therefore, intensive
nitrification processes in the cultivated field soil due to aeration caused by tillage.
Comparisons of nitrogen ions concentrations at consecutive terms of sampling
in April and September 1986 and April 1987, as well as those concentrations in May
and September 1998, were conducted in the same field and afforestation located on
hapludalf soil (Table 5.6), and they indicate clear fluctuations of these ions in the
soil profile. At least some of these changes are caused by leaching of ions into the
ground water. One has to remember that uptake of ions by plants also influences
Table 5.6 Distribution of N–NO
3
–
and N–NH
4
+
(g·m
–2
) in the Unsaturated Layers of Soil
in the Cultivated Field and Adjoining Pine Afforestation
Sampling Term
Mineral Form
of N
Cultivated Field
Soil Layer Depth (cm)
Pine Afforestation
Soil Layer Depth (cm)
0–80 81–150 0–150 0–80 81–150 0–150
April 1986 N–NO
3
–
(a)
N–NH
4
+
(b)
Sum
a:b
13.9
2.3
16.2
6.0
7.9
4.9
12.8
1.6
21.8
7.2
29.0
3.0
5.2
6.7
11.9
0.8
1.1
3.3
4.4
0.3
6.3
10.0
16.3
0.6
September 1986 N–NO
3
–
(a)
N–NH
4
+
(b)
Sum
a:b
3.7
1.6
5.3
2.3
1.2
0.9
2.1
1.3
4.9
2.5
7.4
1.9
0.3
2.1
2.4
0.1
0.2
0.5
0.7
0.4
0.5
2.6
3.1
0.2
April 1987 N–NO
3
–
(a)
N–NH
4
+
(b)
Sum
a:b
9.7
1.7
11.4
5.7
8.6
0.3
8.9
28.6
18.3
2.0
20.3
9.1
2.8
3.9
6.7
0.7
1.0
0.8
1.8
1.2
3.8
4.7
8.5
0.8
May 1998 N–NO
3
–
(a)
N–NH
4
+
(b)
Sum
a:b
0.4
2.2
2.6
0.2
4.5
1.1
5.6
4.0
4.9
3.3
8.2
1.5
0.7
2.4
3.1
0.3
2.9
1.7
4.6
1.7
3.6
4.1
7.7
0.8
September 1998 N–NO
3
–
(a)
N–NH
4
+
(b)
Sum
a:b
5.5
1.9
7.4
2.9
1.9
1.2
3.1
1.6
7.4
3.1
10.5
2.4
1.3
3.3
4.6
0.4
0.7
1.6
2.3
0.4
2.0
4.9
6.9
0.4
Source:
Modified after Bartoszewicz 2001a, Ryszkowski et al. 1997.
0919 ch05 frame Page 123 Tuesday, November 20, 2001 6:25 PM
© 2002 by CRC Press LLC
the distribution of nitrogen ions in the soil profile; in the majority of performed
determinations, lower concentrations of nitrogen ions were observed in the soil strata
below 80 cm depth (Table 5.6) as a result of ion uptake by root systems. Lack of
direct measurements of water infiltration fluxes through soil profile obscures the
precise estimates of nitrates and ammonium inputs into ground water from the
unsaturated zone of soil with percolating water after precipitation events. Neverthe-
less, comparisons of nitrates and ammonium concentrations in ground water under
fields and afforestations or meadows (Tables 5.3 and 5.5) clearly demonstrate that
nitrates are reduced by those biogeochemical barriers while ammonium ions are not.
In order to evaluate the influence of shelterbelts on mineral nitrogen in the soil
the special studies were done on the distribution of inorganic nitrogen in the soil
profile 6 years after trees were planted on a cultivated field with hapludalf soils. In
soil withdrawn from cultivation for 6 years, very low concentrations of mineral
nitrogen were detected in comparison with an adjoining cultivated field (Table 5.7).
When inputs of fertilizers into soil under a growing shelterbelt were ceased, the
amount of mineral nitrogen dramatically decreased almost 10 times in comparison
with a field in October 1999 and 5 times in May 2000 when mineral nitrogen was
regenerated due to greater decomposition rates brought by the higher temperatures
of spring. The levels of mineral nitrogen in the soil under newly planted shelterbelts
were lower than in soil under a 60-year-old afforestation planted also on the same
hapludalf soils (compare Tables 5.6 and 5.7). This phenomenon is caused by the
low level of litter and soil organic matter accumulation in a new shelterbelt due to
short time lapse after tree planting. Decomposed organic matter is an important
source of mineral nitrogen stocks in soil (this process is discussed with results of
urease activity studies later in this chapter).
In the new shelterbelt, ammonium ions predominate over nitrates, which resem-
bles the situation in the old afforestations and shelterbelts, indicating that the pre-
ponderance of N–NH
4
+
is very quickly established when soil is withdrawn from
cultivation.
Table 5.7 Distribution of N–NO
3
–
and N–NH
4
+
(g·m
–2
) in the Unsaturated Layers of Soil
under Cultivated Field and Newly Planted Shelterbelt
Sampling
Term
Mineral Form
of N
Cultivated Field
Soil Layer Depth (cm)
New Shelterbelt
Soil Layer Depth (cm)
0–80 81–150 0–150 0–80 81–150 0–150
October 1999 N–NO
3
–
(a)
N–NH
4
+
(b)
Sum
a:b
4.8
1.7
6.5
2.8
17.8
0.4
18.2
44.5
22.6
2.1
24.7
10.7
0.4
1.0
1.4
0.4
0.6
0.6
1.2
1.0
1.0
1.6
2.6
0.6
May 2000 N–NO
3
–
(a)
N–NH
4
+
(b)
Sum
a:b
4.0
1.2
5.2
3.3
11.5
0.4
11.9
28.7
15.5
1.6
17.1
9.6
1.1
1.7
2.8
0.6
0.1
0.3
0.4
0.3
1.2
2.0
3.2
0.6
Source: Modified after Bartoszewicz 2001a.
0919 ch05 frame Page 124 Tuesday, November 20, 2001 6:25 PM
© 2002 by CRC Press LLC
The other study of Bartoszewicz (2000) on the newly planted shelterbelt growing
on endoaquolls showed that after 1 year of seedling growth, the ratio of N–NO
3
–
to
N–NH
4
+
was already 0.8 (1.5 g·m
–2
and 1.7 g·m
–2
, respectively) while in the same
adjoining soil but under cultivation this ratio was 2.7 (3.5 g·m
–2
and 1.3 g·m
–2
,
respectively) in soil profiles to 150 cm of depth. This last result indicates that
withdrawal of tillage activities alone has important bearing on decreased nitrification
processes due to poorer soil aeration, although the levels of mineral nitrogen in
organic-rich soil (endoaquolls) showed differences not as great between field and
new shelterbelt (total mineral nitrogen in cultivated soil amounted to 4.8 g·m
–2
and
in 1 year the old shelterbelt was equal to 3.2 g·m
–2
).
Some ammonium ions are absorbed by roots as well as retained by the base-
exchange complex, especially in the deeper strata of soil in the Turew landscape
(see Table 5.1 for values of cation exchange capacities [CEC] and percent of satu-
ration of sorption complex [BS]). The observed lack of decrease in N–NH
4
+
ions
concentrations when ground water is passing through root systems of the bio-
geochemical barriers (Table 5.5) should be related, therefore, to inputs of ammonium
ions from decomposing organic matter.
Several biological processes could lead to production of N–NH
3
. The first process
is assimilatory nitrate reduction in which N–NH
3
is used for production of biomass,
(proteins) which after mineralization could release ammonium ions. Assimilatory
nitrate reduction takes place under oxygenic conditions. The second process is
actually two processes: dissimilatory reduction of nitrates, which in denitrification
releases gaseous forms of nitrogen, and in dissimilatory reduction of nitrate to
ammonium releases N–NH
4
+
ions under anaerobic conditions (Tiedje et al. 1981). In
addition, very small amounts of N–NH
4
+
can be exuded from tree roots as shown
experimentally by Smith (1976) in the case of birch, beech, and maple trees.
In all plants, ammonia (NH
3
) plays a key role in nitrogen assimilation because
all nitrogen organic compounds are derived from ammonia assimilation regardless
of the nutritional source of nitrogen to plants. Plant proteins and nucleic acids are
built from low molecular organic compounds deriving nitrogen from the NH
3
form.
Thus, nitrates absorbed by plants are converted by assimilatory nitrate reduction to
ammonia, and in this form nitrogen is incorporated into the biomass. When plant
tissues undergo decomposition, ammonia ions are released. This last process is
controlled at the final stage by the enzyme urease, which is responsible for the
conversion of urea nitrogen to ammonia nitrogen (Bremner and Mulvaney 1978).
Urease activity analysis therefore monitors the release of N–NH
3
from decomposing
organic compounds in the soil, which in soil solution appears as N–NH
4
+
.
In studies reported here, urease activity was measured by the Hoffman and
Teicher method described and calibrated by Szajdak and Matuszewska (2000). The
urease activity was measured in the upper layer of soil (0–20 cm of depth) in the
7-year-old shelterbelt as well as the 140-year-old shelterbelt and adjoining fields.
Both shelterbelts were planted on hapludalf soils. The urease activity was studied
by L. Szajdak in the 7-year-old shelterbelt 1 year later than studies on distribution
of mineral nitrogen forms in the soil profile presented in Table 5.7 were conducted.
0919 ch05 frame Page 125 Tuesday, November 20, 2001 6:25 PM
© 2002 by CRC Press LLC
According to the review by Bremner and Mulvaney (1978), urease activity is
positively related to organic matter content due to microbial and plant metabolism,
and its activity is high in soils under dense vegetation. Clay content to some extent
protects urease against decomposition. Mineral fertilizers (e.g., ammonium nitrate)
and soil oxygenation have no effects; slight effects are exerted by levels of soil
moisture, but a rapid sequence of drying and rewetting of soil decreases its activity.
Fluctuations of urease activity are characteristic both for shelterbelts and culti-
vated fields (Table 5.8). Despite detected variability, the average values of urease
activities in soil of the 7-year-old shelterbelt and adjoining cultivated field as well
as a field adjacent to the 140-year-old shelterbelt were similar. The rate of urea
[CO(NH
2
)
2
] hydrolysis into CO
2
and NH
3
brought by catalytic activity of urease
depends on its concentration. Assuming that organic nitrogen contents in soil (esti-
mated as the difference between nitrogen estimated by the Kjeldahl method [without
reduction of nitrates] and N–NH
4
+
), may be used as an index of urea concentrations,
the similarity of urease activity in these three ecosystems can be explained by the
same levels of substrates available for decomposition (Table 5.8). Soil under the
7-year-old growing shelterbelt did not store enough organic nitrogen, part of which
could undego decomposition and provide significantly higher levels of urea concen-
tration. But during the 140 years since the trees were planted on hapludalf soils, the
organic matter accumulated in soil and the average contents of organic nitrogen are
almost fivefold higher than in the adjacent field. In response to this increase the
amounts of hydrolyzed urea almost doubled (Table 5.8). Thus, in shelterbelts not
only is conversion of nitrates into ammonium ions by assimilatory nitrate reduction
observed, but release of N–NH
3
during decomposition of biomass is also observed.
Because of the organic nitrogen accumulation during the growth of the shelter-
belt, the amounts of urea available for decomposition also increase, which results
in higher production of N–NH
3
due to activity of urease although this relationship
is not linear. In the 7-year-old shelterbelt, the ratio of organic nitrogen to urease
activity is 581.9: 5.61 = 103, and in the 140-year-old shelterbelt this ratio is 2656.3:
Table 5.8 Urease Activity (UA; µµ
µµ
g urea hydrolyzed·g
–1
soil·h
–1
), Organic Nitrogen
(ON; mg·kg
–1
) in Soils of Various Ecosystems in the Turew Landscape
Date
Shelterbelts Fields Adjoining to Shelterbelts
7-Year-Old 140-Year-Old 7-Year-Old 140-Year-Old
UA ON UA ON UA ON UA ON
March 12
April 7
May 8
June 5
July 9
August 20
September 14
October 12
November 14
4.35
4.81
4.56
4.25
6.20
9.17
7.76
5.07
4.35
590.5
591.8
609.1
527.3
602.7
571.4
538.4
657.3
549.1
16.88
14.50
18.96
5.32
4.88
3.58
7.94
4.05
2.15
1634.3
1677.3
1416.5
2541.4
5644.9
3400.7
2138.0
3133.0
2320.7
6.45
5.98
7.25
5.27
5.30
8.40
5.30
3.40
3.07
354.8
350.6
355.1
497.1
421.2
472.4
506.4
488.9
501.2
4.53
4.38
3.94
2.50
2.67
6.41
7.92
2.63
1.93
587.5
567.8
533.3
789.1
576.7
566.1
460.3
521.1
506.9
Mean 5.61 581.9 8.69 2656.3 5.60 438.6 4.10 567.6
0919 ch05 frame Page 126 Tuesday, November 20, 2001 6:25 PM
© 2002 by CRC Press LLC
8.69 = 305. Thus, in the older shelterbelt more organic nitrogen is not decomposed
into urea but stored in resistant-to-decomposition form. Nevertheless, when soil
sorption capacities as well as nutritional demands of plants are met, then higher rates
of leaching ammonium ion can be expected in older shelterbelts rather than in young
ones, where low amounts of organic nitrogen are accumulated.
Interplay of these processes explains the results presented in the Table 5.5,
showing the efficacy of biogeochemical barriers for control of ammonium ions
seeping with ground water through the root systems of plants. In 9 of 13 analyzed
cases, no decreases were detected when output-to-input N–NH
4
+
concentrations were
analyzed. Efficient uptake of nitrates by plants in biogeochemical barriers and their
processing by biota into N–NH
4
+
also explain lower variation of ammonium ions
than nitrates in the main drainage canal during the course of the year (Table 5.2).
How much N–NH
4
+
is leached into ground water depends on the complicated
interplay of several processes. Released N–NH
4
+
ions from decomposing organic
matter could again be taken up by organisms for production of their biomass,
converted to nitrates in nitrification processes, withdrawn from soil solution by
sorption complex, incorporated into stored inert organic nitrogen, or leached into
ground water. Moreover, ammonia (NH
3
) could be volatilized into air. Because
intense NH
3
volatilization appears from soil solutions when its reaction is above 7
pH, one can assume that this is not a significant form of ammonia loss from the
Turew landscape soils, but drying of soils and high air temperature could have some
effects on this process (Freney et al. 1981, Harper et al. 1996). The losses of NH
3
by volatilization may be reduced to some extent by the repeated absorption of
released ammonia by plants when this gas is still within a vegetation stand (Harper
et al. 1995). Due to those various recycling processes, the ammonia emissions from
forests are small (Longford and Fehsenfeld 1992). All those processes are influenced
by physical and chemical factors, but the central role is played by the biological
processes of assimilation, decomposition, nitrification, and denitrification.
In the young and old shelterbelts and adjoining fields studied, CO
2
and N
2
O
evolution were measured. Carbon dioxide and nitrous oxide concentrations in gas
samples were determined with Varian GC 3800, equipped with an electron capture
at an operating temperature of 340°C and with a thermal conductivity detector
operating at a temperature of 200°C. A Porapak 1.8-m Q 80/100 column (Alltech
Associates, Inc., Deerfield, IL) at 50°C was used to separate N
2
O, and at 74°C to
separate CO
2
(Cabrera et al. 1993).
Evolution of CO
2
from soil can be used as an index of general biological activity
of the cultivated fields and shelterbelts studied. The highest mean of CO
2
evolution
was found from the soil of the 140-year-old shelterbelt while the two fields and the
7-year-old shelterbelt were characterized by similar (not statistically significant)
rates of CO
2
evolution (Table 5.9). More than fourfold higher organic nitrogen
contents found in soil of the older shelterbelt compared to an adjacent field was
associated with only 56% higher CO
2
evolution, which again indicates that the
relationship between nitrogen organic matter and soil metabolic activity is not
directly proportional to the increase of the potential substrate for decomposition.
0919 ch05 frame Page 127 Tuesday, November 20, 2001 6:25 PM
© 2002 by CRC Press LLC
With increasing age of shelterbelt, more and more nitrogen is stored in the
resistant-to-decomposition organic compounds. The accumulation of soil organic
matter under shelterbelts is the main mechanism of long-term withdrawal of various
elements from the dynamic cycle of transformations in an ecosystem. Absorbed by
plants or microbes, nutrients become built into plant biomass; then after the decay
of biomass some of them are stored in humus. Estimates of the withdrawal rates of
nitrogen into humus provided the figure of 1.7 g·m
–2
·year
–1
in the 140-year-old
shelterbelt and 1.4 g·m
–2
·year
–1
for pine afforestation planted on hapludalf soils
(Ryszkowski et al. 1997). Some nitrogen is also withdrawn from circulation for a
considerable time in woody parts of trees. In the case of the pine afforestation this
form of nitrogen storage attains a value of 0.0022 g N·m
–2
·year
–1
(Ryszkowski et al.
1997) and is much lower than incorporation of nitrogen into humus. The highest
level of organic nitrogen in the soil of the old shelterbelt was also correlated with
very clear seasonal changes in the CO
2
evolution, reaching the highest values in the
warmest months (July and August) of the year. The most intensive evolution of the
nitrous oxide from soil was also observed in the summer (Table 5.10).
Table 5.9 CO
2
Evolution (g·m
–2
·h
–1
) from Soil in Shelterbelts of Various
Ages and Adjoining Cultivated Field
Date
Shelterbelts Fields Adjoining Shelterbelts
7-Year-Old 140-Year-Old 7-Year-Old 140-Year-Old
March 12
April 7
May 8
June 5
July 9
August 20
September 14
October 12
November 14
82
83
84
86
88
87
83
82
79
119
120
141
146
167
159
155
123
119
82
82
87
91
115
107
87
83
85
79
78
81
100
129
99
83
80
68
Mean 83.8 138.8 91 88.6
Table 5.10 N
2
O Evolution (N g·m
–2
·h
–1
) from Soil in Shelterbelts of Various
Ages and Adjoining Cultivated Fields
Date
Shelterbelts Fields Adjoining Shelterbelts
7-Year-Old 140-Year-Old 7-Year-Old 140-Year-Old
March 12
April 7
May 8
June 5
July 9
August 20
September 14
October 12
November 14
80
80
80
120
120
110
100
90
100
120
110
130
130
180
170
150
150
140
200
240
220
370
320
250
190
200
170
250
230
250
270
280
270
250
240
240
Mean 97 142 240 253
0919 ch05 frame Page 128 Tuesday, November 20, 2001 6:25 PM
© 2002 by CRC Press LLC
From the soil of cultivated fields, where nitrates prevail over ammonium ions
(Tables 5.3, 5.6, and 5.7), much higher rates of N
2
O evolution were observed than
from the soil of shelterbelts where ammonium dominates or makes a substantial
contribution to the pool of mineral nitrogen. This result confirms estimates of
Robertson et al. (2000) indicating that N
2
O fluxes are much higher from soil under
annual crops than from poplar cultivation. With higher amounts of nitrates in soil,
rates of N
2
O evolution are also greater, though this relation is not linear and strongly
depends on distribution of anaerobic sites in the soil. In the newly planted shelterbelt,
where shortage of nitrates is apparent (1.0 to 1.2 g·m
2
in 150-cm-deep soil stratum,
Table 5.7) the evolution of N
2
O was the lowest.
Converting the annual rates of nitrogen storage in humus and wood production
into hourly intervals for the sake of comparison with N
2
O evolution, 160 µg
N·m
–2
·h
–1
is found for pine afforestation and 190 µg N·m
–2
·h
–1
for the 140-year-
old shelterbelt. These rates are very similar to those for N
2
O evolution in the old
shelterbelt (Table 5.10). The rate of the nitrogen storage in wood is lower and after
conversion is 22 µg N·m
–2
·h
–1
. One can infer that nitrogen storage in shelterbelt
humus is greater than its storage in wood, and that both long-term storage mecha-
nisms operate at the same level such as the release of nitrogen in N
2
O evolution.
The intensive conversion of nitrate inputs to ammonium ions through assimila-
tory reduction and then decomposition of organic nitrogen, releasing ammonium,
as well as the low intensity of nitrification processes are the reasons for lower rates
of N
2
O release into atmosphere in shelterbelts than in cultivated fields. Nitrification
was not studied in the Turew landscape, but many researchers found low rates of
nitrification in the terrestrial ecosystems with an unfertilized permanent vegetation
(Verstraete 1981). The conversion of N–NO
3
–
into N–NH
4
+
constitutes, as one can
hypothesize, a nitrogen-saving mechanism in shelterbelts or meadows, preventing
nitrogen loss by nitrate leaching and N
2
O evolution. Those nitrogen-saving mecha-
nisms are evidenced by lower nitrate concentrations in ground water of the bio-
geochemical barriers than under fields (Table 5.3) and lower rates of N
2
O evolution
in the shelterbelts than in cultivated fields (Table 5.10) and generally low concen-
trations of ammonium ions both in ground water under cultivated fields and bio-
geochemical barriers (Table 5.5). The lower rates of N
2
O evolution were directly
measured. Considering operation of nitrogen-saving mechanisms in shelterbelts and
meadows, the question still remains of how intensive is the release of N
2
in denitri-
fication processes. In addition, field measurements of NH
3
volatilization should show
if, as the literature suggests, very low rates of NH
3
loss in the Turew upland soils
represent the real situation.
LANDSCAPE MANAGEMENT GUIDELINES FOR EFFICIENT
CONTROL OF NITROGEN POLLUTION
The above analysis indicates that transformations of mineral nitrogen to organic
forms and vice versa play a crucial role in control of nitrogen fluxes in the landscape.
0919 ch05 frame Page 129 Tuesday, November 20, 2001 6:25 PM
© 2002 by CRC Press LLC
Nitrate input with precipitation in the Turew landscape, which makes up quite
a substantial source,* as well as nitrate water runoff from cultivated fields are
effectively controlled by the network of biogeochemical barriers that results in low
mineral nitrogen concentrations in the main drainage canal. The mean annual mineral
nitrogen (N–NO
3
–
plus N–NH
4
+
) varied over a 28-year period within 1.5 mg·dm
–3
to
6 mg·dm
–3
(Figure 5.1). The landscape mechanisms of control kept nitrogen con-
centrations at this rather stable level despite dramatic decrease in fertilizer use,
changes in crop rotation patterns, and various weather conditions. From the land-
scape management point of view, an interesting question is what should be the size
of the area that should be covered by biogeochemical barriers to efficiently control
diffuse pollution. The answer will be provided in three steps that reflect varying
degrees of complexity. The first step concerns the evaluation of the effective width
of the biogeochemical barrier. The second step is the functional relationship between
buffer zone area and output of nitrates from the watersheds. The third step deals
with the management of nitrogen storing capacities in shelterbelts.
Using the model of solar energy partitioning for various components of the heat
balance of a large area incorporating meteorological characteristics and parameter-
ization of plant cover structure developed by Olejnik (1988), K dziora et al. (1989),
Olejnik and K dziora (1991), Ryszkowski and K dziora (1993), Ryszkowski et al.
(1997) estimated evapotranspiration rates of birch and pine afforestations under field
conditions during the plant growth seasons for 10-day intervals. Estimates of evapo-
transpiration were then corrected for values of evaporation in order to obtain only
plant stand transpiration estimates. Additionally, inputs of ground water from field
into birch or pine afforestations through the 1 m × 2 m phreatic plane were estimated
by special hydrological studies (Ryszkowski et al. 1997). Estimates of transpiration
rates per square meter and the amount of ground water discharged from field into
forest by under-surface flux were used to calculate the length of land band, under
trees of 1-m width, necessary to transpire the incoming water. Thus, the subsurface
water input was divided by the amount of water transpired by plants from 1 square
meter. The length of that band was assumed to constitute an approximation of
shelterbelt width necessary to perform effective removal of incoming mineral forms
of nitrogen. Those calculations rely on the assumption that uptake of nitrates and
ammonium ions by plants is mainly determined by water mass uptake for transpi-
ration and that effects of the absorption by diffusion processes are small.
In these calculations describing a selective performance of plants for uptake,
various mineral forms of nitrogen found in some studies (see, for example, Kirkby
1981, Prusinkiewicz et al. 1996) were not taken into account. 1996 among others).
Regarding selective uptake of nitrogen mineral forms, Prusinkiewicz et al. (1996)
show that in periods of high water consumption the differences between the uptake
of NH
4
+
ions and NO
3
–
ions diminish, while at low water consumption increased
selection for nitrates is observed. One has to keep in mind that because of these
* The annual mean concentrations of N–NO
3
–
in rain varies in the Turew region from 1.7 mg·dm
–3
to
2.2 mg·dm
–3
and ammonium from 2.6 mg·dm
–3
to 5.1 mg·dm
–3
.
˛e
˛e ˛e
0919 ch05 frame Page 130 Tuesday, November 20, 2001 6:25 PM
© 2002 by CRC Press LLC
inaccuracies, this proposed method of nutrient uptake estimation of an intact forest
stand provides only approximations. Width of effective biogeochemical barriers
during the plant growing season was estimated to vary from 5 m to 25 m in birch
afforestation. The season-long mean was equal to 10.4 m. In pine afforestation, the
estimates of effective width of biogeochemical barrier varied from 2.4 m to about
10 m, with an average value of 5.8 m. The differences between means were statis-
tically significant, but the reason for it was probably not differentiated plant uptake
by coniferous and deciduous trees but rather the poor stand of trees in the birch
afforestation (Ryszkowski et al. 1997). One can assume, therefore, that the effective
width of shelterbelt under Turew landscape conditions is about 6 to 8 m. This estimate
was obtained for small slopes of ground water table and thus for slow ground water
fluxes. For greater fluxes (e.g., higher water table slopes), the water will be passing
faster and effectiveness of a given width of shelterbelt will be smaller. Ryszkowski
and K dziora (1993) show that the uptake of ground water by a 10-m wide shelterbelt
or meadow can be so great on a warm and sunny day, having net radiation of 100
W·m
–2
, that flux of ground water is reduced almost completely if the ground water
table steepness is 0.01. Under the same meteorological conditions but with the
ground water table steepness of 0.04, the water flux is reduced by only 33%. These
studies also show that shelterbelts have greater impact on ground water fluxes than
meadow strips of the same width (Ryszkowski and K dziora 1993) which explains
the findings of Haycock and Pinay (1993) that grass riparian zones were less effective
in control of nitrate pollution than were poplar riparian strips. The estimates of buffer
barrier width for control of nitrates found by other scientists range from 5 m to 30
m. Individual estimates were as follows: 5 m (Cooper 1990), 8 m (Haycock and
Burt 1991), 16 m (Jacobs and Gilliam 1985), 19 m (Peterjohn and Correll 1984),
and 30 m (Pinay and Decamps 1988).
Despite different interpretations of these estimates presented by various scientists,
results are quite similar. In view of results obtained in the Turew landscape, efficient
removal of nitrates from ground water is related to their uptake by plants with
transpired water but not mainly with denitrification processes as claimed by many
authors studying riparian vegetation strips.
To disclose the relationship between an area of watershed covered by bio-
geochemical barriers and the output of nitrates, the studies were done on N–NO
3
–
con-
centration in the water discharged in ditches from six small watersheds situated in
the studied landscape (Ryszkowski 2000). The studies were carried out from Novem-
ber 1995 until December 1996. The area of the watershed varied from 75 to 216 ha.
Cultivated fields have hapludalf and glossudalf soils. The watersheds varied with
respect to contribution of arable fields which ranged from 99 to 52% of total area.
Meadows, shelterbelts, and small forests represented the perennial vegetation. Each
watershed was drained by ditch from which water samples were taken every 2 weeks.
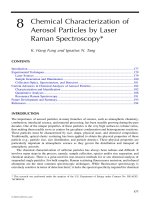
It was found that the exponential relationship characterizes well the relation between
the share of biogeochemical barrier area in total watershed and N–NO
3
–
concentra-
tions in draining ditches (Figure 5.2). During the entire plant growing season two
very intense rainfalls occurred. During the first 10 days of May, 1996, very heavy
˛e
˛e
0919 ch05 frame Page 131 Tuesday, November 20, 2001 6:25 PM
© 2002 by CRC Press LLC
Figure 5.2 Influence of plant cover structure (x) on N–NO
3
–
concentration (y) in water output
from small drainage basins.
Winter season
y = 10.626e
-0.035
R
2
= 0.9616
0
2
4
6
8
10
12
14
16
0 5 10 15 20 25 30 35 40 45 50
Share of nonarable area [%]
N-NO
3
[mg· l
-1
]
y = 8.6287e
-0.05
R
2
= 0.8114
0
2
4
6
8
10
12
14
16
0 1020304050
Share of nonarable area [%]
N-NO
3
[mg ·l
-1
]
Plant growth season excluding heavy rains
y = 14.251e
-0.02
R
2
= 0.9101
0
2
4
6
8
10
12
14
16
0 101520253035404550
Share of nonarable area [%]
N-NO
3
[mg· l
-1
]
Heavy rains during plant growth season
5
0919 ch05 frame Page 132 Tuesday, November 20, 2001 6:25 PM
© 2002 by CRC Press LLC
rains amounted to 106.4 mm, and at the beginning of July there was a second heavy
rainfall of 111.1 mm. Measurements of N–NO
3
–
concentrations in ditch water runoff
associated with these precipitation events were analyzed separately because of the
appearance of intense surface flows. The exponent of the equation characterizing
the relationship between the share of buffer zones in the total area of watershed and
N–NO
3
–
concentration was higher for the plant growing season than for winter
(Figure 5.2). This result can again be interpreted as caused by transpiration activity
of plants — transpiring plants take up nutrients from soil solutions. Thus, greater
area coverage by perennial plants with high transpiration rates shows larger uptake
of nutrients and greater purification effect exerted by plants on diffuse pollution by
nitrates. The lowest exponent value was found when heavy rains occurred. It seems
that concentrated surface runoff caused by heavy rains masks to some extent the
effects of biogeochemical barriers. Nevertheless, one can find a correlation between
N–NO
3
–
concentrations and buffer zone areas even in the case of heavy rainfall
(Figure 5.2).
The finding that the relationship between the share of biogeochemical barrier
areas and nitrate concentration shows exponential character has an important bearing
on landscape management practice. The small area under planted shelterbelts or
grass strips shows unproportionally high control effects compared with those gained
when it is extended to a larger size. That implication is true, of course, when
biogeochemical barriers are strategically distributed with regard to directions of
water runoff from the watershed. Permanent vegetation located in one patch will
not exert such a control effect as would a network of shelterbelts and grass strips
of the same area size. The network of biogeochemical barriers enables, therefore,
optimization of the area withdrawn from agricultural production with arable land
with respect to the economic issues of farming. In other words, the knowledge of
the exponential effect exerted by the area under shelterbelts on water cleansing can
help make economic decisions about the area of land that should be withdrawn from
agricultural production for introduction of permanent vegetation strips.
Uptake of both nitrogen mineral forms by plants and the subsequent formation
of NH
4
+
ions during biomass decomposition play a crucial role in regulation of
nitrogen cycling in an ecosystem. One can therefore hypothesize that when
NH
4
+
released during decomposition of organic nitrogen overcomes its storage in
long-term withdrawal processes (incorporation into humus or in woody tissues) as
well as its maintenance in dynamic recycling between various biota (plants,
microbes, animals), the biogeochemical barrier turns from N sink to its source in
the landscape. It can be presumed, therefore, that when accumulated plant litter is
rapidly decomposed because of favorable conditions, substantial amounts of nitrogen
are leached through the soil profile, and its concentration will increase in ground
water under the biogeochemical barrier. This situation was documented in studies
on nitrogen leaching from the old, mixed species afforestation (a manor park) located
in the Turew agricultural landscape. The park is overgrown by a stand of very old
trees that has existed as a park for more than 200 years, and there are some
pedological indications that its territory was never tilled. The upper part of the park
0919 ch05 frame Page 133 Wednesday, November 21, 2001 1:51 PM
© 2002 by CRC Press LLC
is located on hapludalf soils. The park is kept as a nature reserve and no management
practices are carried out. Along the direction of ground water flux from the cultivated
field, through the park and then to the pond, piezometers were installed for sampling
ground water chemistry. It was dry in 1996, and the decomposition rate of litter was
low, especially low in autumn and winter, which resulted in accumulation of plant
litter. After the fall of leaves, the average mass of litter reached 641 g·m
–2
(Table 5.11). There were heavy rains in the summer of 1997; in June precipitation
was 67.7 mm, in July 169.3 mm, and in August 139.4 mm, and some flooding was
experienced. The total amount of nitrogen released from litter in plant growth in the
period March 21–October 30, 1997 was estimated at 15.33 g·m
–2
or 153 kg N·ha
–1
,
which is equal to a very high dose of nitrogen application in fertilizer. The decom-
position rate was estimated by exposition of known mass of litter in mesh bags, and
the rate was calculated assuming exponential decay — W
t
mass of litter after t days
and W
o
mass at the time of exposition, t time in days.
Studies on the contents of nitrogen mineral forms in the total unsaturated zone
of hapludalf soils showed a constant decrease from May 26, 1997 to March 30, 1998
from 12.5 g N·m
–2
to 1.4 g N·m
–2
. The share of N–NO
3
–
in total mineral form
appearing in the unsaturated zone was 54% in May and 66% in March. But nitrifi-
cation transformations of mineral nitrogen resulted in a preponderance of
N–NO
3
–
concentrations in ground water under hapludalf soils (Table 5.12), although
in the unsaturated soil zone only a slight dominance of N–NO
3
–
was detected.
The dominance of N–NO
3
–
over NH
4
+
ions in ground water increased with the
distance from the edge of the park indicating intensive processes of nitrification of
large amounts of nitrogen released in decomposition processes, although some
contribution of N–NO
3
–
from rain was possible. Intensive nitrification was also con-
firmed by the decrease in organic nitrogen. However, the most important result of
this study is the finding that high inputs of mineral nitrogen from decomposing
organic biomass resulted in increased N–NO
3
–
, which indicates an intensive leaching
of nitrogen. Accumulation of litter can therefore convert shelterbelt from a nitrogen
sink into a nitrogen source. Removal of plant debris from the shelterbelt floor is
therefore needed to maintain its control functions for diffuse pollution.
Table 5.11 Nitrogen Loss from Litter in Park Afforestation Located
on Hapludalf Soils
Period
Decomposition
Rate k of Litter/day
(W
t
= W
o
e
–kt
)
Average Mass
of Litter
(g·m
–2
)
Loss of
Nitrogen
(mg·dm
–2
·24h)
April 23–June 18, 1996 0.0032 483.1 43.6
July 15–September, 1996 0.0042 312.2 27.0
November 28, 1996–
March 27, 1997
0.0034 641.0 31.2
May 27–July 22, 1997 0.0046 464.0 94.1
September 15–
November 10, 1997
0.0038 285.8 53.9
Source: Z. Bernacki (unpublished data).
0919 ch05 frame Page 134 Tuesday, November 20, 2001 6:25 PM
© 2002 by CRC Press LLC
Results of long-term studies in the Turew landscape recommend the following
guidelines for control of diffuse pollution (Ryszkowski 1998):
• The ground water table should be within the direct or indirect (capillary ascension)
reach of plant root systems.
• Better control efficiency is obtained when the shelterbelt is composed of multiple
tree species rather than one species.
• With less slope of the ground water table and hydraulic conductivity a narrower
shelterbelt can be installed.
• Accumulated litter in shelterbelts should be removed.
• A network of shelterbelts is recommended.
• Other biogeochemical barriers, such as stretches of meadows, small mid-field
wetlands or ponds, riparian buffer strips, and diversified crop rotation patterns all
perform functions of diffuse pollution control.
PROSPECTS FOR CONTROL OF THE DIFFUSION POLLUTION
THROUGH MANAGEMENT OF LANDSCAPE STRUCTURE
Diffuse pollution was recognized recently as a worldwide threat, and the need
for its control is recognized in an increasing number of countries. For example, the
European Union, revising its environment policy in 1996, stressed the need for a
fundamental shift in its priorities from environmental protection legislation to using
new policy instruments for pursuing environmental problems. One of the principal
issues addressed is a clear need to tackle growing problems of ground water pollu-
tion, especially nitrate pollution of water reservoirs both underground and on the
surface. Despite much environmental legislation, for example, the nitrogen directive
of 1992, the success of implementation thus far is low, as 87% of agricultural area
in Europe has a nitrate concentration above the guideline level of 25 mg·dm
–3
and
22% surpass maximum admissible concentrations of 50 mg·dm
–3
(Com 1999). In
the U.S., programs aimed at controlling diffuse pollution have been proposed within
the Conservation Research Program and focus on implementations of riparian forest
strips (FSA 1997, Lowrance 1997).
Table 5.12 Annual Mean Concentrations of N–NO
3
–
, N–NH
4
+
and Organic Nitrogen (mg·dm
–3
) in Ground Water
Seeping through Old Afforestations Calculated
from Monthly Samples in 1997
Form of Nitrogen
Location of Piezometers in Distance
from the Field-Park Boundary (m)
0 16.5 62
N–NO
3
–
5.3 6.4 14.2
N–NH
4
+
3.1 3.1 2.9
Total mineral nitrogen 8.4 9.5 17.1
Dissolved organic nitrogen 7.4 5.6 4.5
0919 ch05 frame Page 135 Tuesday, November 20, 2001 6:25 PM
© 2002 by CRC Press LLC