Kinetics of Materials - R. Balluff S. Allen W. Carter (Wiley 2005) WW Part 7 pot
Bạn đang xem bản rút gọn của tài liệu. Xem và tải ngay bản đầy đủ của tài liệu tại đây (2.83 MB, 40 trang )
9.2:
GRAIN BOUNDARIES
221
9.2.3
The mechanisms by which fast grain-boundary diffusion occurs are not well estab-
lished at present. There is extensive evidence that
a
net diffusional transport of
atoms can be induced along grain boundaries, ruling out the ring mechanism and
implicating defect-mediated mechanisms as responsible for grain-boundary diffu-
sion [13]. Due to the small amount of material present in the grain boundary,
it
has not been possible,
so
far, to gain critical information about defect-mediated
processes using experimental techniques. Recourse has been made to computer
simulations which indicate that vacancy and interstitial point defects can exist in
the boundary core as localized bona fide point defects (see the review by Sutton and
Balluffi [4]). Calculations also show that their formation and migration energies are
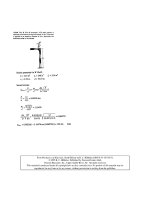
often lower than in the bulk crystal. Figure
9.9
shows the calculated trajectory of
a vacancy in the core of a large-angle tilt grain boundary in b.c.c. Fe. Calculations
showed that vacancies were more numerous and jump faster in the grain boundary
than in the crystal, indicating a vacancy mechanism for diffusion in this particular
boundary. However, there is an infinite number of different types of boundaries,
and computer simulations for other types of boundaries indicate that the dominant
mechanism in some cases may involve interstitial defects [4,
121.
During defect-mediated grain-boundary diffusion, an atom diffusing in the core
will move between the various types of sites in the core. Because various types of
jumps have different activation energies, the overall diffusion rate is not controlled
by a single activation energy. Arrhenius plots for grain-boundary diffusion therefore
should exhibit at least some curvature. However, when the available data are of only
moderate accuracy and exist over only limited temperature ranges, such curvature
may be difficult to detect. This has been the case
so
far with grain-boundary
diffusion data, and the straight-line representation of the data in the Arrhenius
Mechanism
of
Fast Grain-Boundary Diffusion
Boundary
midplane
[ooi]
Figure
9.9:
Calculated atom jumps in the core of
a
C5
symmetric
(001)
tilt boundary in
b.c.c. Fe. A
pair-potential-molecular-dynamics
model was employed. For purposes
of
clarity.
the scales used in the figure are
[I301
:
[310]
:
[OOT]
=
1
:
1
:
5.
All jumps occurred in the
fast-diffusing core region. Along the bottom, a vacancy was inserted at
B.
and subse uently
executed the series
of
jumps shown. The tra'ectory was essentially parallel to the tjt axis.
Near the center
of
the figure, an atom in a
b
site jumped into an interstitial site at
I.
At
the top an atom jumped between
B,
I
and
B'
sites.
From Balluffi
et
al.
[14].
222
CHAPTER
9
DIFFUSION ALONG CRYSTAL IMPERFECTIONS
plot in Fig. 9.3 must be regarded
as
an approximation that yields an effective
activation energy,
EB,
for the temperature range of the data. Some evidence for
curvature of Arrhenius plots for grain-boundary diffusion has been reviewed
[4].
9.3
DIFFUSION ALONG DISLOCATIONS
As with grain boundaries, dislocation-diffusion rates vary with dislocation struc-
ture, and there is some evidence that the rate is larger along a dislocation in the
edge orientation than in the screw orientation [15]. In general, dislocations in close-
packed metals relax by dissociating into partial dislocations connected by ribbons
of stacking fault as in Fig. 9.10 [16]. The degree of dissociation is controlled by
the stacking fault energy. Dislocations in A1 are essentially nondissociated because
of
its high stacking fault energy, whereas dislocations in Ag are highly dissociated
because of its low stacking fault energy. The data in Fig. 9.1 (averaged over the
available dislocation orientations) indicate that the diffusion rate along dislocations
in f.c.c. metals decreases as the degree of dislocation dissociation into partial dislo-
cations increases. This effect of dissociation on the diffusion rate may be expected
because the core material in the more relaxed partial dislocations is not as strongly
perturbed and “loosened up’’ for fast diffusion, as in perfect dislocations.
In Fig. 9.1,
*DD
for nondissociated dislocations is practically equal to
*DB,
which
indicates that the diffusion processes in nondissociated dislocation cores and large-
angle grain boundaries are probably quite similar. Evidence for this conclusion
also
comes from the observation that dislocations can support a net diffusional transport
of atoms due to self-diffusion [15]. As with grain boundaries, this supports a defect-
mediated mechanism.
The overall self-diffusion in a dislocated crystal containing dislocations through-
out its volume can be classified into the same general types of regimes
as
for a
polycrystal containing grain boundaries (see Section 9.2.1). Again, the diffusion
may be multiple
or
isolated, with
or
without diffusion in the lattice, and the dis-
locations may be stationary
or
moving. However, the critical parameters include
*DD
rather than
*DB
and the dislocation density rather than the grain size. The
multiple-diffusion regime for a dislocated crystal is analyzed in Exercise 9.1.
Figure 9.11 shows a typical diffusion penetration curve for tracer self-diffusion
into a dislocated single crystal from an instantaneous plane source at the sur-
face [17]. In the region near the surface, diffusion through the crystal directly
from the surface source is dominant. However, at depths beyond the range at
,Stacking fault
ribbon
Partial
f
2
Partial
dislocation
1
dislocation 2
Figure
9.10:
partial dislocations separated
by
a
ribbon
of
stacking fault.
Dissociated lattice dislocation in f.c.c. metal. The structure consists of two
9.4
FREE
SURFACES
223
Dislocation
pipe diffusion
C
e
Penetration depth
-w
Figure
9.11:
Typical penetration curve for tracer self-diffusion from a free surface at
tracer concentration
csurf
into a single crystal containing dislocations. Transport near the
surface is dominated by diffusion in the bulk; at greater depths, dislocation pipe diffusion is
the major transport path.
which atoms can be delivered by crystal diffusion alone, long penetrating “tails”
are present, due to fast diffusion down dislocations with some concurrent spreading
into the adjacent lattice and no overlap of the diffusion fields of adjacent dislo-
cations. This behavior corresponds to the dislocation version of the
B
regime in
Fig.
9.4.
9.4
DIFFUSION ALONG FREE SURFACES
The general macroscopic features of fast diffusion along free surfaces have many
of the same features as diffusion along grain boundaries because the fast-diffusion
path is again a thin slab of high diffusivity, and
a
diffusing species can diffuse in
both the surface slab and the crystal and enter or leave either region. For example,
if a given species is diffusing rapidly along the surface,
it
may leak into the adjoining
crystal just as during type-B kinetics for diffusion along grain boundaries. In fact,
the mathematical treatments of this phenomenon in the two cases are similar.
The structure
of
crystalline surfaces is described briefly in Sections
9.1
and
12.2.1
and in Appendix B. All surfaces have a tendency to undergo a “roughening” tran-
sition at elevated temperatures and
so
become general. Even though a considerable
effort has been made, many aspects of the atomistic details of surface diffusion are
still unknowns6
For singular and vicinal surfaces at relatively low temperatures, surface-defect-
mediated mechanisms involving single jumps of adatoms and surface vacancies are
pred~minant.~ Calculations indicate that the formation energies of these defects
are of roughly comparable magnitude and depend upon the surface inclination [i.e.,
(hkl)].
Energies of migration on the surface have also been calculated, and in
most cases, the adatom moves with more difficulty. Also, as might be expected,
the diffusion on most surfaces is anisotropic because of their low two-dimensional
symmetry. When the surface structure consists
of
parallel rows of closely spaced
atoms, separated by somewhat larger inter-row distances, diffusion is usually easier
parallel to the dense rows than across them. In some cases,
it
appears that the
60ur
discussion follows reviews
by
of Shewmon
[18]
and Bocquet et al.
[19].
7Adatoms, surface vacancies, and other features of surface structure are depicted in Fig.
12.1
224
CHAPTER
9:
DIFFUSION
ALONG
CRYSTAL
IMPERFECTIONS
transverse diffusion occurs by a replacement mechanism in which an atom lying
between dense rows diffuses across a row by replacing an atom in the row and
pushing the displaced atom into the next valley between dense rows. Repetition of
this process results in a mechanism that resembles the bulk interstitialcy mechanism
described in Section
8.1.3.
In addition, for vicinal surfaces, diffusion rates along
and over ledges differs from those in the nearby singular regions.
At more elevated temperatures, the diffusion mechanisms become more complex
and jumps to more distant sites occur, as do collective jumps via multiple defects.
At still higher temperatures, adatoms apparently become delocalized and spend
significant fractions of their time in “flight” rather than in normal localized states.
In many cases, the Arrhenius plot becomes curved at these temperatures (as in
Fig.
9.1),
due
to
the onset
of
these new mechanisms. Also, the diffusion becomes
more isotropic and less dependent on the surface orientation.
The mechanisms above allow rapid diffusional transport of atoms along the sur-
face. We discuss the role of surface diffusion in the morphological evolution of
surfaces and pores during sintering in Chapters
14 and
16,
respectively.
Bibliography
1.
N.A. Gjostein. Short circuit diffusion. In
Diffusion,
pages 241-274. American Society
for Metals, Metals Park, OH, 1973.
2. I. Herbeuval and M. Biscondi. Diffusion of zinc in grains of symmetric flexion
of
aluminum.
Can. Metall. Quart.,
13(1):171-175, 1974.
Diffusion in ceramics. In R.W. Cahn,
P.
Haasen, and
E.
Kramer,
editors,
Materials Science and Technology-A Comprehensive Treatment,
volume
11,
pages 295-337, Wienheim, Germany, 1994. VCH Publishers.
4. A.P. Sutton and R.W. Balluffi.
Interfaces
in
Crystalline Materials.
Oxford University
Press, Oxford, 1996.
5. E.W. Hart.
On the role of dislocations in bulk diffusion.
Acta Metall.,
5(10):597,
1957.
6.
L.G. Harrison. Influence of dislocations on diffusion kinetics in solids with particular
reference to the alkali halides.
Trans. Faraday Soc.,
57(7):1191-1199, 1961.
7.
D.
Turnbull. Grain boundary and surface diffusion. In J.H. Holloman, editor,
Atom
Movements,
pages 129-151, Cleveland,
OH,
1951.
American Society
for
Metals. Spe-
cial Volume
of ASM.
8. J.W. Cahn and R.W. Balluffi. Diffusional mass-transport in polycrystals containing
stationary
or
migrating grain boundaries.
Scripta Metall. Mater.,
13(6):499-502, 1979.
9. I. Kaur and W. Gust.
Fundamentals of Grain and Interphase Boundary Diffusion.
Ziegler Press, Stuttgart, 1989.
10.
J.C. Fisher. Calculation of diffusion penetration curves for surface and grain boundary
diffusion.
J.
Appl. Phys.,
22(1):74-77, 1951.
11.
J.C.M. Hwang and R.W. Balluffi. Measurement of grain-boundary diffusion at low-
temperatures by the surface accumulation method
1.
Method and analysis.
J.
Appl.
12.
Q.
Ma and R.W. Balluffi. Diffusion along
[OOl]
tilt boundaries in the Au/Ag system
1.
Experimental results.
Acta Metall.,
41(1):133-141, 1993.
13.
R.W. Balluffi. Grain boundary diffusion mechanisms in metals. In G.E. Murch and
AS.
Nowick, editors,
Diffusion
in
Crystalline Solids,
pages 319-377, Orlando, FL,
1984. Academic Press.
3.
A. Atkinson.
Phys.,
50(3):1339-1348, 1979.
EXERCISES
225
14.
R.W. Balluffi,
T.
Kwok, P.D. Bristowe, A. Brokman, P.S.
Ho,
and
S.
Yip. Deter-
mination of the vacancy mechanism for grain-boundary self-diffusion by computer
simulation.
Scripta
Metall.
Mater.,
15(8):951-956, 1981.
On measurements of self diffusion rates along dislocations in f.c.c.
metals.
Phys. Status Solidi,
42(1):11-34, 1970.
16.
R.E. Reed-Hill and R. Abbaschian.
Physical Metallurgy Principles.
PWS-Kent,
Boston,
1992.
17.
Y.K.
Ho and P.L. Pratt. Dislocation pipe diffusion in sodium chloride crystals.
Radiat.
18.
P.
Shewmon.
Diffusion
in
Solids.
The Minerals, Metals and Materials Society, War-
rendale, PA,
1989.
19.
J.L.
Bocquet,
G.
Brebec, and Y. Limoge.
Diffusion in metals and alloys. In R.W.
Cahn and
P.
Haasen, editors,
Physical Metallurgy,
pages
535-668.
North-Holland,
Amsterdam, 2nd edition,
1996.
15.
R.W.
Balluffi.
Eff.,
75~183-192, 1983.
EXERCISES
9.1
In a Type-A regime, short-circuit grain-boundary self-diffusion can enhance
the effective bulk self-diffusivity according to Eq. 9.4. A density of lattice
dislocations distributed throughout a bulk single crystal can have a similar
effect if the crystal diffusion distance for the diffusing atoms is large compared
with the dislocation spacing.
Derive an equation similar
to
Eq. 9.4 for the effective bulk self-diffusivity,
(*D),
in the presence of fast dislocation diffusion. Assume that the dislocations are
present at a density,
p,
corresponding to the dislocation line length in a unit
volume
of
material.
Solution.
During self-diffusion, the fraction of the time that a diffusing atom spends
in dislocation cores is equal to the fraction of all available sites that are located in
the dislocation cores.
This fraction will be
7
=
p7d2/4.
The mean-square displace-
ment due to self-diffusion along the dislocations is then
*DDqt,
while the corresponding
displacement in the crystal is
*DxL(l
-
7)t.
Therefore,
(*D)t
=
*DXL(l
-
7)t
+
*DD7t
(9.17)
and because
7
<<
1,
(9.18)
p7rP
(*D)
=
*DxL
+
-
*DD
4
9.2
Exercise 9.1 yielded an expression, Eq. 9.18, for the enhancement
of
the ef-
fective bulk self-diffusivity due to fast self-diffusion along dislocations present
in the material at the density,
p.
Find a corresponding expression for the
enhancement of the effective bulk self-diffusivity of solute atoms due to
fast
solute self-diffusion along dislocations. Assume that the solute atoms segre-
gate to the dislocations according
to
simple McLean-type segregation where
cf/cf"
=
k
=
constant, where
cf
is the solute concentration in the disloca-
tion cores and
cfL
is the solute concentration in the crystal.
Solution.
Because the fraction of solute sites in the dislocations is small, the number
of occupied solute-atom sites (per unit volume) in the crystal is
cgL,
and the number of
226
CHAPTER
9:
DIFFUSION
ALONG
CRYSTAL
IMPERFECTIONS
occupied sites in the dislocations is
pd2kc?XL/4.
The fraction of time that a diffusing
solute atom spends in dislocation cores is then
17
=
p7d2k/4.
Therefore, following the
same argument as in Exercise
9.1,
(*Dz)t
=
*D,””(l
-
v)t
+
*Dpqt (9.19)
and thus
(*D2)
=
*DfL
+
@
*Df
(9.20)
4
9.3
For Type-B diffusion along a grain boundary, Eq. 9.9, which holds for self-
diffusion, takes the form of Eq. 9.15 for solute diffusion when simple McLean-
type segregation occurs with
cf/cgL
=
k.
Show that this causes Eq. 9.13,
which holds for self-diffusion, to take the form
(9.21)
for solute diffusion.
Solution.
As
indicated in the text, Eq.
9.9
must have the form of Eq.
9.15
in order
to satisfy the segregation condition
k
=
cf/c?”
at the boundary slab. Equation
9.10
then becomes
Equation
9.11
becomes
[
-
(A)
Yl]
B
c2
(yi,ti)
=
exp
(9.23)
Equation
9.12
becomes
cz
XL
(zl,yl,tl)
=
-exp
1
[-
(A)”*
YI]
[1
-erf
-$)I
(9.24)
k
and, finally, Eq.
9.13
becomes
(9.25)
9.4
As
described in Section 9.2.2, grain-boundary diffusion rates in the Type-C
diffusion regime can be measured by the surface-accumulation method illus-
trated in Fig. 9.12. Assume that the surface diffusion is much faster than the
grain-boundary diffusion and that the rate at which atoms diffuse from the
%ource” surface to the “accumulation” surface is controlled by the diffusion
rate along the transverse boundaries. If the diffusant, designated component
2,
is initially present on the source surface and absent on the accumulation
surface and the specimen is isothermally diffused, a quasi-steady rate of ac-
cumulation of the diffusant is observed on the accumulation surface after a
short initial transient. Derive a relationship between the rate of accumulation
EXERCISES
227
and the parameter
SDF
that can be used to determine
SDf
experimentally.
Assume that each grain is a square of side
d
in the plane of the surface.
c
Source
surface
Fil
thi
Accumulation surface
Figure
9.12:
diffusion.
Transport
of
diffusant
through
a thin polycrystalline film
by
grain-boundary
Solution.
Because of the fast surface diffusion, the concentrations of the diffusant
on both surfaces are essentially uniform over their areas. After the initial transient, the
quasi-steady rate (per unit area of surface)
at
which the diffusant diffuses along the
transverse boundaries between the two surfaces is
Here,
d
is the average grain size of the columnar grains,
JB
is the diffusional flux
along the grain boundaries,
dcB/dx
=
[cB(0)
-
cB(I)]
/I,
where
cB(0)
and
cB(I)
are
the diffusant concentrations in the boundaries at the source surface and accumulation
surface, respectively, and
I
is the specimen thickness. In the early stages,
cB(I)
=
0
and, therefore, to a good approximation,
B
Id
dN
6D2
=
-
-
2cB(0)
dt
(9.27)
All quantities on the right-hand side of Eq.
9.27
are measurable, which allows the
determination of
bDf
[12].
9.5
Using the result of Exercise 9.1 and data in Fig. 9.1, estimate the density
of
dissociated dislocations necessary to enhance the average bulk self-diffusivity
by a factor of 2 at
Tm/2,
where
T,
is the absolute melting temperature of the
material.
Note:
typical dislocation densities in annealed f.c.c. metal crystals
are in the range 106-108
cm-2.
Solution.
Equation
9.18
may be solved for
p
in the form
(9.28)
It
is estimated from Fig.
9.1
that
*DD(dissoc)/*DXL
=
3
x
lo6
at
Tm/T
=
2.0.
Also,
6
%
6
x
lo-*
cm-*. Using these values and
(*D)/*DxL
=
2
in Eq.
9.28,
p
E
10'
cmP2
Therefore,
it
appears that the dislocations could make a significant contribution to
diffusion under many common conditions.
228
CHAPTER
9:
DIFFUSION
ALONG
CRYSTAL IMPERFECTIONS
9.6
The asymmetric small-angle tilt boundary in Fig.
B.5a
consists of an array
of parallel edge dislocations running parallel to the tilt axis. During diffusion
they will act as fast diffusion “pipes.” Show that fast self-diffusion along this
boundary parallel to the tilt axis can be described by an overall boundary
diffusivity,
e
(9.29)
lr
4
where
b
is the magnitude of the Burgers vector and
6’
is the tilt angle.
sin
4
+
cos
4
b
*DB(para)
=
-
*DD6
Use
*DD
>>
*DL
(9.30)
Solution.
As
usual, take the boundary as a slab that is
6
thick. In considering diffusion
along the tilt axis, any contribution of the crystal regions in the slab can be neglected
and only the contributions of the dislocation pipes are included because
*DD
>>
*DxL.
The flux through a unit cross-sectional area of the boundary slab
is
then
(9.31)
where the first bracketed term is the flux along
a
single pipe and the second
is
the
number of pipes per unit area of the boundary slab. The desired expression
is
obtained
by equating this result with
J
=
-
*DB(para)
&/ax
and solving for
*DB.
9.7
Self-diffusion along the boundary in Exercise
9.6
is highly anisotropic because
diffusion along the tilt axis (parallel to the dislocations) is much greater than
diffusion transverse to it (i.e., perpendicular to the dislocations but still in
the boundary plane). Find an expression for the anisotropy factor,
*D
(para)
*D (transv)
(9.32)
where *DB (transv) is the boundary diffusivity in the transverse direction.
Solution.
The transverse diffusion rate is controlled by the relatively slow crystal
diffusion rate because the diffusing atoms must traverse the patches of perfect crystal
between the dislocation pipes. Therefore, when the dislocations are discretely spaced,
a good approximation is the simple result
*DB
(para)
-
*DB (para)
-
*DB(transv) *DxL
(9.33)
CHAPTER
10
DIFFUSION IN NONCRYSTALLINE
M
AT
E
R
I
A LS
Noncrystalline materials exist in many different forms.
A
huge variety of atomic
and molecular structures, ranging from liquids to simple monatomic amorphous
structures to network glasses to dense long-chain polymers, are often complex and
difficult to describe. Diffusion in such materials occurs by a correspondingly wide
variety of mechanisms, and is, in general, considerably more difficult to analyze
quantitatively than is diffusion in crystals.
The understanding of diffusion in many noncrystalline materials has lagged be-
hind the understanding of diffusion in crystalline material, and a unified treatment
of
diffusion in noncrystalline materials is impossible because of its wide range of
mechanisms and phenomena. In many cases: basic mechanisms are still controver-
sial or even unknown. We therefore focus on selected cases, although some of the
models discussed are still under development and not yet firmly established.
10.1
FREE-VOLUME MODEL FOR SELF-DIFFUSION IN LIQUIDS
Self-diffusion in simple monatomic liquids at temperatures well above their glass-
transition temperatures may be interpreted in a simple manner.' Within such
liquids, regions with
free
volume
appear due to displacement fluctuations. Occa-
sionally, the fluctuations are large enough to permit diffusive displacements.
'This section closely follows Cohen and Turnbull's original derivation
[l].
The original paper
should be consulted for further details.
Kinetics
of
Materials.
By Robert
W.
Balluffi, Samuel
M.
Allen, and
W.
Craig Carter.
229
Copyright
@
2005 John Wiley
&
Sons, Inc.
230
CHAPTER
10:
DIFFUSION
IN
NONCRYSTALLINE
MATERIALS
The
hard-sphere
model
for the liquid serves as a reasonably good approximation
for the atomic interactions [2]. Here, the potential energy between any pair of
approaching particles is assumed to be constant until they touch, at which point it
becomes infinite. On average, the particles in the liquid maintain a volume larger
than that which they would have if they all touched; the resulting volume difference
is the free volume. Each particle effectively traverses a small confined volume within
which the interatomic potentials are essentially flat [3]. The average velocity
of
a
particle in the region of flat potential inside the confining volume is the same as
the velocity of a gas particle. Most .of the time a particular particle is confined
to a particular region. However, there will occasionally be a fluctuation in local
density that opens a space large enough to permit a considerable displacement of the
particle. If another particle jumps into that space before the displaced first particle
returns, a diffusive-type jump will have occurred. Diffusion therefore occurs as a
result of the redistribution of the free volume that occurs at essentially constant
energy because of the flatness of the interatomic potentials.
According to the kinetic theory of gases, the self-diffusivity of a hard-sphere
gas is given by
*DG
=
(2/5)(u)L, where
(u)
is the average velocity and
L
is
the
mean free path
[4].
Because the mean free path of a confined particle in the liquid is
about equal
to
the diameter of its confining volume, the contribution of the confined
particle to the self-diffusivity of the liquid may be written
’
*D(V)
=
Cgeom
a(V)
(u)
(10.1)
where
u(V)
is the diameter of the confining volume,
V
is the free volume associ-
ated with the particle,
(u)
is the average velocity of the particle, and
C,,,,
is a
geometrical constant.It is reasonable to assume that the diffusivity is very small,
*D(V)
=
0,
unless the local free volume
V
exceeds a critical volume,
Vcrit.
There-
fore, the overall diffusivity may be expressed
(10.2)
where
p(V) dV
is the free volume’s probability that it lies between
V
and
V
+
dV.
To determine this probability distribution, consider a system containing
n/
particles
and divide the total range of possible free volumes for a particle into bins indexed
by
i.
Let
Ni(V,)
be the number of particles with free volume
V,.
If
Vfree
is the total
free volume, the condition
Vfree
=
NiV,
(10.3)
i
must hold. The factor
y
accounts for all free-volume overlap between adjacent
particles.
y
lies between zero and one because of the physical limits of complete
and no overlap; its value is probably closer to one. The total number of particles,
N.
is
(10.4)
i
The entropy associated with the number of ways that the free volume can be
distributed at constant energy is
(10.5)
10
1.
FREE-VOLUME
MODEL
FOR
LIQUIDS
231
for bin populations given by
Ni.
The equilibrium probability distribution in Eq. 10.2
is the continuum limit of the bin populations
Ni
that maximize
Sconf
subject to
constraints, Eqs.
10.3
and 10.4. Introducing Lagrange multipliers
p
and
X
for the
total free volume and fixed-number constraints, the extremal conditions are
which, using Stirling's formula
Ni!
x
Ni
In
Ni
and the limit of
Ni
>>
1,
reduces to
Ni
=
e X/ke-fi7V%/k (10.7)
The constraints Eqs. 10.3 and 10.4 determine the Lagrange multipliers. With
Eq. 10.7,
(10.8)
and
The average free volume per particle is
(afree)
=
Vfree/N
=
k/p.
Therefore, com-
parison of the average free volume to its definition from a probability distribution,
shows that the probability distribution p(V) must be proportional to
y
exp[-ypV/k]
=
y
exp[-yV/(Rfree)]. The proportionality factor can be determined by setting the
sum of probabilities equal to one, and
(10.11)
The probability distribution, Eq. 10.11, can be used in Eq. 10.2
as
an estimate
for evaluating *DL. Above the critical free volume Vcrit, *D(V) is probably nearly
constant; therefore,
(10.12)
*D(vcrit)
e-y~CP't/(~free)
=
c
geom
U(vcrit)(u) e-
y~crit
/(afree)
Equation
10.12
matches diffusivities measured in simple liquids if the character-
istic "cage" diameter, u(Vcrit), is approximately the particle diameter and yVcrit is
approximated by the particle volume
[l].
*DL
is not thermally activated-it does
not exhibit Arrhenius behavior as does, for example, the diffusivity in crystals,
because
(u)
0;
T1/*and
(afree)
increases approximately linearly with
T
[4].
Less
approximate models for diffusion in liquids have been reviewed by Frohberg
[5].
232
CHAPTER
10
DIFFUSION
IN
NONCRYSTALLINE
MATERIALS
10.2 DIFFUSION
IN
AMORPHOUS METALS
Amorphous metallic alloys
(metallic glasses)
can be produced by rapid cooling
(quenching) from the liquid phase. If the initially stable liquid avoids solidification
by crystallization by being quenched rapidly below its ordinary melting tempera-
ture,
T,,
it first becomes a supercooled liquid, and then, at a still lower tempera-
ture, it undergoes a
glass transition
to an amorphous glassy state
as
in Fig.
10.1.
Occurring over a range of temperatures that is dependent upon the cooling rate,
the glass transition is characterized by an abrupt change in the rate at which the
volume and other physical properties change with decreasing temperature. The
glass transition temperature,
T,,
which occurs at a given cooling rate, is obtained
from the intersection of the extrapolated cooling curves from well above and well
below the transition. Because the glass transition occurs at a higher temperature
during rapid cooling than during slow cooling, less free volume remains in glasses
formed at low temperatures. Below the glass transition temperature, the combined
effects of the low temperature and the loss
of
free volume cause the initially liquid
material to lose its characteristic fluidity and become relatively rigid and unable to
reorganize itself quickly as the temperature is decreased further (i.e., it becomes a
frozen-in glass).
Temperature
Figure
10.1:
Volume
of
metallic glass during
fast
and relatively slow cooling from the
liquid phase.
T,,
is the melting teinperature;
Tq
is the glass-transition temperature (shown
for both fast and relatively slow cooling).
10.2.1 Self-Diffusion
If
a rapidly cooled metallic glass is reheated and annealed isothermally at a tem-
perature below
T,,
the excess free volume that is frozen-in will anneal out
as
the
system attempts to relax and equilibrate without crystallizing.
The free volume
is mobile and is presumably annihilated when it encounters regions of higher than
average atomic density
[6,
71.
The self-diffusivity that is measured during such
annealing decreases initially. However, it eventually reaches an asymptotic value
and becomes time independent,
as
in Fig.
10.2.
The asymptotic value of the dif-
fusivity is then that of the relaxed glassy state in which the supersaturated excess
volume has annealed out. This dense structure is,randomly packed, and the atoms
are arranged with the highest density compatible with their hard-sphere radii and
10.2:
DIFFUSION
IN
AMORPHOUS
METALS
233
-
h
h
613
K4
Figure
10.2:
Self-diffusion coefficient of 5gFe in amorphous Fe40Ni40B20 during
isothermal annealing below
T,
after rapid quenching from liquid state as in Fig.
10.1.
Arrows
indicate different time scales used at each temperature.
Reprinted from "Tracer Diffusion
of
Fe-
59
in Amorphous FemNimBm,"
J.
Horvath and H. Mehrer,
1986,
Crystal Lattice Defects and
Amorphous
Materials,
Taylor and Francis,
[8].
lack of translational symmetry. Locally, the atoms form various polyhedral units in
definite ratios with neither microcrystallites nor large holes present. Even though
relaxed, this structure is still metastable with respect to the crystalline state.
Extensive measurements show that self-diffusivities in the relaxed glassy state
are time independent and closely exhibit Arrhenius behavior (i.e., ln*D, vs.
1/T
plots appear as essentially straight lines) [8-111. The diffusion therefore is ther-
mally activated (in contrast to self-diffusion in the liquid above
Tg
as described in
Section 10.1).
The mechanism by which the self-diffusion in the relaxed state occurs is not
firmly established at present. However, there are reasons to believe that for certain
atoms in glassy systems, self-diffusion occurs by a direct collective mechanism and
is not aided by point defects in thermal equilibrium as in the vacancy mechanism
for self-diffusion in crystals (Section 8.2.1)
.2
These reasons include:
0
Sudden changes in temperature during diffusion cause instantaneous changes
in the diffusivity
[9,
121.
This result is unexpected if diffusion occurs by a
point-defect mechanism because significant time is required to obtain the new
equilibrium defect concentrations corresponding to the temperature changes.
0
The activation volume for diffusion, as measured by the pressure dependence
of the diffusivity, is zero to within experimental accuracy
[13,
141. This is
unexpected for defect-mediated diffusion, as in such cases, the activation vol-
ume for diffusion should consist of the sum of the volume of formation of the
defect and the activation volume for the defect migration, and this is usually
measurable.
0
Computer simulations of the diffusion process in relaxed FeZr glasses re-
veal diffusion which takes place directly via thermally activated displacement
2The ring mechanism in Section
8.1.1
is an example
of
a direct mechanism.
234
CHAPTER
10
DIFFUSION
IN
NONCRYSTALLINE
MATERIALS
chains like that in Fig. 10.3 [7, 9, 151. These chains do not start at localized
Figure
10.3:
displacement chains.
hlechanism
of
diffusion in amorphous glasses by thermally activated
point defects but in regions where the initial density deviations are small. Fur-
thermore, when the displacement sequences are completed, any large-density
deviations disperse gradually and do not leave behind localized point defects.
The entire displacement process, from beginning to end, involves
a
relatively
large number of atoms and, therefore, is of a collective nature. Such a direct
collective diffusion process, which is spread over a considerable volume and
involves relatively little ion-core overlap and repulsion, presumably occurs
with relatively little volume change, in agreement with the small activation
volume cited above.
0
The observation that the self-diffusion exhibits Arrhenius behavior is consis-
tent with a direct collective mechanism because the thermally activated dis-
placement chains are spread over a considerable number of atomic distances.
Irregularities in the disordered glassy structure are therefore averaged in the
activated state, and all activation energies for displacements are then closely
the same.
0
No
isotope effect is observed (see Eq. 8.31) during self-diffusion in relaxed
glasses
[16,
171. In tracer self-diffusion studies of crystalline materials, where
the atomic displacements that lead to vacancy migration and diffusion are
highly localized, the harmonic model for the isotope effect is justified. How-
ever,
if
the migration process involves a relatively large number of atoms
and is highly collective, this estimate of the effective attempt frequency is
no longer valid. Instead, it is expected that two isotopes diffuse at close
to
the same rates because the mass difference of the two isotopes hardly affects
their jump frequencies when relatively large numbers of atoms are strongly
involved in the activated state.
Further discussion of self-diffusion in relaxed metallic glasses and other disor-
dered systems may be found in key articles
[7,
10,
14, 18, 191.
10.2.2
Diffusion
of
Small
Interstitial Solute Atoms
Small solute atoms in the interstices between the larger host atoms in a relaxed
metallic glass diffuse by the direct interstitial mechanism (see Section 8.1.4). The
host atoms can be regarded as immobile. A classic example is the diffusion of H
solute atoms in glassy Pd80Si20. For this system, a simplified model that retains the
essential physics of a thermally activated diffusion process in disordered systems is
used to interpret experimental measurements
[20-221.
10.2:
DIFFUSION
IN
AMORPHOUS
METALS
235
W
Because many different types of interstitial sites exist in the disordered glassy
structure, the energy of the system varies as an interstitial atom jumps between
the sites. The trace of the energy during successive jumps has the general form
illustrated in Fig. 10.4a, where, for simplicity, the energy at each saddle point is
assumed to be the same [20,
22,
231.
This approximation has the realistic feature
that a diffusing interstitial encounters sites of varying energy and jump barriers of
various heights.
The following quantities will be of use in describing the interstitial self-diffusion
and intrinsic chemical diffusion:
W
N
=
total number of interstitial sites
p
=
fraction of all interstitial sites that are occupied
*p
=
fraction of all sites that are tracer-interstitial occupied
pi
=
fraction of all sites that are type
k
sites (Fig. 10.4a)
pk
=
fraction
of
all sites that are occupied type
k
sites
*pk
=
fraction of all sites that are tracer-occupied type
k
sites
p(k)
=
fraction of type
k
sites that are occupied
E"
The occupation probability at the various sites should follow Fermi-Dirac statis-
tics because each site can accommodate only one interstitial. Therefore,
(10.13)
where
Gk
is the energy corresponding to occupation of the type
k
site and
p
is the
chemical potential of the interstitials [24]. The fraction of all interstitial sites that
are occupied is then
(10.14)
Figure
10.4:
(a)
The energy variation of an amorphous glass with the displacement
of
a diffusing interstitial atom as it jumps between successive interstitial sites.
(b)
A
plot
similar to (a) for interstitial jumping in
a
hypothetical material containing only sites
of
the
reference state and having activation energies corresponding to
E".
236
CHAPTER
10:
DIFFUSION
IN
NONCRYSTALLINE MATERIALS
and the partial concentration,
pk,
can be written
(
10.15)
Also,
cPk=P
(
10.16)
k
A
model for the tracer self-diffusivity
of
the interstitials is now developed for a
system in which the total concentration
of
inert interstitials and chemically similar
radioactive-tracer interstitials is constant throughout the specimen but there is a
gradient in both concentrations. Since the inert and tracer interstitials are randomly
intermixed in each local region,
(10.17)
*Pk
-
*P
Pk
P
-
Therefore, with the use of Eq. 10.15,
(10.18)
In a typical tracer self-diffusion experiment, the tracer concentration probability,
*p,
depends upon position, whereas the total interstitial concentration probability,
p,
does not.
An expression for the tracer self-diffusivity, of the interstitials,
*D,
can be de-
rived by employing the same basic method applied to a crystalline material to
obtain the self-diffusivity given by Eq. 8.19. This involves finding the net flux
of
tracer interstitials jumping through a unit cross-sectional area in the diffusion zone
perpendicular to the concentration gradient. For a crystalline material, this flux is
found by considering the jumping of atoms between well-defined adjacent atomic
planes lying parallel to the unit cross section. This approach, however, cannot be
applied to a glassy material because of the disorder that is present, and therefore
the flux must be determined by a slightly modified method. Consider two thin slabs
in the material, each of thickness
Ax
and having unit area, lying perpendicular to
the concentration gradient along
x.
Slab
1
extends from
zo
-
Ax
to
20,
and slab
2
extends from
xo
to
zo
+
Ax.
Let
I?;,
be the jump rate of a tracer interstitial from
an
i
site to an adjacent empty
i
site. According to Fig. 10.4~~ the activation energy
for such a jump will be
Go
+
Eo
-
Gk,
so
r/
kz
- -
ve-(Go+Eo-Gk)/(kT)
(10.19)
The rate of k-to-i site jumping originating in slab
1
is proportional to the quantity
(P/(Q))Ax
*pk(pp
-
pz)qZ.
In this expression,
(a)
is the average atomic volume
in the glass,
p
is the ratio of interstitial sites to atoms, and
@/(a))
is the number
of interstitial sites per unit volume.
(p,"
-
pz)
is the probability that a site is an
empty
i
site. Making the approximation that all jump distances in the disordered
material are of the same magnitude and equal to
Ax,
the net number of jumps of
all types crossing the
x
=
zo
plane per unit time in the
x
direction is
(10.20)
10.2.
DIFFUSION
IN
AMORPHOUS
METALS
237
where
g
is a purely geometrical constant and the double summation ensures that
all types of different jumps between the various sites are included. The first term
represents the jumps that originate in slab
1
and cross
x
=
xo
in the
x
direction,
while the second term represents the jumps that originate in slab
2
and cross
x
=
xo
in the
-x
direction. During tracer self-diffusion, the total concentration of inert
and tracer interstitial atoms is constant,
so
both p and (pg
-
pi) are independent
of
2.
Making the usual Taylor expansion to evaluate the small difference between
the terms and using Eqs.
10.18
and 10.19,
Using Eq. 10.16 and the fact that zip;
=
1,
ci(pg -pi)
=
1
-
p. Also, using
this result and Eq. 10.15,
Putting these results into Eq. 10.21 then yields
Equation 10.23 can be put into the simpler form
(10.24)
where
*D;
=
g
(Az)'
vexp[-E"/(kT)] is the self-diffusivity in a hypothetical ma-
terial that contains only sites of the reference state with the energy
Go,
and in
which jumps may occur between them with the activation energy
E",
as illustrated
in Fig.
10.4b.
Equation 10.24 is a Fick's-law equation with a tracer interstitial
self-diffusivity corresponding to
(10.25)
Having this result, an expression can be obtained for the "intrinsic" chemical
diffusivity,
DI,
which describes the diffusion arising from an inert-interstitial con-
centration gradient. According to Eqs. 3.35 and 3.42, the flux in such a system
is
-
Also,
p
=
yo
+
IcTlnyp
(10.26)
(10.27)
where the activity coefficient yis generally a function of concentration and therefore
of position. Putting Eq. 10.27 into Eq. 10.26 leads to the Fick's-law-type expression
(
10.28)
238
CHAPTER
10:
DIFFUSION
IN
NONCRYSTALLINE
MATERIALS
and, therefore,
For tracer self-diffusion, a similar initial equation for the flux is
(10.29)
(10.30)
However, in this system, the ideal free energy of mixing of the inert and tracer
interstitials is the only component that varies with x. By taking the derivative of
the free energy to obtain the chemical potential, the x-dependent component of
the chemical potential of the tracer interstitials
is
simply
kT
ln(*p/p), and there-
fore, because
p
is constant, (a*p/dx)
=
(kT/*p)(d*p/dx). Putting this result into
Eq. 10.30,
(10.31)
which is a Fick’s-law-type expression with an interstitial tracer self-diffusivity given
*DI
=*
MkT
(10.32)
Neglecting any small isotope effect,
MI
=*MI,
and comparing Eqs. 10.29 and 10.32,
bY
(10.33)
which
is
of the same form as Eq. 3.13.
The model above has been compared to experimental results for the diffusion of
H
in glassy PdsoSizo by Kirchheim and coworkers
[21,
221.
DI
increases strongly
with increasing
H
concentration as seen in Fig. 10<5. By assuming that the energies
of the interstitial sites follow
a
Gaussian distribution around
a
mean value, good
agreement was obtained between the model and experiment. The increase of
DI
-1 1
-1
3
-5
-4
-3
-2
-1
log
P
Figure
10.5:
Logarithm
of
the diffusivity
of
H
in amorphous PdsoSizo as a function
of
the
H
concentration probability at different temperatures. Points are experimental data.
The curves are the predictions
of
the model leading to
Eq.
10.25.
From Kirchheim
[22].
10
3.
SMALL
ATOMS (MOLECULES)
IN
GLASSY
POLYMERS
239
with
p
arises from the successive saturation of the lower-energy sites as the concen-
tration is increased. This causes a progressive decrease of the activation energy and
a corresponding increase in the diffusivity. For example, at very low concentrations,
essentially all of the interstitials become trapped at the lowest-energy sites and they
engage in long-range diffusion only with difficulty. Further aspects are discussed
elsewhere
[22].
Figure 10.6 plots the tracer diffusivity data for a number of solute species in
glassy Ni80Zr50 as a function of their metallic radius. The diffusivity increases
rapidly as the metallic radius decreases. The relatively rapid diffusion of the small
atoms in this case may result from the fact that they diffuse by the interstitial
mechanism
[lo,
181.
-19
-
h
Ti
-20
N
E
v
P-
-21
I
g
-22
-
-2
3
Metallic
radius
(nm)
Figure
10.6:
Tracer diffusivities in glassy Ni80Zr50
of
various solute atoms as a function
of their size (as measured by their metallic radii)
[25].
Reprinted, by permission, from
H.
Hahn and
R.S. Averback.
"Dependence of tracer diffusion on atomic size in amorphous Ni-Zr,"
Phys.
Rev.
B,
Vol.
37,
p.
6534.
Copyright
01988
by the American Physical Society.
10.3
SMALL ATOMS (OR MOLECULES)
IN
GLASSY POLYMERS
Some small atoms and molecules, such as He, Ar,
COz,
and
Nz,
dissolve in glassy
polymers from the gas phase. These particles then diffuse in the bulk polymer
presumably by occupying interstices in the glassy structure and jumping between
them by the direct interstitial mechanism. The solubilities increase with increasing
partial pressure, and the behavior observed can be well explained on the basis of
a model in which the dissolved species occupy interstitial sites, the site occupancy
obeys Fermi-Dirac statistics, and the site energies are distributed about a mean
value in the form of a Gaussian distribution
[26,
271. The corresponding diffusivities
of these species increase with increasing concentration, in
a
manner similar to the
diffusion of small solute atoms in amorphous metals. This behavior can be explained
by the same interstitial diffusion model. Here, the diffusing particles must again
occupy progressively higher-energy sites as their concentration increases, causing
the average activation energy for diffusion to decrease and the diffusivity to increase.
The diffusion of small particles in glassy polymers therefore appears to be quite
similar to that in glassy metals.
240
CHAPTER
10.
DIFFUSION
IN
NONCRYSTALLINE
MATERIALS
10.4
DIFFUSION OF ALKALI IONS IN NETWORK OXIDE GLASSES
The structure of
a
pure oxide network glass having stoichiometry G203, free
of
any alkali ions, is illustrated in Fig.
10.7a [28].
In this structure, cations are three-
coordinated and the oxygen anions are two-coordinated. In three-dimensional silica
glass, each glass-forming Si4+ cation is enclosed in
a
polyhedron of oxygen anions,
and these polyhedra are arranged in a network lacking special symmetry and peri-
odicity. The oxygen polyhedra share corners, not edges or faces, and each oxygen
ion is covalently bonded to no more than two cations.
The oxide glass structure changes significantly when
modzfyzng
alkali ions are
added,
as
in Fig.
10.7b.
where the
G203
glass has been altered by adding a signifi-
cant amount of the network modifier
M20.
The structure accommodates the net-
work modifier
M+
ions by substitution of three one-coordinated modifier cations for
one three-coordinated glass-forming ion. In three-dimensional silica glass, the ad-
dition
of
Na ions (e.g., via Na2O) causes oxygen ions. previously covalently bonded
to two of the glass-forming Si4+ cations between which
it
formed a
brzdge.
to reduce
this bonding
so
that they become bonded to only one glass-forming cation. These
oxygen ions, called
nonbrzdgzng oxygens,
possess an effective negative charge. The
corresponding positively charged Na’ ions are then ionically bonded to the non-
bridging oxygens, resulting in a partly covalent and partly ionic overall structure.
Studies show that in silica glasses with low concentrations of NazO, the ionically
bound material exists in the form of small isolated patches or
lakes.
As the concen-
tration increases, these patches link and eventually form
a
network of continuous
channels
[29-321.
Continuous percolation networks are present at and above
a
per-
colation threshold of about
16
vol.
%
of modifier.
Na’ ions are highly mobile compared to the glass-forming components and pos-
sess a diffusivity which follows Arrhenius behavior
[21,
26, 29, 31, 331.
Furthermore,
the activation energy for diffusion decreases markedly (and the diffusivity increases
correspondingly) as the modifier concentration is increased, as in Fig.
10.8.
The
Figure
10.7:
(a)
Two-dimensional schematic of pure, oxide network glass
of
composition
Gz03.
Small open circles are glass-forming cations
G3+.
Large open circles represent oxygen
anions.
From Kingery et
a1
[28]
(b)
Schematic
of
glass
as
modified by the addition
of
alkali
hl+
cations (filled small circles). At high modifier-ion content, the modifier ions aggregate and
form high-diffusivity “lakes” or channels in the glass.
Adapted from Greaves
[29]
10.5:
DIFFUSION OF
POLYMER
CHAINS
241
4
0.51
,
,
,.
0.1
0.2
0.3
Figure
10.8:
Activation
energy
for
diffusion
of
Na+
ions
in
sodium silicate
glass
of
composition (Na20),(Si02)1-,
as
a
function
of
Na+
ion
concentration
as
measured by the
fraction
of
NazO,
2.
From
Frischat
[33].
mechanism for the diffusion of the Na’ ions is not thoroughly understood, but the
results above can be explained with a model in which the Na’ ions diffuse in the
modified random-network structure by a direct interstitial mechanism.
To engage in long-range diffusion at low concentrations, the Na’ ions must disso-
ciate themselves from their ionic bonding with the nonbridging oxygens and diffuse
through the interstices in the covalently bonded network glass regions. This gen-
erally requires a relatively large activation energy. At higher concentrations above
the percolation threshold, the Na’ ions diffuse relatively easily along the inter-
stices in the ionically bonded percolation channels with a low activation energy.
As
the modifier concentration increases, the activation energy decreases progressively.
Also, the correlation coefficient decreases as the modifier concentration increases,
due to the increased degree of correlation arising from the restriction of the diffusion
to the narrow channels
[31].
10.5 DIFFUSION OF POLYMER CHAINS
Polymer structure is characterized by long chains of molecules arranged in a wide
variety of ways. Diffusion of these long chains occurs in two important and char-
acteristic situations3 In the first, each chain is essentially isolated and embedded
in a solvent melt made up of much smaller molecules, and the long chains diffuse
by a type of Brownian motion. In the second situation, the long chains are in a
dense entangled arrangement, much like cooked spaghetti, and a given chain can
then only diffuse in the entangled structure by a snakelike process called
reptation.
10.5.1 Structure
of
Polymer Chains
A polymer chain is typically composed of a large number of units (i.e., monomers)
arranged in a chainlike configuration held together by covalent bonds. When the
monomers are identical,
it
is termed a
homopolymer chain.
The chain possesses con-
siderable flexibility since the covalently bonded monomers can change their bonding
angles with one another, allowing the chain to act
as
if were almost “freely jointed.”
This flexibility allows a chain to adopt a huge number of possible configurations.
An important parameter for describing the chain configuration is the mean-square
3For
detailed treatments
of
this topic, see de Gennes
[34,
351
and Lodge et al.
[36]
242
CHAPTER
10
DIFFUSION
IN
NONCRYSTALLINE
MATERIALS
distance between the two ends of the chain
(h2).
This can be approximated using
the
freely jointed chain model,
in which it is assumed that the direction of each bond
between monomers is random. This model ignores the fact that covalent bonds tend
to assume specific angles and also that it is physically impossible for the chain to
bend sharply backward and overlap on itself (i.e it ignores the existence of an
excluded volume
that the flexible chain cannot enter). Nevertheless, the model is a
reasonable first approximation under many conditions and retains much of the es-
sential physics of the problem. If each monomer
is
of
length
b,
a chain consisting of
N
monomers can be constructed by joining them together sequentially end to end.
If the angles at which they are added are at random, the problem of determining
the distance between the ends,
(h2),
is identical to that of finding the mean-square
displacement resulting from a random walk given by Eq.
7.47.
Therefore,
(h2)
=
Nb2
(10.34)
A
typical freely jointed chain will therefore be quite compact since the root-
mean-square value of its end-to-end length,
m
=
fib,
will be small compared
with its length if it were stretched out (i.e.,
Nb,
when
N
is large). Figure
10.9
shows a simulated molecule of polyethylene,
(-CH2-CH2
-)N,
which approximates
a freely jointed configuration.
The relationship
m
0:
N1/’
derived on the basis of the freely jointed model is
often quite satisfactory despite the approximate nature of the model. Even though
the excluded volume clearly exists, its effect can essentially be canceled out under
many circumstances. When the chains are in dilute solution in a
theta solvent.
interactions between the solvent and the chain monomers favor compression of the
chain
so
that the relation
x
N112
is nearly obeyed. On the other hand, in
a “good solvent” where monomer-monomer and monomer-solvent interactions are
closely the same, any interactions favoring compression are absent and the excluded
volume then acts to reduce the degree of compactness of the chain and produce
swelling. In these cases, the relation
K
N3I5
holds to a good approximation.
In the case of homopolar polymer melts where the polymer chains are densely
entangled, the excluded volume does not play an important role in determining
the degree of swelling since each monomer is surrounded by similar monomers, and
is unable to distinguish whether they belong to its own chain or another nearby
chain. Even though the relationship
m
x
N1/2
will hold closely for a given
Figure
10.9:
N
=
50.
Conformation
of
polyethylene.
(-CHz-CHz
-)N.
Degree
of
polymerization
10.5:
DIFFUSION
OF POLYMER
CHAINS
243
type of chain of fixed
N
in different theta solvents and in its melt, the magnitudes
of for the chain will differ.
10.5.2
From a hydrodynamical standpoint, a single isolated chain immersed in a liquid
solvent consisting of relatively small molecules may be regarded as a porous sponge
having a uniform density [35]. Vorticity cannot penetrate this sponge except over
a
certain screening length which is negligible for a long chain. As far as global
properties (such as viscosity and sedimentation) are concerned, the coil possesses
an effective radius,
Rh,
which is proportional to
m.
Using previous results,
Rh
is therefore
Rh
0;
N3/5b
(10.35)
for a chain in a good solvent, and for
a
chain in a theta solvent is
Diffusion
of
Isolated Polymer Chains in Dilute Solutions
Rh
0;
N1/2b
(10.36)
Using this approximation, the diffusivity of the chain is the diffusivity of the effective
sponge of radius,
Rh,
due to its classical
Brownian motion
in the solvent. The
Brownian motion of the sponge is its irregular motion due to random collisions
with surrounding solvent molecules that induce the sponge
to
follow a random
walk. The diffusivity
of
a small particle due to Brownian motion was determined in
the early part of the twentieth century by Einstein, Smoluchowski, and Langevin.
We follow here a more recent description which imagines that the particle (i.e., the
sponge) is embedded in an effectively uniform medium having a viscosity
77
[37].
At the same time, the particle is subjected to random collisions with molecules in
the surrounding medium. The model therefore has a continuum-molecular duality.
The Newtonian force equation for all forces in the
2
direction is
dX
d2
X
dt2
dt
-3-
+
F,
m-
=
(10.37)
where
X
is the instantaneous x-coordinate of the sponge’s position. The first term
in Eq. 10.37 is the usual inertial term
(rn
is the effective mass of the chain). The
second term is the frictional force exerted on the sponge by the viscous medium
and is proportional to the velocity via the friction factor,
F,
as would be expected
on the basis of Stokes’s law. The third term includes all forces associated with
collisions with the surrounding molecules. Multiplying Eq. 10.37 by
X
yields
But
and
d2
X dX
rnx-
dt2
=
-3X-
dt
+
XF,
d2X
1
d
d(X2) dX
dt2
x-=
___
2
dt
[
dt
]
-
(x)
dX
1
d(X2)
x-
=
dt
2
dt
Putting these expressions into Eq. 10.38 then yields
(10.38)
(10.39)
(10.40)
+
XF,
(10.41)
m
d d
(X2) dX .Fd(X2)
2
dt
[
dt
=-2dt
__
~
244
CHAPTER
10:
DIFFUSION
IN
NONCRYSTALLINE
MATERIALS
Next, the mean values of these terms over
a
long period are introduced so that
(10.42)
Now, according to equipartition,
Also.
and
(XF,)
=
0
because the
F,
forces are exerted randomly. Therefore,
where
Equation
10.47
has the solution
mdu
3
2
dt
2
__
+
-U
=
kT
.=(V)
(10.43)
(10.44)
(10.45)
(10.46)
(10.47)
(10.48)
where
A
is constant. The exponential term in Eq. 10.48 is negligible for all times
of interest, and therefore
dt
3
By integrating Eq. 10.49,
2kT
3
(x2)=
-t
(10.49)
(10.50)
Results for the mean-square displacement along
y
and
z
will be the same and,
therefore,
(10.51) (R2)
=
(X2)
+
(Y2)
+
(Z2)
=
-
t
6kT
3
Comparing this result with Eq.
7.52,
the diffusivity of the isolated chain is
(
10.52)
kT
*D1=
7
An expression for the friction factor,
3,
can be obtained from Stokes's law, which
gives the force,
F,
exerted by
a
viscous medium on a sphere of radius,
R,
moving
through it with
a
velocity,
v,
in the form
[38]
F
=
6.irqRv (10.53)
10.5:
DIFFUSION
OF
POLYMER
CHAINS
245
where
7
is the viscosity. Therefore,
(10.54)
r
V
3
=
-
=
6~7R
Putting this result into Eq. 10.52 and setting
R
=
Rh for the chain (sponge),
(10.55)
where Rh is given by Eq. 10.35 or 10.36. Therefore,
*D1
for the chain varies in-
versely with the viscosity and decreases as the chain length increases since it scales
approximately as
N-1/2
or
N-3/5.
Because the viscosity,
7,
is generally thermally
activated, the diffusivity is similarly thermally activated. The determination of the
proportionality constant implicit in Eq. 10.55 requires more detailed calculations.
10.5.3
Diffusion
of
Densely Entangled Polymer Chains by Reptation
In a polymer melt or
a
concentrated polymer solution, chains are densely packed
and highly entangled. An unattached chain in such an entangled structure is able
to
diffuse through a process called
reptation,
first proposed by de Gennes [39].* In
the densely packed and entangled environment of a polymer melt, a given chain
will be unable to move bodily in directions perpendicular to itself because of the
resistance provided by its closely packed environment. On the other hand, it will
be able to move in directions tangential to itself by a sliding type of motion much
like the movement of
a
snake-hence, the term reptation. The freely jointed “head”
at the leading end of the chain can always find an optimum region of low density
in the material in front of it to advance into, and the remainder of the chain can
then follow along by an appropriate sliding motion. This type of motion is similar
in many respects to the motion of a train along
a
curved track. The chain can
move equally well in the reverse direction in the same manner since its “head”
and “tail” are interchangeable. For conceptual purposes, the highly constricting
and anisotropic environment just described can be represented by a fictitious rigid
tube within which the chain can slide backward and forward. The sliding can be
accomplished by the propagation along the chain length of localized dispiration
defects [41], as in Fig. 10.10. The motion of the chain is then visualized essentially
as a quasi one-dimensional Brownian motion in which the chain randomly walks
forward and backward along its tube.
As
a result
of
this motion, the tube that initially surrounds the chain (i.e.,
the initial
primitive tube),
will be replaced progressively by a new tube, as in
Fig. 10.10. By executing excursions in random directions, the ends of the chain
iteratively change their surroundings. After a large number
of
excursions, the
chain’s conformation eventually loses contact with its original primitive tube. At
this loss of contact, the chain’s trailing end ceases to touch the original primitive
tube (Fig. 10.10d) and a new primitive tube is defined. Thus, each successive
primitive tube is connected to its predecessor as in Fig. 10.11.
An approximate expression for the chain’s self-diffusivity can be obtained using
the theory
of
random walks. Let
rrep
be the average time required for the chain to
move from one primitive tube to its successor. During an interval
T,,~,
the chain’s
4This
discussion
of
reptation is
a
simplified version
of
other
rigorous
treatments
[36,
401.