Báo cáo y học: "The effect of CpG-ODN on antigen presenting cells of the foal" ppt
Bạn đang xem bản rút gọn của tài liệu. Xem và tải ngay bản đầy đủ của tài liệu tại đây (714.56 KB, 17 trang )
BioMed Central
Page 1 of 17
(page number not for citation purposes)
Journal of Immune Based Therapies
and Vaccines
Open Access
Original research
The effect of CpG-ODN on antigen presenting cells of the foal
M Julia BF Flaminio*
1
, Alexandre S Borges
2
, Daryl V Nydam
3
,
David W Horohov
4
, Rolf Hecker
5
and Mary Beth Matychak
1
Address:
1
Department of Clinical Sciences, College of Veterinary Medicine, Cornell University, Ithaca, NY, USA,
2
Departamento de Clinica
Veterinaria, Faculdade de Medicina Veterinaria e Zootecnia, Universidade Estadual Paulista 'Julio de Mesquita Filho', UNESP-Campus de Botucatu,
SP, Brazil,
3
Department of Population Medicine and Diagnostics Sciences, College of Veterinary Medicine, Cornell University, Ithaca, NY, USA,
4
Department of Veterinary Science, Maxwell H. Gluck Equine Research Center, University of Kentucky, Lexington, KY, USA and
5
Qiagen GmbH,
Hilden, Germany; current address Tübingen, Germany
Email: M Julia BF Flaminio* - ; Alexandre S Borges - ; Daryl V Nydam - ;
David W Horohov - ; Rolf Hecker - ; Mary Beth Matychak -
* Corresponding author
Abstract
Background: Cytosine-phosphate-guanosine oligodeoxynucleotide (CpG-ODN) has been used
successfully to induce immune responses against viral and intracellular organisms in mammals. The main
objective of this study was to test the effect of CpG-ODN on antigen presenting cells of young foals.
Methods: Peripheral blood monocytes of foals (n = 7) were isolated in the first day of life and monthly
thereafter up to 3 months of life. Adult horse (n = 7) monocytes were isolated and tested once for
comparison. Isolated monocytes were stimulated with IL-4 and GM-CSF (to obtain dendritic cells, DC) or
not stimulated (to obtain macrophages). Macrophages and DCs were stimulated for 14–16 hours with
either CpG-ODN, LPS or not stimulated. The stimulated and non-stimulated cells were tested for cell
surface markers (CD86 and MHC class II) using flow cytometry, mRNA expression of cytokines (IL-12,
IFNα, IL-10) and TLR-9 using real time quantitative RT-PCR, and for the activation of the transcription
factor NF-κB p65 using a chemiluminescence assay.
Results: The median fluorescence of the MHC class II molecule in non-stimulated foal macrophages and
DCs at birth were 12.5 times and 11.2 times inferior, respectively, than adult horse cells (p = 0.009). That
difference subsided at 3 months of life (p = 0.3). The expression of the CD86 co-stimulatory molecule was
comparable in adult horse and foal macrophages and DCs, independent of treatment. CpG-ODN
stimulation induced IL-12p40 (53 times) and IFNα (23 times) mRNA expression in CpG-ODN-treated
adult horse DCs (p = 0.078), but not macrophages, in comparison to non-stimulated cells. In contrast, foal
APCs did not respond to CpG-ODN stimulation with increased cytokine mRNA expression up to 3
months of age. TLR-9 mRNA expression and NF-kB activation (NF-kB p65) in foal DCs and macrophages
were comparable (p > 0.05) to adult horse cells.
Conclusion: CpG-ODN treatment did not induce specific maturation and cytokine expression in foal
macrophages and DCs. Nevertheless, adult horse DCs, but not macrophages, increased their expression
of IL-12 and IFNα cytokines upon CpG-ODN stimulation. Importantly, foals presented an age-dependent
limitation in the expression of MHC class II in macrophages and DCs, independent of treatment.
Published: 25 January 2007
Journal of Immune Based Therapies and Vaccines 2007, 5:1 doi:10.1186/1476-8518-5-1
Received: 12 October 2006
Accepted: 25 January 2007
This article is available from: />© 2007 Flaminio et al; licensee BioMed Central Ltd.
This is an Open Access article distributed under the terms of the Creative Commons Attribution License ( />),
which permits unrestricted use, distribution, and reproduction in any medium, provided the original work is properly cited.
Journal of Immune Based Therapies and Vaccines 2007, 5:1 />Page 2 of 17
(page number not for citation purposes)
Background
The susceptibility of the naïve foal to infection in the neo-
natal period is greatly dependent on the adequacy of
transfer and absorption of maternally-derived antibodies
through the colostrum. Passively-transferred humoral
immune protection, though, is limited and short-lived.
When maternal antibodies are reduced to low levels, the
foal must rely on its immune system to resist infections. In
addition, protection against intracellular pathogens may
require cellular immunity. Therefore, early maturation of
the foal's immune system would likely increase resistance
to infectious disease.
Bacterial DNA has a potent immunostimulatory activity
explained by the presence of frequent unmethylated cyto-
sine-phosphate-guanosine (CpG) motifs [1,2]. Synthetic
CpG-oligodeoxynucleotides (CpG-ODN) have shown
potent immunostimulatory activity in adult and in neona-
tal vertebrates likely because they mimic bacterial DNA
[3]. In vivo, CpG-ODNs have been shown to induce strong
Type 1 immune responses, with subsequent activation of
cellular (cytotoxic T lymphocytes, CTLs) and humoral
(Th1 immunoglobulin isotypes) components [4]. There-
fore, CpG-ODNs have been extensively studied for their
application as adjuvants in vaccines in domestic species,
including bovine, ovine and swine, revealing increase in
vaccine efficacy and protection [5-11]. In the horse, CpG-
ODN 2007 formulated in 30% Emulsigen added to a
commercial killed-virus vaccine against equine influenza
virus enhanced the antibody responses in comparison to
the vaccine alone [12].
Toll-like receptors (TLRs) are essential for the recognition
of highly conserved structural motifs (pathogen-associ-
ated molecular patterns or PAMPS) only expressed by
microbial pathogens. The combination of different TLRs
provides detection of a wide spectrum of microbial mole-
cules. For instance, TLR-4 specifically recognizes lipopoly-
saccharide (LPS) derived from gram-negative bacteria,
whereas bacterial DNA (unmethylated CpG motif) is rec-
ognized by TLR-9 [13]. TLRs are predominantly expressed
on antigen-presenting cells [macrophages, dendritic cells
(DCs) and, to some extent, B cells], which are abundantly
present in immune tissues (spleen, lymph nodes, periph-
eral blood leukocytes), as well as tissues that are directly
exposed to microorganisms (lungs, gastrointestinal tract,
skin). The nuclear-factor kB (NF-kB) is a transcription fac-
tor activated upon recruitment of the adaptor MyD88 and
TLR 4 or TLR9 engagement with PAMPs [14]. Antigen pre-
senting cells (APCs) play a major role in the initiation and
instruction of antigen-specific immune response, and are
the link between innate and adaptive immunity: they rec-
ognize, process and present antigen to T cells. Many stud-
ies have indicated that DCs, but not macrophages, are
critical for the induction of primary immune responses,
i.e. a first time T cell encounter with processed antigen
[15]. Dendritic cells ability to process and present antigen
depends on their stage of maturation, and circulating pre-
cursor DCs enter tissues as immature DCs. After antigen
capture, they migrate to secondary lymphoid organs
where they become mature DCs. Immature DCs exhibit
active phagocytosis but lack sufficient cell surface MHC
class II and co-stimulatory molecules (CD83, CD86) for
efficient antigen presentation to T lymphocytes [16]. In
contrast, mature DCs demonstrate decreased capacity of
phagocytosis and antigen processing, and increased
expression of MHC class II and co-stimulatory molecule
on the cell surface. CpG-ODNs have been shown to
induce maturation of DCs by increasing cell surface
expression of MHC class II, CD40, and CD86/80 mole-
cules [17]. In combination with antigens, CpG-ODNs
enhance antigen processing and presentation by DCs and
the expression of Type I cytokines (i.e. type I interferon
IFNα and IL-12) [18]. In the horse, Wattrang et al. (2005)
demonstrated that phosphodiester ODN containing
unmethylated CpG-ODN motif induced type I interferon
production in peripheral blood mononuclear cells [19].
Activation of human monocytes through Toll-like recep-
tor has been shown to induce their differentiation into
either macrophages or DCs, and the presence of GM-CSF
is synergistic for the expression of MHC class II, CD86,
CD40 and CD83 molecules, mixed lymphocyte reaction
and the secretion of Th1 cytokines by T cells [20].
In contrast to adults, human neonates have demonstrated
impaired response to multiple PAMPS, which may signif-
icantly contribute to immature neonatal immunity
[21,22]. Nevertheless, CpG-ODN has been shown to
induce in vitro IFNα cytokine production and reduce in
vivo viral shedding in newborn lambs [23]. To date, lim-
ited information is available about the competence of foal
cells to detect pathogens and trigger an immune response
against them. A similar dependency in APC competency
could exist in the foal in regards to resistance to viral and
intracellular bacterial infections, for instance Rhodococcus
equi, which causes pyogranulomatous pneumonia exclu-
sively in young foals [24,25].
The ex vivo system used in this investigation allowed a lon-
gitudinal study of the immune cells of the foal. We inves-
tigated the effect of a CpG-ODN on monocyte-derived
macrophages and DCs from adult horses and foals from
birth to 3 months of life. We evaluated the effect of CpG-
ODN in the maturation process of dendritic cells of foals
and compared to those of adult horses by measuring cell
surface molecule expression, cytokine profile, and signal-
ing pathway activation.
Journal of Immune Based Therapies and Vaccines 2007, 5:1 />Page 3 of 17
(page number not for citation purposes)
Methods
Foals, adult horses and blood samples
This study was conducted following a protocol approved
by Cornell University Center for Animal Resources and
Education and the guidelines from the Institutional Ani-
mal Care and Use Committees. Eight pregnant mares of
various breeds (1 Bavarian, 1 Westfalen, 1 Selle Fraincaise,
1 Thoroughbred, 2 Oldenburg, 2 Pony mares) belonging
to the Cornell University Equine Park were monitored for
this study. Those mares had access to pasture and barn,
and they were fed grass hay and grain according to their
management schedule. They were vaccinated approxi-
mately 30 days before foaling with Encevac-T
®
(Intervet,
DeSoto, KS). All the foalings were observed, and the ade-
quate absorption of colostral immunoglobulin G (IgG) by
the foals was assessed using the SNAP
®
Test (Idexx, West-
brook, MN) by 18 hours of birth. Daily physical examina-
tion in the first week of life, and monthly complete blood
cell count were performed to evaluate natural inflamma-
tory/infectious conditions in the foals.
Sixty milliliter peripheral blood samples were collected
from the 8 foals via jugular venipuncture using
heparinized vacutainer tubes within 5 days of life, and
monthly up to 3 months of life. One of the foals was euth-
anized due to septic synovitis and was removed from the
study. An equivalent amount of blood was collected once
from 7 different adult horses (5 Thoroughbred and 2
ponies). All the samples were processed as below immedi-
ately after collection.
Monocyte-derived macrophages and dendritic cells
Monocytes were purified from peripheral blood using a
modified technique described by Hammond et al. [26].
Briefly, mononuclear cells were isolated using Ficoll-
Paque (Amershan Biosciences, Piscataway, NJ) density
centrifugation, and incubated in DMEM-F12 medium
(Gibco-Invitrogen Corporation, Grand Island, NY) plus
5% bovine growth serum (Hyclone, Logan UT), antibiot-
ics and antimycotics (Gibco-Invitrogen Corporation,
Grand Island, NY) for 4 h at 5% CO
2
, 37°C. All those rea-
gents were certified for the presence of lipopolysaccharide.
The loosely adherent and non-adherent cells were
removed by gentle wash with 37°C phosphate buffered
solution (PBS). For the generation of DCs, recombinant
equine IL-4 (rEqIL-4, 10 ng/ml) and recombinant human
granulocyte-monocyte colony stimulating factor
(rHuGM-CSF, 1000 units/ml, R&D Systems, Minneapolis,
MN) were added to the culture medium as the following:
Dendritic cell baseline control: for the generation of DCs,
monocytes were cultured in the presence of rEqIL-4 and
rHuGM-CSF for 5 days.
To test the effect of CpG-ODN or LPS on dendritic cells:
monocytes were cultured in the presence of rEqIL-4 (10
ng/ml) and rHuGM-CSF (1,000 units/ml) for 5 days, fol-
lowed by the addition of CpG-ODN 1235 (10 μg/ml, Qia-
gen, Hilden, Germany) or LPS (Sigma Diagnostics, Inc.,
St. Lois, MO) to the medium for 14–16 hours.
Macrophage baseline control: monocytes were cultured with
no extra additives for 5 days.
To test the effect of CpG-ODN or LPS on macrophages: mono-
cytes were cultured with no extra additives for 5 days, fol-
lowed by the addition of CpG-ODN 2135 (10 μg/ml) or
LPS (12.5 μg/ml) to the medium for 14–16 hours.
Cell viability (> 90%) and morphology (formation of
dendrites) were tested by 0.2% Trypan blue (Gibco BRL,
Grand Island, NY) exclusion and contrast phase micros-
copy, respectively. One portion of the cultured cells was
tested for cell surface molecule expression using flow
cytometry. The adhered cells were detached from the wells
using 5 mM EDTA in medium for 5–10 minutes at 37°C,
and washed with fresh PBS. The plates were evaluated
afterward to ensure all cells were removed for analysis. In
general, macrophages presented moderate adherence to
the plates, whereas dendritic cells were loose or loosely
attached. The other portion was snap frozen in liquid
nitrogen and stored at minus 80°C for: a) RNA extraction,
and subsequent measurement of gene expression using
real-time RT-PCR; or b) measurement of NF-κB activation
using a chemiluminescence assay.
Unmethylated cytosine-phosphate-guanosine
oligodeoxynucleotides (CpG-ODN) motifs
In this study, we used the synthetic CpG-ODN 2135
(TCGTCGTTTGTCGTTTTGTCGTT) (Merial, USA), which
has been shown to induce equine peripheral blood
mononuclear cell proliferation in vitro [27]. To confirm
the recognition of this CpG-ODN motif by horse periph-
eral blood leukocytes and collect preliminary data about
the response in foals, 2-day-old foal (n = 5) and adult
horse (n = 5) isolated peripheral blood mononuclear
cells, and a 5-day-old foal isolated mesenteric lymph node
mononuclear cells (n = 1) were cultured in the presence or
absence of 5 μg/ml or 10 μg/ml CpG-ODN 2135, 12.5 μg/
ml LPS or non-stimulated. Approximately 4 × 10
5
cells/
well were cultured in a 96-well plate and medium
described above. The cells were incubated for 3 days at
37°C in 5% CO
2
, and pulsed with 0.8 μCi [
3
H]-thymidine
per well for the last 8 hours of incubation. Well contents
were harvested onto glass fiber filters and [
3
H]-thymidine
incorporation was measured using a liquid scintillation
beta counter. The stimulation index was calculated divid-
ing the average counts per minute from stimulated cells by
the average counts per minute from non-stimulated cells.
Journal of Immune Based Therapies and Vaccines 2007, 5:1 />Page 4 of 17
(page number not for citation purposes)
Flow cytometric analysis of cell surface markers
Cell surface markers of monocyte-derived macrophages
and DCs were evaluated by flow cytometry after 5 days of
culture (Day 5) and after overnight stimulation with CpG-
ODN or LPS (Day 6). The assay was performed according
to Flaminio et al. [28], and monoclonal antibodies used
are described in Table 1[29-31]. Leukocyte subpopula-
tions were displayed in a dot plot and gated according to
size based on forward light scatter (FSC), and according to
granularity based on 90 degree side light scatter (SSC).
The cell population of interest was gated away from small
and dead cells, including events greater than 400 FSC and
200 SSC. Both percentage positive cells and mean fluores-
cence expression were measured.
Real-time RT-PCR reactions for cytokine mRNA
expression
Quantitative analysis of cytokine mRNA expression was
performed as described in Flaminio et al. [32]. Isolation of
total RNA from monocyte-derived macrophages and DCs
was performed using RNeasy
®
Mini Kit (Qiagen, Valencia,
CA), and quality of RNA was tested by 260/280 nm. The
RNA product was treated with DNAse to eliminate possi-
ble genomic DNA from the samples, and the lack of
amplification of genes in samples without the addition of
reverse transcriptase confirmed the purity of RNA. A same
amount (0.01 μg in 1 μL) of RNA from each sample was
used to test for the expression of cytokines. The cytokine
(IL-10, IL-12p35, IL-12p40 and IFNα) and Toll-like recep-
tor 9 (TLR9) gene expression in stimulated and non-stim-
ulated cells was measured in triplicate using Taqman
®
one-step RT-PCR master mix reagents, specific primers
and probes designed using published equine sequences
(Table 2), and the ABI Prism
®
7700 Sequence Detection
System (AB Biosystems, Foster City, CA). In a small subset
of adult horse cells (n = 3), the expression of TNFα mRNA
was tested at 14–16 hours of culture. Analysis of data was
performed by normalizing the target gene amplification
value (Target C
T
) with its corresponding endogenous con-
trol (βactin, Reference C
T
). The quantity of the target gene
in each sample was calculated relatively to the calibrator
sample (fold difference over Day 5 non-stimulated cells).
To determine the time-point for cell harvesting that corre-
sponded to the approximate peak of cytokine expression
in CpG-ODN stimulated cells, samples from 3 adult
horses were tested at different time points for cytokine
mRNA expression. Results indicated that the peak of IL-
12p40 expression was at observed between 12 and 24
hours of stimulation (data not shown).
Toll-like receptor 9 (TLR9)
Consensus sequence was obtained by aligning the
human, bovine, ovine, canine, feline and murine TLR9
gene sequences using the gene alignment NTI software.
Primers for the consensus sequence were designed and
used for PCR amplification of horse cDNA obtained from
purified peripheral blood leukocyte RNA. Gel electro-
phoresis of the PCR product using low melting point gel
agar revealed a single band of expected size. The PCR
product was purified using QIAquick PCR purification kit
(Qiagen, Valencia, CA). The PCR product was ligated into
the pDrive cloning vector, followed by transformation of
Quiagen EZ chemically competent cells (Qiagen, Valen-
cia, CA). Selected colonies were grown overnight and plas-
mid DNA was isolated with the QIAprep Spin Miniprep
Kit (Qiagen, Valencia, CA). Inserts were confirmed with
restriction digest and/or PCR. Desired clones were
sequenced with universal primers at Cornell University
Sequencing Center. Primers and probes were designed for
the quantitative RT-PCR using the equine sequence and
the PrimerExpress software (ABIPrism). The equine TLR9
partial sequence was submitted to GenBank under acces-
sion number DQ157779
.
Nuclear-factor kappa B (NF-kB)
The activation of NF-kB was measured using the commer-
cially available chemiluminescent TransAM™ NF-kB tran-
scription factor kit that measures the NF-kB p65 subunit
(Active Motif, Carlsbad, CA). The kit contains a 96-well
plate coated with oligonucleotide containing a NF-kB
consensus site (5'-GGGACTTTCC-3'). Only the active
form of NF-kB (i.e. not bound to inhibitor iNF-kB) specif-
ically binds to this oligonucleotide. Therefore, nuclear
purification is not necessary for this assay because inacti-
vated cytoplasmic NF-kB cannot bind to the immobilized
sequence. A primary antibody that recognizes the p65
subunit epitope is used subsequently to the incubation
with cellular extract, which is obtained using the buffers
included in the kit. A horse-radish-peroxidase-conjugated
secondary antibody is used for the chemiluminescence
assay. A standard curve was generated using dilutions of
the NF-kB standard protein (Active Motif, Carlsbad, CA).
Results were expressed in ng/μL.
Statistical Analysis
Descriptive statistics were generated and distributions of
data were analyzed using commercial software (PROC
Univariate, SAS Institute, Version 9.1, Cary, NC). Box and
Whiskers plots were produced using commercial software
(KaleidaGraph, Version 4.01, Synergy Software, Reading,
PA). Box plots represent the data collected. The box
includes 50% of the observations with the top line indi-
cating the upper quartile, the middle line showing the
median value, and the lower line indicating the lower
quartile. The lines extending from the box ("whiskers")
mark the maximum and minimal values observed that are
not outliers. Outliers are depicted by circles are a values
that are either greater than the upper quartile + 1.5* the
interquartile distance (ICD) or less than the lower quartile
Journal of Immune Based Therapies and Vaccines 2007, 5:1 />Page 5 of 17
(page number not for citation purposes)
– 1.5*ICD. Non-normally distributed data was analyzed
using non-parametric techniques (i.e. Kruskal-Wallis and
Wilcoxin rank-sum, or Wilcoxin signed-rank depending
on the number of comparisons and/or independence of
observations) performed by commercially available soft-
ware (PROC Npar1way, SAS Institute, Version 9.1, Cary,
NC). General linear regression was used to examine the
association between cell surface marker expression and
age (PROC Reg, SAS Institute, Version 9.1, Cary, NC). The
level of significance was set at p < 0.05.
Table 2: Primer and probe sequences used to measure mRNA expression in monocyte-derived macrophages and dendritic cells
CYTOKINE PRIMER AND PROBE SEQUENCES GenBank accession #
IL-12p35 5'-TCA AGC TCT GCA TCC TTC TTC AT-3' Y11130
5'-CAG ATA GCC CAT CAT CCT GTT G-3'
5'-FAM-CCT TCA GAA TCC GCG CAG TGA CCA-TAMRA-3'
IL-12p40 5'-CAC CTG CAA TAC CCC TGA AGA-3' Y11129
5'-TGC CAG AGC CTA AGA CCT CAT T-3'
5'-FAM-CAT CAC CTG GAC CTC GGC CCA-TAMRA-3'
IFNα 5'-AGG TGT TTG ACG GCA ACC A-3' M14540
5'-ACG AGC CGT CTG TGC TGA A-3'
5'-FAM-AGC CTC AAG CCA TCT CCG CGG T-TAMRA-3'
IL-10 5'-GAC ATC AAG GAG CAC GTG AAC TC-3' U38200
5'-CAG GGC AGA AAT CGA TGA CA-3'
5'-FAM-AGC CTC ACT CGG AGG GTC TTC AGC TT-TAMRA-3'
TNFα 5'-GAT GAC TTG CTC TGA TGC TAA TCC-3' M64087
5'-TCT GGG CCA GAG GGT TGA T-3'
5'-FAM-TCT CCC CAG CAG TTA CCG AAT GCC TT-TAMRA-3'
TLR9 5'-AAC TGG CTG TTC CTG AAG TCT GTG-3' DQ157779
5'-TCA ACC TCA AGT GGA ACT GCC C-3'
5'-FAM-AGA GAA CTG TCC TTC AAC ACC AGG-TAMRA-3'
β-actin 5'-TCA CGG AGC GTG GCT ACA-3' AF035774
5'-CCT TGA TGT CAC GCA CGA TTT-3'
5'-FAM-CAC CAC CAC GGC CGA-TAMRA-3'
Table 1: Monoclonal antibodies used to test the expression of cell surface markers of monocyte-derived macrophages and dendritic
cells stimulated or not with CpG-ODN or LPS
MARKER ANTIBODY CLONE SUPPLIER VALIDATION
CD172a mouse anti-bovine CD172a DH59B VMRD, Pullman, WA Kydd et al., 1994
CD86 mouse anti-human CD86 2331(FUN-1) Becton and Dickinson, San Diego, CA Hammond et al., 1999
MHC I mouse anti-horse MHC I CZ3 D. Antczak's laboratory, Cornell University Lunn et al., 1998
MHC II mouse anti-horse MHC II CZ11 D. Antczak's laboratory, Cornell University Lunn et al., 1998
CD14 mouse anti-human CD14 big10 Biometec, Germany Steinbach et al., 1998
Negative mouse anti-canine parvovirus C.Parrish's laboratory, Cornell University Parrish et al., 1982
Journal of Immune Based Therapies and Vaccines 2007, 5:1 />Page 6 of 17
(page number not for citation purposes)
Results
Effect of CpG-ODN 2135 in peripheral blood mononuclear
cells of foals and adult horses
In a pilot study, we tested the proliferative response of 2-
day-old foal (n = 5) and adult horse (n = 5) isolated
peripheral blood mononuclear cells, and a 5-day-old foal
isolated mesenteric lymph node mononuclear cells (n =
1) to CpG-ODN 2135 or non-stimulation. Those leuko-
cytes included B cells and monocytes, which potentially
express TLR9 and respond to CpG-ODN stimulation. Our
results indicated that CpG-ODN 2135 motif induced pro-
liferation of foal lymph node leukocytes in vitro with
median stimulation indexes equal to 2 and 3 when cells
were stimulated with 5 μg/ml or 10 μg/ml CpG-ODN
2135 final concentration, respectively, versus median
stimulation index 0.8 when cells were stimulated with
12.5 μg/ml LPS. In addition, foal peripheral blood mono-
nuclear cells responded to 10 μg/ml CpG-ODN or 12.5
μg/ml LPS with cell proliferation median stimulation
indexes equal to 1.2 and 2.5, respectively. Adult horse
cells presented median stimulation indexes 7.3 and 16.3,
respectively.
Cell culture system
Our ex vivo propagated adult horse monocyte-derived
macrophages and DCs on Day 5 of culture exhibited a
similar surface antigen phenotype to the one described by
Hammond et al. [26] and Mauel et al. [33]. On day 5 of
culture, adult horse and foal macrophages appeared
round and attached to the plastic bottom of the culture
plate (Figure 1). Foal macrophages tended to become
giant cells more frequently in 2–3 month-old foal sam-
ples. In contrast, the adult horse and foal dendritic cells
were elongated. After stimulation (day 6), occasional den-
dritic cells with stellate shape were observed, whereas
many cells detached from the plastic, isolated or forming
clumps, but keeping the dendrites.
Approximately 30% and 19% of the monocyte-derived
macrophages and DCs, respectively, expressed the CD14
marker. Approximately 61% and 77% of the monocyte-
derived macrophages and DCs, respectively, expressed the
CD172a marker. Overall, non-stimulated dendritic cells
expressed 1.4 and 1.2 times median fluorescence intensity
(hence molecular expression) for MHC class II and CD86,
respectively, than macrophages (Figure 2). The percent-
ages of CD8+ or CD4+ in rEqIL-4+rHuGM-CSF-stimu-
lated cells were less than 3% and 9%, respectively. Foal
cells presented similar phenotype to adult horse cells.
Cell surface marker expression in stimulated and non-
stimulated cells
Median fluorescence intensity of MHC class II expression
was greater but not statistically significant different (p >
0.05) in DCs than in macrophages of adult horses and
foals (Figure 3). Although there was no specific effect of
CpG-ODN stimulation in adult horse and foal cells, there
was an age-dependent limitation in the expression of
MHC class II (fluorescence) on both macrophage and
DCs of foals (p < 0.035). The median fluorescence of the
MHC class II molecule in non-stimulated foal macro-
phages and DCs at birth were 12.5 times (p = 0.009) and
11.2 times (p = 0.009) inferior, respectively, to adult horse
cells. At 3 months of life, there were no statistically signif-
icant differences in the expression of MHC class II mole-
cule between foal and adult horse macrophages (2.6
times, p = 0.31) and dendritic cells (1.3 times, p = 0.37).
The percentage of MHC class II positive cells remained
somewhat constant through age. CpG-ODN or LPS treat-
ment did not promote specific changes in MHC class II
expression in macrophages or DCs, yet a statistically sig-
nificant difference in MHC class II expression was
observed in stimulated cells in an age-dependent in man-
ner. The expression of the CD86 co-stimulatory molecule
was comparable in adult horse and foal macrophages and
DCs, independent of treatment.
Cytokine mRNA expression in stimulated and non-
stimulated cells
Adult horse DCs increased the median IL-12p40 and IFNα
mRNA expression 53 and 23 times, respectively, upon
CpG-ODN stimulation, in comparison to non-stimulated
DCs (p = 0.078). Adult horse CpG-ODN-stimulated mac-
rophages did not change their cytokine mRNA expression
in comparison to non-stimulated cells (Figure 4). Foal
APCs did not change mRNA cytokine expression in an
age-dependent manner upon CpG-ODN stimulation up
to 3 months of age; instead, random fold differences were
observed in the data with both CpG-ODN and LPS stimu-
lation (Figures 5 and 6). The expression of IL-12p40 and
IFNα in adult horse non-stimulated DCs were comparable
to foal DCs at birth (p > 0.05). Despite the distinct median
values, there was not a statistically significant difference in
CpG-ODN stimulated cells between both groups. In order
to evaluate if LPS was inducing a different pattern of
cytokine expression than CpG-ODN, we tested TNFα
mRNA expression in a small subset of adult horse sam-
ples: at 14–16 hours, CpG-ODN-stimulated DCs revealed
a 5-fold increase in comparison to non-stimulated DCs,
whereas LPS-stimulated-DCs revealed a 1-fold decrease.
Stimulated and non-stimulated macrophages did not
show any differences in their TNFα mRNA expression.
TLR9 and NF-kB signaling pathway
TLR-9 mRNA expression in foal DCs and macrophages
were comparable (p > 0.05) to adult horse cells, and CpG-
ODN treatment induced upregulation of a 1-fold differ-
ence in comparison to non-stimulated and LPS-stimu-
lated cells (Figure 7). Values for NF-kB activation (NF-kB
Journal of Immune Based Therapies and Vaccines 2007, 5:1 />Page 7 of 17
(page number not for citation purposes)
p65) were comparable (p < 0.05) in adult horse and foal
macrophages and DCs, independent of treatment.
Discussion
Age-dependent aspects of APCs in the horse
Limitations in the immune system of the foal could be
associated with age-dependent development of cell inter-
action for a primary immune response. The low expres-
sion of MHC class II in equine neonate and young foal
peripheral blood lymphocytes has been well documented,
but the expression of this essential molecule in APCs had
not been studied before in the foal [34,35]. Our investiga-
tion revealed 2 important observations: a) there was a sta-
tistically significant difference in the fluorescence
expression of MHC class II in macrophages and DCs of
foals with age; and b) median MHC class II fluorescence
expression in non-stimulated macrophages and DCs of
the foal at birth were 12.5 times and 11.2 times inferior,
respectively, to adult horse cells. The median MHC class II
fluorescence expression in non-stimulated DCs of 3
month-old-foals was comparable to adult horses, which
suggests a greater competence for the priming of T cells at
that age. In human fetuses, the percentage of MHC class
II-positive monocytes increases significantly over gesta-
tion but remains lower than the adult human at term [36].
Limitation in APC number and function in young age has
been shown to contribute to poor protective cellular
immune responses [37-39]. Human cord blood DCs are
less efficient in the activation of T cells in vitro and instruc-
tion to a Type 1 immune response, likely due to their
lower cell surface MHC class I and II, co-stimulatory
(CD86), and adhesion molecule expression levels than
adult human blood cells [40].
Likewise, the expression of cytokines and co-stimulatory
molecules (signal II) in APCs had not been studied before
in foals. These important immune mediators are critical
for the priming and clone expansion of naïve T cells. There
were no statistically significant differences in the expres-
sion of CD86 in foal macrophages and DCs. In addition,
there were no age-dependent changes in the expression of
CD86. Importantly, those values were comparable to the
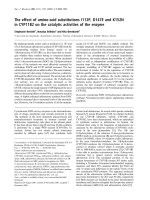
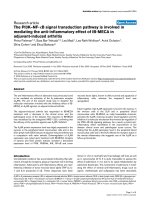
Equine monocyte-derived macrophages (A) and dendritic cells (B) generated ex vivoFigure 1
Equine monocyte-derived macrophages (A) and dendritic cells (B) generated ex vivo. Isolated peripheral blood
monocytes were stimulated (dendritic cells) or not (macrophages) with rEq IL-4 and rHuGM-CSF in DMEM-F12, 5% bovine
growth serum. The photomicrogaphs depict the differentiation of adult horse and foal macrophages and dendritic cells in cul-
ture. A and B = day 5 adult horse and foal macrophages, respectively; A' and B' = day 5 adult horse and foal dendritic cells,
respectively – note their extended shape in contrast to the round macrophages; C = day 6 dendritic cells adhered to the plastic
of the cell culture plate; C' = a group of day 6 dendritic cells floating in the supernatant of the cell culture – note the presence
of small dendrites. Bars indicate 50 μm.
Journal of Immune Based Therapies and Vaccines 2007, 5:1 />Page 8 of 17
(page number not for citation purposes)
adult horse, and they suggest that APCs of foals are com-
petent in the expression of the CD86 co-stimulatory mol-
ecule.
Response to stimulus
CpG-ODN 2135 was a functional tool to evaluate the
innate immune response in foals, and to compare those
results to adult horse response. We learned that adult
horse DCs, but not macrophages, increased the IL-12p40
and IFNα mRNA expression 53 and 23 times, respectively,
in comparison to non-stimulated DCs, whereas foal DCs
did not respond specifically to that stimulus up to 3
months of life. Despite the lack of statistical difference,
the contrast between foal and adult horse cell cytokine
responses to CpG-ODN should not be overlooked, but
further pursued for better understanding of foal response
to different types of pathogens and vaccines/adjuvants.
Other CpG-ODN motifs could induce different types and
magnitude of response by adult horse and foal cells. How-
ever, the CpG-ODN motif used herein revealed a differ-
ence between adult horse and foal DC response. Indeed,
in our pilot studies, this same CpG-ODN induced greater
proliferation indexes in adult horse peripheral blood leu-
kocytes than foal cells.
Interleukin-12 is a heterodimeric molecule composed of
p35 and p40 subunits. Upon CpG-ODN stimulation,
adult horse DCs increased the expression of IL-12p40,
which was not matched in magnitude by IL-12p35. Hols-
cher et al. [41] demonstrated a protective and agonistic
role of IL-12p40 in mycobacterial infection in IL-12p35
knockout mouse. This immune effect could have been
associated with the expression of IL-23, which comprises
the same p40 subunit of IL-12 but a different p19 subunit.
Therefore, it is possible that the IL-12p40 response to
CpG-ODN in adult horse DCs may reflect the expression
of IL-23, instead, and that needs to be tested. Whereas IL-
12 promotes the development of naïve T cells, IL-23 par-
ticipates in the activation of memory T cells and chronic
inflammation, and this difference is relevant when study-
ing the development of primary immune response in foals
[42].
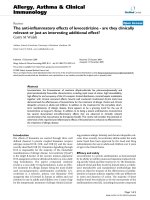
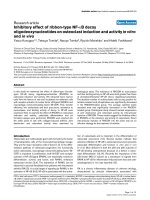
Percentage positive cells (%) and mean fluorescence intensity (MFI) of cell surface molecule expression in monocyte-derived macrophages (MO) and dendritic cells (DC) cultured for 5 days ex vivoFigure 2
Percentage positive cells (%) and mean fluorescence intensity (MFI) of cell surface molecule expression in monocyte-derived
macrophages (MO) and dendritic cells (DC) cultured for 5 days ex vivo. Note that immature dendritic cells revealed greater
molecular expression (fluorescence intensity) for MHC class II and CD86 than macrophages, and inferior percentage of CD14-
positive cells.
0
20
40
60
80
100
120
MO DC
MHC I
MO DC
MHC II
MO DC
CD14
MO DC
CD86
MO DC
CD172a
99
73
30
37
61
99
70
19
25
77
MACROPHAGE AND DENDRITIC CELL
CELL SURFACE MARKERS
0
500
1000
1500
2000
MO DC
MHC I
MO DC
MHC II
MO DC
CD14
MO DC
CD86
MO DC
CD172a
798
805
1211
1281
1175
1668
479
445
373
452
0
20
40
60
80
100
120
MO DC
MHC I
MO DC
MHC II
MO DC
CD14
MO DC
CD86
MO DC
CD172a
99
73
30
37
61
99
70
19
25
77
MACROPHAGE AND DENDRITIC CELL
CELL SURFACE MARKERS
0
500
1000
1500
2000
MO DC
MHC I
MO DC
MHC II
MO DC
CD14
MO DC
CD86
MO DC
CD172a
798
805
1211
1281
1175
1668
479
445
373
452
Journal of Immune Based Therapies and Vaccines 2007, 5:1 />Page 9 of 17
(page number not for citation purposes)
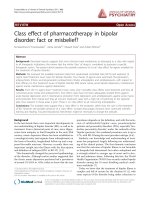
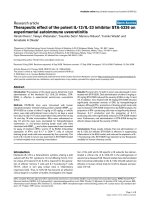
Mean fluorescence intensity (MFI) of cell surface molecule expression in monocyte-derived macrophages and dendritic cells stimulated with CpG-ODN for 14–16 hours after 5 days of culture ex vivoFigure 3
Mean fluorescence intensity (MFI) of cell surface molecule expression in monocyte-derived macrophages and dendritic cells
stimulated with CpG-ODN for 14–16 hours after 5 days of culture ex vivo. Results are depicted for adult horses (A, n = 7) and
foals (B, n = 7) of different ages. Although there was no specific effect of CpG-ODN or LPS stimulation in adult horse or foal
cells, there was an age-dependent limitation in the expression of MHC class II on macrophage and dendritic cells of foals. The
median fluorescences of the MHC class II molecule in non-stimulated foal macrophages and DCs at birth were 12.5× (p =
0.009) and 11.2× (p = 0.009) inferior, respectively, than adult horse cells, and 2.6× (p = 0.31) and 1.3× (p = 0.37), respectively,
at 3 months of life.
0
1000
2000
3000
4000
5000
6000
NoStim CpG LPS NoStim CpG LPS
1036.5
1278
1074.5
1835.6
1608.9
1406.2
MACROPHAGES
DENDRITIC CELLS
0
200
400
600
800
1000
NoStim CpG LPS NoStim CpG LPS
225.6
256
291.3
255.3
225.1
246.4
MACROPHAGES DENDRITIC CELLS
MHC class II CD86
0
1000
2000
3000
4000
5000
6000
NoStim CpG LPS NoStim CpG LPS
1036.5
1278
1074.5
1835.6
1608.9
1406.2
MACROPHAGES
DENDRITIC CELLS
0
200
400
600
800
1000
NoStim CpG LPS NoStim CpG LPS
225.6
256
291.3
255.3
225.1
246.4
MACROPHAGES DENDRITIC CELLS
MHC class II CD86
0
200
400
600
800
1000
MACROPHAGES
376
294
388
403
414
391
235
304
237
214
179
226
birth 1 month
2 months
3 months
0
200
400
600
800
1000
DENDRITIC CELLS
312
237
270
286
343
259
283
247
282
194
195
198
birth
1 month 2 months 3 months
CD86
0
200
400
600
800
1000
MACROPHAGES
376
294
388
403
414
391
235
304
237
214
179
226
birth 1 month
2 months
3 months
0
200
400
600
800
1000
DENDRITIC CELLS
312
237
270
286
343
259
283
247
282
194
195
198
birth
1 month 2 months 3 months
CD86
-500
0
500
1000
1500
2000
2500
3000
3500
MACROPHAGES
83
77
91
124
113 122
140
140 152
390
560
558
birth 1 month
2 months
3 months
0
1000
2000
3000
4000
5000
6000
DENDRITIC CELLS
164
251 217
161
211
215
381
459
239
1569
1449
birth
1 month 2 months
3 months
1399
MHC class II
-500
0
500
1000
1500
2000
2500
3000
3500
MACROPHAGES
83
77
91
124
113 122
140
140 152
390
560
558
birth 1 month
2 months
3 months
0
1000
2000
3000
4000
5000
6000
DENDRITIC CELLS
164
251 217
161
211
215
381
459
239
1569
1449
birth
1 month 2 months
3 months
1399
MHC class II
ADULT HORSES
FOALS
Journal of Immune Based Therapies and Vaccines 2007, 5:1 />Page 10 of 17
(page number not for citation purposes)
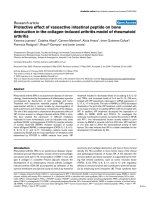
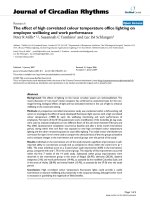
Quantitative cytokine (IL-12p35, IL-12p40, IFNα, IL-10) mRNA expression in adult horse (n = 7) monocyte-derived macro-phages and dendritic cells stimulated or not (NoStim) with CpG-ODN or LPS for 14–16 hours after 5 days of culture ex vivoFigure 4
Quantitative cytokine (IL-12p35, IL-12p40, IFNα, IL-10) mRNA expression in adult horse (n = 7) monocyte-derived macro-
phages and dendritic cells stimulated or not (NoStim) with CpG-ODN or LPS for 14–16 hours after 5 days of culture ex vivo.
Fold difference was calculated using baseline control values (non-stimulated cells on Day 5).
-20
0
20
40
60
80
100
NoStim CpG LPS NoStim CpG LPS
-0.60
-1.27
-1.68
2.45
52.71
2.67
MACROPHAGES
DENDRITIC CELLS
-5
0
5
10
15
20
25
NoStim CpG LPS NoStim CpG LPS
-1.25 -1.16
-1.26
2. 16
4.44
-1.02
MACROPHAGES DENDRITIC CELLS
IL-12p35 IL-12p40
-20
0
20
40
60
80
100
NoStim CpG LPS NoStim CpG LPS
-0.60
-1.27
-1.68
2.45
52.71
2.67
MACROPHAGES
DENDRITIC CELLS
-5
0
5
10
15
20
25
NoStim CpG LPS NoStim CpG LPS
-1.25 -1.16
-1.26
2. 16
4.44
-1.02
MACROPHAGES DENDRITIC CELLS
IL-12p35 IL-12p40
-6
-4
-2
0
2
4
6
NoStim CpG LPS NoStim CpG LPS
1.17
1.73
1.06
1.23
1.98
-1.36
MACROPHAGES
DENDRITIC CELLS
-50
0
50
100
150
NoStim CpG LPS NoStim CpG LPS
2.18
1.36
1.14
2.06
22.63
3.90
MACROPHAGES
DENDRITIC CELLS
IFN
α
IL-10
-6
-4
-2
0
2
4
6
NoStim CpG LPS NoStim CpG LPS
1.17
1.73
1.06
1.23
1.98
-1.36
MACROPHAGES
DENDRITIC CELLS
-50
0
50
100
150
NoStim CpG LPS NoStim CpG LPS
2.18
1.36
1.14
2.06
22.63
3.90
MACROPHAGES
DENDRITIC CELLS
IFN
α
IL-10
ADULT HORSES
Journal of Immune Based Therapies and Vaccines 2007, 5:1 />Page 11 of 17
(page number not for citation purposes)
Quantitative cytokine (IL-12p35 and IL-12p40) mRNA expression in foal (n = 7; A = birth, B = 1 month, C = 2 months, D = 3 months) monocyte-derived macrophages and dendritic cells stimulated or not (NoStim) with CpG-ODN or LPS for 14–16 hours after 5 days of culture ex vivoFigure 5
Quantitative cytokine (IL-12p35 and IL-12p40) mRNA expression in foal (n = 7; A = birth, B = 1 month, C = 2 months, D = 3
months) monocyte-derived macrophages and dendritic cells stimulated or not (NoStim) with CpG-ODN or LPS for 14–16
hours after 5 days of culture ex vivo. Fold difference was calculated using baseline control values (non-stimulated cells on Day
5).
-100
-50
0
50
100
150
200
MACROPHAGES
2.30
3.29
17.27
3.66
0.21
4.56
1.77
5.98
11.08
1.69
10.45
1.11
birth 1 month 2 months 3 months
-100
-50
0
50
10 0
15 0
20 0
DENDRITIC CELLS
0.68
-0.10
1.96
3.84
13.31
1.39
1.52
0.07
-3 .68
4.06
1.98
-1.28
birth
1 month 2 months 3 months
IL-12p40
-100
-50
0
50
100
150
200
MACROPHAGES
2.30
3.29
17.27
3.66
0.21
4.56
1.77
5.98
11.08
1.69
10.45
1.11
birth 1 month 2 months 3 months
-100
-50
0
50
10 0
15 0
20 0
DENDRITIC CELLS
0.68
-0.10
1.96
3.84
13.31
1.39
1.52
0.07
-3 .68
4.06
1.98
-1.28
birth
1 month 2 months 3 months
IL-12p40
-60
-40
-20
0
20
40
60
DENDRITIC CELLS
1.38
-1 .28
-2 .57
2.87
4.27
1.82
1.10
-1.77
-2 .38
-1 .99
-2 .82
-1 .34
birth
1 month 2 months 3 months
-60
-40
-20
0
20
40
60
MACROPHAGES
-1.03 -0.11
1.20
0.49
0.83
2.30
1.50
-1 .23
1.09
-4.14
1.38
-1.6 1
birth
1 month
2 months 3 months
IL-12p35
-60
-40
-20
0
20
40
60
DENDRITIC CELLS
1.38
-1 .28
-2 .57
2.87
4.27
1.82
1.10
-1.77
-2 .38
-1 .99
-2 .82
-1 .34
birth
1 month 2 months 3 months
-60
-40
-20
0
20
40
60
MACROPHAGES
-1.03 -0.11
1.20
0.49
0.83
2.30
1.50
-1 .23
1.09
-4.14
1.38
-1.6 1
birth
1 month
2 months 3 months
IL-12p35
FOALS
Journal of Immune Based Therapies and Vaccines 2007, 5:1 />Page 12 of 17
(page number not for citation purposes)
Both IL-12 and IFNα promote activation of T cells into
Type 1 immune response, with activation, proliferation
and IFNγ production [43,44]. Subsequently, CD40-ligand
engagement and IFNγ from activated T cells facilitate the
production of IL-12 by APCs [45,46]. Indeed, mouse con-
ventional DCs require IFNγ co-stimulation for the produc-
Quantitative cytokine (IFNα and IL-10) mRNA expression in foal (n = 7; A = birth, B = 1 month, C = 2 months, D = 3 months) monocyte-derived macrophages and dendritic cells stimulated or not (NoStim) with CpG-ODN or LPS for 14–16 hours after 5 days of culture ex vivoFigure 6
Quantitative cytokine (IFNα and IL-10) mRNA expression in foal (n = 7; A = birth, B = 1 month, C = 2 months, D = 3 months)
monocyte-derived macrophages and dendritic cells stimulated or not (NoStim) with CpG-ODN or LPS for 14–16 hours after
5 days of culture ex vivo. Fold difference was calculated using baseline control values (non-stimulated cells on Day 5).
-200
-100
0
100
200
300
400
500
600
MACROPHAGES
-2.97
-1.23
46.27
-2.11
1.69
4.74
1.04
3.39
24.40
-0.09
2.17
0.12
birth 1 month
2 months 3 months
-200
-100
0
100
200
300
400
500
600
DENDRITIC CELLS
-2.14
-0.31
3.24
1.34
7.89
2.82
-1.05
1.91
-6.36
0.29
2.99
2.89
birth 1 month 2 months
3 months
IFN
α
-200
-100
0
100
200
300
400
500
600
MACROPHAGES
-2.97
-1.23
46.27
-2.11
1.69
4.74
1.04
3.39
24.40
-0.09
2.17
0.12
birth 1 month
2 months 3 months
-200
-100
0
100
200
300
400
500
600
DENDRITIC CELLS
-2.14
-0.31
3.24
1.34
7.89
2.82
-1.05
1.91
-6.36
0.29
2.99
2.89
birth 1 month 2 months
3 months
IFN
α
-10
-5
0
5
10
15
20
25
30
DENDRITIC CELLS
-1.50
1.77
1.59 2.56
-1.01
2.73
1.03
1.95
2.42
2.56
2.09
1.18
birth 1 month 2 months 3 months
-10
-5
0
5
10
15
20
25
30
MACROPHAGES
2.71
1.90
5.82
0.28
-1.51
1.42
1.97
1.95
8.23
1.44
2.17
2.38
birth 1 month
2 months 3 months
IL-10
-10
-5
0
5
10
15
20
25
30
DENDRITIC CELLS
-1.50
1.77
1.59 2.56
-1.01
2.73
1.03
1.95
2.42
2.56
2.09
1.18
birth 1 month 2 months 3 months
-10
-5
0
5
10
15
20
25
30
MACROPHAGES
2.71
1.90
5.82
0.28
-1.51
1.42
1.97
1.95
8.23
1.44
2.17
2.38
birth 1 month
2 months 3 months
IL-10
FOALS
Journal of Immune Based Therapies and Vaccines 2007, 5:1 />Page 13 of 17
(page number not for citation purposes)
Quantitative analysis of TLR9 and NFkB p65 in monocyte-derived macrophages and dendritic cells stimulated with CpG-ODN or LPS for 14–16 hours after 5 days of culture ex vivoFigure 7
Quantitative analysis of TLR9 and NFkB p65 in monocyte-derived macrophages and dendritic cells stimulated with CpG-ODN
or LPS for 14–16 hours after 5 days of culture ex vivo. Results are depicted for (A) adult horses (n = 7) and (B) foals of differ-
ent ages (n = 7; A = birth, B = 1 month, C = 2 months, D = 3 months).
-4
-2
0
2
4
6
8
10
12
NoStim CpG LPS NoStim CpG LPS
1. 46
2. 30
1.66
-1.14
1. 95
-1.08
MACROPHAGES
DENDRITIC CELLS
TLR9
-4
-2
0
2
4
6
8
10
12
NoStim CpG LPS NoStim CpG LPS
1. 46
2. 30
1.66
-1.14
1. 95
-1.08
MACROPHAGES
DENDRITIC CELLS
TLR9
-20
-10
0
10
20
30
MACROPHAGES
1.27
1.12
-1.42
0.40
1.61
4.11
1.45
1.38
2.55
-1.13
2.55
1.02
birth 1 month 2 months 3 months
-20
-10
0
10
20
30
DENDRITIC CELLS
1.13
1.28
-1. 65
1.27
2.26
2.09
1.55
1.00
-2. 23
-1. 13
1.35
-1.4 9
birth 1 month 2 months 3 months
TLR9
-20
-10
0
10
20
30
MACROPHAGES
1.27
1.12
-1.42
0.40
1.61
4.11
1.45
1.38
2.55
-1.13
2.55
1.02
birth 1 month 2 months 3 months
-20
-10
0
10
20
30
DENDRITIC CELLS
1.13
1.28
-1. 65
1.27
2.26
2.09
1.55
1.00
-2. 23
-1. 13
1.35
-1.4 9
birth 1 month 2 months 3 months
TLR9
0
0. 01
0. 02
0. 03
0. 04
0. 05
0. 06
NoStim CpG LPS NoStim CpG LPS
0.025
0. 026
0.024
0. 022
0.023
0.022
MACROPHAGES
DENDRITIC CELLS
NFkB
0
0. 01
0. 02
0. 03
0. 04
0. 05
0. 06
NoStim CpG LPS NoStim CpG LPS
0.025
0. 026
0.024
0. 022
0.023
0.022
MACROPHAGES
DENDRITIC CELLS
NFkB
0
0.01
0.02
0.03
0.04
0.05
0.06
MACROPHAGES
0.02
0.018
0.022
0.018
0.015
0.015
0.017
0.015
0.019
0.026
0.022
0.023
birth 1 month
2 months 3 months
0
0.01
0.02
0.03
0.04
0.05
0.06
DENDRITIC CELLS
0.023
0.018
0.019
0.025
0.018
0.019
0.024
0.021
0.017 0.024
0.024
0.022
birth 1 month 2 months 3 months
NFkB
FOALS
ADULT HORSES
Journal of Immune Based Therapies and Vaccines 2007, 5:1 />Page 14 of 17
(page number not for citation purposes)
tion of the active form of IL-12 upon TLR stimulation
[47]. Therefore, an impaired cytokine signaling for appro-
priate APC activation in foals could not only hamper a
subsequent Type 1 primary immune response, but also
the proper activation of APCs. In fact, this may be a limit-
ing factor in foals because Breathnach et al. [48] have
demonstrated that the equine neonate peripheral blood
and pulmonary lymphocytes present a marked low
response for the production of IFNγ, which improves
steadily with age.
Compromised Th1 differentiation has been also observed
when there is CD4+ T cell hyporesponsiveness to IL-12
[49]. In young age, DC maturation and cytokine produc-
tion may require specific and co-stimulatory stimuli,
which may become less crucial in a more developed
(adult) immune system. In addition, IL-12 production
can be antagonized by the presence of the anti-inflamma-
tory cytokines IL-10 and TGFβ [50]. Foal DCs did not alter
the expression of IL-12 upon stimulation; yet, those cells
did not change the expression of IL-10 either. Therefore, it
is unlikely the lack of IL-12 response was due to a bias of
the foal cells toward an anti-inflammatory state; rather, it
is possible that those cells have a decreased overall
response to stimulus up to 3 months of life through the
TLR9 signaling pathway [51].
Similarly to CpG-ODN, LPS has been shown to induce
DC maturation with cytokine production, up-regulation
of co-stimulatory molecules and activation of T cells.
Those effects were not observed in our data. LPS inflam-
matory stimulation involves both common and different
pathways to CpG-ODN, and distinct cytokine expression
kinetics has been observed [17,52]. To investigate whether
LPS was inducing a different pattern of cytokine response,
we evaluated the TNFα mRNA expression in a subset of
adult horse samples. At 14–16 hours of stimulation, CpG-
ODN- or LPS-stimulated DCs expressed TNFα mRNA
with a median 5-fold increase and 1-fold decrease, respec-
tively, in comparison to non-stimulated cells. It is possi-
ble that the peaks of cytokine expression of LPS-
stimulated DCs were missed by the time the cells were
harvested, and measuring protein levels would have been
a better comparison.
Two classes of CpG have been described to induce differ-
ent effects in human cells: CpG-A and CpG-B. The former
has a phosphodiester core with CpG motifs, flanked by
phosphorothioate poly(G) sequences on both the 3' and
5' ends; the latter is mainly a phosphorothioate, nuclease
resistant backbone [53,54]. CpG-A had been originally
known to stimulate plasmacytoid DCs to express large
amounts of IFNα; and CpG-B as a potent stimulator of B
cell proliferation and secretion of IL-10 [1,3,55,56]. Both
types of CpG require TLR9 for immune stimulation [57].
However, only CpG-B has been shown to activate NF-kB,
whereas CpG-A induces a minimal response [58]. In our
studies, median TLR9 expression was comparable in CpG-
ODN-treated or LPS-treated macrophages and DCs of foal
and adult horse cells. NF-kB activation in foal macro-
phages and DCs was comparable to adult horse cells, and
CpG-ODN or LPS treatment did not reveal an effect in any
of the groups. Therefore, those analyses were not inform-
ative of the mechanisms involved in cell activation upon
CpG-ODN stimulation.
Structurally, the CpG-ODN used in these experiments is
of class B. However, its effect on horse cells resembled the
one of class A in other species for the increased IFNα
expression and lack of concomitant increased expression
of NF-kB in the adult horse dendritic cells. Distinct
responses to CpG-ODN have been described in different
species. Mena et al. [59] have shown a specific and dose-
dependent IFNα response to class B CpG-ODN motif-
stimulated ovine, but not bovine, peripheral blood
mononuclear cells. In addition, class B CpG-ODN has
been shown to induce in vitro IFNα production in new-
born lambs, which seems to contrast with our findings in
foals [60]. Nevertheless, it is possible that IFNα expression
in equine cells is higher when cells are stimulated with
class A CpG-ODN. Wattrang et al. [19] demonstrated that
class A CpG-ODN indeed induces IFNα expression by
equine peripheral blood mononuclear cells.
The maturation of DCs measured by MHC class II expres-
sion upon CpG-ODN stimulus was not obvious in adult
horse cells, potentially because those cells were already
expressing high levels of that molecule on the cell surface
on Day 5 of the ex vivo culture. Alternatively, there were
mixed-maturation stage cells in the cell culture well, and
only a fraction of those cells became mature with greater
MHC class II expression. Our flow cytometric analysis for
MHC class II expression did not include specific gated
areas in the DC population to keep consistent with the
mRNA cytokine data, which was generated from the
whole cell population. Yet, a subpopulation of cells with
high side and forward scatters in the dot plots expressed
the highest levels of MHC class II, and CpG-ODN stimu-
lation could have induced distinct increased expression of
that molecule in comparison to controls.
Categorization of the monocyte-derived macrophages and
dendritic cells
The ex vivo model presented here produced monocyte-
derived macrophages and DCs with characteristics com-
parable to published results [26,33,61,62]. On Day 5 of
cell culture, rEqIL-4 + rHuGM-CSF induced a slight
increase in the expression of MHC class II molecule (fluo-
rescence), whereas the number of cells (percentage)
expressing CD14 molecule was decreased in comparison
Journal of Immune Based Therapies and Vaccines 2007, 5:1 />Page 15 of 17
(page number not for citation purposes)
to control. Those results suggest the generation of imma-
ture DCs, which were desired for our experiments. Never-
theless, it is unlikely that this system produced
macrophage or DC cell populations in synchronous stages
of development. Both macrophages and DCs were derived
primarily from adherent peripheral blood mononuclear
cells, and a high percentage of cells expressing the
CD172a molecule was present in the cell culture.
Although CpG-ODN may not have induced DC matura-
tion per se as it is classically measured (i.e. increased MHC
class II expression), only stimulated DCs (and not non-
stimulated DCs and stimulated macrophages) induced IL-
12p40 and IFNα cytokine expression.
The classification of DCs is quite complex: the heteroge-
neity of DCs is determined by the precursor population,
anatomical localization, function, and the final outcome
of the immune response [15,63]. Several DC subsets have
been identified in human and mouse, and some similari-
ties and differences exist between species [64]. Two major
categories, conventional DCs or plasmacytoid DCs, can be
described according to the cell origin, TLR expression and
cytokine profile. The cell surface marker CD11c has been
an important parameter in the identification of DCs; how-
ever a monoclonal antibody that recognizes this marker is
lacking for the equine species. In general, conventional
DCs express TLR4 and plasmacytoid DCs express TLR9,
and other TLRs may or not be expressed in the same cell
types in both species [65]. In addition, conventional DCs
are known to produce high levels of IL-12, whereas plas-
macytoid DCs produce type I IFN (IFNα) and IL-12 [16].
To date, there is no single reliable method for the charac-
terization and categorization of equine DCs derived from
peripheral blood or from peripheral or lymphoid tissues.
Therefore, the combination of cell surface marker expres-
sion, using the monoclonal antibodies available for the
horse species, and the expression of cytokines upon stim-
ulation may reveal preliminary characteristics of those
cells. It is not clear from our analyses if the cells producing
IFNα and IL-12 were positive or not for the CD172a and
CD14 markers. This question would require a double
staining of cytokines and cell surface markers, and those
reagents are not widely available for horse proteins to this
date. Alternatively, this system generates a type of DC that
does not follow a predetermined classification system,
such as the one described by Asselin-Paturel et al. [66], a
unique subset of murine immature APCs with plasmacy-
toid morphology that secrete IFNα and IL-12 upon stim-
ulation with viruses and CpG-ODN.
Conclusion
The results from our ex vivo system suggest that foal APCs
do not respond to stimulus comparably to adult horse
cells in cytokine expression. In addition, this investigation
revealed an age-dependent limitation in the expression of
MHC class II molecule in the APCs of the newborn and
young foal, although the expression of the co-stimulatory
molecule CD86 seems to be present already in early life.
Our studies are not comprehensive in determining the
intrinsic developmental aspects of the foal APCs, yet they
bring new observations to support future studies in the
competence of the foal cells to elicit a primary immune
response, and in the choice of appropriate adjuvants for
use in young age. CpG-ODN has shown positive effects in
DC maturation and activation in neonatal cells of other
species. In addition, different CpG-ODN motifs have dis-
tinct effect in immune cells. Other types of stimulants
(e.g. inactivated whole Gram positive or negative organ-
isms, inactivated viruses, or distinct CpG-ODN motifs)
may further indicate levels of response, and potential lim-
itations of APCs to signal T cells for a primary immune
response in young age.
Competing interests
The author(s) declare that they have no competing inter-
ests.
Authors' contributions
MJBFF conceived the study design, coordinated the study,
performed the blood collection, and flow cytometric anal-
ysis. MBM performed the cell culture, cell harvesting and
freezing. ASB performed the RNA isolation, real-time
quantitative RT-PCR, and chemiluminescence assay.
DWH provided technical orientation and reagents for the
cell culture. RH determined and provided the motif to be
used in the experiments. MJBFF and ASB prepared the
draft of the manuscript. DVN and ASB performed the data
analysis. All authors read and contributed to the final ver-
sion of the manuscript.
Acknowledgements
The authors would like to thank Carol Collyer and staff at the Cornell Uni-
versity Equine Park for facilitating the handling of the foals. We are also
grateful to Dr. Philip J. Griebel from the Veterinary Infectious Disease
Organization (VIDO), Saskatchewan, Canada for his insightful comments
and suggestions. This study was supported by the Harry M. Zweig Memorial
Fund for Equine Research and CAPES-Brazil Fellowship (A.S.Borges).
References
1. Krieg AM, Yi AK, Matson S, Waldschmidt TJ, Bishop GA, Teasdale R,
Koretzky GA, Klinman DM: CpG motifs in bacterial DNA trig-
ger direct B-cell activation. Nature 1995, 374:546-549.
2. Tokunaga T, Yamamoto T, Yamamoto S: How BCG led to the dis-
covery of immunostimulatory DNA. Jpn J Infect Dis 1999,
52:1-11.
3. Krieg AM: CpG motifs in bacterial DNA and their immune
effects. Annu Rev Immunol 2002, 20:709-760.
4. Maletto B, Ropolo A, Moron V, Pistoresi-Palencia MC: CpG-DNA
stimulates cellular and humoral immunity and promotes
Th1 differentiation in aged BALB/c mice. J Leukoc Biol 2002,
72:447-454.
5. Gramzinski RA, Doolan DL, Sedegah M, Davis HL, Krieg AM, Hoffman
SL: Interleukin-12- and gamma-interferon-dependent pro-
Journal of Immune Based Therapies and Vaccines 2007, 5:1 />Page 16 of 17
(page number not for citation purposes)
tection against malaria conferred by CpG oligodeoxynucle-
otide in mice. Infec Immun 2001, 69:1643-1649.
6. Rhee EG, Mendez S, Shah JA, Wu CY, Kirman JR, Turon TN, Davey
DF, Davis H, Klinman DM, Coler RN, Sacks DL, Seder RA: Vaccina-
tion with heat-killed leishmania antigen or recombinant
leishmanial protein and CpG oligodeoxynucleotides induces
long-term memory CD4+ and CD8+ T cell responses and
protection against leishmania infection. J Exp Med 2002,
195:1565-1573.
7. Mutwiri G, Pontarollo R, Babiuk S, Griebel P, van Drunen Littel-van
den Hurk S, Mena A, Tsang C, Alcon V, Nichani A, Ioannou X, Gomis
S, Townsend H, Hecker R, Potter A, Babiuk LA: Biological activity
of immunostimulatory CpG DNA motifs in domestic ani-
mals. Vet Immunol Immunopathol 2003, 91:89-103.
8. Vecchione A, Catchpole B, D'Mello F, Kanellos T, Hamblin A: Mod-
ulating immune responses with dendritic cells: an attainable
goal in veterinary medicine? Vet Immunol Immunopathol 2002,
87:215-221.
9. Klinman DM: CpG Adjuvant activity of CpG oligodeoxynucle-
otides. Int Rev Immunol 2006, 25:135-154.
10. Ioannou XP, Griebel P, Hecker R, Babiuk LA, van Drunen Littel-van
den Hurk S: The immunogenicity and protective efficacy of
bovine herpesvirus 1 glycoprotein D plus Emulsigen are
increased by formulation with CpG oligodeoxynucleotides. J
Virol 2002, 76:9002-9010.
11. Dory D, Beven V, Torche AM, Bougeard S, Cariolet R, Jestin A: CpG
motif in ATCGAT hexamer improves DNA-vaccine effi-
ciency against lethal Pseudorabies virus infection in pigs. Vac-
cine 2005, 23:4532-4540.
12. Lopez AM, Hecker R, Mutwiri G, van Drunen Littel-van den Hurk S,
Babiuk LA, Townsend HG: Formulation with CpG ODN
enhances antibody responses to an equine influenza virus
vaccine. Vet Immunol Immunopathol 2006, 114:103-110.
13. Aderem A, Ulevitch RJ: Toll-like receptors in the induction of
the innate immune response. Nature 2000, 406:782-787.
14. Akira S, Takeda K: Toll-like receptor signaling. Nat Rev Immunol
2004, 4:
449-511.
15. Banchereau J, Paczesny S, Blanco P, Bennett L, Pascual V, Fay J, Palucka
AK: Dendritic cells: controllers of the immune system and a
new promise for immunotherapy. Ann N Y Acad Sci 2003,
987:180-187.
16. Cella M, Facchetti F, Lanzavecchia A, Colonna M: Plasmacytoid
dendritic cells activated by influenza virus and CD40L drive
a potent TH1 polarization. Nat Immunol 2000, 1:305-310.
17. Hartmann G, Weiner GJ, Krieg AM: CpG DNA: a potent signal
for growth, activation, and maturation of human dendritic
cells. Proc Natl Acad Sci USA 1999, 96:9305-9310.
18. Askew D, Chu RS, Krieg AM, Harding CV: CpG DNA induces
maturation of dendritic cells with distinct effects on nascent
and recycling MHC-II antigen-processing mechanisms. J
Immunol 2000, 165:6889-6895.
19. Wattrang E, Berg M, Magnusson M: Immunostimulatory DNA
activates production of type I interferons and interleukin-6
in equine peripheral blood mononuclear cells in vitro. Vet
Immunol Immunopathol 2005, 107:265-279.
20. Krutzik SR, Tan B, Li H, Ochoa MT, Liu PT, Sharfstein SE, Graeber
TG, Sieling PA, Liu YJ, Rea TH, Bloom BR, Modlin RL: TLR activa-
tion triggers the rapid differentiation of monocytes into
macrophages and dendritic cells. Nat Med 2005, 11:653-660.
21. Levy O, Zarember KA, Roy RM, Cywes C, Godowski PJ, Wessels MR:
Selective impairment of TLR-mediated innate immunity in
human newborns: neonatal blood plasma reduces monocyte
TNF-alpha induction by bacterial lipopeptides, lipopolysac-
charide, and imiquimod, but preserves the response to R-
848. J Immunol 2004, 173:4627-4634.
22. Levy O: Innate immunity of the human newborn: distinct
cytokine responses to LPS and other Toll-like receptor ago-
nists. J Endotoxin Res 2005, 1192:113-116.
23. Nichani AK, Mena A, Kaushik RS, Mutwiri GK, Townsend HG,
Hecker R, Krieg AM, Babiuk LA, Griebel PJ: Stimulation of innate
immune responses by CpG oligodeoxynucleotide in new-
born lambs can reduce bovine herpesvirus-1 shedding. Oligo-
nucleotides 2006, 16:58-67.
24. Hines SA, Stone D, Hines MT, Alperin DC, Knowles DP, Norton L,
Hamilton MJ, Davis WC, McGuire TC: Clearance of virulent but
not avirulent Rhodococcus equi from the lungs of adult
horses is associated with intracytoplasmic gamma inter-
feron production by CD4+ and CD8+ T lymphocytes. Clin
Diagn Lab Immunol 2003, 10:208-215.
25. Hooper-McGrevy KE, Wilkie BN, Prescott JF: Immunoglobulin G
Subisotype Responses of Pneumonic and Healthy, Exposed
Foals and Adult Horses to Rhodococcus equi Virulence-
Associated Proteins. Clin Diagn Lab Immunol 2003, 10:345-51.
26. Hammond SA, Horohov D, Montelaro RC: Functional character-
ization of equine dendritic cells propagated ex vivo using
recombinant human GM-CSF and recombinant IL-4. Vet
Immunol Immunopathol 1999, 71:197-214.
27. Rankin R, Pontarollo R, Ioannou X, Krieg AM, Hecker R, Babiuk LA,
van Drunen Littel-van den Hurk S: CpG motif identification for
veterinary and laboratory species demonstrates that
sequence recognition is highly conserved. Antisense Nuc Acid
Drug Develop 2001, 11:333-340.
28. Flaminio MJBF, LaCombe V, Kohn CW, Antczak DF: Common var-
iable immunodeficiency in a mare. J Am Vet Med Assoc 2002,
221:1296-1302.
29. Kydd J, Antczak DF, Allen WR, Barbis D, Butcher G, Davis W, Duffus
WPH, Edington N, Grunig G, Holmes MA, Lunn DP, McCulloch J,
O'Brien A, Perryman LE, Tavernor A, Williamson S, Zhang C: Report
of the First International Workshop on Equine Leukocyte
Antigens, Cambridge, UK. Vet Immunol Immunopathol 1994,
42:3-60.
30. Lunn DP, Holmes MA, Antczak DF, Agerwal N, Baker J, Bendali-
Ahcene S, Blanchard-Channell M, Byrne KM, Cannizzo K, Davis W,
Hamilton MJ, Hannant D, Kondo T, Kydd JH, Monier MC, Moore PF,
O'Neil TO, Schram BR, Sheoran A, Stott JL, Sugiura T, Vagnoni KE:
Report of the Second Equine Leukocyte Antigen Workshop,
Squaw Valley, California, July 1995. Vet Immunol Immunopathol
1998, 62:101-143.
31. Parrish CR, Carmichael LE, Antczak DF: Antigenic relationships
between canine parvovirus Type-2, feline panleukopenia
virus and mink enteritis virus using conventional antisera
and monoclonal antibodies. Arch Virol 1982, 72:267-278.
32. Flaminio MJBF, Antczak DF: Inhibition of lymphocyte prolifera-
tion and activation: a mechanism used by equine invasive
trophoblast to escape the maternal immune response.
Pla-
centa 2005, 26:148-159.
33. Mauel S, Steinbach F, Ludwig H: Monocyte-derived dendritic cells
from horses differ from dendritic cells of humans and mice.
Immunology 2006, 117:463-473.
34. Lunn DP, Holmes MA, Duffus WP: Equine T-lymphocyte MHC II
expression: variation with age and subset. Vet Immunol Immun-
opathol 1993, 35:225-238.
35. Flaminio MJ, Rush BR, Davis EG, Hennessy K, Shuman W, Wilkerson
MJ: Characterization of peripheral blood and pulmonary leu-
kocyte function in healthy foals. Vet Immun Immunopathol 2000,
73:267-285.
36. Jones CA, Holloway JA, Warner JO: Phenotype of fetal mono-
cytes and B lymphocytes during the third trimester of preg-
nancy. J Reprod Immunol 2002, 56:45-60.
37. Petty RE, Hunt DW: Neonatal dendritic cells. Vaccine 1998,
16:1378-1382.
38. Muthukkumar S, Goldstein J, Stein KE: The ability of B cells and
dendritic cells to present antigen increases during ontogeny.
J Immunol 2000, 165:4803-4813.
39. Pihlgren M, Tougne C, Bozzotti P, Fulurija A, Duchosal MA, Lambert
PH, Siegrist CA: Unresponsiveness to lymphoid-mediated sig-
nals at the neonatal follicular dendritic cell precursor level
contributes to delayed germinal center induction and limita-
tions of neonatal antibody responses to T-dependent anti-
gens. J Immunol 2003, 170:2824-2832.
40. Hunt DW, Huppertz HI, Jiang HJ, Petty RE: Studies of human cord
blood dendritic cells: evidence for functional immaturity.
Blood 1994, 84:4333-4343.
41. Holscher C, Atkinson RA, Arendse B, Brown N, Myburgh E, Alber G,
Brombacher F: A protective and agonistic function of IL-12p40
in mycobacterial infection. J Immunol 2001, 167:6957-6966.
42. Cua DJ, Sherlock J, Chen Y, Murphy CA, Joyce B, Seymour B, Lucian
L, To W, Kwan S, Churakova T, Zurawski S, Wiekowski M, Lira SA,
Gorman D, Kastelein RA, Sedgwick JD: Interleukin-23 rather than
interleukin-12 is the critical cytokine for autoimmune
inflammation of the brain. Nature
2003, 421:744-748.
Publish with BioMed Central and every
scientist can read your work free of charge
"BioMed Central will be the most significant development for
disseminating the results of biomedical research in our lifetime."
Sir Paul Nurse, Cancer Research UK
Your research papers will be:
available free of charge to the entire biomedical community
peer reviewed and published immediately upon acceptance
cited in PubMed and archived on PubMed Central
yours — you keep the copyright
Submit your manuscript here:
/>BioMedcentral
Journal of Immune Based Therapies and Vaccines 2007, 5:1 />Page 17 of 17
(page number not for citation purposes)
43. Magram J, Connaughton SE, Warrier RR, Carvajal DM, Wu CY, Fer-
rante J, Stewart C, Sarmiento U, Faherty DA, Gately MK: IL-12-defi-
cienct mouse are defective in IFN gamma production and
type 1 cytokine responses. Immunity 1996, 4:471-481.
44. Le Bon A, Durand V, Kamphuis E, Thompson C, Bulfone-Paus S, Ross-
mann C, Kalinke U, Tough DF: Direct stimulation of T cells by
type I IFN enhances the CD8+ T cell response during cross-
priming. J Immunol 2006, 176:4682-4689.
45. Schulz O, Edwards AD, Schito M, Aliberti J, Manickasingham S, Sher
A, Reis e Sousa C: CD40 triggering of heterodimeric IL-12 p70
production by dendritic cells in vivo requires a microbial
priming signal. Immunity 2000, 13:453-462.
46. Belardelli F: Role of interferons and other cytokines in the reg-
ulation of the immune response. APMIS 1995, 103:161-179.
47. Hayes MP, Wang J, Norcross MA: Regulation of interleukin-12
expression in human monocytes: selective priming by inter-
feron-gamma of lipopolysaccharide-inducible p35 and p40
genes. Blood 1995, 86:646-650.
48. Breathnach CC, Sturgill-Wright T, Stiltner JL, Adams AA, Lunn DP,
Horohov DW: Foals are interferon gamma-deficient at birth.
Vet Immunol Immunopathol 2006, 112:199-209.
49. Taki S, Sato T, Ogasawara K, Fukuda T, Sato M, Hida S, Suzuki G, Mit-
suyama M, Shin EH, Kojima S, Taniguchi T, Asano Y: Multistage reg-
ulation of Th1-type immune responses by the transcription
factor IRF-1. Immunity 1997, 6:673-679.
50. Ma X, Trinchieri G: Regulation of interleukin-12 production in
antigen-presenting cells. Adv Immunol 2001, 79:55-92.
51. Langrish CL, Buddle JC, Thrasher AJ, Goldblatt D: Neonatal den-
dritic cells are intrinsically biased against Th-1 immune
responses. Clin Exp Immunol 2002, 128:118-123.
52. Kaisho T, Akira S: Pleiotropic function of Toll-like receptors.
Microbes Infect 2004, 6:1388-1394.
53. Dalpke AH, Zimmermann S, Albrecht I, Heeg K: Phosphodiester
CpG oligonucleotides as adjuvants: polyguanosine runs
enhance cellular uptake and improve immunostimulative
activity of phosphodiester CpG oligonucleotides in vitro and
in vivo. Immunology 2002, 106:102-112.
54. Hemmi H, Kaisho T, Takeda K, Akira S: The roles of Toll-like
receptor 9, MyD88, and DNA-dependent protein kinase cat-
alytic subunit in the effects of two distinct CpG DNAs on
dendritic cell subsets. J Immunol 2003, 170:3059-3064.
55. Lipford GB, Bendigs S, Heeg K, Wagner H: Poly-guanosine motifs
costimulate antigen-reactive CD8 T cells while bacterial
CpG-DNA affect T-cell activation via antigen-presenting
cell-derived cytokines. Immunology 2000, 101:46-52.
56. Krug A, Rothenfusser S, Hornung V, Jahrsdorfer B, Blackwell S, Ballas
ZK, Endres S, Krieg AM, Hartmann G: Identification of CpG oli-
godeoxynucleotide sequences with high induction of IFNa/b
in plasmacytoid dendritic cells. Eur J Immunol 2001,
31:2154-2163.
57. Hornung V, Rothenfusser S, Britsch S, Krug A, Jahrsdorfer B, Giese T,
Endres S, Hartmann G: Quantitative expression of toll-like
receptor 1–10 mRNA in cellular subsets of human peripheral
blood mononuclear cells and sensitivity to CpG oligodeoxy-
nucleotides. J Immunol 2002, 168:4531-4537.
58. Klinman DM, Takeshita F, Gursel I, Leifer C, Ishii KJ, Verthelyi D,
Gursel M: CpG DNA: recognition by and activation of mono-
cytes. Microbes Infect 2002, 4:897-901.
59. Mena A, Nichani AK, Popowych Y, Ioannou XP, Godson DL, Mutwiri
GK, Hecker R, Babiuk LA, Griebel PJ: Bovine and ovine blood
mononuclear leukocytes differ markedly in innate immune
responses induced by Class A and Class B CpG-oligodeoxy-
nucleotide. Oligonucleotides 2003, 13:245-259.
60. Nichani AK, Mena A, Kaushik RS, Mutwiri GK, Townsend HG,
Hecker R, Babiuk LA, Griebel PJ: Stimulation of innate immune
responses by CpG oligodeoxynucleotide in newborn lambs
can reduce bovine herpesvirus-1 shedding. Oligonucleotides
2006, 16:58-67.
61. Siedek E, Little S, Mayall S, Edington N, Humblin A: Isolation and
characterization of equine dendritic cells. Vet Immunol Immun-
opathol 1997, 60:15-31.
62. Steinbach F, Krause B, Blass S, Burmester GR, Hiepe F: Develop-
ment of accessory phenotype and function during differenti-
ation of monocyte-derived dendritic cells.
Res Imunol 1998,
149:627-632.
63. Bajer AA, Garcia-Tapia D, Jordan KR, Haas KM, Werling D, Howard
CJ, Estes DM: Peripheral blood-derived bovine dendritic cells
promote IgG1-restricted B cell responses in vitro. J Leukoc Biol
2003, 73:100-106.
64. Hemmi H, Akira S: TLR signaling and the function of dendritic
cells. Chem Immunol Allergy 2005, 86:120-135.
65. Akira S, Hemmi H: Recognition of pathogen-associated molec-
ular patterns by TLR family. Immunol Lett 2003, 85:85-95.
66. Asselin-Paturel C, Boonstra A, Dalod M, Durand I, Yessaad N, Dezut-
ter-Dambuyant C, Vicari A, O'Garra A, Biron C, Briere F, Trinchieri
G: Mouse type I IFN-producing cells are immature APCs
with plasmacytoid morphology. Nat Immunol 2001,
2:1144-1150.