báo cáo khoa học: " PHENOPSIS DB: an Information System for Arabidopsis thaliana phenotypic data in an environmental context" pot
Bạn đang xem bản rút gọn của tài liệu. Xem và tải ngay bản đầy đủ của tài liệu tại đây (855.78 KB, 7 trang )
DATABASE Open Access
PHENOPSIS DB: an Information System for
Arabidopsis thaliana phenotypic data in an
environmental context
Juliette Fabre
1
, Myriam Dauzat
1
, Vincent Nègre
1
, Nathalie Wuyts
1
, Anne Tireau
2
, Emilie Gennari
2
, Pascal Neveu
2
,
Sébastien Tisné
1,3
, Catherine Massonnet
1
, Irène Hummel
1,4
and Christine Granier
1*
Abstract
Background: Renewed interest in plant × environment interactions has risen in the post-genomic era. In this
context, high-throughput phenotyping platforms have been developed to create reproducible environmental
scenarios in which the phenotypic responses of multiple genotypes can be analysed in a reproducible way. These
platforms benefit hugely from the development of suitable databases for storage, sharing and analysis of the large
amount of data collected. In the model plant Arabidopsis thaliana, most databases available to the scientific
community contain data rela ted to genetic and molecular biology and are characterised by an inadequacy in the
description of plant developmental stages and experimental metadata such as environmental conditions. Our goal
was to develop a comprehensive information system for sharing of the data collected in PHENOPSIS, an
automated platform for Arabidopsis thaliana phenotyping, with the scientific community.
Description: PHENOPSIS DB is a publicly available (URL: information
system developed for storage, browsing and sharing of online data generated by the PHENOPSIS platform and
offline data collected by experimenters and experimental metadata. It provides modules coupled to a Web
interface for (i) the visualisation of environmental da ta of an experiment, (ii) the visualisation and statistical analysis
of phenotypic data, and (iii) the analysis of Arabidopsis thaliana plant images.
Conclusions: Firstly, data stored in the PHENOPSIS DB are of interest to the Arabidopsis thaliana community,
particularly in allowing phenotypic meta-analyses directly linked to environmental conditions on which publications
are still scarce. Secondly, data or image analysis modules can be downloaded from the Web interface for direct
usage or as the basis for modifications according to new requirements. Finally, the structure of PHENOPSIS DB
provides a useful template for the development of other similar databases related to genotype × environment
interactions.
Background
Arabidopsis thaliana, a small flowering plant with a
rapid life cycle, offers important advantages for
researches in genetics a nd molecular biology. Since
2000, the complete sequencing of its genome has
enabled scientists to monito r gene expression on a gen-
ome-scale [1] in different organs and in different envir-
onmental conditions [e.g. [2,3]]. The broad-based
knowledge of this plant inclu des extensive genetic maps
of all five chromosomes, efficient technology for muta-
genesis and transformation and a large range of biologi-
cal resources availab le at the various Arabidopsis stock
centers (Arabidopsis Biological Resource Center, Not-
tingham Arabidopsis Stock Center, Riken Bioresource
Center, INRA-Versailles Genomic Resource Center and
Lehle Seeds, a pr ivate company). Many structured data-
bases and querying tools have been develope d providing
repositories of large datasets and efficient applications
for the determination of gene function (TAIR [4], NASC
Proteomics [5], etc). While these databases provide
extensive and robust genetic or molecular information,
* Correspondence:
1
Laboratoire d’Ecophysiologie des Plantes sous Stress Environnementaux
(LEPSE), INRA-AGRO-M, UMR 759, 2 Place Viala, 34060 Montpellier Cedex 1
France
Full list of author information is available at the end of the article
Fabre et al. BMC Plant Biology 2011, 11:77
/>© 2011 Fabre et al; licensee BioMed Central Ltd. This is an Open Access article distributed under the terms of the Creative Commons
Attribution License (http://creativec ommons.or g/licenses/by/2.0), which permits unrestricted use, distribution, and reproduction in
any medium, pro vided the original work is properly cited.
metadata like the precise characterisation of environ-
mental conditions or plant developmental phenotypes
are generally poorly documented. This point has
recently received attention and sev eral guidelines have
been proposed acknowledging the importance of com-
prehensive metadata, and thus allowing cross-validation
of experiments and meta-analysis procedures [6-10].
Unravelling gene function by large scale mutant
screening has been mainly based on the mean value of a
phenotypic effect measured under a given lab condition.
It is often assumed in this approach that phenotypic
variation among plants is largely due to genotypic varia-
tion. However, the validity of this assumption was qu es-
tioned by a recent study in which three genotypes of
Arabidopsis thaliana weregrownin10laboratories
using the same standardised conditions [11]. Despite the
use of a common, highly detailed protocol, the 10 labs
still o btained phenotypic variation within genoty pes for
molecular and leaf developmental traits. The results
showed that even small differences in environmental
conditions or plant handling substantially affected
growth at different levels [11]. This study clearly
demonstrates the need for precise recording of environ-
mental conditions and reproducible characterisation of
phenotypic traits in order to enable data sharing and
comparison across laboratories. While automated phe-
notyping platforms are developed in many groups to
obtain precise records of plant environmental conditions
and growth phenotypes (Traitmill [12], PHENOSCOPE
[13], WIWAM [14]), these data are still not available
through repository databases. One of the pioneer plat-
forms for reproducible phenotyping of Arabidopsis
thaliana was the PHENOPSIS platform developed in
our group in 2003 [15]. In three highly controlled
growth chambers, plants are subjecte d to different tem-
peratures, day-lengths and drought treatments with an
automatic recording of all environmental data. In plat-
forms such as this, large quantities of environmental
data, plant images and phenotypic data are produced for
the study of genotype × environment effects on different
plant processes. Procedures need to be conceived for a
proper handling of these datasets, their efficient extrac-
tion and sharing with the scientific community. Here,
we describe the content and utility of PHENOPSIS DB,
an information system for the storag e (database), analy-
sis and sharing (Web interface, Web Services) of images
and data collected in the PHENOPSIS platform.
Construction and content
Data source
PHENOPSIS DB contains phenotypic data and experi-
mental and environmental metadata (see additional file 1:
Description of the variables stored in PHENOPSIS DB).
Thephenotypicdataincludeonline(i.e. automatically
recorded) and offline (i.e. manually recorded) plant
images and sets of offline phenotypic measurements.
Metadata consist of protocols, descriptions of variables,
genotype characteristics and online environmental data.
Experiment protocols and variable descriptions
Each experiment is associ ated with a protocol that gives
information about the experimental context. Other pro-
tocols describe how variables were obtained to ensure
that all experimenters use the same methods to measure
a given variable.
Genotype characteristics
Arabidopsis thaliana genotypes may include ecotypes,
inbredlinesfromspecificcrosses,mutants,etc.and
information on the specific features of the genotype and
the source of the material, i.e. the laboratory or stock
center providing the seeds.
Environmental conditions
Climatic conditions (air temperature, air humidity, light
intensity, vapor pressure deficit) in t he PHENOPSIS
growth chambers are continuously recorded during an
experiment [15] and automatically sent to the server. R
[16] functions check and insert them into the database.
Plant watering data, i.e. the weight of individual pots
beforeandafterwateringandthesuppliedamountof
nutrient solution [15], are also automatically recorded
and inserted into the database via real-time automated
SQL requests.
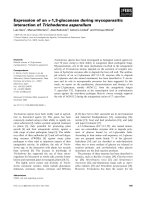
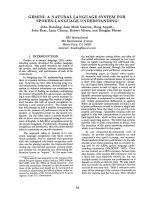
Images
Visible and infrared images of each individual plant in
PHENOPSIS [15] are automatically transferred in real-
time to the server. Additional offline images are manu-
ally inserted into the database. These are produced by
experimenters after the harvest of pla nts or plant organs
for destructive measurements, including scans of diffe r-
ent plant parts (roots, leaves, etc) (Figure 1a), or
obtained after organ prep aration and microscopic obs er-
vations (Figure 1b).
Phenotypic data measured on plants
Non-invasive measurements, such as rosette and indivi-
dual leaf area determination, plant growth s tage records
and transpiration measurements are performed during a
growth run within PHENOPSIS. Invasive measurements,
on the other hand, require the harvest of plants or plant
parts and are performed at predefined dates (x days
after sowing) or at given plant developmental stages.
Examples are the determination of plant and organ
fresh and dry weight, leaf thickness, leaf epidermal cell
density and stomatal density. Both invasive and non-
invasive measurements are inserted into the database via
the Web interface. R functions are used to check data
consistency before insertion.
Data volume
Currently, 70 experiments are stored in the database
and 15 of them are publicly available. They include
Fabre et al. BMC Plant Biology 2011, 11:77
/>Page 2 of 7
87000 phenotypic measurements on 865 genotypes, of
which 50000 measurements on 620 genotypes are pub-
licly available. 600000 images are stored in the database
and more than 90000 are publicly available.
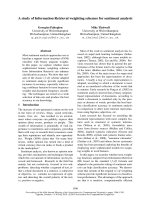
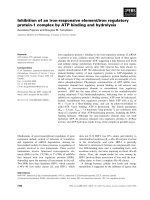
PHENOPSIS DB information system
The PHENOPSIS DB has been designed for data sto-
rage, browsing and retrieval. It also provides tools for
data visualisation and analysis, and image analysis. It
consists of three major components: the database, the
Web interface with modules developed in R or ImageJ
[17], and several Web Services (Figure 2).
The database
The database was developed using the MySQL 5.0 Com-
munity Server and is composed of 15 physical tables
(see additional file 2: Description of the physical data
model of the PHENOPSIS DB database).
The Web interface
The Web interface was developed using XHTML, PHP,
JavaScript, Jquery, Ajax and CSS. Both CSS and
XHTML scripts respect the W3C [18] standards and
were validated by W3C online tools [19,20]. PHP scripts
call R functions to check, insert and format data, and to
perform online statistical analysis or visualisation. The
RODBC package in R version 2.9.2 was used to establish
the database connection.
User access
All metadata are freely available without restriction or
authentication request. Metadata include: characteristic s
of experiments and associated protocols, list of geno-
types grown in an experiment, list of variables measured
in an experiment with their definition and associated
protocols, comments on the experiments, micrometeor-
ological data and plant watering data.
Images and phenotypic data from public experiments
and public genotypes are also freely available without
restriction or authentication request. The whole dataset
associated with an experiment and/or a genotype
becomes public as soon as the data have been published.
The access to images and phenotypic data from non-
published experiments or confidential genotypes requires
a user authentication that can be requested from the
administrator in charge of the information system.
Web Services
Web Services were developed to enhance intero perabil-
ity and data exchanges with other systems (information
systems, stand-alone programs). The PHENOPSIS DB
Web Services are based on the Tomcat/Axis solution,
described using WSDL language and they apply the
SOAP protocol. They were developed in the Java
language.
Utility and discussion
PHENOPSIS DB Web interface
A user-friendly Web interface
Centralise d infor mation systems are often developed for
data storage when datasets are too extensive for perso-
nal computers. They are also used to promote
exchanges between researchers and to pe rform meta-
analyses, requiring high traceability and reproducibility
of dataset s. This can only be ensured through compre-
hensive metadata, data collection protocols and data
descriptions. The PHENOPSIS DB interface has been
developed for a large scientific community and allows
the brows ing, downloading, visuali sation and analysis of
all data recorded in the P HENOPSIS platform. The
PHENOPSIS platform and the information system struc-
ture are documented on the Web interface (see http://
bioweb.supagro.inra.fr/phenopsis/Accueil.php?lang=En).
In the Data Browsing and Download section, basic or
advanced searches can be performed depending on the
user’s familiarity with the system.
Interoperability between PHENOPSIS DB and other
databases
Both the use of standards and the integration of ontolo-
gies enhance the interoperability between PHENO PSIS
DB and other biological databases. The genotype
nomenclature is based on the TAIR international
Figure 1 Examples of images produced by experimenters. (a) Scan of individual rosette leave s of an Arabidopsis thaliana plant allows to
estimate leaf area using a macro developed in ImageJ [18]. (b) Histological section of an individual leaf of Arabidopsis thaliana allows to
measure leaf thickness and the proportions of individual leaf tissues.
Fabre et al. BMC Plant Biology 2011, 11:77
/>Page 3 of 7
nomenclature [21,22] and hyperlinks lead to their
description on the TAIR or NASC websites. The charac-
terisation of growth stages follows the standard nomen-
clature described in [23]. Whenever possible, measured
organs are characterised according to the plant structure
proposed in Plant Ontology [6]. In addition, c orrespon-
dence between plant growth variables and the ontologies
of phenotypic traits were made. Some matches to var i-
ables were identified as terms in Trait Ontology [24],
while for others it was necessary to c ombine different
ontologies (Phenoty pe, Attribute and Trait Ontology
[25], Plant Ontology, etc) following the E QV (Entity
Qualifier Value) model [26]. Variables not clearly identi-
fied in existing ontologies were defined as precisely as
possible and will be submitted to ontology consortiums.
Consultation of the experiments and/or genotypes
The Experiments subsection within the Data Browsing
and Download section allows searches on experiments
associated with a publication, given genotypes or a spe-
cific type of stress (see />nopsis/ConsulterManip.php, e.g. select experiments
without any environmental stre ss). In the advanced
search, users can select additional filters such as mea-
sured variables, environmental conditions, etc. Each
experiment is associated with a description that provides
its general features, the genotypes studied and the vari-
ables measured, the characteristics of each pot (sowing
date, weights for soil humidity calculation, etc), and the
parameters for setting environmental conditions.
Download and analysis of phenotypic data
User s of the system can d ownload the publicly available
datasets in the Data Browsing and Download > Data
measured on plants section (see agro.
inra.fr/phenopsis/ConsulterMesurePlante.php), using
similar searching criteria to those described above to
restrict the downloading to specific data of interest.
Figure 2 Overview of the PHENOPSIS DB Information System. Database, Web interface, Web Services, R functions and files (plant images,
protocol files, etc) are stored on a Linux server. Environmental data from the growth chambers are automatically inserted into the database, and
visible/infrared images are automatically stored and organized on the server. Users interact with the Web interface for offline data, metadata
insertion, data consultation and analysis. The connection to the database is either directly performed with SQL requests, or indirectly via R scripts
using the RODBC package for data formatting or analysis. Web Services connect to the database for automated data extraction.
Fabre et al. BMC Plant Biology 2011, 11:77
/>Page 4 of 7
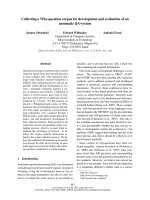
Applications have been developed that assist users in
the visualisation and statistical analysis of phenotypic
data. They can be found in the Graphs and Descriptive
Statistics > Data measured on plants section (see http://
bioweb.supagro.inra.fr/phenopsis/StatPlante.php). Users
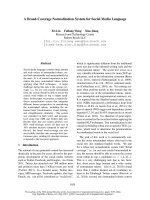
can perform online univariate analyses, including histo-
grams, boxplo ts or curve fitting related to growth
kinetics ( Figure 3). In addition, R scripts developed for
specific analyses are available: sigmoidal curve fitting to
leaf or cell expansion data, test of loci effects on quanti-
tative variable correlations, and selection of Recombi-
nant Inbred Lines. The R sources can be downloaded
with their descriptions, test datasets and the correspond-
ing outputs.
Download and visualisation of environmental conditions
during an experiment
Environmental data, including micrometeorological and
plant watering data, can be consulted an d downloaded
in the Data Browsing and Download section. Two mod -
ules have been developed in the Graphs and Descriptive
Statistics section to check the consi stency between set
and obtained environmental conditions and to assist in
the precise monitoring of experiments. In the first mod-
ule, micrometeorological data and a basic statistical ana-
lysis can be visualised and downloaded in graphs. More
specifically, the module displays the kinetics of the dif-
ferent meteorological data over an experiment together
with a statistical summary (see agro.
inra.fr/phenopsis/StatMeteo.php). In the second module,
the soil water content in pots can be visualised and
downloaded in graphs together with a basic statistical
analysis (see />tIrrigation.php). One application within the module dis-
plays the cha nges in s oil humidity over an experiment
for individual pots [15] with a statistical summary. A
second application produces graphs showing the soil
water content of all potsinaPHENOPSISgrowth
chamber before and after watering at a given date and
for each plant watering cycle.
Download and analysis of images
User s of the system can d ownload the publicly available
images in the Data Browsing and Download > Plant
images section (see />nopsis/Consul terImages.php) and can restrict the down-
loading by applying filters. Plant images can be
previewed, downloaded in ZIP files and used in the esti-
mation of additional variables by a pplying other image
analysis algorithms. For example, scans that have been
used for the measurement of individual area of succes-
sive leaves on a rosette can be re-analysed to estimate
shape parameters of the same leaves; similarly, leaf sec-
tions that have been used in the estimation of leaf thick-
ness can be used in the measurement of vein diameter.
The Image An alyses and ImageJ Macros section pro-
vides tools for the analysis of large sets of plant images
in an automatic or semi-automatic way using ImageJ
macros (see />MacroImageJ.php) . These macros can be downloaded
and run as a stand-alone application for the analysis of
(i) batches of rosette images to measure the projected
rosette area of individual plan ts and (ii) leaf scans to
measure individual leaf areas.
PHENOPSIS DB Web Services
Our Web Services implement several methods. Cur-
rently, in the main methods o ne can get the list and
description of (i) the public genotypes studied in all
experiments or in a specific experiment, ( ii) the mea-
sured phenotypic variables or (iii) the different types of
images collected. Additionally, it is possible to get the
sequence of visible images taken automatically in the
growth chambers for plants of a specific genotype
grown i n a specific experiment. Using this last method
one can for example automatically generate animated
images of individual plant growth. Some examples of cli-
ent applications available in different languages (Python,
PHP) can be downloaded from the Web interface.
The Web services are described at a-
gro.inra.fr/phenopsis/WebService.php and available to
Figure 3 Example of an online statistical analysis.Projected
rosette areas are plotted over time for four plants of the genotype
LAF11-1 grown in four different pots (C1M7-150, C1M7-250, C1M7-
346 and C1M7-479) in a same experiment (C1M7). A sigmoïdal
model is fitted to the data. Projected rosette areas were obtained
by the analysis of images taken by the automatons. This graph was
produced on the PHENOPSIS DB Web interface in the Graphs and
Descriptive Statistics > Data measured on plants section by selecting
the experiment C1M7, the genotype LAF11-1, the phenotypic
measure ‘Rosette projected area’, the sigmoïdal curve fitting analysis
and the genotype level for the analysis.
Fabre et al. BMC Plant Biology 2011, 11:77
/>Page 5 of 7
client programs via the WSDL document http:/ /bioweb.
supagro.inra.fr/phenopsis/wsdl.
Examples of applications
The u tility of PHENOPSIS DB for the analysis of large
datasets has been demonstrated in recent studies. In a
first example, the multi-scale analysis o f leaf growth in
120 genotypes allowed the identification of robust emer-
gent properties in the sub-cellular control of leaf devel-
opment [27]. Secondly, the comparison of the leaf
growth response of t he same 120 genot ypes, grown in
limited soil water content, allowed the detection of gen-
otypes that maintained leaf growth under drought [28].
Examples of extensions
The whole system is flexible and easily upgradable to
host new environmental or phenotypic variables and
new types of images resulting from the evolution of
research projects or the development of new protocols.
For example, the creation of new environmental vari-
ables associated with mineral and abiotic stresses in soil
is in progress. In addition, the development of a recent
protocol for the 3D characterisation of leaf growth at
the cellular level [29] has required the creation of new
phenotypic variables. Finally, as the platform is also
used in the production of highly characterised leaf mate-
rial for molecular, biochemical or mineral content ana-
lyses, variables will be extended to metabolites co ntents,
enzyme activities, transcript profiling, etc [11,30].
Conclusions
PHENOPSIS DB provides the storage of millions of data
and hundreds of Gb o f images generated yearly in the
PHENOPSIS platform. The information system contains
useful resources for the scientific community working
on genotype × environment interactions in Arabidopsis
thaliana. Moreover, its structure serves as a template
for other groups developing similar systems.
Availability and requirements
PHENOPSIS DB is an open access database: http://bio-
web.supagro.inra.fr/phenopsis/
It is refere nced by APP (French Agency for Program
Protection) under the INRA name and with number
IDDN.FR.001.160017.000.R.P.2010.000.40000.
Metadata , images and phenotypic data from public
experiments and public genotypes can be downloaded
for further analyses. However, all analyses or figures
produced using data accessed via PHENOPSIS DB must
include a clear indication of sources such as: “ This ana-
lysis i s based upon data provided by PHENOPSIS DB”,
with citation of this paper. In the case of private data
the acknowledgement must also include a statement
such as “Permission to use these data was granted by
<name, title and affiliation>“.
Our group will serv ice PHENOPSIS DB continuously
and update it on a regular basis. Questions, comments
and requests regarding this database should be sent to
Vincent Negre at
Additional material
Additional file 1: Description of the variables stored in PHENOPSIS
DB. Four types of variables have been defined: variables provided by the
automatons, environmental instructions given by experimenters,
meteorological variables in the growth chambers and variables measured
on plants by experimenters.
Additional file 2: Description of the physical data model of the
PHENOPSIS DB database. Four tables allow the management of user
rights (Group, User, SpecialUser and GroupUser tables). They provide
authorisation on data access and data insertion and restrict the access to
specific experiments and/or genotypes listed with their characteristics in
the Experiment and Genotype tables respectively. The growth chamber in
which a particular experiment is performed, the characteristics of the
pots in this experiment and the environmental instructions provided by
experimenters are listed in the Chamber, Pot and Instruction tables
respectively. Five other tables are related to the studied variables and the
parts of the plants they are measured on. All studied variables are
defined in the Variable table and the plant parts on which they are
measured are defined in the Organ table. Micro-meteorological data are
stored in the MeteoMeasurement table. Plant watering data and names
and filename of the images collected by the automatons are stored in
the AutomatonMeasurement table. Offline phenotypic data are stored in
the OrganMeasurement table, as well as file names of plant images taken
by experimenters. A last table named Comment allows the storage of all
events and remarks associated with an experiment. Additional
supplementary material is available on the PHENOPSIS DB Web interface:
/>Acknowledgements
We would like to thank Virginie Rossard for sharing her know-how on
database management and MySQL. We thank Optimalog [31] for the
development of the PHENOPSIS platform and the automatic transfer of data.
We are grateful to all users that helped us to improve and make evolve the
PHENOPSIS DB. We also thank the informatics team for technical and server
support. Finally, we thank Sean Walsh for correcting the manuscript and the
Web interface texts. This work was supported by Agron-Omics, a European
sixth framework integrated project (LSHG-CT-2006-037704).
Author details
1
Laboratoire d’Ecophysiologie des Plantes sous Stress Environnementaux
(LEPSE), INRA-AGRO-M, UMR 759, 2 Place Viala, 34060 Montpellier Cedex 1
France.
2
Mathématiques, Informatique et Statistique pour l’Environnement et
l’Agronomie (MISTEA), INRA-AGRO-M, UMR 729, 2 Place Viala, 34060
Montpellier Cedex 1 France.
3
Institut Jean-Pierre Bourgin, UMR1318 INRA-
AgroParisTech, Versailles, France.
4
Ecologie et Ecophysiologie Forestières
INRA, Nancy Université, UMR1137, IFR 110 EFABA, F-54280 Champenoux,
France.
Authors’ contributions
JF designed and implemented the database and the Web interface,
developed R modules for graphical and statistical analyses, provided support
on the automatic transfer of data, integrated the ontologies and designed
the Web Service application. MD is responsible for the functioning of the
PHENOPSIS platform and provided support on the automatic transfer of
data. VN provided support on the automatic transfer of data, the integration
of ontologies and the Web Service interface. NW developed the modules for
image analysis. AT and PN provided support on the design of the database,
Fabre et al. BMC Plant Biology 2011, 11:77
/>Page 6 of 7
the Web interface and the Web Service application, and in the integration of
ontologies. EG developed the Web Service application. ST, CM and IH have
made their data publicly available. CG conceived the study, participated in
its design and coordination. JF and CG wrote the manuscript with the
support of all other authors. All authors have approved the final submitted
version.
Received: 26 October 2010 Accepted: 9 May 2011
Published: 9 May 2011
References
1. The Arabidopsis Genome Initiative: Analysis of the genome sequence of
the flowering plant Arabidopsis thaliana. Nature 2000, 408:796-815.
2. Seki M, Narusaka M, Ishida J, Nanjo T, Fujita M, Oono Y, Kamiya A,
Nakajima M, Enju A, Sakurai T, Satou M, Akiyama K, Taji T, Yamaguchi-
Shinozaki K, Carninci P, Kawai J, Hayashizaki Y, Shinozaki K: Monitoring the
expression profiles of 7000 Arabidopsis genes under drought, cold and
high-salinity stresses using a full-length cDNA microarray. Plant J 2002,
31:279-292.
3. Wang R, Okamoto M, Xing X, Crawford NW: Microarray analysis of the
nitrate response in Arabidopsis roots and shoots reveals over 1,000
rapidly responding genes and new linkages to glucose, trehalose-6-
phosphate, iron, and sulfate metabolism. Plant Physiol 2003, 132:556-567.
4. The Arabidopsis Information Resource. [].
5. Proteomics Database for Arabidopsis data. [bidopsis.
info].
6. Plant Ontology Consortium. [ />7. Ilic K, Kellogg EA, Jaiswal P, Zapata F, Stevens PF, Vincent LP, Avraham S,
Reiser L, Pujar A, Sachs MM, Whitman NT, McCouch SR, Schaeffer ML,
Ware DH, Stein LD, Rhee SY: The plant structure ontology, a unified
vocabulary of anatomy and morphology of a flowering plant. Plant
Physiol 2007, 143:587-599.
8. Zimmermann P, Schildknecht B, Craigon D, Garcia-Hernandez M,
Gruissem W, May S, Mukherjee G, Parkinson H, Rhee S, Wagner U, Hennig L:
MIAME/Plant - adding value to plant microarrray experiments. Plant
Methods 2006, 2:1.
9. Brazma A, Hingamp P, Quackenbush J, Sherlock G, Spellman P, Stoeckert C,
Aach J, Ansorge W, Ball CA, Causton HC, Gaasterland T, Glenisson P,
Holstege FC, Kim IF, Markowitz V, Matese JC, Parkinson H, Robinson A,
Sarkans U, Schulze-Kremer S, Stewart J, Taylor R, Vilo J, Vingron M:
Minimum information about a microarray experiment (MIAME)-toward
standards for microarray data. Nat Genet 2001, 29:365-371.
10. MIAME. [ />11. Massonnet C, Vile D, Fabre J, Hannah MA, Caldana C, Lisec J, Beemster GTS,
Meyer RC, Messerli G, Gronlund JT, Perkovic J, Wigmore E, May S,
Bevan MW, Meyer C, Rubio-Díaz S, Weigel D, Micol JL, Buchanan-
Wollaston V, Fiorani F, Walsh S, Rinn R, Gruissem W, Hilson P, Hennig L,
Willmitzer L, Granier C: Probing the reproducibility of leaf growth and
molecular Phenotypes: A Comparison of Three Arabidopsis Accessions
Cultivated in Ten Laboratories. Plant Physiol 2010, 152:2142-2157.
12. Cropdesign: Traitmill - Platform and Process. [pdesign.
com/tech_traitmill.php].
13. IJPB-Phénotypage haut débit chez Arabidopsis thaliana. [http://www-ijpb.
versailles.inra.fr/en/ppa/ppa_accueil.htm].
14. Systems biology of drought tolerance in Arabidopsis. [.
ugent.be/yield-research/465-projects2].
15. Granier C, Aguirrezabal L, Chenu K, Cookson SJ, Dauzat M, Hamard P,
Thioux JJ, Rolland G, Bouchier-Combaud S, Lebaudy A, Muller B,
Simonneau T, Tardieu F: PHENOPSIS, an automated platform for
reproducible phenotyping of plant responses to soil water deficit in
Arabidopsis thaliana permitted the identification of an accession with
low sensitivity to soil water deficit. New Phytol 2006, 16:623-635.
16. R Development Core Team: R: A language and environment for statistical
computing. R Foundation for Statistical Computing, Vienna, Austria; 2009
[], ISBN 3-900051-07-0.
17. ImageJ. [ />18. World Wide Web Consortium. [ />19. The W3C Markup Validation Service. [ />20. W3C CSS Validation Service. [ />21. TAIR Nomenclature Guidelines. [ />nomenclature/guidelines.jsp#genbank].
22. Meinke D, Koornneef M: Community standards for Arabidopsis genetics.
Plant J 1997, 12:247-253.
23. Boyes DC, Zayed AM, Ascenzi R, McCaskill AJ, Hoffman NE, Davis KR,
Görlach J: Growth stage-based phenotypic analysis of Arabidopsis: a
model for high throughput functional genomics in plants. Plant Cell
2001, 13:1499-1510.
24. Gramene. [].
25. PATO: Main Page - OBOFoundry. [ />PATO:Main_Page].
26. Mungall CJ, Gkoutos GV, Smith CL, Haendel MA, Lewis SE, Ashburner M:
Integrating phenotype ontologies across multiple species. Genome Biol
2010, 11:R2.
27. Tisné S, Reymond M, Vile D, Fabre J, Dauzat M, Koornneef M, Granier C:
Combined genetic and modeling approaches reveal that epidermal cell
area and number in leaves are controlled by leaf and plant
developmental processes in Arabidopsis. Plant Physiol 2008,
148:1117-1127.
28. Tisné S, Schmalenbach I, Reymond R, Dauzat M, Pervent M, Vile D,
Granier C: Keep on growing under drought: genetic and developmental
bases of the response of rosette area using a recombinant inbred line
population. Plant Cell Environ 2010, 33:1875-1887.
29. Wuyts N, Palauqui JC, Conejero G, Verdeil JL, Granier C, Massonnet C: High-
contrast three-dimensional imaging of the Arabidopsis leaf enables the
analysis of cell dimensions in the epidermis and mesophyll. Plant
Methods 2010, 6:17.
30. Ghandilyan A, Barboza L, Tisné S, Granier C, Reymond M, Koornneef M,
Schat H, Aarts MGM: Genetic analysis identifies quantitative trait loci
controlling rosette mineral concentrations in Arabidopsis thaliana under
drought. New Phytol 2009, 184:180-192.
31. Optimalog. [ />doi:10.1186/1471-2229-11-77
Cite this article as: Fabre et al.: PHENOPSIS DB: an Information System
for Arabidopsis thaliana phenotypic data in an environmental context.
BMC Plant Biology 2011 11:77.
Submit your next manuscript to BioMed Central
and take full advantage of:
• Convenient online submission
• Thorough peer review
• No space constraints or color figure charges
• Immediate publication on acceptance
• Inclusion in PubMed, CAS, Scopus and Google Scholar
• Research which is freely available for redistribution
Submit your manuscript at
www.biomedcentral.com/submit
Fabre et al. BMC Plant Biology 2011, 11:77
/>Page 7 of 7