báo cáo khoa học: " Identification of tissue-specific, abiotic stressresponsive gene expression patterns in wine grape (Vitis vinifera L.) based on curation and mining of large-scale EST data sets" docx
Bạn đang xem bản rút gọn của tài liệu. Xem và tải ngay bản đầy đủ của tài liệu tại đây (2.69 MB, 23 trang )
RESEARCH ARTICLE Open Access
Identification of tissue-specific, abiotic stress-
responsive gene expression patterns in wine
grape (Vitis vinifera L.) based on curation and
mining of large-scale EST data sets
Richard L Tillett
1
, Ali Ergül
2
, Rebecca L Albion
1
, Karen A Schlauch
1
, Grant R Cramer
1
and John C Cushman
1*
Abstract
Background: Abiotic stresses, such as water deficit and soil salinity, result in changes in physiology, nutrient use, and
vegetative growth in vines, and ultimately, yield and flavor in berries of wine grape, Vitis vinifera L. Large-scale expressed
sequence tags (ESTs) were gener ated, curated, and analyzed to id entify major genetic determinants responsible for stress-
adaptive responses. Although roots serve as the first site of perception and/or injury for many types of abiotic stress, EST
sequencing in root tissues of wine grape exposed to abiotic st resses has been extremely limited to date. To overcome this
limitation, large-scale EST sequencing was conducted from root tissues exposed to multiple abiotic stresses.
Results: A total of 62,236 expressed sequence tags (ESTs) were generated from leaf, berry, and root tissues from
vines subjected to abiotic stresses and compared with 32,286 ESTs sequenced from 20 public cDNA libraries.
Curation to correct annotation errors, clustering and assembly of the berry and leaf ESTs with currently available V.
vinifera full-length transcripts and ESTs yielded a total of 13,278 unique sequences, with 2302 singletons and 10,976
mapped to V. vinifera gene models. Of these, 739 transcripts were found to have significant differential expression
in stressed leaves and berries including 250 genes not described previously as being abiotic stress responsive. In a
second analysis of 16,452 ESTs from a normalized root cDNA library derived from roots exposed to multiple, short-
term, abiotic stresses, 135 genes with root-enriched expression patterns were identified on the basis of their
relative EST abundance in roots relative to other tissues.
Conclusions: The large-scale analysis of relative EST frequency counts among a diverse collection of 23 different
cDNA libraries from leaf, berry, and root tissues of wine grape exposed to a variety of abiotic stress conditions
revealed distinct, tissue-specific expression patterns, previously unrecognized stress-induced genes, and many novel
genes with root-enriched mRNA expression for improving our understanding of root biology and manipulation of
rootstock traits in wine grape. mRNA abundance estimates based on EST library-enriched expression patterns
showed only modest correlations between microarray and quantitative, real-time reverse transcription-polymerase
chain reaction (qRT-PCR) methods highlighting the need for deep-sequencing expression profiling methods.
Background
The study of gene function in the wine grape (Vitis vini-
fera L.) has been f undamentally advanced by the a vail-
ability of whole genome sequences of two Pinot Noir
cultivars (clones 115 and PN40024) [1,2] as well as
BAC-based physical maps [3]. To study wine grape gene
function, multiple transcriptomic approaches have been
developed [4,5], including expressed sequence tags
(ESTs) [6], massively parallel signature sequencing
(MPSS) [7], small RNA deep sequencing [8], Illumina
sequenc ing [9], and multiple oligonucleoti de microar ray
platforms [10-13].
Most V. vinifera varieties are ranked as moderately
sensitive to sensitive to salinity stress [14-17] with Cl
-
anion toxicity having the greatest impact on growth and
vine health [18]. In contrast, V. vinifera is relatively
* Correspondence:
1
Department of Biochemistry and Molecular Biology, MS330, University of
Nevada, Reno, NV 89557-0330, USA
Full list of author information is available at the end of the article
Tillett et al. BMC Plant Biology 2011, 11:86
/>© 2011 Tillett et al; licensee BioMed Central Ltd. This is an Open Access article distributed under the terms of the Creative Commons
Attribution License ( which permits unrestricted use, distribution, and reproduction in
any medium, provide d the original work is properly cited.
water-deficit stress tolerant. Regulated-deficit irrigation
can be used advantageously to inhibit vine growth with-
out significant effects on fruit yield and has been
reported to improve grape quality through the elevation
of a variety of metabolites including anthocyanins and
proanthocyanins [19-22]. mRNA and enzyme expression
profiles during development and in response to abiotic
stress effects have been studied intensively in wine grape
berries [11,12,23-30]. Additional studies h ave examined
mRNA expression patterns in response to abiotic stres-
ses in leaves and shoot tissues [10,31], plant-pathogen
interactions [13,32,33], and the events associated with
Vitis bud endodormancy [34-36].
The roots of te rrestrial plants are vital organs for the
acquisition of water and essential minerals. As such,
roots serve as the first site of perception and/or injury
for many t ypes of abiotic stress, including water defi-
ciency, salinity, nutrient deficiency, and heavy metals
[37-39]. Vitis roots also accumulate a number of unique
sti lbene and oligostilbene defe nse compo unds, chemical
species not found in seed or other phytoalexin-rich tis-
sues [40,41]. Despite the importance of roots, the study
of V. vinifera root tissues has been rather limited in
contrast to the study of berry tissues. In a comparative
EST study, Moser and colleagues generated 1555 ESTs
from V. vinifera cv. Pinot Noir root tissue and found
them enriched for genes with functions in primary
metabolism and energy [42]. Using a 12 K CombiMatrix
custom array, Mica and colleagues profiled the expres-
sion of microRNAs (miRNAs), small (19-24 nt) non-
coding RNAs that negatively regulate gene expression
post-transcriptionall y in multiple organs. This study
showed that roots had nine and four miRNAs with
either significantly increas ed or decreased relative abun-
dance, respectively, relative to leaves and early inflores-
cences [8]. A framework physical or genetic map has
also been developed for wine grape, using resistant and
susceptible cross es, to locat e genetic determ inants asso-
ciated with resistance to the root pathogen phylloxera
[43]. EST transcriptional profiling has recently been
used to identify genes that might be involved in resi s-
tance to Rhizobium vitis in the semi-resistant Vitis
hybrid ‘Tamnara’ [44].
In grapevine, more than 350,000 EST sequences have
been generated and analyzed to identify gene expression
related to a wide range of processes including berry
development in wine grape [30,45] and in table grape
[46], tissue-specific gene expression [6,42], the fulfill-
ment of chilling requirements in dormant grape buds
[34], and the characterization of resistance to pa thogens
such as Xylella fastidiosa [47] and Rhizobium vitis [44].
To discern how steady-state transcript accumulation
changes in response to multiple environmental stress
treatments, we generated a total of 45,784 ESTs from
leaf and berry tissues from vines subjected to abiotic
stresses (e.g., salinity, cold, heat, water deficit, and
anoxia). These were compared with 32,286 ESTs within
20 libraries derived from leaf and berry tissues deposited
in the public databases. Clustering and assembly of leaf
and berry ESTs with all availabl e V. vinifera full-length
transcripts and ESTs returned a total of 13, 278 unique
sequences, with 2302 singletons and 10,976 clusters
mapping to known gene models. Of these 10,976 unique
clusters, 739 transcripts were found to have significant
differential expression among the libraries examined.
Comparison of in silico digital expression analysis with
transcript abundance estimates obtained by Affymetrix
Vitis GeneChip
®
genome microarrays and quantitative
real-time reverse transcription-polymerase chain reac-
tion (qRT-PCR) revealed that EST frequency counts
were in moderate agreement with microarray or qRT-
PCR analysis. Given the relative lack of ESTs available
for grape root tissues, 16,452 ESTs were sequenced
from roots of young vines (10 cm in length), grown
under unstressed conditions as well as under cold, sali-
nity, and water deficit stress. The major categories of
genes expressed in root tissues were defined and 135
genes with root-specific or highly enriched root expres-
sion patterns were identified.
Results
EST library analysis from abiotically stressed tissues of
Vitis vinifera
cDNA libraries derived from abiotically stressed leaves
(Library ID 10208) and berries (Library ID 12435) of V.
vinifera cv. Chardonnay, were sequenced to generate
24,400 and 21,384 ESTs, respectively (Table 1). In addi-
tion, a total of 16,452 ESTs were sequenced from a nor-
malized cDNA library synthesized from Magenta box
grown root tissues from cv. Cabernet Sauvignon
exposed to control, water deficit, cold, and salinity stress
conditions (see Methods section for details) (Lib rary ID
22274). In t otal, 66,236 expressed sequence tags (ESTs)
were generated (Table 1). The leaf and berry libraries
were described previously in the context of flower and
berry development [6]. In addition, five unstressed leaf
libraries, representing a total of 8642 ESTs, 13 whole
berry with seeds libraries derived from unstressed source
tissues at various stages of berry development, repre-
senting a total of 31,840 E STs, and t wo root libraries,
representing a total of 1657 ESTs, present within the
UniGene database [48] were compiled (Table 1). These
EST collections were used as tools to identify transcripts
encoding abiotic stress responsive transcripts in leaves
and berries and root-specific or root-enriched
transcripts.
To create up-to-date annotations, each EST was
matched with the corresponding “tentative consensus”
Tillett et al. BMC Plant Biology 2011, 11:86
/>Page 2 of 23
(TC) contig sequence from the Vitis vinifera Gene Index
(VvGI, version 6, July 30, 2008, Dana Farber Cancer
Institute) [49] and predicted peptide sequences fr om the
Genoscope 8.4X Vitis vinifera cv. Pinot Noir (GSVIV)
genome assembly, August 8, 2007 [1]. A newer version
of VVGI (7.0, 4/17/2010) was released since this analysis
was undertaken. However, this release is substantially
similar to 6.0, containing the same 25,497 gene models
derived from the NCBI Ref Seq source and only 4851
additional ESTs and was not expected to substantially
alter the findings presented. A newer 12X coverage draft
of the Vitis vinifera genome has also become available.
However, some gene models annotated in this 12X draft
were found to contain greater frequencies of intron-
exon splices not supported by EST evidence (data not
shown) and, therefore, the 12X draft was not used.
Because the mixed stress normalized root library was
generated using a normalization technique that would,
in effect, reduce the apparent expression of the most
abundant transcripts, and because few other unstressed
root ESTs were available for comparison, characteriza-
tion of the genes in the root EST library was performed
in a separate analysis.
Identifying EST redundancy
In estimation of gene expression patterns inferred from
EST frequencies, which are the number of times the
transcript of gene x
i
is observed in relation to the tota l
number of random observations of all genes, (x
i
/ ∑x),
any ESTs from a si ngle clone sequenced from both the
5’ and 3’ directions must be counted exactly once to
avoid overestimation of the frequency of genes. cDNA
library sequencing strategies varied among sources, with
Table 1 cDNA Library Attributes
Tissue dbEST
Library ID
cDNA
Orientation
(5’/3’)
Submitted Description Developmental
Stage
ESTs as
per dbEST
Unique
clones
Stressed
Leaf
10208 both An expressed sequence tag database for abiotic stressed
leaves of Vitis vinifera cv. Chardonnay
Juvenile & adult 24,400 21,499
Stressed
Berry
12435 both An expressed sequence tag database for abiotic stressed
berries of Vitis vinifera cv. Chardonnay
Mixed: 8, 9, 11, 13, 15,
16 weeks DAF
21,384 18,963
Leaf 12752 both Cabernet Sauvignon Leaf - CA32EN Mid-season 2,669 1,465
Leaf 12753 both Cabernet Sauvignon Leaf-CA48EN Mid-season 2,051 1,104
Leaf 12948 both Cabernet Sauvignon Leaf - CA48LN Late Season 2,248 1,441
Leaf 12949 both Cabernet Sauvignon Leaf - CA41LN Late Season 1,146 739
Leaf 14446 5’ Grape Leaf pBluescript Library Juvenile 528 528
Leaf subtotal 8642 5277
Berry 4059 both Grape berries Lambda Zap II Library Véraison 105 96
Berry 8669 3’ Green Grape berries Lambda Zap II Library Pre-véraison 1,989 1,989
Berry 8670 3’ Ripening Grape berries Lambda Zap II Library Post-véraison 3,268 3,267
Berry 8671 both Véraison Grape berries Lambda Zap II Library Véraison 96 96
Berry 11063 3’ Véraison Grape berries SuperScriptTM Plasmid Library Véraison 623 623
Berry 11064 3’ Véraison Grape berries Lambda Zap II Library Véraison 1,691 1,691
Berry 12754 both Cabernet Sauvignon Berry - CAB2SG Pre-véraison 4,429 2,339
Berry 13015 both Cabernet Sauvignon Berry Stage I - CAB3 Pre-véraison 3,414 1,955
Berry 13016 both Cabernet Sauvignon Berry - CAB4 Pre-véraison 3,836 2,155
Berry 13017 both Cabernet Sauvignon Berry Post-Véraison - CAB7 Post-véraison 3,558 1,911
Berry 14444 5’ Grape Berry pSPORT1 Library Véraison 1,743 1,743
Berry 20043 n.d. Clusters 4 cm (VvC3) Pre-véraison 4,053 4,053
Berry 20044 n.d. Berries Véraison stage (VvC4) Véraison 3,035 3,035
Berry subtotal 31840 24953
Root 14445 5’ Grape Root pSPORT1 Library One year-old root 1,555 1,555
Root 16696 n.d. Vitis vinifera Cabernet Sauvignon root n.d. 102 102
Stressed
Root
22274 5’ VVM - Normalized Cabernet Sauvignon root Young vines 16,452 16,452
Total 104,402 88,828
Libraries generated or used in the present study. The Stressed Leaf (SL) and Stressed Berry (SB) libraries were generated previously [6], the Stressed Root “ VVM”
library was gene rated specifically for this study, and all other libraries were obtained from the dbEST database maintained by the NCBI. Tissues, dbEST library
identifier, sequencing direction, and library descriptions are provided. Unique clones were identified from the ESTs of bidirectionally sequenced libraries as
described in the “Methods” and “Results” sections.
n.d. not determined
Tillett et al. BMC Plant Biology 2011, 11:86
/>Page 3 of 23
some ESTs being generated from only single-pass 5’ or
3’ reads, whereas other libraries were subjected to bi-
directional and/or same-direction r e-sequencing of
picked clones. In the abiotically stressed leaf library
(Library ID 10208), 2802 ESTs had been seque nced
twice (representing 1401 paired reads). Another 2250
ESTs had been sequenced three times (750 triplets).
Eliminating this redunda ncy reduced the EST total from
24,400 ESTs to 21,499 unique clones (Table 1). The
GSVIV gene i dentifiers of paired clone ends were com-
pared with the expectation that gene IDs would agree
between multiple ESTs from the same transcript. Of the
1401 pairs of clones from this abiotically stressed leaf
library, 114 (7%) pairs matched the annotation of differ-
ent genes and the ID with greatest confidence score was
retained. Similarly, only 60 of the 750 triplicated clones
(8%) within this library were in disagreement as to gene
identity. The total clone redundancy and gene assign-
ment error rates were similar for ESTs from the stressed
berry l ibrary (Library ID 12435). In this EST collection,
2402 ESTs had bee n sequenced twice (representing
1201 pairs), 1821 ESTs had been sequenced three times
(607 triplets), and two clones had been sequenced four
times each. Eliminating this redundancy reduced the
EST total from 21,384 ESTs to 18,963 unique clones
(Table 1). Of the 1201 pairs and 607 triplicates, 107
(9%) and 68 (11%) were in disagreement, respectively.
This method of r edundancy elimination was extended
next to those bi-directionally sequenced clones from the
non-stressed leaf and berry libraries obtained from the
UniGene database (Table 1). Many errors were found in
the annotated compositions of leaf (Libra ry IDs: 12752,
12753, 12948, and 12949) and berry libraries (Library
IDs: 12754, 13015, 13016 and 13017). The errors and
the corrections made are explained below as p resented
in Figure 1 and summarized in Table 2. For the Caber-
net Sauvignon leaf library CA48LN (Library ID 12948),
we were able to organize 1486 ESTs into 743-paired
reads. Within these pairs, > 68% (509) could not be
assigned to the same gene. Similarly, high rates of dis-
agreement were found within other li braries listed in
Table 2. As these rates were higher than those observed
in paired reads from abiotically stressed leaf or berry
libraries, the cause or causes of these higher error rates
were investigated further.
The cDNA libraries presented in Table 2 were bidirec-
tionally sequenced a nd had annotation that allowed for
the partial reconstruction of the workflow by which they
were prepared and sequenced originally [50] with clone
names deposited to NCBI such as “ CA48LN09IF-A9,
5’end.” This annotation identifies the library “CA48LN,”
a batch number ("09,” the plate within that batch (I),
location on a 96-well plate (A9) and direction (5’). All
ESTs in a given library shared the library stem, batches
gene rally contained four plates (I-IV), and 80% of plates
were sequenced from both 5’ and 3’ directions. When
the forward and reverse pairs of ESTs in Library ID
12948 were organized by their 96-well plate well order
(A1,A2, ,A12, ,H1, ,H12), various patterns of “well
slip” were identified, wherein the gene ID for well A9
(5’ ) matched the gene ID of well A10 (3’ ), A10 (5’)
matched A11 (3’ ), and so forth. The distance of these
“well slips” was neither uniform nor consistent.
To determine all pairs of ESTs with incorrectly paired
wells, a method w as devised that would identify robustly
“well slips” of non-uniform distances, analogous to the
dot-plot method of local nucleotide sequence alignment
[51]. In this method, the gene IDs of ESTs were arranged
from A1-H12 for each 5’ and 3’ plate and plotted along
two axes with a dot designating wherever the gene IDs
were identical (Figure 1). The dot plot proved effective at
identifying forward-reverse pairing in plates with “well
slips,” such as in Figure 1A, wherein the four forward
and reverse plates of “batch 09” in leaf Library ID 12948
were plotted in the order 1f, 1r, 2f, 2r, 3f, 3r, 4r along
both the × and y axes. The main diagonal bisecting the
plot, where the ordered list is identical to itself, is flanked
by four offset diagonals that illustrate where the forward
and reverse plate pairs match (1f≈1r, 2f≈2r,
etc.)
. The
matching clearly distinguished pairs of plates through the
variable “well slips” in Library ID 12948.
This matching process was repeated for all plate
batches (generally four forward and four reverse plates
per batch) of the libraries listed in Table 2 and other
error types besides the “well slips” seen in Library ID
12948 were uncovered. Some plates were duplicated, as
seen in Figure 1B, wherein all combinations of the for-
ward and reverse of four individual plates matched in
berry Library ID 12753 (1f≈1r≈2f≈2r). Were these errors
not identified, the ESTs of plate 1 and 2 would have
been added both t o the frequency totals of the genes
therein (i.e., counting twice what should only be
counted once), resulting in an overestimation of the fre-
quency of those transcripts in the library. Other pairs of
plates showed a less complete duplication pattern as
seen as the inchoate diagonals between plates 1 and 2
(pink) and between 2 and 3 (purple) in Figure 1E, and
all four plates (purple) in Figure 1F. In other cases, a
plate did not match the annotated reverse, but a differ-
ent plate instea d, such as the pair-swapping of Library
ID 12948 (3f≈4r and 4f≈3r) in Figure 1C and triplication
(2f≈2r≈3r) / mis-pairing (3f≈1r ) in berry Lib rary ID
13016 (Figure 1D). Where identified, these partial dupli-
cation s and mismatched plates were handled just as the
full duplications were, with the EST counts reduced to
reflect the true number of independent clones involved.
The same analytical method was then extended to
compare every plate in a library to all other plates in
Tillett et al. BMC Plant Biology 2011, 11:86
/>Page 4 of 23
H G
D F E
B A
C
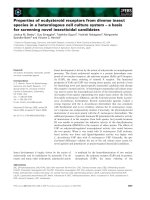
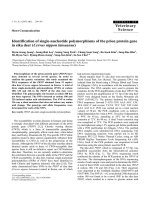
Figure 1 Correcting erroneous EST identities in bi-directionally sequenced leaf and berry libraries with dot plots.Contignames
assigned to ESTs from bi-directionally sequenced libraries were plotted in two dimensions to identify “motifs of self-similarity” analogous to dot-
plot sequence alignments. The sequencing batch, plate order, and well position were recapitulated from dbEST submission files as a sequential
list arranged as 1f, 1r, 2f, 2r, 3f, 3r, 4f, 4r, and plotted against itself in the x and y axes. A) Diagonals indicate four sets of plates from Library ID
12948, batch 8 are named and paired correctly (blue); B) Library ID 12753, batch 1, all combinations of plates 1f, 1r, 2f and 2r are duplicates
(salmon), plates 3 and 4 are correctly paired (blue); C) Library ID 12948, batch 10 plate 1f matches 1r (blue), plate 2f and 2r did not match, plate
3f matches 4r (salmon), 4f matches 3r (magenta); D) Berry Library ID 13016, batch 1, plate 3r matches with 2f and 2r (salmon), 1r matches with
3f (magenta), 1f has no match, plate 4 is paired correctly (blue); E) Library ID 13017, batch 2, Plates 1 and 2 display partial matching (pink), plates
2 and 3 also partially match (purple); F) Berry Library ID 13017 batch 3, partial matching between all four plates (purple); G) Berry Library ID
13015, batch 2, plate 1 matches batch 5 plate 1r (salmon); other plate match errors are also apparent in lower right hand quandrant (magenta);
H), Leaf Library ID 12752, batch 5, plate 4r matches Berry Library ID 12754, batch 5, plates 4fr (salmon).
Tillett et al. BMC Plant Biology 2011, 11:86
/>Page 5 of 23
that library. One additional case of unexpected matching
was found, where plates from one batch match the
plates of a different batch in the same library (Figure
1G). Lastly, we extended the method to compare every
plate in every library against all other plates in all ot her
libraries, even those annotated as arising from different
tissues.Fromthis,asingleinstancewasfoundwherea
plate in the leaf Library ID 12752 (plate 4r) was identi-
cal to a pair of plates from berry Library ID 12754 (Fig-
ure 1H). The genes encoded on these plates were
consistent with those found in mature berry library (e.g.,
cell wall proteins, ripening-related proteins, and no
photosynthesis genes), but not a leaf library, leading to
the conclusion that a cDNA library misassignment error
had occurred, and leading to the exclusion of these data
from our analyses. To uncover other possible library
assignment errors, every plate from all libraries in the
present study were compared against all other libraries
(e.g., bud tissues, petioles, flowers, and pathogen
infected leaves) that were not co nsidered for our abiotic
stress analysis, but no further spurious pairings were
detected (data not shown). Upon exhaustively identifying
all observable patterns of errors, 5’ ESTs were paired
with their 3’ partners and the unique clones within each
library were counted (Table 1). In total, errors in the
identification/annotation of 5558 of 23,351 ESTs (24%)
were discovered from the libraries listed in Table 2.
Estimating gene expression by EST frequency
In order to measure differences in gene expression pat-
terns among stressed and unstressed leaves and berries,
the EST frequency within each GSV IV gene ID (or Uni-
Gene ID, in cases where no GS VIV gene mode l could
be assigned) was calculated for each leaf, berry, stressed
leaf, and stressed berry library. The EST frequencies of
the five leaf libraries were combined by weighted mean,
as were the 13 berry frequencies [52]. Differential gene
expression was then ca lculated using the combined EST
frequency counts for genes using the IDEG6 web tool
[53]. The chi-squared test (c
2
) was used as the test sta-
tistic, as recommended when conducting statistical com-
parisons of more than two groups [54]. At a p-value
cut off of < 0.001, 739 genes were estimated to have dif-
ferential expression among the libraries comp ared. The
739 genes were then organized by hierarchical cluster-
ing, using a function of the Pearson correlation coeffi-
cient as the distance metric and the average
agglomeration method (Figure 2). The sets of genes
clustered first between tissue type, as seen by the first
branching in the dendrogram, and then by control or
abiotic stress condition, as seen in the next two
branches. At this distance the four clusters generally
correlated to transcript abund ance profiles within a sin-
gle library type with the largest cluster of 355 transcripts
correspond ing to tissues of stressed leaves (SL). The leaf
cluster (L) contained 127 genes, whereas stressed berry
(SB) and unstressed berry clusters (B) contained 127
and 130 genes, resp ectively. The annotation, gene mod-
els, and relative frequencies of all 739 genes are listed
by cluster in Additional Files 1, 2, 3 and 4. The high
number of transcripts present within the stressed leaf
Table 2 Correction of errors in the identifications of ESTs in a set of libraries
Error category Specific error type # of Errors See also
Well pairing “slips”
Leaf Library ID 12948 10 Figure 1A
Leaf Library ID 12949 1
Incorrect plate pairings
Leaf Library ID 12753 Plate quadruplicated 1 Figure 1B
Berry Library ID 12754 Plate quadruplicated 1
Leaf Library ID 12948 Plate pair swap 2 Figure 1C
Berry Library ID 13015 Plate pair swap 2
Plate triplicated 3 Figure 1G
Berry Library ID 13016 Plate triplicated 1 Figure 1D
Plate pair swap 1
Partial plate duplications
Berry Library ID 13016 6
Berry Library ID 13017 28 Figure 1E, 1F
Sequences originated from a different library
Leaf Library ID 12752
and
Berry Library ID 12754
Plate of “leaf” ESTs actually a triplicate of berry Lib.12754 ESTs 1 Figure 1H
Errors in the supplied annotation of a set of cDNA clones that were sequenced bidirectionally were identified and corrected to generate accurate counts of EST
frequency. Errors are categorized by the scope of the error, from “well slips” betwe en single pairs of 5’ and 3’ 96-well plates of ESTs, through incorrectly
identified pairs of plates of increasing scope. The number of times each error occurred (pairs or larger groups of 96-well plates affected) and was corrected is
shown. Errors that are visualized by dot-plot in Figure 1 are cross-referenced.
Tillett et al. BMC Plant Biology 2011, 11:86
/>Page 6 of 23
cluster might reflect the depth to which this library was
sequenced, the variety of abiotic stresses to which these
source tissues were subjected, and the diversity of tran-
scripts expressed within the grape leaf transcriptome
under abiotic stresses [10].
Of these 739 genes with different ial expression among
the cDNA library clusters, 637 were matched success-
fully to GSVIV gene/protein identifiers, which were then
matched with the annotation files associated with Vitis-
Net [55]. VitisNet networks were combined into cate-
gories of their major networks, with metabolic networks
divided into primary metabolism, photosynthesis, sec-
ondary metabolism, and hormone biosynthesis, the latter
category being grouped with the hormone signaling
category. Gene IDs that were “out -of-network”,butthat
had functional annotations associated with them in the
VitisNet master list were also incorporated into the
functional category designations. In Figure 3, the func-
tional categories of genes identified within the four
major clusters are shown.
Without over-interpretation, some key differences
among the functional categories of genes prominent
within each organ/condition are clearly apparent. For
example, unstressed leaves (Figure 3A) were distin-
guished by a large proportion (28%) of primary meta-
bolic genes with some photosynthetic genes, such as
RUBISCO small subunit and plastidic photosynthetic
electron transport components being extremely over
represented. Transcripts fo r non-specific l ipid-transfer
protein, metallothionein, early light-induced protein
(ELIP1), and several unknown genes were also hi ghly
represented within this cluster along with 23S rRNA
(Additional File 2). In stressed leaf, 11% of transcripts
encoded photosynthesis-related functions, incl uding
plastidic ATP synthase and electron transport chain
subunits, suggesting that higher demands and/or
damage might occur under stress that must be repaired
(Figure 3B). Consistent with this suggestion is the over
representation of several families of low molecular heat
shock proteins. Leaves under abiotic stress expressed a
greater proportion of specific transport genes (21%)
(Additional File 1). Interestingly, the activity of transpo-
sons is apparently de-repressed in stressed leaves as
judged by the preponderance (7%) of a centromere-spe-
cific class of retrotransposons. Similar abiotic induction
of retroelements in non-germline tissue has been
described in Solanaceous species and the ABA-induction
of the Tnt1A promoter in Arabidopsis thaliana [56].
The unstressed berry cluster possessed overrepresented
transcripts encoding genes with functions involved in
primary metabolism, translation, cell wall-related pro-
teins (9%), and transport (12%) (Figure 3C, Additional
File 4). In contrast, the stressed berry cluster (Figure
3D) had the highest proportion of genes annotated as
“ stress-re sponsive” (17%) including overrepresented
transcripts encoding xyloglucan endotransglucosylase/
hydrolases, a DEAD box RNA helicase, and seed storage
proteins including albumins and globulins and several
highly abundant unknown proteins (Additional File 3).
Correlation with microarray data
Next, differences in transcript expression patterns esti-
mated by EST frequency were compared with a second
platform, the Affymetrix
®
Vitis GeneChip
®
microarray.
Of the 739 transcr ipts described above, microarr ay pro-
beset identifiers could be assigned for 489 of them. All
differentially expressed genes available from microarray
experiments in which similar stresses were imposed
were collected. For leaf tissue, within which our stressed
leaf library included a mixture of drought, NaCl, heat,
and light stressed tissue, two experiments were used as
a source for microarray data: an experiment in which
drought and salt stress were applied over a 16 d period
[10] and an experiment that analyzed rapid changes (≤
24 h) in gene expression under osmotic stress
SL (n=355)
L (n=127)
SB (n=127)
B (n=130)
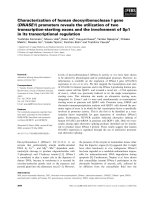
Figure 2 Heat-map and two-dimensional hierarchical clustering
of EST frequencies in 739 differentially expressed genes
among cDNA libraries from stressed and unstressed leaves and
berries. Color shown is given in normalized EST frequency per
10,000 ESTs, scale from blue at f = 0 to white to red at f > 53.6
(inset). Four major clusters that correspond to single-type
predominance are labeled (with the number of genes within the
cluster) stressed leaf (SL), leaf (L), Stressed Berry (SB), Berry (B).
Tillett et al. BMC Plant Biology 2011, 11:86
/>Page 7 of 23
(mannitol), NaCl, and chilling exposure [31]. For the
berry libraries, microarray data from a drought stressed
berry time course experiment of Chardonnay and
Cabernet Sauvignon [27] were compared with EST fre-
quency data. F ollowing the example of van Ruissen and
colleagues [57], probeset expression values were then
compared with EST frequencies using only those probe-
sets for which significant differences were observed
between stressed and unstressed tissues in the original
microarray experiments. Using this method, 184 com-
parisons of sign ificantly different changes were plotted
(Figure 4). Overall correlation between the microarray
and frequency-based expression measures was modest.
The non-parametric Spearman rank correlation was
modestly positive, at (r
s
= 0.2), but with a P < 0.005,
indicating that this similarity, while modest, is extremely
unlikely to be due to chance alone. Pearson correlation
was similar (r =0.21).Inotherstudiescomparing
microarray to EST or similar tag-based technologies,
modest Spearman and Pearson correlations have be en
observed [58]. Following the example of Li and collea-
gues, the directional concordance, which is the direc-
tional agreement in either increased or decreased
relativ e transcript abundance in response to stress treat-
ment, among the 184 significant genes common to both
microarray or EST sampling detection methods was
determined. In their comparison of SAGE tags with
microarrays in multiple human tissues, these authors
found 75% directional concordance among significant
genes [58]. Similarly, for our 184 shared genes, the
directional concordance was 69% or more than two
agreements per disagreement.
16%
2%
2%
4%
2%
10%
13%
4%
5%
1%
2%
3%
11%
2%
17%
8%
28%
1%
3%
3%
6%
9%
8%
13%
2%
2%
1%
2%
13%
2%
5%
1%
%
14%
2%
2%
22%
6%
5% 3%
5%
5%
2%
9%
12%
1%
10%
3%
17%
9%
11%
2%
3%
3%
1%
6%
5%
2%
5%
2%
1%
21%
2%
3%
1%
7%
Leaf
Stressed Leaf Stressed Berry
Berry
A
B
C
D
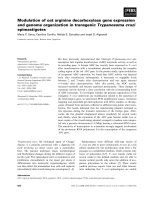
Figure 3 Functional categories of differentially expressed transcripts identified by EST frequency analysis. Functional assignments of
genes found in the four major clusters of differentially expressed genes. At the chosen hierarchy depth / distance, the four clusters correspond,
in large part, to maximal frequencies within A) Leaf, B) Stressed Leaf, C) Berry, and D) Stressed Berry cDNA libraries. Assignments are based upon
the data available at VitisNet Chart colors progress clockwise from the top.
Tillett et al. BMC Plant Biology 2011, 11:86
/>Page 8 of 23
In order to verify the gene expression ratios deter-
mined by microarray analysis, qRT-PCR was performed
on the set of genes listed in Additional file 5. These
genes were selected at random and represented genes
expressed preferentially in either leaf or berry tissues.
Relative mRNA expression for 17 and 22 transcripts was
assayed in drought-stressed and well-watered berry tis-
sue and leaf tissue, respectively. A linear regression of
the log
2
-ratios of those genes found strong correlation
between transcript abundance measured by microarray
and qRT-PCR metho ds (Pearson correlation, r = 0.85)
and a very high degree of directional concordance (34/
39 genes or 87%) (Figure 5).
Identification of root-enriched genes
The 16,452 ESTs sequenced from the normalized abiotic
stressed Cabernet Sauvignon root cDNA library (VVM)
were matched to their VvGI ver. 6 consensus sequence
contigs [59] and, when possible, to the 8.4X genomic
GSVIV gene/protein identifiers and matched with the
annotation files associated with VitisNet [55], resulting
in the identification of 6424 non-redundant transcripts.
Of these, 6002 were mapped successfully to 8.4X GSVIV
gen e models, wher eas the remain ing 307 singletons and
115 VvGI contigs did not match GSVIV gene models.
The cDNA librar y normalization method was successful
in generat ing a highly complex library, with 3449 (54%)
unique transcripts being represented by EST singletons.
Annotation of the 6424 non-redundant root transcripts
revealed 4505 (70%) had known functions, 455 (7%)
matched a previously annotated gene model, but the
function was unclear, and 1464 (22.8%) had unknown
functions, with no homology matches to any previo usly
described gene (Figur e 6A). The functional categories
were assigned for the 4505 transcripts with known func-
tions (Figure 6B). Overall, the VVM normalized library
contained a high diversity of transcripts with the func-
tional categories of primary metabolism, signal transduc-
tion, and transport systems being well represented
(Figure 6B).
Next, the 16,452 VVM Caberne t Sauvignon root ESTs
plus an additional 1657 ESTs from two Cabernet Sau-
vignon root libraries (Library ID 14445, 16696; Table 1)
were analyzed f or either root-specif ic or root-enriched
transcripts. These root cDNA libraries were compared
with a total of 291,233 ESTs from 114 libraries compris-
ing the NCBI UniGene dataset .
gov/UniGene/lbrowse2.cgi?TAXID=29760[48] with the
exception of five EST lib raries derived from in vitro or
cell cultures (Library ID 10498, 15513), mixed organ (e.
g., root and leaf together) cDNA libraries (Library ID
20007, 20010), or an amplified fragment length
r
s
= 0.2047
P = 0.005
46
81
28
29
-10 -5 5 10
-4
-2
2
4
6
log
2
[EST frequency difference (stressed/not stressed)
]
Microarray gene expression [log
2
(
stress
/
control
)]
Figure 4 Scatterplot of EST frequencies compared with
microarray expression levels. Log
2
-transformed frequency
distributions of ESTs from mixed stressed leaf (e.g., water deficit,
NaCl, heat, high light) and berry (water deficit stress) and unstressed
leaf and berry tissue were compared to 184 Affymetrix
®
Vitis
GeneChip
®
log
2
-abundance ratios of chilling, osmotic (mannitol),
and salt stress, and water-deficit-stressed leaf [10,31] and water-
deficit-stressed whole berry tissues [24]. Differences in gene model
EST frequencies between stressed and unstressed library pairs (i.e.,
stressed berries compared with unstressed berries) were plotted
along a log
2
scale as well. The Spearman rank correlation, r
s
, was
0.2047, with likelihood P = 0.005). Filled and gray circles indicate
agreement and disagreement in directional concordance,
respectively. The total number of genes present in each Cartesian
quadrant are shown in gray-shaded boxes.
-3-2-1 1234567
-3
-2
-1
1
2
3
4
5
6
7
leaf
berry
19
13
3
2
log
2
(wd/ww) by microarray
log
2
(
wd
/
ww
)
by qRT-P
C
R
Figure 5 Expression of stress-related genes in V. vinifera leaves
and berries as detected by microarray and qRT-PCR. Log
2
-
transformed values of Affymetrix
®
Vitis GeneChip
®
signal intensities
(x-axis) and real time-RT-PCR expression log
2
-ratios (y-axis) of 22
genes in leaf tissue (filled circles), as well as 17 genes in berry tissue
(open circles) of water deficit (wd) and well watered (ww) vines. A
linear regression has slope m = 0.92 and Pearson correlation r =
0.85 for the total data set of 39 pairs of log
2
-ratios [10,24]. The totals
of genes present in each Cartesian quadrant are shown in gray-
shaded boxes. qRT-PCR data were derived from three biological
replicates.
Tillett et al. BMC Plant Biology 2011, 11:86
/>Page 9 of 23
polymorphism (AFLP) cDNA library (Library ID 20099).
Relative EST frequency counts were calculated as pre-
viously described using weighted averages for the com-
bination of libraries grouped into either “root” or “non-
root” groups. EST frequency c ounts for genes with t wo
or more ESTs within one or both of the library sets (sin-
gletons were removed) and corresponding differential
gene expression patterns were calculated with the
IDEG6 web tool using the Audic- Claverie statistic (AC),
p -value < 0.01. Bonferroni multiple-testing correction
was applied to consider only p-values < 3.0 × 10
-6
[53,60]. The comparison of root ESTs against all non-
root ESTs resulted in the initial identification of 255
genes that had p-values below the significance threshold.
Furthermore, the AC statistic identified 135 “ root-
enri ched” transcripts that showed greater frequencies in
root compared with non-root tissues as listed in Table
3. In addition, 119 of the 255 genes were identified as
being enriched in the non-root libraries. Because a nor-
malized root cDNA library was analyzed, these 119
genes were not considered further as the normalization
process was expected to result in a systematic
underrepresentation of highly abundant root transcripts.
Evaluation of the functional categories of the 135 root-
enriched genes showed that genes for primary an d sec-
ondary metabolism as well as transport processes were
more numerous co mpared with the entire root EST col-
lection (Figure 6C).
Validation of root-enriched genes
In order to confirm root expression patterns estimated
by EST frequency, the expression of a set of putative
root-specific or root-enriched genes was selected for
validation by qRT-PCR. Gene-specific primers were
designed for ten of the 135 highly root-enriched tran-
scripts. Genes were selected not only for those with very
high root E ST count, b ut also for those gene with lower
frequencies, but still considered statistically significant.
The gene-specific primers used are listed in Additional
File 6. Relative transcript abundance for each gene was
tested within root and shoot tissue of Cabernet Sau-
vignon (Figure 7). Two-way ANOVA by gene and tissue
was performed, and both were significant (P < 0.0001).
After ANOVA, individual Bonferroni corrected t-statis-
tics were computed for each individual gene between
root and shoot tissues. Of these ten transcripts, six were
found to be significantly more abundant in roots than
shoots by Student’ s t-statistic (p < 0.01). Transcript
abundances ranged from 3.8- to 730-times greater abun-
dance in roots than shoots.
The most highly root-enriched transcript encoded an
uncharacterized Vitis tonoplast intrinsic protein TIP1;4
(GSVIVP00024394001) and was detected at 730-times
greater transcript abundance in roots than in shoot tis-
sue. This correlates well wi th the estimated expression
by EST frequencies, where it was found with a fre-
quency of ~33.6 tags per ten thousand (tp10k) in roots
compared with 0.1 tp10k in non-root tissues (57 root
ESTs compared with 2 non-root ESTs). A resveratrol O-
methyltransferase (ROMT, GSVIVP00018661001) that
was found with a frequency of 17.7 tp10k in roots (30
root ESTs compared with 0 non-root EST) was
express ed 120-fold greater in root than in shoot as esti-
mated by qRT-PCR. Similarly, a terpene synthase (TPS)
gene, (E, E)-alpha-farnesene synthase [61], was found
with a f requency of 13.6 tp10k in roots (23 root ESTs
compared with 0 non-root EST) and was 44-fold more
abundant in root than shoot as assessed by qRT-PCR. A
cinnamyl-alcohol dehydrogenase (9 root ESTs compar ed
with 1 non-root EST) was expressed 27-fold greater in
roots than in shoots. A flavonol 3-O-glucosyltransferase
(10 root ESTs compared with 1 non-ro ot EST) showed
a 8.3-fold greater abundance in roots than in shoots.
Lastly, a Myb transcription factor-like a gene (5 root
ESTs compared with 0 non-root EST) was tested to
evaluate the selected significance cutoff. This transcript
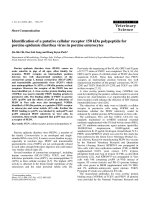
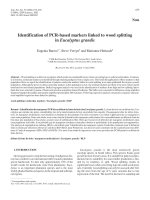
Figure 6 Functional categories of genes in the VVM root cDNA
library and within a root-enriched subset. Functional
assignments for genes from the Cabernet Sauvignon root EST
library, VVM, were made using VitisNet annotation. A) Proportion of
genes identified in VVM for which functions are unclear, unknown,
or are known as described within VitisNet annotation; B)
Classification of the functions of all 4505 genes from the above
“known” category in VVM; C) the functional assignments of 135
transcripts estimated to be differentially expressed in root tissues
from the Audic-Claverie test [60].
Tillett et al. BMC Plant Biology 2011, 11:86
/>Page 10 of 23
Table 3 135 genes with predicted root-enrichment expression profiles by Audic-Claverie statistic
Gene ID Gene Description Gene Function (via
VitisNet)
Root EST count
(frequency)
Non-root EST count
(frequency)
AC
statistic
GSVIVP00030165001 Lectin 7.0 Stress-related 68 (40.1) 32 (1.2) < 1E-06
GSVIVP00027836001 Curculin (mannose-binding) lectin 6.0 Binding 59 (34.8) 5 (0.2) < 1E-06
GSVIVP00024394001 Aquaporin TIP1;4 5.3 Transport System 57 (33.6) 2 (0.1) < 1E-06
GSVIVP00029248001 Aquaporin TMP-C 5.3 Transport System 57 (33.6) 15 (0.6) < 1E-06
GSVIVP00015118001 Aspartic proteinase nepenthesin-1 2.3 Folding, Sorting &
Degradation
47 (27.7) 38 (1.4) < 1E-06
GSVIVP00036222001 Endochitinase 1, basic 1.0 Primary Metabolism 33 (19.5) 1 (0.1) < 1E-06
GSVIVP00032953001 Glutamine synthetase (cytosolic) 2 1.2 Energy Metabolism 32 (18.9) 26 (1) < 1E-06
GSVIVP00018661001 Resveratrol O-methyltransferase 1.9 Secondary
Metabolism
30 (17.7) 0 (0) < 1E-06
GSVIVP00013365001 Mannitol dehydrogenase 1.0 Primary Metabolism 26 (15.3) 26 (1) < 1E-06
GSVIVP00006171001 Phosphate-induced protein 1 Unclear 26 (15.3) 37 (1.4) < 1E-06
GSVIVP00015200001 Phosphate-induced protein 1 Unclear 24 (14.2) 5 (0.2) < 1E-06
GSVIVP00027842001 (E,E)-alpha-Farnesene synthase 1.9 Secondary
Metabolism
23 (13.6) 0 (0) < 1E-06
GSVIVP00004164001 IAA beta-glucosyltransferase 3.2 Hormone Signaling 20 (11.8) 1 (0.1) < 1E-06
GSVIVP00037746001 C2 domain-containing 3.1 Signal Transduction 20 (11.8) 7 (0.3) < 1E-06
GSVIVP00036564001 Carboxylesterase 1.0 Primary Metabolism 19 (11.2) 0 (0) < 1E-06
GSVIVP00011776001 Polyphenol oxidase II, chloroplast 5.3 Transport System 19 (11.2) 17 (0.7) < 1E-06
GSVIVP00020241001 Unknown Unknown 19 (11.2) 30 (1.1) < 1E-06
GSVIVP00013172001 Octicosapeptide/Phox/Bem1p (PB1) Unknown 18 (10.6) 12 (0.5) < 1E-06
GSVIVP00030638001 Xyloglucan endotransglycosylase 4.3 Cell Wall 18 (10.6) 28 (1) < 1E-06
GSVIVP00036411001 RD22 7.0 Stress-related 17 (10) 5 (0.2) < 1E-06
GSVIVP00021415001 Glutathione S-transferase 8 1.0 Primary Metabolism 16 (9.4) 14 (0.5) < 1E-06
GSVIVP00009226001 Stilbene synthase 1.9 Secondary
Metabolism
15 (8.8) 7 (0.3) < 1E-06
GSVIVP00017772001 ATP synthase beta chain 2 5.3 Transport System 15 (8.8) 18 (0.7) < 1E-06
GSVIVP00025990001 Caffeic acid O-methyltransferase 1.9 Secondary
Metabolism
14 (8.3) 22 (0.8) < 1E-06
GSVIVP00011267001 Flavonol sulfotransferase 1.9 Secondary
Metabolism
13 (7.7) 0 (0) < 1E-06
GSVIVP00002185001 DNA-binding protein 2.4 Replication & Repair 13 (7.7) 1 (0.1) < 1E-06
GSVIVP00036600001 Nitrite reductase 1.2 Energy Metabolism 13 (7.7) 5 (0.2) < 1E-06
GSVIVP00034550001 Unknown protein Unknown 13 (7.7) 7 (0.3) < 1E-06
GSVIVP00018662001 Orcinol O-methyltransferase 2 1.9 Secondary
Metabolism
12 (7.1) 0 (0) < 1E-06
GSVIVP00022812001 Germin 8.0 Storage 12 (7.1) 0 (0) < 1E-06
GSVIVP00019908001 7S globulin precursor, basic 2.3 Folding, Sorting &
Degradation
12 (7.1) 4 (0.2) < 1E-06
GSVIVP00021582001 E8 protein 3.2 Hormone Signaling 12 (7.1) 4 (0.2) < 1E-06
GSVIVP00013571001 Strictosidine synthase 1.9 Secondary
Metabolism
12 (7.1) 5 (0.2) < 1E-06
GSVIVP00020905001 Aldose 1-epimerase 1.0 Primary Metabolism 12 (7.1) 10 (0.4) < 1E-06
GSVIVP00002589001 Unknown protein Unknown 12 (7.1) 11 (0.4) < 1E-06
GSVIVP00004581001 Carboxyesterase 20 1.0 Primary Metabolism 11 (6.5) 1 (0.1) < 1E-06
GSVIVP00027736001 4-Amino-4-deoxychorismate lyase 1.0 Primary Metabolism 11 (6.5) 1 (0.1) < 1E-06
GSVIVP00036840001 Ferulate-5-hydroxylase 1.9 Secondary
Metabolism
11 (6.5) 3 (0.1) < 1E-06
GSVIVP00001860001 UDP-glucose:anthocyanidin 5,3-O-
glucosyltransferase
1.9 Secondary
Metabolism
11 (6.5) 4 (0.2) < 1E-06
GSVIVP00032824001 Aspartic proteinase nepenthesin-2 2.3 Folding, Sorting &
Degradation
11 (6.5) 4 (0.2) < 1E-06
GSVIVP00023389001 WRKY DNA-binding protein 11 2.11 Transcription
Factors
11 (6.5) 6 (0.3) < 1E-06
Tillett et al. BMC Plant Biology 2011, 11:86
/>Page 11 of 23
Table 3 135 genes with predicted root-enrichment expression profiles by Audic-Claverie statistic (Continued)
GSVIVP00031491001 UDP-glucose glucosyltransferase 1.0 Primary Metabolism 10 (5.9) 1 (0.1) < 1E-06
GSVIVP00037558001 Flavonol O-glucosyltransferase 1.9 Secondary
Metabolism
10 (5.9) 1 (0.1) < 1E-06
GSVIVP00036143001 Monooxygenase Unclear 10 (5.9) 1 (0.1) < 1E-06
GSVIVP00017017001 Trans-cinnamate 4-monooxygenase 1.9 Secondary
Metabolism
10 (5.9) 2 (0.1) < 1E-06
GSVIVP00033062001 Senescence-associated gene (SAG101) 4.2 Cell Growth & Death 10 (5.9) 3 (0.1) < 1E-06
GSVIVP00018298001 Phosphate translocator protein2,
plastid
5.3 Transport System 10 (5.9) 7 (0.3) < 1E-06
GSVIVP00005745001 Octicosapeptide/Phox/Bem1p (PB1)
domain
Unknown 10 (5.9) 13 (0.5) < 1E-06
GSVIVP00005849001 Anthocyanidin 3-O-glucosyltransferase 1.9 Secondary
Metabolism
10 (5.9) 16 (0.6) < 1E-06
GSVIVP00036485001 CYP82C4 1.0 Primary Metabolism 9 (5.3) 1 (0.1) < 1E-06
GSVIVP00002954001 Cinnamyl-alcohol dehydrogenase 1.9 Secondary
Metabolism
9 (5.3) 1 (0.1) < 1E-06
GSVIVP00031199001 Cytokinin-O-glucosyltransferase 2 1.9 Secondary
Metabolism
9 (5.3) 3 (0.1) < 1E-06
GSVIVP00015320001 Nitrate reductase 2 (NR2) 3.1 Signal Transduction 9 (5.3) 3 (0.1) < 1E-06
GSVIVP00025346001 beta-1,3-Glucanase 1.0 Primary Metabolism 9 (5.3) 4 (0.2) < 1E-06
GSVIVP00013928001 Phenylalanine ammonia-lyase 1.9 Secondary
Metabolism
9 (5.3) 8 (0.3) < 1E-06
GSVIVP00005194001 Stilbene synthase 1.9 Secondary
Metabolism
9 (5.3) 8 (0.3) < 1E-06
GSVIVP00001453001 Salt tolerance zinc finger 2.11 Transcription
Factors
9 (5.3) 11 (0.4) < 1E-06
GSVIVP00037055001 Metal-nicotianamine transporter YSL7 5.3 Transport System 9 (5.3) 11 (0.4) < 1E-06
GSVIVP00020070001 Sulfate adenylyltransferase 3 1.2 Energy Metabolism 9 (5.3) 13 (0.5) < 1E-06
GSVIVP00000463001 Cinnamyl alcohol dehydrogenase 1.9 Secondary
Metabolism
9 (5.3) 14 (0.5) < 1E-06
GSVIVP00024717001 Peroxidase 1.0 Primary Metabolism 8 (4.7) 0 (0) < 1E-06
GSVIVP00031214001 Cytokinin-O-glucosyltransferase 2 1.9 Secondary
Metabolism
8 (4.7) 0 (0) < 1E-06
GSVIVP00034489001 2-Oxoglutarate-dependent
dioxygenase
Unclear 8 (4.7) 0 (0) < 1E-06
GSVIVP00036965001 Glutathione S-transferase 10 GSTU10 1.0 Primary Metabolism 8 (4.7) 1 (0.1) < 1E-06
GSVIVP00018322001 Glucosyltransferase-2 1.0 Primary Metabolism 8 (4.7) 2 (0.1) < 1E-06
GSVIVP00019233001 Isoflavone reductase 1.9 Secondary
Metabolism
8 (4.7) 2 (0.1) < 1E-06
GSVIVP00029527001 Unknown protein Unknown 8 (4.7) 2 (0.1) < 1E-06
GSVIVP00003722001 Zinc finger (C3HC4-type RING finger) 2.11 Transcription
Factors
8 (4.7) 3 (0.1) < 1E-06
GSVIVP00010417001 Zinc finger (C3HC4-type RING finger) 6.0 Binding 8 (4.7) 5 (0.2) < 1E-06
GSVIVP00034781001 Kelch repeat-containing F-box Unknown 8 (4.7) 5 (0.2) < 1E-06
GSVIVP00020913001 Aldose 1-epimerase 1.0 Primary Metabolism 8 (4.7) 6 (0.3) < 1E-06
GSVIVP00022605001 Nicotianamine synthase 1.0 Primary Metabolism 8 (4.7) 7 (0.3) < 1E-06
GSVIVP00023306001 p-Coumaroyl shikimate 3’-hydroxylase
1
1.9 Secondary
Metabolism
8 (4.7) 7 (0.3) < 1E-06
GSVIVP00002706001 Unknown protein Unknown 8 (4.7) 7 (0.3) < 1E-06
GSVIVP00031130001 DNA-damage-repair/toleration
(DRT102)
2.4 Replication & Repair 8 (4.7) 8 (0.3) < 1E-06
GSVIVP00024773001 Acyl-CoA synthetase (Acyl-activating
18)
5.3 Transport System 8 (4.7) 9 (0.4) < 1E-06
GSVIVP00000809001 Phosphoesterase Unclear 8 (4.7) 11 (0.4) < 1E-06
GSVIVP00010326001 Esterase/lipase/thioesterase family Unclear 8 (4.7) 12 (0.5) 2E-06
GSVIVP00015215001 UDP-glycosyltransferase 85A1 1.0 Primary Metabolism 7 (4.1) 0 (0) < 1E-06
GSVIVP00026343001 NADPH HC toxin reductase 1.0 Primary Metabolism 7 (4.1) 0 (0) < 1E-06
Tillett et al. BMC Plant Biology 2011, 11:86
/>Page 12 of 23
Table 3 135 genes with predicted root-enrichment expression profiles by Audic-Claverie statistic (Continued)
GSVIVP00036190001 Catechol O-methyltransferase 1.0 Primary Metabolism 7 (4.1) 0 (0) < 1E-06
GSVIVP00010293001 F-box domain containing 2.3 Folding, Sorting &
Degradation
7 (4.1) 0 (0) < 1E-06
GSVIVP00025242001 Aspartyl protease 2.3 Folding, Sorting &
Degradation
7 (4.1) 0 (0) < 1E-06
GSVIVP00026388001 Pectinesterase family 4.3 Cell Wall 7 (4.1) 0 (0) < 1E-06
GSVIVP00015805001 AT-hook DNA-binding protein Unknown 7 (4.1) 0 (0) < 1E-06
GSVIVP00008086001 Myb family TF-like b 2.11 Transcription
Factors
7 (4.1) 1 (0.1) < 1E-06
GSVIVP00017803001 Laccase 5.3 Transport System 7 (4.1) 1 (0.1) < 1E-06
GSVIVP00036529001 Open stomata 1 (OST1) 3.1 Signal Transduction 7 (4.1) 2 (0.1) < 1E-06
GSVIVP00024338001 Fasciclin arabinogalactan-protein
(FLA4)
4.3 Cell Wall 7 (4.1) 2 (0.1) < 1E-06
GSVIVP00024285001 Zinc transporter (ZIP2) 5.3 Transport System 7 (4.1) 2 (0.1) < 1E-06
GSVIVP00017555001 UDP-glycosyltransferase 89B2 1.0 Primary Metabolism 7 (4.1) 3 (0.1) < 1E-06
GSVIVP00018198001 Patatin 8.0 Storage 7 (4.1) 3 (0.1) < 1E-06
GSVIVP00029089001 Kelch repeat-containing Unknown 7 (4.1) 3 (0.1) < 1E-06
GSVIVP00012218001 Myb divaricata 2.11 Transcription
Factors
7 (4.1) 4 (0.2) < 1E-06
GSVIVP00031610001 Unknown protein Unknown 7 (4.1) 4 (0.2) < 1E-06
GSVIVP00023356001 alpha-L-Arabinofuranosidase 1.0 Primary Metabolism 7 (4.1) 5 (0.2) < 1E-06
GSVIVP00028303001 beta-1,3-Glucanase precursor 1.0 Primary Metabolism 7 (4.1) 5 (0.2) < 1E-06
GSVIVP00030576001 Receptor-like protein kinase 3.1 Signal Transduction 7 (4.1) 5 (0.2) < 1E-06
GSVIVP00019610001 IAA-amido synthetase GH3.2 3.2 Hormone Signaling 7 (4.1) 5 (0.2) < 1E-06
GSVIVP00024987001 Allergen Alt a 7 7.0 Stress-related 7 (4.1) 5 (0.2) < 1E-06
GSVIVP00002843001 Kelch repeat-containing F-box Unknown 7 (4.1) 5 (0.2) < 1E-06
GSVIVP00001138001 Flavonoid 3-monooxygenase 1.9 Secondary
Metabolism
7 (4.1) 6 (0.3) < 1E-06
GSVIVP00021523001 Aspartyl protease 2.3 Folding, Sorting &
Degradation
7 (4.1) 6 (0.3) < 1E-06
GSVIVP00023266001 Serine carboxypeptidase K10B2.2 2.3 Folding, Sorting &
Degradation
7 (4.1) 8 (0.3) < 1E-06
GSVIVP00003796001 Glycosyl hydrolase family 1 1.0 Primary Metabolism 6 (3.5) 0 (0) < 1E-06
GSVIVP00005841001 UDP-glucose glucosyltransferase 1.0 Primary Metabolism 6 (3.5) 0 (0) < 1E-06
GSVIVP00006924001 Peroxidase 1.0 Primary Metabolism 6 (3.5) 0 (0) < 1E-06
GSVIVP00023878001 CYP94A1 1.0 Primary Metabolism 6 (3.5) 0 (0) < 1E-06
GSVIVP00023969001 Class III peroxidase 40 1.0 Primary Metabolism 6 (3.5) 0 (0) < 1E-06
GSVIVP00037866001 Peroxidase 1.0 Primary Metabolism 6 (3.5) 0 (0) < 1E-06
GSVIVP00006201001 AP2/ERF114 2.11 Transcription
Factors
6 (3.5) 0 (0) < 1E-06
GSVIVP00033054001 Protein phosphatase 2C 3.1 Signal Transduction 6 (3.5) 0 (0) < 1E-06
GSVIVP00000122001 Chromosome maintenance MAG2 2.4 Replication & Repair 6 (3.5) 1 (0.1) < 1E-06
GSVIVP00018988001 Transposon protein 9.0 Transposons 6 (3.5) 1 (0.1) < 1E-06
GSVIVP00014792001 Carboxylesterase 1.0 Primary Metabolism 6 (3.5) 3 (0.1) < 1E-06
GSVIVP00033506001 beta-1,3-Glucanase 1.0 Primary Metabolism 6 (3.5) 3 (0.1) < 1E-06
GSVIVP00014758001 Calmodulin-binding protein AR781 3.1 Signal Transduction 6 (3.5) 3 (0.1) < 1E-06
GSVIVP00019639001 Peroxidase 73 1.0 Primary Metabolism 6 (3.5) 4 (0.2) < 1E-06
GSVIVP00009234001 Stilbene synthase 1.9 Secondary
Metabolism
6 (3.5) 4 (0.2) < 1E-06
GSVIVP00020035001 MLK/Raf-related protein kinase 1 3.1 Signal Transduction 6 (3.5) 4 (0.2) < 1E-06
GSVIVP00025363001 Myb family TF-like a 2.11 Transcription
Factors
5 (2.9) 0 (0) < 1E-06
GSVIVP00026190001 NGA1 TF (NGATHA1) 2.11 Transcription
Factors
5 (2.9) 0 (0) < 1E-06
GSVIVP00037318001 Myb divaricata 2.11 Transcription
Factors
5 (2.9) 0 (0) < 1E-06
Tillett et al. BMC Plant Biology 2011, 11:86
/>Page 13 of 23
was detected at 3.8-fold greater abundance in roots than
in shoots (significant, p < 0.05). In contrast, three of the
genes tested (e.g., AP2/ERF114, NGATHA1, Nitrate
Reductase 2) f ailed to demonstrate a significant differ-
ence as measured by the multiple test-corrected t-statis-
tic, and a single transcript, a second Myb transcription
factor-like b gene (7 root ESTs compared with 1 non-
root EST), was determined t o be 2.6-fol d less abundant
in roots than in shoots (p < 0.05) (Figure 7). For all ten
genes tested, the Spearman rank correlation between the
two measures of gene e xpression (EST frequency com-
pared with qRT-PCR) was high (r
s
= 0.78, p = 0.005).
Although only ten genes were tested, estimation of tran-
script ab undance by EST frequency was apparently
effective in identifying genes with root-specific expres-
sion, despite the majority of root ESTs coming from a
normalized library source.
Discussion
Data mining to discover Vitis vinifera stress-adaptive
genes
In order to i dentify novel transcripts that respond to
multiple environmental stress treatments, EST libraries
generated by us and those derived from public sources
were carefully curated and mined to obt ain estimates of
transcript abundance based on EST freque ncies. A total
of 21,499 and 18,963 unique ESTs derived from non-
normalized cDNA libraries fro m mixed abiotic stress
leaf and water-defi cit stressed berry tissues, respectively,
were compared with 5277 and 24,953 unique ESTs
derived f rom cDNA libraries generated w ith unstressed
leaf and berry tissues (Table 1). Tag frequency-based
detection of differentially expressed genes is a well-
established methodology for ESTs [53,60,62], SAGE
[57], and MPSS [7], and continues to be an important
tool in the era of “next-generation” deep sequencing of
transcriptomes [63]. Aside from the removal of
Table 3 135 genes with predicted root-enrichment expression profiles by Audic-Claverie statistic (Continued)
GSVIVP00007503001 ACC oxidase homolog 1 3.2 Hormone Signaling 5 (2.9) 0 (0) < 1E-06
GSVIVP00006975001 Kinesin family member 2/24 4.1 Cell Motility 5 (2.9) 0 (0) < 1E-06
GSVIVP00021432001 Laccase 5.3 Transport System 5 (2.9) 0 (0) < 1E-06
GSVIVP00012703001 Aquaporin TIP2;2 5.3 Transport System 5 (2.9) 0 (0) < 1E-06
GSVIVP00008708001 Monooxygenase (MO3) 1.0 Primary Metabolism 5 (2.9) 0 (0) < 1E-06
GSVIVP00020827001 AAA-type ATPase Unclear 5 (2.9) 0 (0) < 1E-06
GSVIVP00017947001 Unknown protein Unknown 5 (2.9) 0 (0) < 1E-06
GSVIVP00021666001 Unknown protein Unknown 5 (2.9) 0 (0) < 1E-06
GSVIVP00001266001 Unknown Unknown 5 (2.9) 0 (0) < 1E-06
GSVIVP00017730001 CYP77A5P 1.0 Primary Metabolism 5 (2.9) 1 (0.1) < 1E-06
GSVIVP00006293001 Jasmonate O-methyltransferase 3.2 Hormone Signaling 5 (2.9) 1 (0.1) < 1E-06
GSVIVP00020849001 ABC transporter B member 11 5.3 Transport System 5 (2.9) 1 (0.1) < 1E-06
Root-enriched genes were identified by EST frequency comparison of Vitis vinifera roots compared with all other tissues, using the Audic-Claverie (AC) statistic
[60]. Gene identifi er (ID) from GSVIV, gene description, gene function (from VitisNet annotation), frequency in root and non-root cDNA libraries, and AC
confidence statistic are presented. Genes tested for root-enriched expression by real-time qRT-PCR are indicated in bold (Figure 7).
Myb TF-like b
Nitrate Reductase 2
NGATHA1
AP2/ERF 114
Myb TF-like a
Flavonol O-glucosyltransferase
C
innamyl-alcohol dehydrogenase
(E,E)-alpha farnesene synthase
Resveratrol O-methyltransferase
Aquaporin TIP1;4
0.25
1
4
16
64
256
1024
shoot
root
***
*
**
***
***
***
***
Fold-difference (root/shoot)
Figure 7 Expression of candidate root-specific genes in roots
and shoots of Cabernet Sauvignon. qRT-PCR analysis of ten
selected transcripts in shoot (white bars) and root (gray bars) tissues.
Transcript abundances derived from three biological replicates were
normalized to an actin reference gene and fold differences were
standardized to shoot expression values. Error bars represent
standard error. Two-way ANOVA (gene, tissue) was performed
followed by post-test Bonferroni-corrected t-statistics. Significant
differences in gene expression (root compared with shoot) are
indicated by asterisks. * denotes p < 0.05; ** denotes p < 0.01; ***
denotes p < 0.001. Fold-differences are drawn on log scale. The
tested genes are listed below in the order that they appear on the
graph from left to right, with the number of root ESTs compared
with non-root ESTs in parentheses. Myb family transcription factor-
like b, (7 compared with 1); Nitrate reductase 2, (9 compared with
3); NGATHA1 transcription factor, (5 compared with 0); (AP2/ERF
transcription factor, 6 compared with 0); Myb family transcription
factor-like a, (5 compared with 0); Flavonol 3-O-glucosyltransferase,
(10 compared with 1); Cinnamaldehyde dehydrogenase, (9
compared with 1); (E, E)-alpha-Farnesene synthase, (23 compared
with 0); Resveratrol O-methyltransferase, (30 compared with 0);
Aquaporin TIP1;4, (57 compared with 2).
Tillett et al. BMC Plant Biology 2011, 11:86
/>Page 14 of 23
redundant ESTs derived from bi-directional and/or same
direction resequencing of i ndividual cDNA clones, one
of the main issues encountered during the data curation
process was the d iscovery of various types of na ming
errors within and across plated clone libraries. With the
aid of a simple dot-plot method analogous to that used
for local nucleotide sequence alignments [51], gene IDs
could be aligned and readily visualized to discover
incorrectly paired plates (or portions of plate s) contain-
ing “well slip” naming errors that would have overesti-
mated the number of ESTs actually present within a
particular cDNA library of interest due to duplicated
sequencing of plates within the same library (Table 2,
Figure 1A-G). Application of this technique also allowed
for the discovery of a misassigned plate of ESTs from a
leaf cDNA library to a berry cDNA library, an error that
would have confounded the accuracy of EST counting
with regard to a particular tissue (Figure 1H).
Comparing EST frequency counts from cDNA
libraries of mixed or water-deficit stressed leaf and berry
tissues, respectively, with those from cDNA libraries
from unstressed leaf and berry tissues, a total of 739
transcripts were identified and clustered into four main
clusters (Figure 2, Additional Files 1, 2, 3 and 4). Of
these, 637 (86%) transcripts could be annotated and
assigned to functional categories (Figure 3) . Each cluster
contained distinct functional groups that reflected
clearly the tissue type and treatment condition in ques-
tion. For example, transcripts encoding the CBL-inter-
acting protein kinase 10 (CIPK10) were overrepresented
in both the stressed leaf (SL) and stressed berries (SB)
clusters. CIPK10 participates in the calcineurin B-like
(CBL) calcium sensor protein-CIPK network that
decodes calcium signals in response to environmental
perturbations [64]. The Arabidopsis CIPK10 is localized
to the nucleus and cytoplasm when expressed as a GFP
fusion in Nicotiana benthamiana leaves [65]. CBL-CIPK
interactions are crucial for the regulation of ion home-
ostasis during salinity stress and other forms of environ-
mental stress, not only at the plasma membrane and
tonoplast, but also at the cytoplasm, and nucleus [65].
The increased abundance of CIPK10 transcripts in these
stress-specific cDNA libraries indica tes this CIPK might
play a role in stress adaptation in both Vitis le aves and
berries. Several other stress-specific transcripts appeared
to be over-represented in both stress libraries including
RD22, a salt-, dehydration-, and ABA-responsive gene in
grape berries [66] (Additional File 1 and 3). In addition
to the genes discussed earlier that were enriched within
the stressed berry (SB) cluster, several pathogenesis-
related (PR) proteins, such as three thaumatin genes, a
class IV chitinase gene, two osmotin genes, and Snakin-
1, a cysteine-rich peptide that exhibits broad-spectrum
antimicrobial activity in vitro and fungal and bacterial
pathogen resistance in vivo [67], were also enriched in
this cluster. The identification of this collection of PR
proteins using the EST frequency counting approach
outlined here cl early illustrates its practical utility in the
discovery of genetic determinants important for biotic
and abiotic stress responses. A large number of
unknown genes with discrete, cluster-specific expression
patterns were also identified, particularly within the
stressed leaf (SL) cluster. Such unknown genes can serve
as primary targets for future, detailed investigations into
gene function.
Validation of EST frequency counts by microarray analysis
In order to validate the efficacy of the EST frequency
counting method, 489 out of 739 transcripts could be
identified on the Affymetrix
®
Vitis GeneChip
®
microar-
ray and thus compared us ing these two distinct techni-
cal approaches. The remaining 250 transcripts had no
match, and thus, were potentially not described pre-
viouslyasbeingabioticstressresponsiveinVit is.
Between the two platforms, expression data for 184
transcripts could be compared where significant differ-
ences in gene expression patterns were observed using
both technologies. Like previous reports comparing tag
and hybridization measures [63], a modest (r = 0.21),
but significant correlation between the two platforms
was observed (Figure 4). Further comparison between
the two methods revealed a directional concordance of
69%, indicating that the two platforms agreed to a
greater extent in terms of their general gene expression
trends. What might account for these rather modest
correlations? First, these low correlations might be
related partly to differences in the reported magnitude
of increased or decreased transcript abunda nce. How-
ever, for every two genes that were reported in creased
or decreased significantly by both platforms, one gene
changed significantly in opposite directions (Figure 4).
Thus, magnitude can only account for part of the dis-
agreement. Second, the use of public data sets, which
are highly diverse, might introduce biases in gene repre-
sentation. In earlier studies that have mined public data-
sets, such as in a comparison of EST reads generated by
454 pyrosequencing with microarray mRNA profiles in
two porcine tissues, four-to-one concordance (160 com-
pared with 38) ratios were observed [63] or in a com-
parison of SAGE tags with microarrays mRNA profiles
within a set of human tissues, three-to-one concordance
ratios were observed [58]. In the present study, while
major systematic errors within the public data sets were
corrected in an attempt to capture correct frequency
counts for unstressed leaf and berry libraries (Figure 1;
Tables 1, 2), these public data sets contained large d if-
ferences in grapevine cultivar, age, developmental stage,
season, terroir, and sample preparation that were likely
Tillett et al. BMC Plant Biology 2011, 11:86
/>Page 15 of 23
to introduce biases in gene r epresentation. Third, the
relative complexity of our mixed stress leaf library might
be a source of bias, because the source tissue for this
library included RNA from UV- and heat-treated leaves,
treatments for which corresponding microarray data
were unavailable for comparison. The presence of genes
strongly or exclusively regulated by UV or heat stress
would be expected to contribute to the population of
the significant-by-EST transcripts with which no corre-
sponding microarray data could be compared.
EST-based gene discovery in Vitis roots
To redress the relative paucity of available grape root
sequence data, more than 16,000 ESTs were generated
from a normalized cDNA library ( VVM) constructed
from Cabernet Sauvignon root tissues exposed to cold,
salinity, and water deficit stress (Table 1). D uring its
prep aration, this library was normalized with the aim of
increasing the number of different and low-abundance
root genes identified [68]. The 16,452 ESTs assemble
into 6424 unique transcripts, of which 3 449 (>53%)
were represented just once. Bec ause normalized libraries
are biased, resulting in an under-counting of abundant
transcripts and over-counting of rare ones, they violate
the assumption of random sampling, and as such, are
not usually considered for use in tag frequency analyses
of gene expression [6,42]. Recognizing that library nor-
malization would, at a minimum, underestimate the true
relative expression of most root transcripts, the identifi-
cation of root-specific or root-abundant EST was
attempted by EST frequency counting. A total of 18,109
root-derived ESTs were compared with 291,233 ESTs
from 114 n on-root cDNA libraries. This analysis
resulted in the identification of 135 “ root-enriched”
transcripts with significantly greater EST frequencies in
roots than other tissues as determined by the AC statis-
tic (Table 3). Validation of a set of 10 candidate root
genes with varying degrees of apparent root enrichment
by qRT-PCR confirmed six genes to be significantly
more abundant in grapevine roots than in shoots (Figure
7). The correlation between estimated EST frequencies
and qRT-PCR expression ratios was strong (r
s
= 0.78)
and significant (P = 0.005). Shoot tissue was used to
confirm broadly, but not exhaustively, that e xpression
patterns were root-enhanced. Confirmation of the root-
specific expression patterns of these candidate genes will
require that additional non-root tissue types (e.g., stems,
flowers, berries, etc.) be tested on a gene-by-gene basis.
Chief among the qRT-PCR-validated root genes is a
gene encoding an aquaporin/tonoplast intrinsic protein
1;4 (VvTIP1;4) t hat was expressed as much as 730-fold
more in roots than in shoots. VvTIP1;4 has been pre-
viously identifie d from genomic sequence by two groups
[69,70], but has not yet been characterized functionally.
Another root-enriched gene, which showed 120-fold
greater mRNA abundance in roots than in shoots by
qRT-PCR, encodes a putative resveratrol-O-methyltrans-
ferase (ROMT), which is 78% identical and 88% similar
to a known Vitis ROMT [71]. The ROMT characterized
by Schmidlin and colleagues was observed to doubly O-
methylate molecules of resveratrol into pterostilbene, a
phy toalexin with 5-10 times greater in vitro fungitoxicity
than resveratrol [71]. This root-expressed ROMT is also
structurally distinct from a ROMT recently characterized
in red berries. The red berry ROMT transcript was more
abundant in the red grape Cabernet Sauvignon than the
white Chardonnay and had peak expression two weeks
after véraison in the red cultivar only [72]. A terpene
synthase (TPS) was highly expressed in roots with a 44-
fold greater relative abundance in root than in s hoots.
Martin and colleagues identified this TPS to be an (E, E)-
alpha-farnesene synthase in a thorough survey to charac-
terize V. vini fera TPS gen es [61]. This TPS exhibit ed
activity that was unique among the 39 characterized, pro-
ducing only (E, E)-alpha-farnesene when fed farnesene
diphosphate (FPP), rather than a mixture of multiple pro-
ducts. A cinnamyl-alcohol dehydrogenase (CAD) gene
was also confirmed to be 27-fold more abundant in roots
than in shoots. CAD genes are crucial for the synthesis of
the lignin compounds in wood formation, but some CAD
genes might possess other activities or functions. In Ara-
bidopsis, the activity of the promoters of some AtCAD
genes has been observed in cells where CAD-mediated
lignification does not appea r to take place, including
young root tips [73]. Lastly, an UDP-Glucose O-glucosyl-
transferase (UGT) gene was 8.3-fold more abundant i n
rootsthaninshoots.Whencomparedtotheposition-
specific scoring matrices (PSSMs) found in NCBI’sCon-
served Domain Database (CDD) [74], this UGT was most
similar to the PLN02554 grou p of UGTs, which are clas-
sified as flavonol 3-O-glucosyltransferases (EC 2.4.1.91).
However, determining the exact catalytic activitie s of
UGT s generally requires biochemical characterization as
even single amino acid changes in UGT proteins can
alter regioselectivity (e.g., which hydroxyl group is glyco-
sylated) or UDP-sugar substrate preference [75,76]. Four
other candidate genes were also surveyed, but none were
found to exhibit significant, root-enriched mRNA expres-
sion at p < 0.01.
Conclusions
Abiotic stresses, especially water-deficit stress, have
major impacts on vine growth and berry development
that ultimately can impact wine quality. Here, EST fre-
quency counts were exploited to identify candidate
genes with mRNA expression profiles altered by abiotic
stresses by comparing large EST collections from cDNA
libraries prepared from leaf and berries harvested from
Tillett et al. BMC Plant Biology 2011, 11:86
/>Page 16 of 23
vines subjected to mixed abiotic stresses to publicly
available EST collections from these same tissues har-
vested from unstressed vines. This analysis identified
739 transcripts with significant differential expression in
abiotically stressed leaves and berries. Comparison of
EST frequency counts of these gene s with available
microarray expression data identified 184 genes, which
also showed significant differences between stressed, and
unstressed tissues. While the correlation in expression
patterns was modest at best, 69% of genes exhibited
directional concordance. Fu rthermore, the EST fre-
quency counting approach led to the identification of
many novel candid ate genes whose stress-induced
mRNA expression patterns had not been described pre-
viously. To identify genes preferentially or exclusively
expressed in Vitis roots,atissuethathadpreviously
been largely uncharacterized, 16,452 EST were charac-
terized from a normalized, abiotically stressed cDNA
library from Cabernet Sauvignon. Comparison of these
ESTs with publicly available EST collections from non-
root tissues allowed for the identification of 135 root-
enriched transcripts, a majority of which showed root-
preferential mRNA expression when validated by qRT-
PCR. This root-enriched EST collection will serve as a
rich resource not only for future studies into the abiotic
stress-response networks operating within roots, but
also for futur e geno typing efforts of Vitis rootstock that
differ in salinity or drought tolerance characteristics or
for manipulation of root stock traits in wine grape.
Methods
Plant material
Total RNA was extracted from abiotically stressed V. vini-
fera cv. Chardonnay leaf and berry tissue 8, 9, 11, 13, 15,
16 weeks after flowering) using a modified Tris-LiCl pro-
tocol as previously described [77]. Root tissue was col-
lected from 10 cm high V. vinifera cv. Cabernet Sauvignon
cuttings grown in autoclaved, sterile 77 mm × 77 mm ×
97mm(W×L×H)MagentaGA-7boxes(Magenta
Corp., Chicago, IL) containing 80 ml of 1% Plant Tissue
Culture Agar (#A111, Phytotechnology Laboratories,
Shawnee Mission, KS) with Murashige & Skoog modified
Basal Medium w/ Gamborg Vitamins (#M404, Phytotech-
nology Laboratories), 1.5% sucrose at pH 5.7 [78,79]
grown under fluorescent lamps pro viding a photon flux
density of 50 μmol m
-2
s
-1
on a 16-h light (24°C)/8-h dark
(18°C) cycle. Roots were detached from non-stressed
plants a nd subjecte d to control condi tions (bath ed in
liquid MS media as above), water deficit stress conditions
by exposure to air (for 2 and 4 h), cold (1.5°C), and 150
mM NaCl (in liquid MS media as above) stress for 2, 4
and 6 h. The 6 h time point for water-deficit stress expo-
sure was not used because intact RNA could not be recov-
ered from root tissue after 4 h of stress.
Leaf and Berry cDNA Library Construction, sequencing
and processing
The preparation of the leaf (Library ID 10208) and berry
(Library ID 12534) cDNA librarie s was described pre-
viously [6]. The frozen, ground tissue of Chardonnay
leaf and berry were homogenized in a buf fer containing
200 mM Tris-HCl, pH = 8.5, 1.5% (w/v) lithium dodecyl
sulfate, 300 mM LiCl, 10 mM sodium EDTA, 1% w/v
sodium deoxycholate, and 1% v/v NP-40. Following
autoclaving, 2 mM aurintricarboxylic acid, 20 mM
dithiotheitol (DTT), 10 mM thiourea, and 2% w/v poly-
vinylpolypyrrolidone were added immediately before
use. Following precipitation with sodium acetate and
isopropanol precipitation, samples were extracted once
with 25:24:1 phenol:chloroform:isoamyl and then twice
with 24:1 chloroform:isoamyl prior to performing LiCl
precipitations to remove DNA contamination. Poly(A)+
RNA was purified from 500 mg of total RNA using the
Micro-FastTrack™ 2.0 mRNA Isolation Kit (Invitrogen,
Inc., Carlsbad, CA) according to the manufacturer’ s
instructions. cDNA was synthesized from 1-5 μg of poly
(A)+ RNA using a Lambda Uni-Zap-XR cDNA synthesis
kit according to the manufacturer’s recommended pro-
tocol (Stratagene, La Jolla, CA). The directionally cloned
(EcoRI/XhoI) cDNA libraries generated were then mass-
excised in vivo and the resulting plasmids (pBluescript
II) were propagated in the E. coli SOLR host strain.
Individual cDNA clones containing inserts were ampli-
fied using the TempliPhi DNA Sequencing Template
Amplification kit (Amersham Biosciences Corp., Piscat-
away, NJ) and sequenced using the dideoxy chain-termi-
nation method on an Applied Biosystems 3700
automated DNA sequencing system using the Prism™
Ready Reaction Dye deoxy™ Terminator Cycle Sequen-
cing kit (Applied Biosystems Division, Perkin-Elmer,
Foster City, CA). The T3 primer (5’ - GGGAAAT-
CACTCCCAATTAA-3’) and the T7 primer (5’-GTAA-
TACGACTCACTATAGGGC-3’)wereusedfor5’ reads
and 3’ reads of cDNA clones, respectively. Oligo-dT pri-
mer (T
22
M) was used for 3’ sequencing reads of cDNA
clones containing poly-A tails.
Raw single-pass sequence data were retrieved from a
Geospiza Finch server and downloaded to the EST Ana-
lysis Pipeline (ESTAP) [80] for cleansing and analysis.
Following removal of vector and low quality sequences,
all sequences ≤ 50 bp in length were discarded. Rema in-
ing sequences were clustered using d2_cluster [81] and
CAP3 algorithms [82] using default parameters estab-
lished for ESTAP.
Root cDNA library construction
A third mixed cDNA library ("VVM”, Library ID 22274)
was constructed using total RNA from cold, water-defi-
cit, 150 mM NaCl stressed a nd control condition roots.
Tillett et al. BMC Plant Biology 2011, 11:86
/>Page 17 of 23
Total RNAs from different treatments were extracted
and equal quantities were pooled before mRNA selec-
tion. Poly(A)+ mRNA was isolated from total RNA
using the Oligotex Direct mRNA kit (Qiagen, Valencia,
CA). cDNA synthesis was conducted by converting poly
(A)+ mRNA to double-stranded cDNA with the 5’ -
AACTGGAAGAATTCGCGGCCGCTCGCATTTTTT
TTTTTTTTTTTTV-3’ (V = A,C,G) primer and Super-
script III reverse transcriptase (Invitrogen). Double-
strande d cDNAs were size-selected (more than 600 bp),
modified with EcoRI adaptors (AATTCCGTTG
CTGTCG - Promega #C1291) and digested with NotI.
The cDNAs were then directionally cloned into EcoRI-
NotI digested pBluescript II SK+ phagemid vector (Stra-
tagene, Inc., La Jolla, CA). The total number of white
colony forming units (cfu) before amplification was 3.0
×10
6
. Blue colonies (empty vectors) were less than 10%
of the total colonies present on plates. Purified plasmid
DNA from the primary library was converted to single-
stranded circles and used as the template for PCR
amplification using the T7 (5’-TAATACGACTCACTA
TAGGG-3’ )andT3(5’ -AATTAACCCTCACTAA
AGGG-3’ ) priming sites flanking the cloned cDNA
inserts as previously described [68]. The purified PCR
products, representing the entire cloned cDNA popula-
tion, were used as a driver for normalization. Hybridiza-
tion between the single-stranded library (50 ng) an d the
PCR products (500 ng) was carried out for 44 hours a t
30°C. Unhybridized single-stranded DNA circles were
separated from hybridized DNA rendered parti ally dou-
ble-stranded and electroporated into Escherichia coli
DH10B cells to generate the normalized library. The
total number of clones with insert was 1.6 × 10
6
cfu.
Background levels of empty clones were less than 10%.
cDNA library normalization and construction was per-
formed by the W.M. Keck Center for Comparative and
Functional Genomics at the Roy J. Carver Biotechnology
Center at the University of Illinois at Urbana-Cham-
paign. Normalization efficiency was verified by random
sampling and sequencing of 96 and 285 clones from
both the primary and the normalized libraries, respec-
tively, and comparing their redundancy rates.
Root EST sequencing and data analysis
EST sequencing of the normalized root cDNA library
was performed using a T7 sequencing primer (5’-TAA-
TACGACTCAC TATAGGG-3’ ) on either an Applied
Biosystems 3700 automated DNA sequencing system
(Applied Biosystems Division, Perkin-Elmer) at Beckman
Coulter, Inc., Genomic Servic es (Danvers, MA; formerly
Agencourt Biosciences, Inc. Beverly, MA) or on Beck-
man CEQ8000 and CEQ8800 sequencers (Beckman
Coulter Inc., Brea, CA) at the Central Lab of the Bio-
technology Institute, Ankara University. Sequence
chromatograms were processed through phred [83] for
high-quality base-calls, and screened/masked to omit
vector sequence using cross_match (-minmatch 10 -min-
score 20 -masklevel 100) against NCBI’ sUniVecwith
added screening and removal of sequences specific to
the cloning adaptor strategy. To precisely identify and
fully mask the vector/adaptor region 5’ to the inserted
cDNA fragment the “ canonical adaptor region” (5’ -
TTGTAAAACGACGGCCAGTGAATTGTAATACG
ACTCACTATAGGGCGAATTGGGTACCGGG
CCCCCCCTCGAGGTATAAGCTTGATATCGAAT
TCCGTTGCTGTCG-3’ ), “2variant39” (5’ -GCTTGA
TATCGAATTCCGTTGCTAATTCCGTTGCTGTCG-
3’ ), “3varia nt51” (5’ -GCTTGATATCGAATTCCGTTG
CTGTCGCC GTTGCTGTCTCCG TTGCTGTCG-3 ’ ),
and “4variant39” (5’ -GCTTGATATCGAATTCCGTT
GCTGTCGCCGTTGCTGTCG-3’ )sequenceswere
added to the vector screen file. To detect and mask
TGCGA-tagged/NotI/vector regions 3 ’ to the inserted
EST, “ pB SK- at NotI site” (5’ -TGCGAGCGGCCG
CCACCGCGGTGGAGCTCCAGCTTTTGTTCCCTT
TAGTGAGGGTTAATTTCGA
GCTTGGCGTAATCATGGTCATAGCTGTTTCC-3’)
and the variant (5’-GATC AGCGGCCGCCACCGCGG
TGGAGCTCCAGCTTTTGTTCCCTTT AGTGAGG
GTTAATTTCGA
GCTTGGCGTAATCATGGTCATAGCTGTTTCC-3’)
sequenc es were added to the vector screen file. A se t of
Perl programs was designed to process sequences for
minimum length (>100 nt), chimera removal, poly-A tail
signal identification, Basic Local Alignment Search Tool
(BLAST) annotation, and dbEST submission. The sub-
mitted high-quality ESTs were provisionally given anno-
tations of each top BLAST hit compared with nr
(version 11.06.2007) [84]. The root ESTs from library
VVM were submitted to dbEST and were assigned the
Genbank IDs FC054794-FC071210, and FC072669-
FC072703. The library was submitted to dbEST as
“VVM” />cgi?ORG=Vvi&LID=22274[85].
Datasets used, clustering analysis and annotation
All available V. vinifera sequences (including ESTs,
expressed transcripts as well as other available DNA
sequences in the NCBI database) were extracted from
GenBank with Batch Entrez at NCBI (i.
nlm.nih.gov/sites/batchentrez ) [86]. Additional informa-
tion for cDNA libraries was obtained from the NCBI
UniGene grape database ( />UniGene/UGOrg.cgi?TAXID=29760) [48]. ESTs
sequences were then associated with their corresponding
“tentative consensus” (TC) contig sequence from the V.
vinife ra Gene Index (Vv GI, version 6, Dana Farber Can-
cer Institute, />Tillett et al. BMC Plant Biology 2011, 11:86
/>Page 18 of 23
tgi/gimain.pl?gudb=grape) [49,59]. Libraries analyzed are
listed in Table 1. Assembled TC sequences or individu al
singleton where no TC could be assigned were then
compared to the predicted peptide sequences from the
Genoscope 8.4X V. vinifera cv. Pinot Noir (GSVIV) gen-
ome assembly ( />Download/Projets/Projet_ML/data/) [1,87]. Database
searches using the BLAST were performed using the
Tera-BLAST™P algorithm, open penalty 11, extend
penalty 1, double-affine Smith-Waterman window 50,
and maximum e-value cutoff 1 × 10
-3
on TimeLogic
DeCypher hardware (Active Motif, Inc., Carlsbad, CA).
If no hit for an open reading frame-containing gene
model could be found, each EST was associated with its
UniGene model or listed as a singleton [88].
Identification of differentially expressed transcripts
All available EST information for individual ESTs and
library of origin were downloaded from UniGene to
match paired EST reads from single clone origins.
Redundantly represented clones (e.g., two or more ESTs
derived from the same clone) were identified from
matching clone information parsed from dbEST submis-
sion files and verified using the DotPlot (version 2.1.1)
plug-in ( [89] for
the Eclipse (version 3.4.2) software development envir-
onment ( [90] with the unique
name of their 8.4X gene models plotted plate-wise on
two axes to verify pairs of clones. EST totals were then
adjusted to reflect the correct totals [91].
The frequency of each gene in each library was calcu-
lated by dividing the EST count by library size. The EST
frequenciesofmultiplelibrariesofthesametype(e.g.,
the multiple unstressed berry libraries) were combined
into a single frequency term by the weighted mean, as
described by Haverty and colleagues [52]. Differences in
gene expression were estimated by EST frequency for
genes with at least four ESTs present in the dataset
using the web tool “Identifying Differe ntially Expressed
Genes 6” (IDEG6; ( info/
IDEG6_form/) [53] with the recommended chi-squared
test for multiple library compari sons with a p-value cut-
off of < 0.0001. With these settings, IDEG6 calculates
the likelihood that the frequency distribution of each
genewouldbeexpectedbychanceandreportsthefre-
quencies (transcr ipts/10,000) of genes below the cut-off.
Hierarchical clustering of differentially expressed genes
was performed using the Cluster software package [92],
using the function (1 - Pearson correlation coefficient)
as the pairwise distance metric and the average agglom-
era tion method. The differenti ally expressed genes were
matched to probesets found on the Affymetrix Vitis
GeneChip
®
microarray [55] and were then compared by
Spearman rank correlation to the expression data of the
significantly changed genes of multiple Affymetrix
microarray experiments in which abiotic stress condi-
tions were test ed at multiple time points [10,27,31]. For
the microarray probeset expression values, the time
point/condition with the greatest fold-change was used
for comparison and probesets with contradictory
responses to st ress (expression significantly increa sed in
one condition, but significantly decreased in another)
were not considered. Functional annotation was then
assigned using the pathways, networks and out-of-net-
work annotations found in VitisNet software http://
www.sdstate.edu/aes/vitis/pathways.cfm[55,93]. The
VVM library sequences were compared to non-root EST
libraries in a separate analysis, again with the IDEG6
web tool ( />form/) [94] using the recommende d Audic-Claverie
(AC) statistic for comparisons of pairs, p-value < 0.01,
with Bonferroni multiple-testing correction adjustment
determined by the IDEG6 software (adju sted p-value
cutoff of < 3.0 × 10
-6
) [53,60].
Quantitative Real-time Reverse Transcriptase-PCR
Frozen leaf and shoot tissues were ground in liquid
nitrogen by mortar and pestle and total RNA was
extracted from the frozen powder using a Qiagen
RNeasy plant mini kit (Qiagen Inc., Valencia, CA) with
on-column DNase treatment according to manufac-
turers’ instructions. Frozen berry and root tissue RNA
was extracted using a Qiagen RNeasy Plant Midi kit,
except that the manufacturer’s instructions were modi-
fied by the addition of 2% polyethylene glycol (MW >
20,000 kD, Sigma-Aldrich, Inc., St. Louis, MO) to
reduce polyphenol contamination [77]. RNA integrity
was confirmed by electrophoresis on 1.5% agarose gels
containing formaldehyde. cDNA was synthesized using
an iScript cDNA Synthesis Kit (Bio-Rad Laboratories,
Inc., Hercules, CA) according to manufactur ers’ instruc-
tions with a uniform 1 μg RNA/reaction volume
reverse-transcribed. Gene-specific primers for real-time
qRT-PCR were selected using Primer-BLAST at NCBI
/>cgi?LINK_LOC=BlastHome[95] using RefSeq V. vinifera
transcripts as input, screened against all other V. vini-
fera RefSeq sequences, and the following Primer3 [96]
settings: Tm range 58-60°C, product size = 50-150 bp,
primer size = 13-25 nt, max poly-X = 3, G/C content =
30-80%. Primer pairs were selected for an anti-GC
clamp, such that no more than two of the last five 3’
nucleotides were either G or C, as per qRT-PCR instru-
ment recommendations. Quantitative real-time RT-PCR
reactions were prepared using Fast SYBR
®
Green Master
Mix and performed using an ABI PRISM
®
7500
Sequence Detection System (Applied Biosystems, Inc.,
Foster City, CA). Expression was determined for
Tillett et al. BMC Plant Biology 2011, 11:86
/>Page 19 of 23
triplicate biological replicates using the ΔΔCt method,
referenced to a eIF4a endogenous control gene (GSVIV
gene model, GSVIVP00034135001) for leaf and berry
comparisons or to an actin 7 endogenous control gene
(NCBI locus ID, LOC 100232968) for shoot and root
comparisons [97]. Primers designed and used in this
studyalongwithcognategenedescriptionsarelistedin
additional files 5 and 6.
Additional material
Additional file 1: List of genes within the Stressed leaf cluster (SL, n
= 355). Genes in the SL cluster of differentially expressed tags are listed
with their VitisNet-derived annotated gene description and functional
category. EST frequencies (f, tags per 10,000) are shown for each library
type: leaf f(L), stressed leaf f(SL), berry f(B), stressed berry f(SB). Gene IDs
are for corresponding 8.4X draft genome identifiers or NCBI UniGene
models. Corresponding Affymetrix Vitis GeneChip
®
® probeset identifiers
are also shown if available.
Additional file 2: List of genes within the Leaf cluster (L, n = 127).
Genes in the L cluster of differentially expressed tags are listed with their
VitisNet-derived annotated gene description and functional category. EST
frequencies (f, tags per 10,000) are shown for each library type: leaf f(L),
stressed leaf f(SL), berry f(B), stressed berry f(SB). Gene IDs are for
corresponding 8.4X draft genome identifiers or NCBI UniGene models.
Corresponding Affymetrix Vitis GeneChip
®
® probeset identifiers are also
shown if available.
Additional file 3: List of genes within the Stress Berry cluster (SB, n
= 127). Genes in the SB cluster of differentially expressed tags are listed
with their VitisNet-derived annotated gene description and functional
category. EST frequencies (f, tags per 10,000) are shown for each library
type: leaf f(L), stressed leaf f(SL), berry f(B), stressed berry f(SB). Gene IDs
are for corresponding 8.4X draft genome identifiers or NCBI UniGene
models. Corresponding Affymetrix Vitis GeneChip
®
® probeset identifiers
are also shown if available.
Additional file 4: List of genes within the Berry cluster B (B, n =
130). Genes in the B cluster of differentially expressed tags are listed
with their VitisNet-derived annotated gene description and functional
category. EST frequencies (f, tags per 10,000) are shown for each library
type: leaf f(L), stressed leaf f(SL), berry f(B), stressed berry f(SB). Gene IDs
are for corresponding 8.4X draft genome identifiers or NCBI UniGene
models. Corresponding Affymetrix Vitis GeneChip
®
® probeset identifiers
are also shown if available.
Additional file 5: List of primers used for real-time qRT-PCR of
shoot and berry gene expression. Primers were generated for real-
time qRT-PCR of genes for comparison with microarray and EST
frequency results. Gene name, gene model or contig identifier, forward
primer (FP) and reverse primer (RP) sequences, and product size are
shown.
Additional file 6: List of primers used for real-time qRT-PCR of root
gene expression. Primers were generated for real-time qRT-PCR
corroboration of root-enriched gene expression estimated by EST
frequency. Gene name, NCBI gene locus identifier, forward primer (FP)
and reverse primer (RP) sequences and product size are shown.
Acknowledgements
Funding from the National Science Foundation NSF (DBI-0217653) and the
University of Nevada Agricultural Experiment Station (to GRC and JCC)
supported this work. The authors would like to thank Kitty Spreeman for
invaluable technical support. We would also like to thank Brian Anspach and
Mary Ann Cushman for their expert assistance with figure design and critical
manuscript reading, respectively. We gratefully acknowledge the W.M. Keck
Center for Comparative and Functional Genomics at the Roy J. Carver
Biotechnology Center at the University of Illinois at Urbana-Champaign and
Agencourt Biosciences, Inc. for providing cDNA library construction and
high-throughput EST sequencing services. NIH Grant Number P20 RR-016464
also made this publication possible from the NIH IDeA Network of
Biomedical Research Excellence (INBRE, RR-03-008) Program of the National
Center for Research Resources (NCRR) for its support of the Nevada
Genomics, Proteomics and Bioinformatics Centers.
Author details
1
Department of Biochemistry and Molecular Biology, MS330, University of
Nevada, Reno, NV 89557-0330, USA.
2
Biotechnology Institute, Ankara
University, Merkez Laboratuvari, Rektorluk Binasi Arkasi, 06100 Ankara, Turkey.
Authors’ contributions
RLT performed all EST data analyses, Perl programming, mRNA extractions,
qRT-PCR, prepared all figures and tables, and wrote the initial manuscript
draft. AE performed all root EST sequencing, primary data analysis and
submission. RLA performed all root tissue preparations and mRNA
extractions and data analyses for root cDNA library construction. KAS
performed hierarchical clustering analysis and data interpretation and
finalization of the manuscript. GRC participated in the organization of the
studies and finalization of the manuscript. JCC conceived and organized the
studies, conducted EST data analysis, tracking and submission, data
interpretation, and finalized the figures and written manuscript. All authors
read and approved the final manuscript.
Received: 14 February 2011 Accepted: 18 May 2011
Published: 18 May 2011
References
1. Jaillon O, Aury J, Noel B, Policriti A, Clepet C, Casagrande A, Choisne N,
Aubourg S, Vitulo N, Jubin C, Vezzi A, Legeai F, Hugueney P, Dasilva C,
Horner D, Mica E, Jublot D, Poulain J, Bruyère C, Billault A, Segurens B,
Gouyvenoux M, Ugarte E, Cattonaro F, Anthouard V, Vico V, Del Fabbro C,
Alaux M, Di Gaspero G, Dumas V, et al: The grapevine genome sequence
suggests ancestral hexaploidization in major angiosperm phyla. Nature
2007, 449:463-467.
2. Velasco R, Zharkikh A, Troggio M, Cartwright D, Cestaro A, Pruss D, Pindo M,
Fitzgerald L, Vezzulli S, Reid J, Malacarne G, Iliev D, Coppola G, Wardell B,
Micheletti D, Macalma T, Facci M, Mitchell J, Perazzolli M, Eldredge G,
Gatto P, Oyzerski R, Moretto M, Gutin N, Stefanini M, Chen Y, Segala C,
Davenport C, Demattè L, Mraz A, et al: A high quality draft consensus
sequence of the genome of a heterozygous grapevine variety. PLoS ONE
2007, 2:e1326.
3. Scalabrin S, Troggio M, Moroldo M, Pindo M, Felice N, Coppola G, Prete G,
Malacarne G, Marconi R, Faes G, Jurman I, Grando S, Jesse T, Segala C,
Valle G, Policriti A, Fontana P, Morgante M, Velasco R: Physical mapping in
highly heterozygous genomes: a physical contig map of the Pinot Noir
grapevine cultivar. BMC Genomics 2010, 11:204.
4. Romieu C, Kappel C, Delrot S: Functional genomics: Closed system
approaches for transcriptome analysis. In Genetics, Genomics and Breeding
of Grapes. Edited by: Adam-Blondon A-F, Martinez-Zapata J, Kole C. New
York, NY: CRC Press; 2011:270-298.
5. Tillett R, Cushman J: Vitis functional genomics: Open systems for
transcriptome analysis. In Genetics, Genomics and Breeding of Grapes.
Edited by: Adam-Blondon A-F, Martinez-Zapata J, Kole C. Enfield, NH:
Science Publishers; 2011:235-269.
6. da Silva F, Iandolino A, Al-Kayal F, Bohlmann M, Cushman M, Lim H,
Ergul A, Figueroa R, Kabuloglu E, Osborne C, Rowe J, Tattersall E, Leslie A,
Xu J, Baek J, Cramer G, Cushman J, Cook D: Characterizing the grape
transcriptome. Analysis of expressed sequence tags from multiple Vitis
species and development of a compendium of gene expression during
berry development. Plant Physiol 2005, 139:574-597.
7. Iandolino A, Nobuta K, da Silva F, Cook D, Meyers B: Comparative
expression profiling in grape (Vitis vinifera) berries derived from
frequency analysis of ESTs and MPSS signatures. BMC Plant Biol 2008,
8:53.
8. Mica E, Piccolo V, Delledonne M, Ferrarini A, Pezzotti M, Casati C, Del
Fabbro C, Valle G, Policriti A, Morgante M, Pesole G, Pe ME, Horner D:
Correction: High throughput approaches reveal splicing of primary
Tillett et al. BMC Plant Biology 2011, 11:86
/>Page 20 of 23
microRNA transcripts and tissue specific expression of mature
microRNAs in Vitis vinifera. BMC Genomics 2010, 11:109.
9. Zenoni S, Ferrarini A, Giacomelli E, Xumerle L, Fasoli M, Malerba G, Bellin D,
Pezzotti M, Delledonne M: Characterization of transcriptional complexity
during berry development in Vitis vinifera using RNA-Seq. Plant Physiol
2010, 152:1787-1795.
10. Cramer G, Ergül A, Grimplet J, Tillett R, Tattersall E, Bohlman M, Vincent D,
Sonderegger J, Evans J, Osborne C, Quilici D, Schlauch K, Schooley D,
Cushman J: Water and salinity stress in grapevines: early and late
changes in transcript and metabolite profiles. Funct Integr Genomics 2007,
7:111-134.
11. Grimplet J, Deluc L, Tillett R, Wheatley M, Schlauch K, Cramer G, Cushman J:
Tissue-specific mRNA expression profiling in grape berry tissues. BMC
Genomics 2007, 8:187.
12. Chervin C, Tira-Umphon A, Terrier N, Zouine M, Severac D, Roustan J:
Stimulation of the grape berry expansion by ethylene and effects on
related gene transcripts, over the ripening phase. Physiol Plant 2008,
134:534-546.
13. Polesani M, Bortesi L, Ferrarini A, Zamboni A, Fasoli M, Zadra C, Lovato A,
Pezzotti M, Delledonne M, Polverari A: General and species-specific
transcriptional responses to downy mildew infection in a susceptible
(Vitis vinifera) and a resistant (V. riparia) grapevine species. BMC
Genomics 2010, 11:117.
14. Walker RR, Törökfalvy E, Scott NS, Kriedemann PE: An analysis of
photosynthetic response to salt treatment in Vitis vinifera. Aust J Plant
Physiol 1981, 8:359-374.
15. Prior L, Grieve A, Cullis B: Sodium chloride and soil texture interactions in
irrigated field grown Sultana grapevines. 1. Yield and fruit quality. Aust J
Plant Physiol 1992, 43:1067-1083.
16. Stevens R, Harvey G, Partington D, Coombe B: Irrigation of grapevines
with saline water at different growth stages 1. Effects on soil, vegetative
growth, and yield. Austral J Agric Res 1999, 50:343-355.
17. Sinclair C, Hoffmann AA: Monitoring salt stress in grapevines: are
measures of plant trait variability useful? J Appl Ecol 2003, 40:928-937.
18. Mullins MG, Bouquet A, Williams LE: Biology of the grapevine. Cambridge;
New York: Cambridge University Press; 1992.
19. Castellarin S, Pfeiffer A, Sivilotti P, Degan M, Peterlunger E, DI Gaspero G:
Transcriptional regulation of anthocyanin biosynthesis in ripening fruits
of grapevine under seasonal water deficit. Plant Cell Environ 2007,
30:1381-1399.
20. Esteban M, Villanueva M, Lissarrague J: Effect of irrigation on changes in
the anthocyanin composition of the skin of cv Tempranillo (Vitis vinifera
L.) grape berries during ripening. J Sci Food Agric 2001,
81:409-420.
21.
Kennedy JA, Matthews MA, Waterhouse AL: Effect of maturity and vine
water status on grape skin and wine flavonoids. Am J Enol Vitic 2002,
53:268-274.
22. Castellarin S, Matthews M, Di Gaspero G, Gambetta G: Water deficits
accelerate ripening and induce changes in gene expression regulating
flavonoid biosynthesis in grape berries. Planta 2007, 227:101-112.
23. Waters DLE, Holton TA, Ablett EM, Slade Lee L, Henry RJ: The ripening
wine grape berry skin transcriptome. Plant Science 2006, 171:132-138.
24. Deluc L, Grimplet J, Wheatley M, Tillett R, Quilici D, Osborne C, Schooley D,
Schlauch K, Cushman J, Cramer G: Transcriptomic and metabolite
analyses of Cabernet Sauvignon grape berry development. BMC
Genomics 2007, 8:429.
25. Chen JY, Wen PF, Kong WF, Pan QH, Wan SB, Huang WD: Changes and
subcellular localizations of the enzymes involved in phenylpropanoid
metabolism during grape berry development. J Plant Physiol 2006,
163:115-127.
26. Davies C, Robinson S: Differential screening indicates a dramatic change
in mRNA profiles during grape berry ripening. Cloning and
characterization of cDNAs encoding putative cell wall and stress
response proteins. Plant Physiol 2000, 122:803-812.
27. Deluc LG, Quilici DR, Decendit A, Grimplet J, Wheatley MD, Schlauch KA,
Merillon JM, Cushman JC, Cramer GR: Water deficit alters differentially
metabolic pathways affecting important flavor and quality traits in
grape berries of Cabernet Sauvignon and Chardonnay. BMC Genomics
2009, 10:212.
28. Pilati S, Perazzolli M, Malossini A, Cestaro A, Demattè L, Fontana P, Dal Ri A,
Viola R, Velasco R, Moser C: Genome-wide transcriptional analysis of
grapevine berry ripening reveals a set of genes similarly modulated
during three seasons and the occurrence of an oxidative burst at
vèraison. BMC Genomics 2007, 8:428.
29. Waters DLE, Holton TA, Ablett EM, Lee LS, Henry RJ: cDNA microarray
analysis of developing grape (Vitis vinifera cv. Shiraz) berry skin. Funct
Integr Genomics 2005, 5:40-58.
30. Terrier N, Glissant D, Grimplet J, Barrieu F, Abbal P, Couture C, Ageorges A,
Atanassova R, Leon C, Renaudin J, Dedaldechamp F, Romieu C, Delrot S,
Hamdi S: Isogene specific oligo arrays reveal multifaceted changes in
gene expression during grape berry (Vitis vinifera L.) development.
Planta 2005, 222:832-847.
31. Tattersall E, Grimplet J, DeLuc L, Wheatley M, Vincent D, Osborne C, Ergül A,
Lomen E, Blank R, Schlauch K, Cushman J, Cramer G: Transcript abundance
profiles reveal larger and more complex responses of grapevine to
chilling compared to osmotic and salinity stress. Funct Integr Genomics
2007, 7:317-333.
32. Figueiredo A, Fortes A, Ferreira S, Sebastiana M, Choi Y, Sousa L,
Acioli-Santos B, Pessoa F, Verpoor te R, Pai s M: Transcr iptional and
metabolic profiling of grape (Vitis vinifera L.) leave s unravel
possible innate resistance against pathogenic fungi.
JExpBot2008,
59:3371-3381
.
33. Rotter A, Camps C, Lohse M, Kappel C, Pilati S, Hren M, Stitt M, Coutos-
Thevenot P, Moser C, Usadel B, Delrot S, Gruden K: Gene expression
profiling in susceptible interaction of grapevine with its fungal
pathogen Eutypa lata: extending MapMan ontology for grapevine. BMC
Plant Biol 2009, 9:104.
34. Keilin T, Pang X, Venkateswari J, Halaly T, Crane O, Keren A, Ogrodovitch A,
Ophir R, Volpin H, Galbraith D, Or E: Digital expression profiling of a
grape-bud EST collection leads to new insight into molecular events
during grape-bud dormancy release. Plant Sci 2007, 173:446-457.
35. Mathiason K, He D, Grimplet J, Venkateswari J, Galbraith D, Or E, Fennell A:
Transcript profiling in Vitis riparia during chilling requirement fulfillment
reveals coordination of gene expression patterns with optimized bud
break. Funct Integr Genomics 2009, 9:81-96.
36. Sreekantan L, Mathiason K, Grimplet J, Schlauch K, Dickerson JA, Fennell AY:
Differential floral development and gene expression in grapevines
during long and short photoperiods suggests a role for floral genes in
dormancy transitioning. Plant Mol Biol 2010, 73:191-205.
37. Cushman JC, Bohnert HJ: Genomic approaches to plant stress tolerance.
Curr Opin Plant Biol 2000, 3:117-124.
38. Chinnusamy V, Jagendorf A, Zhu JK: Understanding and improving salt
tolerance in plants. Crop Sci 2005, 45:437-448.
39. Brunet J, Varrault G, Zuily-Fodil Y, Repellin A: Accumulation of lead in the
roots of grass pea (Lathyrus sativus L.) plants triggers systemic variation
in gene expression in the shoots. Chemosphere 2009, 77:1113-1120.
40. Huang KS, Lin M, Cheng GF: Anti-inflammatory tetramers of resveratrol
from the roots of Vitis amurensis and the conformations of the seven-
membered ring in some oligostilbenes. Phytochem 2001, 58:357-362.
41. Zhu YJ, Agbayani R, Jackson MC, Tang CS, Moore PH: Expression of the
grapevine stilbene synthase gene VST1 in papaya provides increased
resistance against diseases caused by Phytophthora palmivora. Planta
2004, 220:241-250.
42. Moser C, Segala C, Fontana P, Salakhudtinov I, Gatto P, Pindo M, Zyprian E,
Toepfer R, Grando M, Velasco R: Comparative analysis of expressed
sequence tags from different organs of Vitis vinifera L. Funct Integ
Genomics 2005, 5:208-217.
43. Zhang J, Hausmann L, Eibach R, Welter LJ, Topfer R, Zyprian EM: A
framework map from grapevine V3125 (Vitis vinifera ’Schiava grossa’ x
‘Riesling
’)
x rootstock cultivar ‘Borner’ (Vitis riparia x Vitis cinerea)to
localize genetic determinants of phylloxera root resistance. Theor Appl
Genet 2009, 119:1039-1051.
44. Choi YJ, Yun HK, Park KS, Noh JH, Heo YY, Kim SH, Kim DW, Lee HJ:
Transcriptional profiling of ESTs responsive to Rhizobium vitis from
‘Tamnara’ grapevines (Vitis sp.). J Plant Physiol 2010, 167:1084-1092.
45. Terrier N, Ageorges A, Abbal P, Romieu C: Generation of EST from grape
berry at various developmental stages. J Plant Physiol 2001,
158:1575-1583.
46. Peng F, Reid K, Liao N, Schlosser J, Lijavetzky D, Holt R, Martínez Zapater J,
Jones S, Marra M, Bohlmann J, Lund S: Generation of ESTs in Vitis vinifera
wine grape (Cabernet Sauvignon) and table grape (Muscat Hamburg)
and discovery of new candidate genes with potential roles in berry
development. Gene 2007, 402:40-50.
Tillett et al. BMC Plant Biology 2011, 11:86
/>Page 21 of 23
47. Lin H, Doddapaneni H, Takahashi Y, Walker M: Comparative analysis of
ESTs involved in grape responses to Xylella fastidiosa infection. BMC
Plant Biol 2007, 7:8.
48. Vitis vinifera-UniGene Build #12. [ />UGOrg.cgi?TAXID=29760].
49. DFCI - Grape Gene Index. [ />gimain.pl?gudb=grape].
50. Iandolino AB, da Silva FG, Lim H, Choi H, Williams LE, Cook DR: High-
quality RNA, cDNA, and derived EST libraries from grapevine (Vitis
vinifera L.). Plant Mol Biol Rep 2004, 22:269-278.
51. Gibbs AJ, McIntyre GA: The diagram method for comparing sequences.
its use with amino acid and nucleotide sequences. Eur J Biochem 1970,
16:1-11.
52. Haverty PM, Hsiao LL, Gullans SR, Hansen U, Weng Z: Limited agreement
among three global gene expression methods highlights the
requirement for non-global validation. Bioinformatics 2004, 20:3431-3441.
53. Romualdi C, Bortoluzzi S, D’Alessi F, Danieli GA: IDEG6: a web tool for
detection of differentially expressed genes in multiple tag sampling
experiments. Physiol Genomics 2003, 12:159-162.
54. Romualdi C, Bortoluzzi S, Danieli GA: Detecting differentially expressed
genes in multiple tag sampling experiments: comparative evaluation of
statistical tests. Hum Mol Genet 2001, 10:2133-2141.
55. Grimplet J, Cramer GR, Dickerson JA, Mathiason K, Van Hemert J,
Fennell AY: VitisNet: “Omics” integration through grapevine molecular
networks. PLoS ONE 2009, 4:e8365.
56. Grandbastien MA, Audeon C, Bonnivard E, Casacuberta JM, Chalhoub B,
Costa AP, Le QH, Melayah D, Petit M, Poncet C, Tam SM, Van Sluys MA,
Mhiri C: Stress activation and genomic impact of Tnt1 retrotransposons
in Solanaceae. Cytogenet Genome Res 2005, 110:229-241.
57. van Ruissen F, Ruijter JM, Schaaf GJ, Asgharnegad L, Zwijnenburg DA,
Kool M, Baas F: Evaluation of the similarity of gene expression data
estimated with SAGE and Affymetrix GeneChips. BMC Genomics 2005, 6:91.
58. Li S, Li YH, Wei T, Su EW, Duffin K, Liao B: Too much data, but little inter-
changeability: a lesson learned from mining public data on tissue
specificity of gene expression. Biol Direct 2006, 1:33.
59. Pertea G, Huang X, Liang F, Antonescu V, Sultana R, Karamycheva S, Lee Y,
White J, Cheung F, Parvizi B, Tsai J, Quackenbush J: TIGR Gene Indices
clustering tools (TGICL): a software system for fast clustering of large
EST
datasets. Bioinformatics 2003, 19:651-652.
60. Audic S, Claverie J: The significance of digital gene expression profiles.
Genome Res 1997, 7:986-995.
61. Martin D, Aubourg S, Schouwey M, Daviet L, Schalk M, Toub O, Lund S,
Bohlmann J: Functional annotation, genome organization and phylogeny
of the grapevine (Vitis vinifera) terpene synthase gene family based on
genome assembly, FLcDNA cloning, and enzyme assays. BMC Plant
Biology 2010, 10:226.
62. Stekel DJ, Git Y, Falciani F: The comparison of gene expression from
multiple cDNA libraries. Genome Res 2000, 10:2055-2061.
63. Hornshoj H, Bendixen E, Conley LN, Andersen PK, Hedegaard J, Panitz F,
Bendixen C: Transcriptomic and proteomic profiling of two porcine
tissues using high-throughput technologies. BMC Genomics 2009, 10:30.
64. Weinl S, Kudla J: The CBL-CIPK Ca
2+
-decoding signaling network: function
and perspectives. New Phytol 2009, 184:517-528.
65. Batistic O, Waadt R, Steinhorst L, Held K, Kudla J: CBL-mediated targeting
of CIPKs facilitates the decoding of calcium signals emanating from
distinct cellular stores. Plant J 2010, 61:211-222.
66. Hanana M, Deluc L, Fouquet R, Daldoul S, Léon C, Barrieu F, Ghorbel A,
Mliki A, Hamdi S: Identification and characterization of “rd22”
dehydration responsive gene in grapevine (Vitis vinifera L.). C R Biol 2008,
331:569-578.
67. Almasia N, Bazzini A, Hopp H, azquez-Rovere C: Overexpression of snakin-
1 gene enhances resistance to Rhizoctonia solani and Erwinia carotovora
in transgenic potato plants. Mol Plant Pathol 2008, 9:329-338.
68. Bonaldo M, Lennon G, Soares M: Normalization and subtraction: two
approaches to facilitate gene discovery. Genome Res 1996, 6:791-806.
69. Fouquet R, Leon C, Ollat N, Barrieu F: Identification of grapevine
aquaporins and expression analysis in developing berries. Plant Cell Rep
2008, 27:1541-1550.
70. Shelden M, Howitt S, Kaiser B, Tyerman S: Identification and functional
characterisation of aquaporins in the grapevine, Vitis vinifera. Funct Plant
Biol 2009, 36:1065-1078.
71. Schmidlin L, Poutaraud A, Claudel P, Mestre P, Prado E, Santos-Rosa M,
Wiedemann-Merdinoglu S, Karst F, Merdinoglu D, Hugueney P: A stress-
inducible resveratrol O-methyltransferase involved in the biosynthesis of
pterostilbene in grapevine. Plant Physiol 2008, 148:1630-1639.
72. Deluc LG, Decendit A, Papastamoulis Y, Merillon JM, Cushman JC,
Cramer GR: Water deficit increases stilbene metabolism in Cabernet
Sauvignon berries. J Agric Food Chem 2010, 59:289-297.
73. Kim SJ, Kim KW, Cho MH, Franceschi VR, Davin LB, Lewis NG: Expression of
cinnamyl alcohol dehydrogenases and their putative homologues
during Arabidopsis thaliana growth and development: Lessons for
database annotations? Phytochem 2007, 68 :1957-1974.
74. Marchler-Bauer A, Anderson JB, Chitsaz F, Derbyshire MK, DeWeese-Scott C,
Fong JH, Geer LY, Geer RC, Gonzales NR, Gwadz M, He S, Hurwitz DI,
Jackson JD, Ke Z, Lanczycki CJ, Liebert CA, Liu C, Lu F, Lu S, Marchler GH,
Mullokandov M, Song JS, Tasneem A, Thanki N, Yamashita RA, Zhang D,
Zhang N, Bryant SH: CDD: specific functional annotation with the
Conserved Domain Database. Nucleic Acids Res 2009, 37:D205-210.
75. He XZ, Wang X, Dixon RA: Mutational analysis of the Medicago
glycosyltransferase UGT71G1 reveals residues that control
regioselectivity
for (iso)flavonoid glycosylation. J Biol Chem 2006,
281:34441-34447.
76. Kubo A, Arai Y, Nagashima S, Yoshikawa T: Alteration of sugar donor
specificities of plant glycosyltransferases by a single point mutation.
Arch Biochem Biophys 2004, 429:198-203.
77. Tattersall EAR, Ergul A, AlKayal F, DeLuc L, Cushman JC, Cramer GR:
Comparison of methods for isolating high-quality RNA from leaves of
grapevine. Am J Enol Vitic 2005, 56:400-406.
78. Murashige T, Skoog F: A revised medium for rapid growth and bio assays
with tobacco tissue cultures. Physiologia Plantarum 1962, 15:473-497.
79. Gamborg OL, Miller RA, Ojima K: Nutrient requirements of suspension
cultures of soybean root cells. Exp Cell Res 1968, 50:151-158.
80. Mao C, Cushman JC, May GD, Weller JW: ESTAP-an automated system for
the analysis of EST data. Bioinformatics 2003, 19:1720-1722.
81. Burke J, Davison D, Hide W: d2_cluster: a validated method for clustering
EST and full-length cDNA sequences. Genome Res 1999, 9:1135-1142.
82. Huang X, Madan A: CAP3: A DNA sequence assembly program. Genome
Res 1999, 9:868-877.
83. Ewing B, Hillier L, Wendl MC, Green P: Base-calling of automated
sequencer traces using phred. I. Accuracy assessment. Genome Res 1998,
8:175-185.
84. Altschul S, Gish W, Miller W, Myers E, Lipman D: Basic local alignment
search tool. J Molec Biol 1990, 215:403-410.
85. cDNA Library 22274 [Vitis vinifera]. [ />library.cgi?ORG=Vvi&LID=22274].
86. Batch Entrez. [ />87. Index of /externe/Download/Projets/Projet_ML/data. [http://www.
genoscope.cns.fr/externe/Download/Projets/Projet_ML/data/].
88. Pontius JU, Wagner L, Schuler GD: UniGene: a unified view of the
transcriptome. The NCBI Handbook Bethesda (MD): National Center for
Biotechnology Information; 2003.
89. DotPlot | Download DotPlot software for free at SourceForge.net. [http://
sourceforge.net/projects/dotplot/].
90. Eclipse - The Eclipse Foundation open source community website.
[ />91. Journet EP, van Tuinen D, Gouzy J, Crespeau H, Carreau V, Farmer MJ,
Niebel A, Schiex T, Jaillon O, Chatagnier O, Godiard L, Micheli F, Kahn D,
Gianinazzi-Pearson V, Gamas P: Exploring root symbiotic programs in the
model legume Medicago truncatula using EST analysis. Nucleic Acids Res
2002,
30:5579-5592.
92.
Eisen MB, Spellman PT, Brown PO, Botstein D: Cluster analysis and display
of genome-wide expression patterns. Proc Natl Acad Sci USA 1998,
95:14863-14868.
93. VitisNet. [ />94. IDEG6 software home page. [ />IDEG6_form/].
Tillett et al. BMC Plant Biology 2011, 11:86
/>Page 22 of 23
95. Primer designing tool. [ />index.cgi?LINK_LOC=BlastHome].
96. Rozen S, Skaletsky H: Primer3 on the WWW for general users and for
biologist programmers. Methods Mol Biol 2000, 132:365-386.
97. Reid KE, Olsson N, Schlosser J, Peng F, Lund ST: An optimized grapevine
RNA isolation procedure and statistical determination of reference
genes for real-time RT-PCR during berry development. BMC Plant Biol
2006, 6:27.
doi:10.1186/1471-2229-11-86
Cite this article as: Tillett et al.: Identification of tissue-specific, abiotic
stress-responsive gene expression patterns in wine grape (Vitis vinifera
L.) based on curation and mining of large-scale EST data sets. BMC Plant
Biology 2011 11:86.
Submit your next manuscript to BioMed Central
and take full advantage of:
• Convenient online submission
• Thorough peer review
• No space constraints or color figure charges
• Immediate publication on acceptance
• Inclusion in PubMed, CAS, Scopus and Google Scholar
• Research which is freely available for redistribution
Submit your manuscript at
www.biomedcentral.com/submit
Tillett et al. BMC Plant Biology 2011, 11:86
/>Page 23 of 23