báo cáo khoa học: " Transcriptomics and molecular evolutionary rate analysis of the bladderwort (Utricularia), a carnivorous plant with a minimal genome" pptx
Bạn đang xem bản rút gọn của tài liệu. Xem và tải ngay bản đầy đủ của tài liệu tại đây (4.16 MB, 16 trang )
Transcriptomics and molecular evolutionary rate
analysis of the bladderwort (Utricularia), a
carnivorous plant with a minimal genome
Ibarra-Laclette et al.
Ibarra-Laclette et al. BMC Plant Biology 2011, 11:101
(3 June 2011)
RESEA R C H ART I C L E Open Access
Transcriptomics and molecular evolutionary rate
analysis of the bladderwort (Utricularia), a
carnivorous plant with a minimal genome
Enrique Ibarra-Laclette
1
, Victor A Albert
2
, Claudia A Pérez-Torres
1
, Flor Zamudio-Hernández
1
,
María de J Ortega-Estrada
1
, Alfredo Herrera-Estrella
1*
and Luis Herrera-Estrella
1*
Abstract
Background: The carnivorous plant Utricularia gibba (bladderwort) is remarkable in having a minute genome,
which at ca. 80 megabases is approximately half that of Arabidopsis. Bladderworts show an incredible diversity of
forms surrounding a defined theme: tiny, bladder-like suction traps on terrestrial, epiphytic, or aquatic plants with a
diversity of unusual vegetative forms. Utricularia plants, which are rootless, are also anomalous in physiological
features (respiration and carbon distribution), and highly enhanced molecular evolutionary rates in chloroplast,
mitochondrial and nuclear ribosomal sequences. Despite great interest in the genus, no genomic resources exist
for Utricularia, and the substitution rate increase has received limited study.
Results: Here we describe the sequencing and analysis of the Utricularia gibba transcriptome. Three different
organs were surveyed, the traps, the vegetative shoot bodies, and the inflorescence stems. We also examined the
bladderwort transcriptome under diverse stress conditions. We detail aspects of functional classification, tissue
similarity, nitrogen and phosphorus metabolism, respiration, DNA repair, and detoxification of reactive oxygen
species (ROS). Long contigs of plastid and mitochondrial genomes, as well as sequences for 100 individual nuclear
genes, were compared with those of other plants to better establish information on molecular evolutionary rates.
Conclusion: The Utricularia transcriptome provides a detailed genomic window into processes occurring in a
carnivorous plant. It contains a deep representation of the complex metabolic pathways that characterize a
putative minimal plant genome, permitting its use as a source of genomic information to explore the structural,
functional, and evolutionary diversity of the genus. Vegetative shoots and traps are the most similar organs by
functional classification of their transcriptome, the traps expressing hydrolytic enzymes for prey digestion that were
previously thought to be encoded by bacteria. Supporting physiological data, global gene expression analysis
shows that traps significantly over-express genes involved in respiration and that phosphate uptake might occur
mainly in traps, whereas nitrog en uptake could in part take place in vegetative parts. Expression of DNA repair and
ROS detoxification enzymes may be indicative of a response to increased respiration. Finally, evidence from the
bladderwort transcriptome, direct measurement of ROS in situ, and cross-species comparisons of organellar
genomes and multiple nuclear genes supports the hypothesis that increased nucleotide substitution rates
throughout the plant may be due to the mutagenic action of amplified ROS production.
* Correspondence: ;
1
Laboratorio Nacional de Genómica para la Biodiversidad, Centro de
Investigación y de Estudios Avanzados del Instituto Politécnico Nacional,
36821 Irapuato, Guanajuato, México
Full list of author information is available at the end of the article
Ibarra-Laclette et al. BMC Plant Biology 2011, 11:101
/>© 2011 Ibarra-Laclette et al; licensee BioMed Central Ltd. This is an Open Access article distributed under the terms of the Creative
Commons Attribution License (ht tp://creativecommons.org/licenses/b y/2.0), which permits unrestricted use, distribution, and
reproduction in any medium, provided the original work is properly cited.
Background
The carnivorous plant Utricularia and its sister genus
Genlisea (Lentibula riaceae) share two anomalous mole-
cular evolutionary features: highly increased rates of
nucleotide substitution across the genomes of all three
cellular compartments, mito chondrial, plastid, and
nuclear [1-4], and dynamic evolution of genome size at
the level of species o r even population [5,6]. Some
species, such as Utricularia gibba and Genlisea aurea,
possess the smallest haploid angiosperm genomes
known, at ca. 80 and 60 megabases (Mb), respectively,
one-half or even less than that of Arabidopsis thaliana
(Arabidopsis), and have bacterial-size chromosomes that
vary widely in number between species [5]. Paradoxi-
cally, Genlisea also contai ns species with genomes up to
1500 Mb in size. Along with their many physiological
and morphological peculiarities, these plants are prime
candidates for f urther research on the complexities of
plant physiology associated with carnivory, metagenomic
surveys of trap micr obial communities, novel plant
nitrogen/nutrient utilization pathways, the ecology of
prey attraction, whole-plant and trap comparative
development, and finally, evolution of the minimal
angiosperm genome [6].
With a total of 214 species w orldwide, Utricularia is
the largest genus of carnivorous plants [7]. The name
“bladderwort” refers to the bladder-like suction traps
that serve for prey capture. Bladders take on many
forms within a theme, and their morphologies among
species match well with phylogenetic groupings [1].
Additionally, bladders can appear on almost ever y sur-
face of the plants’ leafy or non-leafy structures, as well
as in place of a first embryonic leaf [7,8]. Ecologically,
the genus comprises predominantly small annual or per-
ennial herbs that occur in three life forms: about 60% of
the species are terrestrial, 15% aquatic, and the remain-
ing 25% comprise lithophytes and epiphytes [7]. Like
other carnivorous plants, Utricularia are typically inha-
bitants of nutrient-poor environments, and supplement
normal photolithotrophic nutrition by trapping and uti-
lizing prey, typically aquatic crustaceans, m ites, rotifers
and protozoa [9,10]. Previous studies have confirmed
nutrient uptake from artificially fed prey in Utricularia
[11,12], and it is known that organic carbon (C), nitro-
gen (N) and phosphorus (P) are prominent targets of
prey digestion in carnivorous plants [13]. In contrast
with other carnivorous plants that acquire carbon from
their prey, in some Utricularia species photosyntheti-
cally absorbed C is s ecreted into the trap e nvironment
[14], suggesting that C supplied into the traps benefits
the large associated microbial community, while N and
P derived from this community become available for
plant uptake in a manner similar to the rhizosphere
interactions of terrestrial plants [14,15]. Near zero O
2
in
traps of aquatic Utricularia species probably determines
the type of organisms that can live inside traps, where a
captured prey dies of oxygen deprivation [16]. Digestive
extracellular enzymes have been detected on the various
trap glands and in the trap fluid [17,18]. It has been
proposed that a considerable proportion of enzymatic
activity in trap fluid is derived from the commensal
organisms that liv e in Utricularia bladders [15]. How-
ever, d etermination of enzyme activities does not prove
their origin, with some of them possibly encoded in the
Utricularia genome.
Despite considerable interest in the biology of Lenti-
bulariaceae, no genomic data is available for these carni-
vorous plants. Massive parallel 454 pyrosequencing has
become a feasible method for de novo transcriptome
sequencing with sufficient depth and coverage to carry
out quantitative differential gene expression analysis
[19-21], which has already been efficiently used for
large-scale transcriptome sequencing of different plant
species [22-24]. With the aim of determining the Utricu-
laria transcriptome and report a detailed analysis of the
resulting sequences, we sequenced and assembled 185.5
Mpb of Utricularia gibb a ESTs. Utricularia gibba (Len-
tibulariaceae) is a free-floating, submerged aquatic carni-
vorous plant with a small genome of about 80 Mbp [5].
This work provides the first broad survey of nuclear
genes t ranscripts in Utricularia species, permitting sev-
eral hypotheses about their physiology and morphology
to be assessed. We detail aspects of the U. gibba tran-
scriptome in different organs as well as in plants under
physiological stress. Particular attention is paid t o the
expression of genes involved in N and P uptake, hydro-
lase-related genes expressed during prey digestion, as
well as genes involved in respiration and Reactive
Oxygen Species (ROS) production and scavenging. We
also report preliminary sequencing of the chloroplast
and mitochondrial genomes and provide analyses of
molecular evolutionary rates. Finally, using molecular
evolutionary analyses and direct experimental methods,
we evaluate the hypothesis of Albert et al., 2010 [6],
which postulates that Reactive Oxygen Species (ROS)
derived from specialized action of cytochrome c oxidase
account for increased substitution rates and genome-
size dynamism following DNA repair.
Results and Discussion
Basic analysis of the Utricularia gibba transcriptome
Three cDNA libraries were generated from RNA
extracted from different organs of U. gibba plants [traps:
TrpL, shoots: ShtL (vegetative organs), and inflores-
cences: FlwL (reproductive organs)]. Additionally, a
cDNA library from whole plants subjected to multiple
Ibarra-Laclette et al. BMC Plant Biology 2011, 11:101
/>Page 2 of 15
physiological stress conditions was generated (StsL) (see
Methods for more details). cDNA libraries were
sequenced in two 454 pyrosequencing runs. 817,792
masked reads were entered into the assembly process
(for more information about masked reads and assembly
process see Me thods). Using New bler Assembler soft-
ware (v2.5; cDNA pipeline) a high proportion of non-
assembled reads (singlets) was obtained; this fraction
represents approximately one quarter of total masked
reads (data not shown). Using a different assembly
approach that consisted of cluster ing/ass embl ing proce-
dures, the vast majority of the masked reads (88.27%)
were merged into contigs. The total number of clusters
generated was 13,122 that assembled into 16,551 con-
tigs, with an average of 66.4 reads per contig. The
length of contigs ranged from 0.1 to 3.0 kb, with an
average length of 707.45 bp, suggesting that a significant
number of contigs may represent full-length cDNAs.
Thepresenceofmultiplecontigsinaclustercouldbe
duetopossiblealternativetranscripts, paralogy or
domain sharing. All reads that did not meet the match
criteria to be clustered/assembled with any other reads
during the clustering/assembling process were defined
as singlets. The total number of singlets was 95,873
(only 11.72% of total masked reads) with an average
length of 215.71 nucleotides. Unique transcripts (UT)
from U. gibba we re generated by combining 16,551
assembled contigs and 95,873 singlets.
U. gibba UT were annotated by searching for
sequence similarities using BLASTX against proteins
identified in several available complete plant genomes
[Arabidopsis thaliana, Populus trichocarpa, Ricinus com-
munis, Vitis vinifera (dicotyledoneous plants), Oryza
sativa, Sorghum bicolor (monocotyledoneous plants),
Physcomitrella patens (moss), Chlamydomonas reinhard-
tii,andOstreococcus lucimarinas (green algae), all of
them downloaded from the RefSeq database [25]. Using
acut-offe-valueof≤ 10
-05
and a bit score ≥ 45 we
found that 60,595 (54%) of U. gibba UT have high iden-
tity to at least one plant protein. The high proportion of
U. gibba UT with no significant hit (~46%) was
expected since the likelihood of finding similarity to pre-
viously described proteins is highly dependent on the
length of the query sequence. This is illustrated by con-
tig versus singlet hits to database proteins; contigs were
found to have significant similarity to plant proteins in
over 90% of cases, whereas the majority (55%) of singlets
bore no similarity to any proteins. It is also possible that
many U. gibba UT could not be reliably annotated
because they represent untranslated regions (UTRs) or
non-coding RNAs (nc RNAs). A comparison of U. gibba
UT against the U. gibba genome sequence (assembled
using Celera; [26,27]) using BLASTN shows that 85.2%
of the transcripts have a significant hit against the
genome (98% of alignment length and minimal sequence
identity of 90% over the complete alignment). The
remaining sequences probably failed to align because
the U. gibba genome is currently represented by a preli-
minary draft assembly of relatively low coverage (~8x,
E. Ibarra-Laclette et al., unpublished data).
We determined the proportion of plant proteins for
which homology was detected among U. gibba UT.
Homology was detec ted to 4 3% of Arabidopsis (14,382
of 33,405), 38% of Populus (16,202 of 42,344), 40% of
Ricinus (12,494 of 31,221), 55% of Vitis (13,017 of
23,493), 47% of Oryza (12,652 of 26,940), 38% of
Sorghum (12,472 of 33,005), 30% of Physcomitrella (10,789
of 35,936), 30% of Chlamydomonas (4,441 of 14,503) and
47% of Ostreococcus proteins (3,621 of 7,603). U. gibba UT
were similar, at most, to 16,202 unique plant proteins
(Additional file 1, Table S1). This number represents the
most stringent underestimation of the minimal number of
U. gibba genes found expressed in the organs and condi-
tions sampled in this study.
The Kyoto Encyclopedia of Genes and Genomes
(KEGG) classifications [28] from best-hit plant proteins
were associated to U. gibba UT in order to identify pro-
teins with a known function. Proportions of best hits in
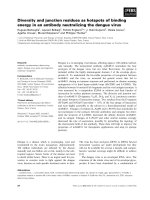
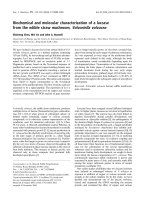
each KEGG category are shown in Figure 1. Addition-
ally, using the KEGG Atlas resource [29] we created a
global metabolism map combining 119 existing path-
ways, corresponding to 16,595 genes referenced to in
the KEGG database for Arabidopsis, Populus, Vitis,
Ricinus, Oryza, Sorghum, Physcomitrella, Chlamydomo-
nas and Ostreococcus. This global metabolism map was
compared to the global map created for the U. gibba
UT, for whi ch 117 distinct metabolic pathways could be
assigned (Additional file 2, Figure S1) out of 119 plant
metabolic pathways annotated in the KEGG Atlas.
These results indicate t hat the U. gibba UT comprise a
deep representation of the complex metabolic pathways
that characterize a plant genome, permitting their use as
asourceofgenomicinformation to explore the struc-
tural, functio nal, and evolutionary diversity of the
Lentibulariaceae.
Identification of U. gibba transcription factor (TF) families
Plants devote ~7% of their genome coding capacity to
proteins that regulate transcriptional activities [30-32].
Analysis of completed plant genome sequences sugges ts
that over 60 transcription factor (TF) famil ies are p re-
sent in most plant genomes. In Arabidopsis [33,34] and
Populus trichocarpa [35,36] the 64 TF families vary in
size from 1-2 members to over 100 members. Rice con-
tains 63 of the 64 dicot TF families [38,39], missing only
the SAP1 family, which is represented b y a single gene
in both Arabidopsis and P. trichocarpa.About~3%
(3,222) of the U. gibba UT showed significant homology
Ibarra-Laclette et al. BMC Plant Biology 2011, 11:101
/>Page 3 of 15
(BLASTx; e-value ≤ 10
-05
and a bit score ≥ 45) to
known TFs previously defined in Arabidopsis [33,34]
and were similar to a maximum of 920 uni que TFs. We
examined the distribution among the known TF families
in vascular plants, and in selected cases, the complexity
of U. gibba TF families relative to w hat is found in
other plant species. At least one m ember for 61 of the
64 TF families previously identified in vascular plants
was identified in U. gibba UT. Among the low copy TF
families present in other plants, one member of each of
the HRT-like, LFY, Whirly, S1Fa-like and VOZ families,
two members of the BBR-BPC, CCAAT -DR1, CPP, GIF
and MBF1 gene families, and 3 members of the C2C2-
YABBY and EIL gene families are represen ted in the U.
gibba UT. O nly the SAP1, NZZ and ULT TF families
were not represented among the U. gibba UT (Addi-
tional file 3, Table S2).
Since U. gibba is a plant that lacks roots, it was possi-
ble that genes involved in root development had been
lost, contributing to a reduction in genome size.
Although the transcriptomes would never be a full
representation of all genes present in a given genome,
interestingly,wefoundthatmostoftheTFspreferen-
tially expressed in and known to be involved in root
development, including homologous proteins to the
A. thaliana ARFs 5, 7, 19, AUX/IAA proteins 3, 7, 12,
14 and 17; Short Root and Scarecrow (members of
GRAS family) are represented in the U. gibba transcrip-
tome [37]. This finding suggests the possibility that the
lack of roots in U. gibba may not be due to a preferen-
tial loss of genes involvedinrootdevelopmentbut
instead a loss of developmental programs involved in
the establishment o f the gene expression networks
required for root formation.
Changes in transcript abundance in the U. gibba
transcriptome
Each organ-specific transcriptome was significantly
sampled, and only a low disparity among t he number of
reads in each organ was detected (258,457 reads for
FlwL, 234,963 for ShtL, and 292,970 for TrpL). The
transcriptome obtained from U. gibba plants exposed to
different stresses (pooled from constant light, darkness,
cold temperature, and drought conditions) was also
included in our analysis (represented b y StsL, 140,507
reads). A large proportion of the reads (88.27%)
assembled into 16,551 contigs, each a ssumed to repre-
sent a distinct gene structure. In principle, the number
of rea ds that assemble in a specific contig represents the
abundance of mRNA produced by a particular gene in a
Figure 1 Functional annotation. Proportion of KEGG categories (Kyoto Encyclopedia of Genes and Genomes) found in the U. gibba unique
transcripts (UT) compared with plants genome annotations [(Arabidopsis thaliana, Populus trichocarpa, Ricinus communis, Vitis vinifera (dicotyledon
plants), Oryza sativa, Sorghum bicolor (monocotyledon plants), Physomitrella patens (moss), Chlamydomonas reinhardtii, and Ostreococcus
Lucimarinuas (green algae’s)].
Ibarra-Laclette et al. BMC Plant Biology 2011, 11:101
/>Page 4 of 15
given tissue sample. However, differences in transcript
abundance may reflec t sampling errors rather than gen-
uine differences in gene expression. In consequence,
read counts must be normalized to allow comparison of
expression measures across samples, and a common
practice is to scale gene counts by library totals [38,39].
Recently, however, it has been reported that more gen-
eral quantile-based procedures yield much better con-
cordance with expression pattern values obtained by
qRT-PCR [40]. Therefore, we decided to normalize
read-counts in the R environment [41] using a quantile
normalization procedure similar to that described pre-
viously by Bullard et al. 2010 [40], which is b ased on a
previously described microarray normalization approach
[42]. An e xpression profile matrix was created (Addi-
tional file 4, Table S3) containing the number of reads
for each of the 16,551 genes represented by contigs
(rows) and four normalized transcriptomes (columns).
Normalized read counts ranged from 0-3500.
To assess the relative abundance of gene transcripts
among organ-specific transcriptomes, we applied the
statistical R test [43]. We considered preferentially
expressed genes (PEGs) to be contigs with R ≥ 8(true
positive rate of ~98%) and a 2-fold minimum differ-
ence in terms of reads per organ-specific transcriptome
as compared against the other sequence sets. A total of
1,181 U. gibba UT were identified as PEGs; 523 in
FlwL, 277 in ShtL and 388 in TrpL, some of which
could be considered as organ-specific genes because of
all reads forming these U. gibba contigs were derived
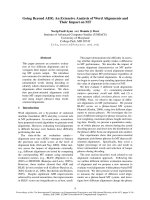
from a single cDNA tissue sample (Figure 2A and
Additional file 5, Table S4). To identify ubiquitously
expressed genes we considered only those clusters with
at least one read from every library. In this case, all
statistical tests were required to have non-significant
results (Additional file 6, Table 5). Stress responsive
genes were identified by comparing the t ranscriptome
obtained from U. gibba stressed plants (represented by
StsL) against all organ-specific data sets. According to
the stringency levels (R ≥ 8 and fold ± 2) a total of
200 U. gibba UT were identified as differentially
expressed genes in r esponse to multiple physiological
stresses (Additional file 7, Table S6).
In order to quantify the similarity among organ-speci-
fic U. gibba transcriptomes we compared their diversity
and specialization using a recently described model
based on Shannon entropy. Diversity (Hj) is measured
by an adaptation of Shannon’s formula for entropy of a
transcriptome’s frequency distribution, while specializa-
tion (δj) is estimated as the average specificity of the
genes expressed in each organ [44]. The estimation of
these properties allows the recognition of gene ral differ-
ences a mong the transcriptomes, enhancing the under-
standing of their distributions. We note t hat the most
specialized organ sampled in U. gibba is the inflores-
cence, even when the traps, characteristic for the genus,
areamongthemostintricatestructuresintheplant
kingdom and are the organ through which Utricularia
attract, capture and digest their prey [10,45,46]. The
diversity measures of the three organ classes (shoot,
inflorescences and traps) group in a region of relatively
low diversity (Figure 2B). Shoots and traps, however,
could be considered as extremely similar organs based
on their transcriptomes. This is not surprising, however,
given that bladders are in fact modifi ed leaves with sen-
sitive bristles on “trap door” entrances [45].
Functional classification of differentially expressed genes
highlights energy, metabolism, and hydrolases
PEGs in a specific organ were classified into f unction al
categories according to the Munich Information Center
for Protein Sequences classification (MIPS) using the
FunCat database [47,48] and an Arabidopsis annotation
was obtained for U. gibba UT (Additional file 8,
Table S7). A Venn diagram was constructed to show
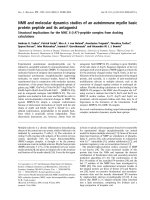
Figure 2 Analysis of the Ut ricularia gibba transcriptome. (A)
Venn diagram of ubiquitously and preferentially expressed genes
(PEG). Biological processes over-represented by PEG are summarized
in figure. (B) Scatter plot of the values of diversity, Hj vs. the values
of specialization given by the average gene specificity of the
organs, δj.
Ibarra-Laclette et al. BMC Plant Biology 2011, 11:101
/>Page 5 of 15
selected overrepresented categories and their intersec-
tions in inflorescences, traps and shoots (Figure 2A). As
one validatio n of differential expression in these tissues,
among inflorescence PEGs, the MIPS category “ Tissue
differentiation” was significantly over-represented via the
subcategory ‘flower’ (Supplementary Table 6). Further-
more, 15 g enes for which expression was considered as
PEG among the transcriptomes were selected with the
aim of validating expression patterns found. In general
we found a good correlation (r
2
= 0.89) of the expres-
sion levels obtained by 454 sequencing with those
obtained by qRT-PCR (Additional file 9, Figure S2).
A noteworthy over-re presented MIPS category identi-
fied in shoot and trap PEG was “ Energy” . In shoot
PEG the “Energy” MIPS category is represented by
‘photosynthesis’ and ‘en ergy conversion and regenera-
tion’ subcategories, while in trap P EG, this category is
represented by ‘respiration’ and ‘electron transport and
membrane-associated energy conservation’ subcategories
(Additional file 8, T able S7). As expected in shoot PEG,
the U. gibba UT annotated as SBPase (Sedoheptulose-
biphospha tase; AT3G5 5800) and RuBisCo small subunit
1B (AT5G38430) were identified as over-represented in
the “Metabolism” MIPS category (represented by subca-
tegory ‘autotrophic CO
2
-fixations’) (Additional file 8,
Table S7). These results suggest that whereas photo-
synthesis occurs mainly in the shoot, in traps respiration
is the major metabolic activity.
With regard to PEG in traps, some U. gibba UT were
annotated as hydrolases (Additional file 5, Table S4).
These U. gibba UT were: CL12267contig15708 (putative
aminopeptidase; similar to AT4G30920), CL3763con-
tig07204 (putative a-glucosidase; similar to AT5G11720),
CL434contig01978 (putative b-glucosidase; similar to
AT1G02850), CL613 4contig09575 (putative b-hexosami-
nidase; similar to AT1G6559 0) a nd CL85 1contig02926
(putative purple acid phosphatase; similar to AT1G14700).
Activities for the same five hydrolases have been reported
in the fluid collected from traps of four aquatic Utricularia
species (U. foliosa, U. australis, U. aurea and U. vulgaris)
[17,18].
Nitrogen and phosphorous uptake in U. gibba
Nitrogen and phosphorous are two essential macronutri-
ent elements for plants, that are often a major constraint
for plant growth and reproduction in both terrestrial
and aquatic ecosystems. The major forms of these nutri-
ents utilized by plants are nitrate (NO
3
-
) and phosphate
(H
2
PO
4
-
; Pi). A number of genes encoding the transpor-
ters and channels for nutrient acquisition have been
identified and functionally characterized in model spe-
cies, particularly Arabidopsis and rice [49-51]. It has
been proposed that phosphorus uptake from prey might
be more important than that of nitrogen [17]. Trap fluid
stoichiometry (molar N:P ratios about 100) as well as
the presence of nutrient limited microbial cells (molar
N:P ratios 25-61) i ndicates the importance of
phosphorus rather than nitrogen for the nutrition of
Utricularia [15]. Additionally, in U. vulgaris it has been
reported that investment in carnivory, calculated as the
proportion of leaf biomass and leaf area comprising
traps, is inversely proportional t o the availability of Pi
from non-carnivorous sources, whereas N showed no
significant effect in the investment in carnivory [52].
This is consistent with the notion that phosphorus
uptake from prey might be more important than th at of
nitrogen for Utricularia species. A gene encoding an
acid phosphatase is the highest expressed among Utricu-
laria PEGs (Additional file 9, Figure S2), and genes
encoding three members of the Pht1 family of high affi-
nity Pi transporter were identified as PEGs in traps
(Additional file 10, Table S8). Since the Pht1 family
comprises high-affinity Pi strongly expressed in plant
roots [53-58], we suggest that in rootless Utricularia Pi
uptake takes place mainly in the traps [8,59].
In higher plants there are two types of nitrate transpor-
ters, named NRT1 and NRT2s (low- and high-affinity
nitrate transporters) [60]. Microarray experiments have
been used to identify additional genes involved in nitrate/
nitrite assimilation [61]. Using this i nformation we iden-
tified a total of 77 U. gibba UT annotate d as homologous
to Arabidopsis prot eins involved in the nit rate assimila-
tion pathway (45 members from the NTR1 family, 3 from
the NTR2 and 23 Nitrate/nitrite-assimilation genes)
(Additional file 11, Table S19). Most of these genes we re
found to be ubiquitously expressed in U. gibba,withthe
exception of the homolog of the Arabidopsis CHL1 gene
that was identified among the shoot PEGs. CHL1
(AT1G08090) i s a NTR2 protein that recently has been
reported to function as a nitrate sensor in plants [62].
Additionally we found that three different U. gibba UT
annotated as δ-TIP (Tonoplast Intrinsic P rotein;
AT3G16240) were among the most highly expressed
genes in shoot. δ-TIP (AT3G16240) has recently been
reported as an ammonium (NH
4
) transporter, since
δ-andg-TIP’ s (AT3G16240 and AT2G36830, respec-
tively) complement the lack of urea transporters in yeast
[63]. In the bladderwort Utricularia vulga ris, 51.8% of
the total nitrogen content has been estimated to come
from insect derived nitr ogen [12], however, contribution
of nitrogen from animal prey is variable in carnivorous
plants, with estimates ranging from 10% to 87% depen-
dent on taxa [64]. Cons idering the high amino acid iden-
tity (Additional file 12, Figure S3), ranging from 59.2 to
78.9% am ong the Utriculari a and Arabidopsis Tonoplast
Intrinsic Proteins (TIPs), these results suggest that in
aquatic Utricularia species, nitro gen uptake, at least in
part, could be taking place in shoot (stem/leaves) and
Ibarra-Laclette et al. BMC Plant Biology 2011, 11:101
/>Page 6 of 15
that urea could be a major N source for aquatic
Utricularia species.
Elevated molecular evolutionary rates in organellar
genome blocks and individual nuclear genes
In addition to transcriptome discovery, we sequenced
large portions of the plastid and mitochondrial genomes
from Utricularia gibba as part of our Utricularia
nuclear genome seque ncing project. This has provided
us with an unprecedented opportunity to evaluate earlier
findings on elevated molecular evolutionary rates in
Utricularia organellar genomes [1-4]. From 2.2 million
U. gibba whole-genome shotgun (WGS) sequencing
reads (748 Mbp, representing more than 8 times the
estimated genome size) 76,364 high-quality reads were
identified as organellar sequences (27.6 Mbp). These
reads w ere assembled using Newbler assembler version
2.5, resulting in 228 contigs from chloroplast and 217
contigs from mitochondrial genomes with a N50 contig
size of 2,146 and 2,842 bp respectively. The largest U.
gibba chloroplast contig ( length = 22,577 bases; FTP:
corre-
sponds to part of the large single copy region (LSC;
[69,70]). Using a Multiple Genome Comparison and
Aligment Tool [ 65,66] we selected a homologous region
from 31 of 64 eudicot (Rosids and Ast erids) angiosperm
chloroplast genomes contained in an organell e genome
database [67,68], this chloroplast region encodes a total
of 28 coding genes. Removal of ambiguously aligned was
carried out using GBlocks [69], which is designed to
identify and remove highly variable regions of align-
ments where positional homology is dubious (Additional
file 13, Figure S4). The final ClustalW alignment [70]
contained 31 taxa and 8,516 nucleotide characters for
the fraction of the LSC chloroplast region. For the mito-
chondrial genome we made a similar analysis as
described above for the chloroplast sequences using
unambiguously aligned sequences (length = 4,125 bases;
FTP: />derived from a mitochondrial contig of 4,673 nucleo-
tides (Additi onal file 14, Figure S5). A total of four cod-
ing genes were identified in this partial sequence of the
U. gibba mitochondrial genome. Due to the limited
number of complete sequences of mit ochondrial gen-
omes, phylogenetic analysis was carried out using the
homologous region from six eudicot taxa.
NeighborNetphylogeneticanalysis[71]wasusedasa
simple tool to illustrate both branch length differences
among s pecies and incongruence of phylogenetic signal
within data sets. Analysis of the large block of chl oro-
plast LSC sequence revealed that Utricularia gibba has
the longest terminal branch of any eudicot sampled
(Figure 3A). Although this relative rate difference is
slight, it is statistically significant at P <0.05(using
several likelihood models; see Methods) with respect to
Jasminum (jasmine), the sister genus of U. gibba,as
analyzed using Coffe a (coffee) as outgroup (Figure 3A).
Elevated evolut ionary rate in U. gibba is, however, strik-
ing in a rate-sensitive UPGMA cluster analysis [72] of
the same d ata (Figure 3B). UPGMA assumes a molecu-
lar clock operating equally among all species, so devia-
tion from this requirement in terms of obtained branch
lengths, and possibly also well-established phylogenetic
relationships, provides a useful test for rate asymmetries.
Accordingly, the plastid DNA UPGMA tree places
U. gibba erroneously, separate from asterid taxa to
which this species is assuredly most closely related
(Figure 3B). For the mitochondrial genome, Neighbor-
Net analysis (Fi gure 4A), relative rate tests (Utricularia
vs. Nicotiana,outgroupVit is ; P << 0.001 across several
tests), and UPGMA clustering (Figure 4B) of the avail-
able data all demonstrate an enormously elevated substi-
tution rate in Utricularia.
Given the availability of considerable nuclear tran-
scriptome sequence, we also assayed molecular evolu-
tionary rates across a random set of 100 genes
homologous to Conserved Orthologous Loci (COS II)
available for seve ral other asterid species [73-75]. Here,
we found that U. gibba displayed the longest branch in
NeighborNet analysis - and therefore the highest relative
molecular evolutionary rate - for 92% of these loci. Con-
sistently, UPGMA analyses identified the U. gibba
branch as longest in 90% of the 100 loci (all 100 data
sets, networks and trees are available via FTP: http://
www.langebio. cinvestav.mx/ut ricularia/). A concatenated
super-matrix comprising all gene sequences for all spe-
cies produced expected NeighborNet (Figure 5A) and
UPGMA (Figure 5B) results, with U. gibba displaying an
elevated molecular evolutionary rate that was significant
at P << 0.001 with respect to Coffea arabica (outgroup
Capsicum annuum, using the same likelihood models as
for the organellar genomes).
Carbon, respiration, and Reactive Oxygen Species
Analysis of the U. gibba choloroplast and mitochondrial
genomes shows that nucleotide substitution rates are
elevated in U. gibba. These alterations in substitution
rates have been proposed to be related to specific
changes in oxidative phosphorylation and excess pro-
duction of reactive oxygen species (ROS; see below).
Therefore, we analyzed the functiona l categorization of
shoot and trap PEG to determine whether they provide
molecular support for ox-phos and ROS related pro-
cesses. As previously mentioned, among the promin ent
over-represented MIPS category identified in shoot and
trap PEG was “ Energy” . In shoot PEG the “ Energy”
MIPS category is represented by ‘photos ynthesis’ and
‘ energy con version and regeneration’ subcategories,
Ibarra-Laclette et al. BMC Plant Biology 2011, 11:101
/>Page 7 of 15
while in trap PEG, the “Energy ” category is represented
by ‘respiration’ and ‘electron transport and membrane-
associated energy conservation’ subcategories. Corre-
spondingly, Utricularia bladders have immensely greater
respiration, while exhibiting far lower photosynthetic
rates than vegetative tissues [76,77]. Interesting in con-
nection, the ‘oxygen and radical detoxification’ subcate-
gory was prominent among stress PEG.
The respiratory chain of mitochondria, normally
coupled to electron transport, is one of the main means
by which cells gain their energy for performing various
activities. Electron tra nsport drives a chemiosmotic
pump that causes sequestration of protons in the mito-
chondrial intermembrane space, where after th ese pos i-
tive charges enter the mitochondrial lumen to catalyze
the phosphorylation of adenosine diphosphate into ATP.
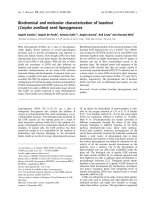
Figure 3 A long contig of the plastid genome shows an elevated substitution rate in Utricularia gibba. Although this phenomenon is
only slightly observable in NeighborNet phylogenetic analysis (A), it is remarkable in a UPGMA phenogram (B), which assumes clock-like rates.
The data analyzed are for eudicots only.
Ibarra-Laclette et al. BMC Plant Biology 2011, 11:101
/>Page 8 of 15
The rate limiting enzyme of oxidative phosphorylation is
cytochrome c oxidase (COX), positioned one step before
ATP synthase. Previous reports showed tha t, due to
changes in specific amino acid positions fixed under
positive Darwinian selection, COX structure and func-
tion might be altered in Utricularia and some species of
its sister genus, Genlisea (the corkscrew plant).
Hypotheses have been proposed whereby specific
changes in these residues [two contiguous cysteines (C)]
could alter the dissociation kinetic s between COX and
cytochromec[78]andpossiblyproduceaconforma-
tional change at the active site [79]. It has been sug-
gested that the latter process could reversibly decouple
proton pumping from electron transport [79]. In this
Figure 4 A portion of the mitochondrial genome shows a dramatically elevated nucleotide substitution rate in Utricularia gibba.Both
the NeighborNet phylogenetic analysis (A) and UPGMA phenogram (B) show Utricularia on a very long external branch.
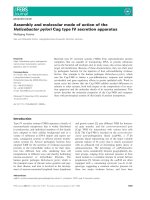
Figure 5 A super-matrix of 100 distinct nuclear gene alignments from the Conserved Ortholog Set (COS) database demonstrates
Utricularia gibba to have the highest relative substitution rate among analyzed asterid species. Both NeighborNet analysis (A) and a
UPGMA test (B) clearly show this asymmetry.
Ibarra-Laclette et al. BMC Plant Biology 2011, 11:101
/>Page 9 of 15
way, the intermembrane space could be likened to a
capacitor holding enormous positive charge until ATP
was needed, e.g., to pump water out of traps after their
firing. However, storing large quantities of protons
could have consequences in the formation of reactive
oxygen species (ROS) that could be produced by back-
up and leakage of electron transport [6]. It then fol-
lows that the mutagenic action of enhanced ROS pro-
duction (with error- prone repair) may, as a common
cause, explain both the high rates of nucleotide substi-
tution observed in Utricularia (above) and the dynamic
evolution of genome size in Lentibulariaceae, the latter
via non-homologous recombination at double strand
breaks [5].
Using the FunCat database and MIPS categorization
we identified a total of 18 annotated U. gibba UT
(homologous to 15 Arabidopsis unique proteins)
grouped into the “DNA recombination and DNA repair”
MIPS subcategory, all of them considered as ubiqui-
tously expressed genes (Additional file 15, Table S10).
With regard to the “ oxygen and radical detoxification”
subcategory, 159 U. gibba UT corresponding, at most,
to 91 Arab idopsis unique pro teins, some of w hich
(44.7%) were also expressed ubiquitously (Additional file
16, Table S11). This MIPS subcategory includes 35 pro-
teins involved in glutathione conjugation and peroxidase
reactions, 6 proteins involved in superoxide metabolism
and one catalase. Again, expression of these DNA repair
and ROS detox processes is neither trap-specific nor
trap-overexpressed, but ubiquitous. However, ROS pro-
duction need not be evenly distributed among organs,
which could alter net repair/detox capacity in living
tissues.
In order to evaluate ROS content in traps versus vege-
tative organ cells, U. gibba plants were stained with the
H
2
O
2
specific dye 3, 3-Diaminobenzidine (DAB). DAB
staining was detected in most cells of vegetative organs
(stem/leaves and traps) with a considerably higher inten-
sity in the t raps (Figure 6), corresponding well to the
much greater respiration observed in these structures by
Adamec 2006 [77]. Given the ubiquitous expression pat-
terns in all Utricularia organs of genes encoding detoxi-
fication enzymes, lower relative ROS detoxification is
expected in traps and therefore greater toxic effects
such as mutagenesis. It is therefore certainly possible
that the observed elevated nucleotide substitution rates
in Utricularia organellar genomes and nuclear genes are
due to ROS overprodu ction in th e face of net less effec-
tive DNA repair. Although the null expectation would
be that all nuclear genes should accrue ROS-mediated
mutations equally and randomly, 8% out of the 100
genes surveyed did not show evidence for an Utricu-
laria-specific rate increase. Analytical error and/or dif-
ferential evolutionary conservation of gene sequences in
different species could explain this small disparity from
100% expectation. Future analyses of nonsynonymous
vs. synonymous substitution rates in these cases might
reveal the latter phenomenon. With regard to nuclear
genome dynamism, detailed studies, e.g., searches for
molecular signatures of rampant double strand break
repair, m ust await a high-quality sequence of the entire
Utricularia gibba genome.
Conclusions
The Utricularia transcriptome provides a detailed geno-
mic window into processes occurring in a carnivorous
plant. It contains a deep representation of the complex
metabolic pathways that characterize a putative minimal
plant genome, permitting its use as a source of genomic
information to explore the structural, functional, and
evolutionary diversity of the genus. Vegetative shoots
and traps are the most similar organs by functional clas-
sification of their transcriptome, the latter expressing
hydrolytic enzymes for prey digestion that were pre-
viously thought to be encoded by bacteria. Supporting
physiological research, traps significantl y overexpress
genes involved in respiration. Other expression data
suggests that whereas nitrogen uptake could in part take
place in vegetative parts, phosphate uptake might occur
mainly in traps. Expression of DNA repair and ROS
detoxification enzymes may be indicat ive of respo nse to
increased respiration. Finally, evidence from the bladder-
wort transcriptome, direct measurement of ROS in situ,
and cross-species comparisons of organellar genomes
and multiple nuclear genes supports a hypothesis that
Figure 6 Detection of Reactive oxygen species (ROS) in
Utricularia. ROS patterns of Utriculara gibba plants stained with
H
2
O
2
specific dye 3, 3-Diaminobenzidine (DAB). Photographs are
representative of at least 10 stained plats. Bars = 100 μm.
Ibarra-Laclette et al. BMC Plant Biology 2011, 11:101
/>Page 10 of 15
increased nucleotide substituti on rates throughout the
plant may be due to the mutagenic action of amplified
ROS production.
Methods
Plant material and treatments
Utricularia gibba plants were collected at the Umécuaro
dam (Michoacán-México), and propagated outdoors in
plastic containers (area 0.1 m2, 10 L), filled to a depth
of 12.5- 15 cm with water from the dam; the water level
maintained by addition of soft tap water. Tissue was col-
lected from shoot-like structures, traps and inflores-
cences containing 1 to 4 flowers.
To obtain evidence for the expression of as many
genes as possible, additional sets of U. gibba plants (3 to
5 individuals) were transferred into a sterile 50 mL
Erlenmeyer flask (containing 25 ml of sterile water) and
then exposed to different physiological stress conditions
(light, temperature and water deprivation). For light
responses, U. gibba plants were treated in continuous
darkness for 48 hrs and then exposed to constant light
(100 μmol m
-2
sec
-1
). Samples were collected at 4, 8, 12
and 24 hrs; as a control U. gibba plants were kept in the
dark and collected at the same time points. For low
temperature responses, U. gibba plants were transferred
to a cold room at 5°C with constant light (approximately
50 μ;mol m
-2
sec
-1
) for 48 hrs. Samples were collected at
4, 8, 12, 24 and 48 hrs. Drought-stress treatments (water
deprivation) consisted of removing the water from flasks
where after U. gibba plants were kept in controlled
environment chambers at 24°C under constant light (50
μmol m
-2
sec
-1
). Samples were collected at 4, 8, 12, 24
and 48 hrs. As a control for low temperature and
drought-stress treatments U. gibba plants were kept in
water in controlled environment chambers at 24°C
under constant light (50 μmol m
-2
sec
-1
). Additionally,
we collected traps, shoots (considering these as stem
with life-like structures) and inflorescences from
U. gibba plants with the aim of exploring and compar-
ing the transcriptome of these organs. All samples col-
lected were f rozen immediately in liquid n itrogen and
stored at -70°C until used.
cDNA library construction
Total RNA was extracted from U. gibba organs or whole
plants exposed to the different stress conditio ns using
TRIZOL (Invitrogen), ground with a mortar and pestle
in liquid nitrogen. In the case of plants subjected to
stress, 5 μg of RNA from each experimental condition
was pooled to obtain a single RNA sample. First a nd
second strand cDNA synthesis was performed with 3 μg
of the total RNA mixture using Message Amp-II kit
(Ambion) following the manufacturers recommenda-
tions. In the case of the three organs (traps, shoots and
inflorescences), each sample was treated separately.
10-12
ng of synthesized cDNA was amplified by in vitro
transcription and the resulting 70-90 μgofantisense
RNA (aRNA) was pur ified using Qiagen RNA easy col-
umns (Qiagen). A second round of cDNA synthesis was
performed using the mRNA as template (20 μg). cDNA
synthesis was performed as described above except that
random primers (mostly hexamers) were used at the
first strand synthesis stage. This procedure yielded
approximately 10 μg of cDNA that was purified using
the DNA Clear Kit for cDNA purification (Ambion).
cDNA was then treated with Ampure magnetic particles
(Agencourt, Beckman Coult er) to obtain fragments of
200 - 700 pb.
454 cDNA sequencing and assembly
Approximately 10 μg of sheared cDNA was used for 454
sequencing. The cDNA sample was end repaired and
adapter ligated according to the manufacturer’sinstruc-
tions. Streptavidin bead enrichment, DNA denaturation
and emulsion PCR were also performed according to
described procedures [80]. Typical o utput from a 4.5-h
run of the GSFLX sequencer is around 75 Mb, compris-
ing roughly 300,000 sequence reads averaging c.250bp.
Two FLX pyrosequencing runs were performed (the
pico-titer plate was divided in two sectors), 1/2 run
from StsL (cDNA pool obtained from U. gibba plants
exposed to multiple physiological stress condition; stress
Library), 1/2 run for ShtL (s hoots library), 1/2 run for
FlwL Inflorescences library) and 1/2 run for TrpL (utri-
cles or traps Library). A total of 926,897 reads were gen-
erated (258,457 for FlwL, 234,963 for ShtL, 14 0,507 for
StsL and 292,970 for TrpL) with an estimated average
size of 200.1 8 bases representing a total of 185.55 Mpb.
Reads were masked using the SeqClean software pipe-
line [83] to eliminate sequence regions that would cause
incorrect assembly. Targets for masking include poly
A/T tails, ends rich in Ns (undetermined bases) and low
complexity sequences. To carry out the assembly pro-
cess, 817,792 masked reads (88.23% of total, w ith a
minimum size of 100 bp) were considered. Masked read
sequences were pairwise compared and grouped into
clusters, based on shared sequence similarity . As a con-
sequence, the clusters obtained comprise reads most
likely derived from the same mRNA. Each cluster was
then assembled into one or more contigs, which were
derived from multiple read alignments. T he clustering
was performed using megablast [81] and the resulting
clusters w ere then assembledusingtheCAP3assembly
program [82]. Contigs within a cluster shared at least
90% identity within a window of 40 nucleotides. The
comb ination of cont igs and singletons are referred to as
unique transcripts (UT; 16,551 contigs and 95,873 sin-
gletons respectively). Files containing sequence reads
Ibarra-Laclette et al. BMC Plant Biology 2011, 11:101
/>Page 11 of 15
andqualityscoresweredepositedintheShortRead
Archive of the National Center for Biotechnology Infor-
mation (NCBI) [Accession number SRP005297].
Annotation of U. gibba UT
BLASTx similarity searches (e-value 10
-5
,bitscore≥ 45)
against proteins reference d in the RefSeq database [25]
from 9 complete plant genomes [Arabidopsis thal iana,
Populus trichocarpa, Ricinus communis, Vitis v inifera
(eudicots), Oryza sativa, Sorghum bicolor (monocots),
Physomitrella patens (moss), Chlamydomonas reinhardtii,
and Ostreococcus lucimar inas (green algae)] were per-
formed to annotate the U. gibba UT. We used the
Arabidopsis protein annotation to define homologous
genes in U. gibba because these annotations are more
refi ned than those from other species. The UT were also
assigned to functional categories using the Kyoto Encyclo-
pedia of Genes and Genomes (KEGG) [83-85] and
Enzyme Commission (EC) numbers [86] were associated.
Expression profile analysis of U. gibba transcriptome
Transcripts appearing more than once in the cDNA
libraries (FlwL, ShtL, TrpL a nd StsL) were selected for
in silico expression analysis after quantile normalization
and statistical testing [42,43]. In brief, this method
allows the comparison of gene expression among any
number of libraries in order to identify differentially
expressed genes. The method uses a single statistical
test to describe the extent to which a gene is differen-
tially expressed between libraries by a log likelihood
ratio statistic that trends asymptotically to a c
2
distribu-
tion [43]. Results were visualized using GeneSpring GX
7.3.1 software (Agilent Technologies
®
).
Phylogenetic, cluster, and molecular rate analyses
Concatenated blocks of plastid and mitochondrial DNA
genome s (defined using Gblocks [75]) and nuclear gene
sequences were analyzed using NeighborNet [71] and
UPGMA [72] in the SplitsTree4 package [87]. The 100
randomly chosen nuclear gene data sets were obtained
by alignment (using MUSCLE [88] against translated
amino acids) of Utricularia gibba cDNA contigs and
Arabidopsis gene sequences to asterid orthologs avail-
able in the COS II database. For phylogenetic analysis,
the LogDet distance [89] was used as a standard model-
based correction t hroughout due to its robustness
against base composition bias, which we empirically
observed using a diagnostic utility in SplitsTree4. Rela-
tive substitution rate differences were calculated using
HyPhy [90] under several models (F81 with f ixed rates,
and F84 with fixed rates, general time reversible either
with local parameters fixed, with global parameters, or
with global parameters, gamma distribution and 4 rate
classes). P values are reported as less than the largest
value obtained under the different models.
Functional classification of differentially expressed genes
Functional gene classification was performed according
to the Functional Catalogue [47,48]. The hypergeometric
method with Bonferroni correction was used for the
analysis with a P-value cutoff of 0.01.
qRT-PCR
Primer design (Tm, 60-65°C) was performed in the
Primer3 v.0.4.0 web tool [91]. cDNA templates for PCR
amplification were prepared using reverse specific primers
for eac h ge ne evaluated, and treated with S uperScript III
reverse transcriptase (Invitrogen) according to the manu-
facturer’s instructions. Each reaction contained cDNA
template fr om 10 μg total RNA, 1× SYBR Green PCR
Master Mix (Applied Biosystems) and 500 μMforward
and reverse primers. Real-time PCR was performed in an
ABI PRISM 7500 sequence detection system (Applied Bio-
systems) under the following thermal cycling conditions:
10 min at 95°C fol lowed by a total of 40 cycles of 30 s at
95°C, 30s min at 65°C and 40s at 72°C. For qRT-PCR, rela-
tive transcript abundance was calculated and no rmalized
with respect to ACTIN tr anscrip t levels . All calculatio ns
and analyses were performed using ABI 750 0 Sof tware
v2.0.1 (Applied biosystems) and the 2
-ΔΔCt
method [92].
Amplification efficiency (0.92 to 1.01) for the primer sets
was determined by amplification of a cDNA dilution series
(1:5). Specificity of the RT-PCR products was followed by
a melting curve analysis with continual fluorescence data
acquisition during the 65-95°C melt.
ROS Detection
For H
2
0
2
localization, the DAB staining method was
performed as described by Orozco and Ryan (1999,
[93]) and the stained U. gibba plants were cleared by
the method described by Malamy and Benfey (1997,
[94]) and analyzed with an SZH10 stereomicroscope
(Olympus).
Additional material
Additional file 1: Table S1 - U. gibba UT annotated by searching for
sequences similarities using BLASTx (e-value ≤10-05 and a bit score
≥ 45) and proteins data bases from Arabidopsis thaliana, Populus
trichocarpa, Ricinus communis, Vitis vinifera (dicotyledon plants),
Oryza sativa, Sorghum bicolor (monocotyledon plants),
Physcomitrella patens (moss), Chlamydomonas reinhardtii, and
Ostreococcus lucimarinuas (green algae)
Additional file 2: Figure S1 - Metabolic pathways represented in the
U. gibba unique transcripts (UT) set. (A) Global metabolism map
constructed combining existing pathway maps and corresponding genes
referenced in the KEGG database for Plants (black lines). (B) Global
metabolism map represented by the U. gibba UT (blue lines). (C) Overlap
Ibarra-Laclette et al. BMC Plant Biology 2011, 11:101
/>Page 12 of 15
comparison of the KEGG metabolic global map of flowering plants to
the metabolic map represented in U. gibba UT.
Additional file 3: Table S2 - Gene numbers comparison of TF
families members indentified in U. gibba with some vascular plants
(Arabidosis thaliana, Populus trichocarpa and Oryza sativa (indica/
japonica)).
Additional file 4: Table S3 - Expression profile matrix of U. gibba
genes. Reads-counts (raw and normalized) for every specific-
transcriptome (FlwL; Inflorescense, ShtL; shoot, TrpL; Traps and StsL;
stressed plants) merged into each one of the 16,551 contigs.
Additional file 5: Table S4 - Preferentially Expressed Genes (PEG) in
U. gibba organ specific.
Additional file 6: Table S5 - Non organ-specific genes of U. gibba
plants (Ubiquitous).
Additional file 7: Table S6 - Stress responsive genes identified in U.
gibba plants.
Additional file 8: Table S7 - Functional categories over-represented
in physiological stress conditions (StsL), inflorescense (FlwL), shoot
(ShtL) and traps (TrpL) U. gibba PEGs. Categorization of U. gibba UT
was obtained according to the MIPS classification using FunCat database.
Additional file 9: Figure S2 - Validation of PEGs by qRT-PCR.
Expression patterns of APETALA1, APETALA3, PISTILLATA, AGAMOUS,
SEPALATA3, CLAVATA1, MYB21, MYB24, RBCS-1B, SBPase, a-glucosidase,
ß-hexosaminidase, aminopeptidase, acid phosphatase and ß-glucosidase
are presented as obtained with 454 sequencing (A) and qRT-PCR (B).
Correlation of expression levels as obtained from 454 sequencing with
those obtained with qRT-PCR (C).
Additional file 10: Table S8 - U. gibba UT annotated as homologous
Arabidopsis Pi transporters.
Additional file 11: Table S9 - U. gibba UT annotated as homologous
Arabidopsis genes involved in Nitrate assimilation pathway.
Additional file 12: Figure S3 - Alignment of aa sequences of
Arabidopsis a- and g- Tonoplast Intrinsic Proteins (AT3G16240,
AT2G36830, respectively) previously characterized as urea
transporters [63]and homologous U. gibba UT identified as shoot
(stem/leaves) PEGs. ‘NPA’ boxes, which are typical for plant TIPs, are
highlighted by a box with discontinuous red line.
Additional file 13: Figure S4 - Fraction of U. gibba LSC chloroplast
region used in phylogenetic analysis. (A) Plastid genome comparison
of two closely related species (Solanum lycopersicum and Jasminum
nudiflorum) and the homologous region of the Utricularia. gibba LSC
region.
(B) Plastid genes identified in this region. (C) Non-ambiguously-
aligned region (blocks) used in phylogenetic analysis.
Additional file 14: Figure S5 - U. gibba mitochondrial region used in
phylogenetic analysis. (A) Mitochondrial genome comparison of
Arabidopsis thaliana, Brassica napus, Carica papaya, Nicotianan tabacum
and Vitis vinifera and the homologous region from Utricularia gibba. (B)
Mitochondrial genes identified in this region. (C) Non-ambiguously-
aligned region (blocks) used in phylogenetic analysis.
Additional file 15: Table S10 - U. gibba UT annotated as
homologous Arabidopsis genes involved in DNA repair system.
Additional file 16: Table S11 - U. gibba UT annotated as
homologous Arabidopsis genes involved in ROS detoxification
system.
List of Abbreviations
UT: Unique Transcripts; PEG: Preferentially expressed genes; TrpL: cDNA
library generated from U. gibba traps; FlwL: cDNA library generated from U.
gibba inflorescences; ShtL: cDNA library generated from U. gibba shoots
(stem/leaves); StsL: cDNA library generated from whole plants subjected to
multiple physiological stress condition; ROS: Reactive Oxygen Species
Acknowledgements
We wish to thank Daniel Rodríguez-Leal for his valuable discussion on
phylogenetic analysis. We also thank Octavio Martínez de la Vega for his
assistance in the diversity and specialization analysis through information
theory, and Araceli Fernández-Cortes for her assistance with bioinformatics
analysis. Special thanks goes to Beatriz Jiménez-Moraila, Verenice Ramírez-
Rodríguez and their colleagues for sequencing services. Finally, we thank the
members of the ‘laboratorio de servicios genómicos’ of LANGEBIO,
CINVESTAV for their help. We also thank the anonymous reviewers for their
positive and relevant comments, which improved the quality of this
manuscript. EIL is indebted to CONACyT (Mexico) for a PhD fellowship.
Author details
1
Laboratorio Nacional de Genómica para la Biodiversidad, Centro de
Investigación y de Estudios Avanzados del Instituto Politécnico Nacional,
36821 Irapuato, Guanajuato, México.
2
Department of Biological Sciences,
University at Buffalo, Buffalo, New York 14260, USA.
Authors’ contributions
EIL performed assembling, annotation, database construction, statistical
analysis and manuscript writing. VAA contributed to data analysis,
phylogenetic analysis, drafting and editing of the manuscript. CAPT and
MJOE carried out RNA extractions and cDNA synthesis. CAPT also
participated in the ROS staining experiments. FMZH performed qRT-PCR
experiments. AHE and LHE conceived of the project and were responsible
for directing all of the research activities, and also have assisted in the
writing of the manuscript. All authors have read and approved the final
submitted version of the manuscript.
Received: 18 January 2011 Accepted: 3 June 2011
Published: 3 June 2011
References
1. Jobson RW, Albert VA: Molecular Rates Parallel Diversification Contrasts
between Carnivorous Plant Sister Lineages. Cladistics 2002, 18(2):127-136.
2. Müller K, Borsch T, Legendre L, Porembski S, Theisen I, Barthlott W:
Evolution of Carnivory in Lentibulariaceae and the Lamiales. Plant Biology
2004, 6(04):477-490.
3. Müller K, Borsch T: Phylogenetics of Utricularia (Lentibulariaceae) and
molecular evolution of the trnK intron in a lineage with high
substitutional rates. Plant Syst Evol 2005, 250(1):39-67.
4. Müller K, Borsch T, Legendre L, Porembski S, Barthlott W: Recent Progress
in Understanding the Evolution of Carnivorous Lentibulariaceae
(Lamiales). Plant Biology 2006, 8(06):748-757.
5. Greilhuber J, Borsch T, Müller K, Worberg A, Porembski S, Barthlott W:
Smallest Angiosperm Genomes Found in Lentibulariaceae, with
Chromosomes of Bacterial Size. Plant Biology 2006, 8(06):770-777.
6. Albert VA, Jobson RW, Michael TP, Taylor DJ: The carnivorous bladderwort
(Utricularia, Lentibulariaceae): a system inflates. Journal of Experimental
Botany 2010, 61(1):5-9.
7. Taylor PG, The genus Utricularia L: a taxonomical monograph. London: Her
Majesty’s Stationery Office; 1989.
8. Plachno BJ, Swiatek P: Unusual embryo structure in viviparous Utricularia
nelumbifolia, with remarks on embryo evolution in genus Utricularia.
Protoplasma 2010, 239(1):69-80.
9. Jobson RW, Morris EC: Feeding ecology of a carnivorous bladderwort
(Utricularia uliginosa, Lentibulariaceae). Austral Ecology 2001,
26(6):680-691.
10. Richards J: Bladder function in Utricularia purpurea
(Lentibulariaceae): is carnivory importantż. American Journal of
Botany 2001, 88(1):170-176.
11. Lollar AQ, Coleman DC, Boyd CE: Carnivorous pathway of phosphorus
uptake in Utricularia inflata. Archiv für Hydrobiologie 1971, 69:400-404.
12. Friday L, Quarmby C: Uptake and translocation of prey-derived 15N and
32P in Utricularia vulgaris L. New Phytologist 1994, 126(2):273-281.
13. Ellison AM, Gotelli NJ: Energetics and the evolution of carnivorous plants-
Darwin’s‘most wonderful plants in the world’. Journal of
Experimental Botany 2009, 60(1):19-42.
Ibarra-Laclette et al. BMC Plant Biology 2011, 11:101
/>Page 13 of 15
14. Sirová D, Borovec J, Santruckova H, Santrucek J, Vrba J, Adamec L:
Utricularia carnivory revisited: plants supply photosynthetic carbon to
traps. Journal of Experimental Botany 2010, 61(1):99-103.
15. Sirová D, Borovec J, Cerná B, Rejmánková E, Adamec L, Vrba J: Microbial
community development in the traps of aquatic Utricularia species.
Aquatic Botany 2009, 90(2):129-136.
16. Adamec L: Oxygen Concentrations Inside the Traps of the Carnivorous
Plants Utricularia and Genlisea (Lentibulariaceae). Annals of Botany 2007,
100(4):849-856.
17. Sirová D, Adamec L, Vrba J: Enzymatic activities in traps of four aquatic
species of the carnivorous genus Utricularia. New Phytologist 2003,
159(3):669-675.
18. Plachno BJ, Adamec L, Lichtscheidl IK, Peroutka M, Adlassnig W, Vrba J:
Fluorescence Labelling of Phosphatase Activity in Digestive Glands of
Carnivorous Plants. Plant Biology 2006, 8(6):813-820.
19. Wicker T, Schlagenhauf E, Graner A, Close T, Keller B, Stein N: 454
sequencing put to the test using the complex genome of barley. BMC
Genomics 2006, 7(1):275.
20. Huse S, Huber J, Morrison H, Sogin M, Welch D: Accuracy and quality of
massively parallel DNA pyrosequencing. Genome Biology 2007, 8(7):R143.
21. Weber APM, Weber KL, Carr K, Wilkerson C, Ohlrogge JB: Sampling the
Arabidopsis Transcriptome with Massively Parallel Pyrosequencing.
Planat Physiology 2007, 144(1):32-42.
22. Jones-Rhoades MW, Borevitz JO, Preuss D: Genome-Wide Expression
Profiling of the Arabidopsis Female Gametophyte Identifies Families of
Small, Secreted Proteins. PLoS Genet 2007, 3(10):e171.
23. Novaes E, Drost D, Farmerie W, Pappas G, Grattapaglia D, Sederoff R,
Kirst M: High-throughput gene and SNP discovery in Eucalyptus grandis,
an uncharacterized genome. BMC Genomics 2008, 9(1):312.
24. Vega-Arreguin J, Ibarra-Laclette E, Jimenez-Moraila B, Martinez O, Vielle-
Calzada J, Herrera-Estrella L, Herrera-Estrella A: Deep sampling of the
Palomero maize transcriptome by a high throughput strategy of
pyrosequencing. BMC Genomics 2009, 10(1):299.
25. Referece Sequences Database (Planta). [ />release/plant/].
26. Myers EW, Sutton GG, Delcher AL, Dew IM, Fasulo DP, Flanigan MJ,
Kravitz SA, Mobarry CM, Reinert KHJ, Remington KA, et al: A Whole-
Genome Assembly of Drosophila. Science 2000, 287(5461):2196-2204.
27. Miller JR, Delcher AL, Koren S, Venter E, Walenz BP, Brownley A, Johnson J,
Li K, Mobarry C, Sutton G: Aggressive assembly of pyrosequencing reads
with mates. Bioinformatics 2008, 24(24):2818-2824.
28. KEGG:
Kyoto Enclyclopedia of Genes and Genomes.[ome.
jp/kegg/].
29. Navigation tool to explore the KEGG global maps. [ />kegg/atlas/].
30. Riechmann JL, Heard J, Martin G, Reuber L, Z C, Keddie J, Adam L,
Pineda O, Ratcliffe OJ, et al: Arabidopsis Transcription Factors: Genome-
Wide Comparative Analysis Among Eukaryotes. Science 2000,
290(5499):2105-2110.
31. Qu L-J, Zhu Y-X: Transcription factor families in Arabidopsis: major
progress and outstanding issues for future research. Current Opinion in
Plant Biology 2006, 9(5):544-549.
32. Richardt S, Lang D, Reski R, Frank W, Rensing SA: PlanTAPDB, a Phylogeny-
Based Resource of Plant Transcription-Associated Proteins. Plant
Physiology 2007, 143(4):1452-1466.
33. Guo A, He K, Liu D, Bai S, Gu X, Wei L, Luo J: DATF: a database of
Arabidopsis transcription factors. Bioinformatics 2005, 21(10):2568-2569.
34. Database of Arabidopsis Transcription Factor. [ />35. Zhu Q-H, Guo A-Y, Gao G, Zhong Y-F, Xu M, Huang M, Luo J: DPTF: a
database of poplar transcription factors. Bioinformatics 2007,
23(10):1307-1308.
36. Database of Poplar Transcription Factors. [ />37. Montiel G, Gantet P, Jay-Allemand C, Breton C: Transcription Factor
Networks. Pathways to the Knowledge of Root Development. Plant
Physiology 2004, 136(3):3478-3485.
38. Marioni JC, Mason CE, Mane SM, Stephens M, Gilad Y: RNA-seq: An
assessment of technical reproducibility and comparison with gene
expression arrays. Genome Research 2008, 18(9):1509-1517.
39. Mortazavi A, Williams BA, McCue K, Schaeffer L, Wold B: Mapping and
quantifying mammalian transcriptomes by RNA-Seq. Nat Meth 2008,
5(7):621-628.
40. Bullard J, Purdom E, Hansen K, Dudoit S: Evaluation of statistical methods
for normalization and differential expression in mRNA-Seq experiments.
BMC Bioinformatics 2010, 11(1):94.
41. R software version 2.1.1. [].
42. Irizarry RA, Bolstad BM, Collin F, Cope LM, Hobbs B, Speed TP: Summaries
of Affymetrix GeneChip probe level data. Nucleic Acids Research 2003,
31(4):e15-e15.
43. Stekel DJ, Git Y, Falciani F: The Comparison of Gene Expression from
Multiple cDNA Libraries. Genome Research 2000, 10(12):2055-2061.
44. Martínez O, Reyes-Valdés MH: Defining diversity, specialization, and gene
specificity in transcriptomes through information theory.
Proceedings of
the National Academy of Sciences 2008, 105(28):9709-9714.
45. Juniper B, Robins R, Joel D: The carnivorous plants. London: Academic
Press; 1989.
46. Harms S: Prey selection in three species of the carnivorous aquatic plant
Utricularia (bladderwort). Archiv für Hydrobiologie 1999, 146:449-470.
47. Ruepp A, Zollner A, Maier D, Albermann K, Hani J, Mokrejs M, Tetko I,
Güldener U, Mannhaupt G, Münsterkötter M, et al: The FunCat, a
functional annotation scheme for systematic classification of proteins
from whole genomes. Nucleic Acids Research 2004, 32(18):5539-5545.
48. MIPS Functional Catalogue Database. [mholtz-muenchen.
de/proj/funcatDB/].
49. Raghothama KG: Phosphate transport and signaling. Current Opinion in
Plant Biology 2000, 3(3):182-187.
50. Gierth M, Mäser P: Potassium transporters in plants - Involvement in K+
acquisition, redistribution and homeostasis. FEBS Letters 2007,
581(12):2348-2356.
51. Lebaudy A, Véry A-A, Sentenac H: K+ channel activity in plants: Genes,
regulations and functions. FEBS Letters 2007, 581(12):2357-2366.
52. Kibriya S, Iwan Jones J: Nutrient availability and the carnivorous habit in
Utricularia vulgaris. Freshwater Biology 2007, 52(3):500-509.
53. Daram P, Brunner S, Persson BL, Amrhein N, Bucher M: Functional analysis
and cell-specific expression of a phosphate transporter from tomato.
Planta 1998, 206(2):225-233.
54. Liu C, Muchhal US, Uthappa M, Kononowicz AK, Raghothama KG: Tomato
Phosphate Transporter Genes Are Differentially Regulated in Plant
Tissues by Phosphorus. Plant Physiology 1998, 116(1):91-99.
55. Chiou T-J, Liu H, Harrison MJ: The spatial expression patterns of a
phosphate transporter (MtPT1) from Medicago truncatula indicate a role
in phosphate transport at the root/soil interface. The Plant Journal 2001,
25(3):281-293.
56. Karthikeyan AS, Varadarajan DK, Mukatira UT, D’Urzo MP, Damsz B,
Raghothama KG: Regulated Expression of Arabidopsis Phosphate
Transporters. Plant Physiology 2002, 130(1):221-233.
57. Mudge SR, Rae AL, Diatloff E, Smith FW: Expression analysis suggests
novel roles for members of the Pht1 family of phosphate transporters in
Arabidopsis. The Plant Journal 2002, 31(3):341-353.
58. Schunmann PHD, Richardson AE, Vickers CE, Delhaize E: Promoter Analysis
of the Barley Pht1;1 Phosphate Transporter Gene Identifies Regions
Controlling Root Expression and Responsiveness to Phosphate
Deprivation. Plant Physiology 2004,
136(4):4205-4214.
59. Lloyd FE: The Carnivorous Plants. MS, USA: Waltham, Chronica Botanica
Company 1942.
60. Liu K-H, Huang C-Y, Tsay Y-F: CHL1 Is a Dual-Affinity Nitrate Transporter
of Arabidopsis Involved in Multiple Phases of Nitrate Uptake. The Plant
Cell 1999, 11(5):865-874.
61. Li J-Y, Fu Y-L, Pike SM, Bao J, Tian W, Zhang Y, Chen C-Z, Zhang Y, Li H-M,
Huang J, et al: The Arabidopsis Nitrate Transporter NRT1.8 Functions in
Nitrate Removal from the Xylem Sap and Mediates Cadmium Tolerance.
The Plant Cell 2010.
62. Cheng-Hsun H, Shan-Hua L, Heng-Cheng H, Yi-Fang T: CHL1 Functions as
a Nitrate Sensor in Plants. Cell 2009, 138(6):1184-1194.
63. Klebl F, Wolf M, Sauer N: A defect in the yeast plasma membrane urea
transporter Dur3p is complemented by CpNIP1, a Nod26-like protein
from zucchini (Cucurbita pepo L.), and by Arabidopsis thaliana [delta]-
TIP or [gamma]-TIP. FEBS Letters 2003, 547(1-3):69-74.
64. Ellison AM, Gotelli NJ: Evolutionary ecology of carnivorous plants. Trends
in ecology & evolution 2001, 16(11):623-629.
65. Treangen T, Messeguer X: M-GCAT: interactively and efficiently
constructing large-scale multiple genome comparison frameworks in
closely related species. BMC Bioinformatics 2006, 7(1):433.
Ibarra-Laclette et al. BMC Plant Biology 2011, 11:101
/>Page 14 of 15
66. Multiple Genome Comparison Software (M-GCAT). [.
es/recerca/align/mgcat/].
67. O’Brien EA, Zhang Y, Wang E, Marie V, Badejoko W, Lang BF, Burger G:
GOBASE: an organelle genome database. Nucleic Acids Research 2009,
37(suppl 1):D946-D950.
68. The Organelle Genome Database (GOBASE). [.
umontreal.ca/].
69. Castresana J: Selection of Conserved Blocks from Multiple Alignments for
Their Use in Phylogenetic Analysis. Molecular Biology and Evolution 2000,
17(4):540-552.
70. Thompson JD, Higgins DG, Gibson TJ: CLUSTAL W: improving the
sensitivity of progressive multiple sequence alignment through
sequence weighting, position-specific gap penalties and weight matrix
choice. Nucleic Acids Research 1994, 22(22):4673-4680.
71. Bryant D, Moulton V: Neighbor-Net: An Agglomerative Method for the
Construction of Phylogenetic Networks. Molecular Biology and Evolution
2004, 21(2):255-265.
72. Sokal RR, Michener CD: A statistical method for evaluating systematic
relationships. University of Kansas Scientific Bulletin 1958, 28:1409-1438.
73. Fulton TM, Van der Hoeven R, Eannetta NT, Tanksley SD: Identification,
Analysis, and Utilization of Conserved Ortholog Set Markers for
Comparative Genomics in Higher Plants. The Plant Cell Online 2002,
14(7):1457-1467.
74. Wu F, Mueller LA, Crouzillat D, Petiard V, Tanksley SD: Combining
Bioinformatics and Phylogenetics to Identify Large Sets of Single-Copy
Orthologous Genes (COSII) for Comparative, Evolutionary and Systematic
Studies: A Test Case in the Euasterid Plant Clade. Genetics 2006,
174(3):1407-1420.
75. Conserved Ortholog Set II (COSII) markers. .
76. Knight SE: Costs of carnivory in the common bladderwort, <i>
Utricularia macrorhiza</i>. Oecologia 1992, 89(3):348-355.
77. Adamec L: Respiration and Photosynthesis of Bladders and Leaves of
Aquatic Utricularia Species. Plant Biology 2006, 8(06):765-769.
78. Jobson RW, Nielsen R, Laakkonen L, Wikström M, Albert VA: Adaptive
evolution of cytochrome c oxidase: Infrastructure for a carnivorous plant
radiation. Proceedings of the National Academy of Sciences of the United
States of America 2004, 101(52):18064-18068.
79. Laakkonen L, Jobson RW, Albert VA: A New Model for the Evolution of
Carnivory in the Bladderwort Plant (Utricularia): Adaptive Changes in
Cytochrome c Oxidase (COX) Provide Respiratory Power. Plant biol
(Stuttg) 2006, 8(06):758-764.
80. Margulies M, Egholm M, Altman WE, Attiya S, Bader JS, Bemben LA, Berka J,
Braverman MS, Chen Y-J, Chen Z et al: Genome sequencing in
microfabricated high-density picolitre reactors. Nature 2005,
437(7057):376-380.
81. Zhang Z, Schwartz S, Wagner L, Miller W: A Greedy Algorithm for Aligning
DNA Sequences. Journal of Computational Biology 2000, 7(1-2):203-214.
82. Huang X, Madan A, CAP3: A DNA Sequence Assembly Program. Genome
Research 1999, 9(9):868-877.
83. Kanehisa M, Goto S: KEGG: Kyoto Encyclopedia of Genes and Genomes.
Nucleic Acids Research 2000, 28(1):27-30.
84. Kanehisa M, Goto S, Hattori M, Aoki-Kinoshita KF, Itoh M, Kawashima S,
Katayama T, Araki M, Hirakawa M: From genomics to chemical genomics:
new developments in KEGG. Nucleic Acids Research 2006, 34(suppl 1):
D354-D357.
85. Kanehisa M, Goto S, Furumichi M, Tanabe M, Hirakawa M: KEGG for
representation and analysis of molecular networks involving diseases
and drugs. Nucleic Acids Research 2010, 38(suppl 1):D355-D360.
86. Bairoch A: The ENZYME database in 2000. Nucleic Acids Research 2000,
28(1):304-305.
87. Huson DH: SplitsTree: analyzing and visualizing evolutionary data.
Bioinformatics 1998, 14(1):68-73.
88. Edgar RC: MUSCLE: multiple sequence alignment with high accuracy and
high throughput. Nucleic Acids Research 32(5):1792-1797.
89. Lockhart PJ, Steel MA, Hendy MD, Penny D: Recovering evolutionary trees
under a more realistic model of sequence evolution. Molecular Biology
and Evolution 1994, 11(4):605-612.
90. Pond SLK, Frost SDW, Muse SV: HyPhy: hypothesis testing using
phylogenies. Bioinformatics 2005, 21(5):676-679.
91. Primer3 (v. 0.4.0). Pick primers from a DNA sequence. [.
edu/primer3/].
92. Livak KJ, Schmittgen TD: Analysis of Relative Gene Expression Data Using
Real-Time Quantitative PCR and the 2-[Delta][Delta]CT Method. Methods
2001, 25(4):402-408.
93. Orozco-Cardenas M, Ryan CA: Hydrogen peroxide is generated
systemically in plant leaves by wounding and systemin via the
octadecanoid pathway. Proceedings of the National Academy of Sciences of
the United States of America 1999, 96(11):6553-6557.
94. Malamy JE, Benfey PN: Organization and cell differentiation in lateral
roots of Arabidopsis thaliana. Development 1997, 124(1):33-44.
doi:10.1186/1471-2229-11-101
Cite this article as: Ibarra-Laclette et al.: Transcriptomics and molecular
evolutionary rate analysis of the bladderwort (Utricularia), a carnivorous
plant with a minimal genome. BMC Plant Biology 2011 11:101.
Submit your next manuscript to BioMed Central
and take full advantage of:
• Convenient online submission
• Thorough peer review
• No space constraints or color figure charges
• Immediate publication on acceptance
• Inclusion in PubMed, CAS, Scopus and Google Scholar
• Research which is freely available for redistribution
Submit your manuscript at
www.biomedcentral.com/submit
Ibarra-Laclette et al. BMC Plant Biology 2011, 11:101
/>Page 15 of 15