báo cáo khoa học: "MeRy-B: a web knowledgebase for the storage, visualization, analysis and annotation of plant NMR metabolomic profiles" potx
Bạn đang xem bản rút gọn của tài liệu. Xem và tải ngay bản đầy đủ của tài liệu tại đây (2.38 MB, 12 trang )
DATABASE Open Access
MeRy-B: a web knowledgebase for the storage,
visualization, analysis and annotation of plant
NMR metabolomic profiles
Hélène Ferry-Dumazet
1†
, Laurent Gil
1
, Catherine Deborde
2,3*
, Annick Moing
2,3
, Stéphane Bernillon
2,3
,
Dominique Rolin
4
, Macha Nikolski
5
, Antoine de Daruvar
1,5
and Daniel Jacob
1,2,3†
Abstract
Background: Improvements in the techniques for metabolomics analyses and growing interest in metabolomic
approaches are resulting in the generation of increasing numbers of metabolomic profiles. Platforms are required
for profile management, as a function of experimental design, and for metabolite identification, to facilitate the
mining of the corresponding data. Various databases have been created, including organism-specific
knowledgebases and analytical technique-specific spectral databases. However, there is currently no platform
meeting the requirements for both profile management and metabolite identification for nuclear magnetic
resonance (NMR) experiments.
Description: MeRy-B, the first platform for plant
1
H-NMR metabolomic profiles, is designed (i) to provide a
knowledgebase of curated plant profiles and metabolites obtained by NMR, together with the corresponding
experimental and analytical metadata, (ii) for queries and visualization of the data, (iii) to discriminate between
profiles with spectrum visualization tools and statistical analysis, (iv) to facilitate compound identification. It contains
lists of plant metabolites and unknown compounds, with information about experimental conditions, the factors
studied and metabolite concentrations for several plant species, compiled from more than one thousand
annotated NMR profiles for various organs or tissues.
Conclusion: MeRy-B manages all the data generated by NMR-based plant metabolomics experiments, from
description of the biological source to identification of the metabolites and determinations of their concentrations.
It is the first database allowing the display and overlay of NMR metabolomic profiles selected through queries on
data or metadata. MeRy-B is available from />Background
The set of low-molecular weight (usually < 1500 Da)
molecules of an organism, organ or tissue is referred to
as the me tabolome [1], and the comprehensive qualita-
tive and quantitative analysis of this set of molecules is
called metabolomics [2]. Metabolome analyses aim to
provide a holistic view of biochemical status at various
levels of complexity, from the whole organism, organ or
tissue, to the cell, at a given time. Metabolomics is
increasinglywidelyusedbyplantbiologists[3-6]
studying the effects of genotype and biotic or abiotic
environments [7-9] or the biochemical modifications
associated with developmental changes [10,11]. It is also
widely used by food scientists, for descriptions o f
changes in the organoleptic properties and nutritional
quality of food [12] and evaluations of food authenticity
[13]. It is also used in subs tantial equivalence studies for
genetically modified organisms [14]. Metabolomics has
also increasingly entere d into routine use in plant func-
tional genomics, in which correlations between such
biochemical information and genetic and molecular data
are improving our insight into the functions of unknown
genes [15-17]. Finally, it is emerging as a tool for the
screening of genetic resources and plant breeding
[18,19].
* Correspondence:
† Contributed equally
2
INRA, UMR 1332 Biologie du Fruit et Pathologie, Centre INRA de Bordeaux,
F-33140 Villenave d’Ornon, France
Full list of author information is available at the end of the article
Ferry-Dumazet et al. BMC Plant Biology 2011, 11:104
/>© 2011 Ferr y-Duma zet et al; licen see BioMed Central Ltd. This is an O pen Access article distributed under the terms of the Creative
Commons Attribution License ( which permits unrestricted use, distribution, and
reproduction in any medium, provided the original work is properly cited.
The chemical diversity and complexity of the plant
metabolome constitutes a real challenge, even for a
given species, because the diversity of metabolites and
their concentration ranges remains huge. It is therefore
impossible to profile all metabolite families (the list of
these families includes amino acids, organic acids, car-
bohydrates, lipids and diverse secondary metabolites,
such as phenylpropanoids, isoprenoids, terpenoids and
alkaloids) simultaneously through a single extraction
and with only one analytical technique. Most metabolo-
mics projects therefore use several analytical strategies
in parallel [17,20]. Several techniques of choice have
emerged, including g as chromatography or liquid chro-
matography coupled with mass spectrometry (GC-MS
or LC-MS) and proton nuclear magnetic resonance
spectrometry (
1
H-NMR) [21,22].
1
H-NMR and GC-MS have been applied to polar
extracts for the study of primary metabolites.
1
H-NMR
technology has been widely used as a high-throughput
technique for non targeted fingerprinting with little or
no sample preparation [23,24]. It has also been applied
to targeted profiling and the absolute quantification of
major metabolites [25], despite its relatively low sensitiv-
ity, taking advantage of its large dynamic range [22].
GC-MS is much more sensitive than
1
H-NMR and is
ideal for the detection of volatile metabolites, but high-
boili ng point metabolites require two-step derivatization
[26].
The relative quantification of a hundred hydrophilic
metabolites can be achieved, but comparisons of sets of
GC-MS metabolomics profiles obtained in different
laboratories remain difficult. For the study of secondary
metabolites, LC-MS analysis is generally the method of
choic e. Extracts are injected directly, without derivatiza-
tion. LC-MS is generally used for metabolomic profiling
[27] with relative quantification. The use of shared data-
bases is hindered by cross-compatibility problems
between spectra acquired with different LC-MS instru-
ments [28], even with two instruments of the same
model from the same manufacturer. High-resolution MS
techniques, such as FT-ICR-MS, are also used without
LC separation and are very promising for use in plant
metabolomics [29]. However, a complementary techni-
que, such as NMR, is oft en required for further charac-
terization of specific metabolome changes in terms of
structure [30]. A major advantage of
1
H-NMR is that
the profiles obtained are often comparable, even
between different instruments or different field magni-
tudes [31,32], provided that some parameters, such as
extract pH, are fixed at a constant value.
Metabolomics facilities, including those usi ng
1
H-
NMR, generate large amounts of raw, processed and
analyzed data, which must be well managed if they are
to generate useful knowledge. Various web-based
software platforms are available for managing and mak-
ing use of metabolomics data. These software platforms
include metabolite spectral databases, such as the Golm
Metabolome Database (GMD) and the Human Metabo-
lome DataBase (HMDB). The GMD [26] provides public
access to GC-MS data and peak lists for plant metabo-
lites. The HMDB [33,34] is an example of an organism-
specific database providing detailed information, includ-
ing quantificat ion and information about the spatial dis-
tribution of small metabolites in the human body. These
metabolite-ori ented platforms also provide simple query
forms for searches by mass or compound names. Stan-
dard compound libraries, such as the Biological Mag-
netic Resonance data Bank (BMRB) [35] are also useful
for metabolite identification b y NMR. Databases of this
type may be seen as knowledgebases rather than inte-
grat ed tools for data management, analysis and metabo-
lite identification. MeltDB [36] and SetupX [37], two
web-based software platforms for the systematic storage,
analysis and annotation of datasets from mass spectro-
metry (MS)-based metabolomics experiments, have
recently been implemented. However, these platforms
cannot handle NMR data. Another platform, PRIMe
[38], provides standardized measurements of metabolites
by multidimensional NMR s pectroscopy, GC-MS, LC-
MS and capillary electrophoresis coupled with MS (CE-
MS). It also provides unique tools for metabolomics,
transcriptomics and the integrated analysis of a range of
other “-omics” data. The standardized spectrum search
in PRIMe is a very useful tool, but it does not provide
information about the biologi cal context of compounds,
unlike the KNApSAcK database linking metabolites
identified by MS to species />software/knapsack-database or Phenolexplorer [39], a
bibliographic database
dedicated to the polyphenol content of food. MetaboA-
nalyst [40] is an online tool for processing high-
throughput metabolomic data from NMR and GC/LC-
MS spectra. For NMR, it allows statistical analysis of
compound concentration data obtained by quantitative
metabolic profiling or of
1
H NMR spectral signatures
(after data reduction with bucketing) for urine samples
for example. MetaboAnalyst does not handle NMR
spectra but only processed data (peak list or buckets
list) in tabular csv files. Each of these applications is
useful, but none constit utes a complete tool for mana-
ging, analyzing and sharing plant NMR metabolomics
data.
Given the types of metabolomics resources available
(listed in [34]), and the key aspects of both the analysis
and understanding of me tabolomics data (identified as
Visualization in [41]), there is currently a need for i)a
spectral database combined with ii) a knowledgebase for
plants, iii) an easy-to-use metabolomic spectral
Ferry-Dumazet et al. BMC Plant Biology 2011, 11:104
/>Page 2 of 12
visualization tool and iv) a metabolomic data analysis
tool. Taking these requirements into account, we have
developed a plant m etabolomics platform (with public
or private a ccess) for the storage, management, visuali-
zation, analysis, annotation and query of NMR finger-
prints or quanti tativ e profiles and quantified metabolite.
This platform has been named MeRy-B, for Metabolo-
mics Repository Bordeaux. MeRy-B facilitates profile
discrimination through the visualization of spectral data
by either modular spectrum overlay (i.e.drivenbythe
choice of criteria or factors from the experimental
design) or multivariate statistical analysis. It can also
construct a knowledgebase of plant metabolites deter-
mined by NMR, including metabolite concentration data
when available, with minimal information ab out experi-
mental conditions in the context of scientific publica-
tions, and can be used for the re-analysis of combined
experiments. Furthermore, MeRy-B provides tools for
the identification of metabolites by comparisons of spec-
tra for plant extracts with spectra available in the MeRy-
B knowledgebase.
Construction and Content
Standards for metabolomics
Data storage and database building tools are required
for the storage and analysis of present and future meta-
bolomics data. MeRy-B therefore takes into account the
recommendations of initiatives concerning the extent
and types of metadata (information associated with the
data or data about the data) to be stored for each meta-
bolomics experiment: MiAMET [42,43], Standard Meta-
bolic Reporting Structure (SMRS) [44], Metabolomics
Standard Initiative (MSI) [45]. In terms of plant biologi-
cal context, MeRy-B also includes a small number of
parameters required to define the experimental stud y
design [46].
MeRy-B database design
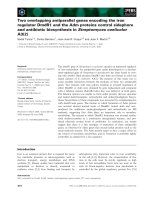
The architecture of MeRy-B (Figure 1) is based on the
ArMet model [43,47] and MIAMET/MSI requirements
[42,48]. We improved the ‘ volume of information
inserted by user’/’ time spent to insert’ ratio by deciding
to store a minimum of information in the database.
MeRy-B ther efore contains fewer components than
ArMet. The aim of this compromise was to ensure that
only the most relevant metadata are stored. Controlled
vocabularies are proposed, where possible, to standar-
dize the information recorded and to reduce the time
required to input information.
Additions to the database are made principally
through web interfaces, with various forms. These data
input forms are accessible to registered users. Other
metadata are uploaded, stored in files and made avail-
able for consultation. For example, all protocols are
collected in PDF format files, as such files are already
available as part of the quality assurance approach oper-
ating in most laboratories: standard operating proce-
dures (SOPs) are available and users therefore waste
littletimeuploadingthesedataintotheMeRy-B
database.
The database is structured according to the steps in a
metabolomics experiment and therefore consists of four
principal components: “Experimental design” (Figure 1a)
“Analytical Metadata” (Figure 1b), “Spe ctra data” (Figure
1c) and “ Compound s” (Figure 1d). There is also a fifth
component: “ Ad ministration” (Figure 1e). Unlike
MeltDB [36], MeRy-B is based on the description of an
experiment according to the logic of the metabolomics
approach (Figure 1). Thus, experimental context is the
first subject tackled, and spectra are then allocated to
this biological context.
Experimental metadata
The Experimental Design component describes the bio-
logical source and protocols for plant growth, sample
harvest, extract preparation and storage (Figure 1a). The
experimental details are crucial for data interpretation
and use in subsequent studies, so all metadata relating
to experimental design are described in detail. For this
purpose, descriptions are based, as far as possible, on
controlled vocabularies and ontologies, such as NCBI
Taxonomy i.nlm.nih.gov/Taxonomy/,
Plant Ontology Consortium ntontology.
org/ and Environment Ontology http://environmenton-
tology.org/. A Project is defined as an entity comprising
a set of experiments carried out on one species by a
laboratory, at a particular geographic site. Within a
given Project, each Experiment is carried out within a
part icular set of environmental conditions, such as ‘con-
trol’ or ‘stress’. A protocol file in PDF format is uploaded
for each step in the experiment: growth, harvest and sto-
rage of the biologic al samples. Five types of biological
factor potent ially contributing to definition of the
experimental design are defined: organ or tissue, geno-
type, genetic background, developmental stage and
environmental conditions.
Analytical metadata
MeRy-B also manages metadata concerning the analyti-
cal part of the experiments. The preparation of analyti-
cal samples (plant extracts or plant fluids, such as sap
or exudate), parameters of analytical instruments and
spectrum processing metadata are described in PDF
protocols (Figure 1b). The PDF file for Extraction also
contains information about the number of samples and
the way they were coded, including the parameters of
biological and technological replicates. The descriptions
of extraction methods and analytical instruments are
Ferry-Dumazet et al. BMC Plant Biology 2011, 11:104
/>Page 3 of 12
stored into the database on forms, allowing these meta-
data to be queried. Each item of analytical metadata is
linked to an analytical technique (i.e.
1
H-NMR).
MeRy-B can generate Analytical Profiles to assist the
user with the input of repetitive analyt ical metadata. An
Analytical Profile consists of an instrument description,
an extraction method description and the various types
of protocol: extraction, analytical and processing.
Spectral data
The Spectral data component describes spectrum format
and processed data (Figure 1c). MeRy-B supports the
standard ascii exchange format f or spectroscopic data:
JCAMP-DX for
1
H-NMR spectra. Spectra in proprietary
formats (Bruker, Jeol, and Varian) must be converted
into JCAMP-DX format (1r 1 spec: real processed data).
Spectra may be uploaded a s data that have already been
preprocessed by commercial softwa re (Fouri er Transfor-
mation, manual phasing and baseline correction). Alter-
natively, MeRy-B provides custom-desig ned signal
processing methods for 1r NMR data. These methods
include noise suppression, baseline correction (signal
denoising and baseline co rrection are obtained by dis-
crete wavelet transform [49]), deconvolution (searching
for pe aks fro m the third order of signal derivative, build-
ing a modeled spectrum as a sum of Lorentzian shapes,
followed by an optimization step based on the Leven-
berg-Marquardt algorithm [50]) and the automatic
detection of chemical shift indicators (i.e. TSP or DSS).
Each spectrum, whether modeled or not, is linked to an
Experimental Design and an Analytical Profile.
Compounds
The Compounds component provides information about
the identification of a given compound and its quantifi-
cation, when available (Figure 1d). Each spectrum can
be linked to a compound list, with compound chemical
shifts and quantifi cations, when available. The user may
declare a compound as “known”,withKEGGIDsand
nam es (KEGG compound database ome.
jp/kegg/compound/[51]), or as “ unknown” .Inthe
MeRy-B database, an unknown compound is a com-
pound with an unknown structure but a known 1D
1
H-
NMR signature (pattern of the NMR signal: singlet,
doublet, triplet or multiplet, and their chemical shifts).
A specific nomenclature is used to allocate identifiers to
the unknown compounds, to link these unknown signa-
tures in the various spectra of the database. For exam-
ple, an interesting singlet peak was detected on a
spectrum at 1.9 ppm. This unknown compound is thus
named unkS1.90: with S for singlet and 1.90 for the che-
mical shift expressed in ppm in agreement with the
recommendations of MSI [48]. A putative identification
may be added as a comment. The user is free to add
comments to all the compounds identified as known
and unknown.
Administration
- Users, Access rights, Project status (public or private)
ŽŶƚƌŽůůĞĚǀŽĐĂďƵůĂƌŝĞƐ;D^/ͿнKŶƚŽůŽŐŝĞƐ;KKͲ ŽďŽ͘ƐŽƵƌĐĞĨŽƌŐĞ͘ŶĞƚͿ
Ğ
Compounds
- Identified compounds
(KEGG)
- Unknown compounds
- Quantifications
ď
Analytical
metadata
- Instrument
- Technique
- Extraction method
- Protocols (PDF)
Ă
Experimental
design
- Biological source
-Project
- Experiments
- Genotype(s)
- Development stage(s)
- Protocols (PDF)
Spectra data
- Pre-processed
spectra data
(JCAMP-DX)
- Processed spectra
data
- Peak lists
Đ Ě
YƵĞƌLJƵŝůĚĞƌ ^ƚĂƚŝƐƚŝĐĂůŶĂůLJƐŝƐ
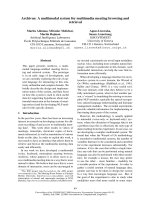
Figure 1 MeRy-B a rchitecture and workflow for the capture and management of metabolomic data. MeRy-B has four components,
following the steps of a metabolomic experiment: (a) description of Experimental Design, (b) Analytical Metadata, (c) Spectral Data, including
preprocessed spectra data supplied by users and processed spectra obtained with custom-designed tools, (d) capture of Compounds with
names based on the KEGG database and chemical annotation of chemical shift based on IUPAC rules where possible. Metadata description is
supported by controlled vocabularies and ontologies. Unstructured “free” text is recorded as protocols in PDF format. The administration
component (e) takes into account different rights of access for both projects and users. Project status defines the type of information to which
users have access, as a function of their access rights for the project concerned.
Ferry-Dumazet et al. BMC Plant Biology 2011, 11:104
/>Page 4 of 12
Administration
The database also contains an Administration compo-
nent (Figure 1e), to manage the accounts and access
rights of users at project level. The “Admin user” has
the right to create new entities, such as Instrument,
Localization, and Controll ed Vocabulary, such as
genotype.
The user responsible for creating a project automati-
cally becomes its “owner” . The owner of a project can
provide temporary or permanent access rights (insertion,
deletion of data) to other users on his or her project. By
default, a project is private. However, it may be made
public (for consultation only) if access via the public
user account is set up by the project’s owner.
Database implementation
MeRy-B is a PostgreS QL relational database accessible
through a web interface developed in the PHP language.
The web interface is rendered dynamic by the use of
JavaScript and AJAX technologies. The application is
maintained on a Linux server. A Java applet has been
developed for
1
H NMR spectrum visualizat ion (the self-
signed certificate is available on the"About MeRy-B”
page). The backend statistical computing and visualiza-
tion operations are carried out with functions from the
R packages and Perl scripts. Data storag e, treatment and
querying have been developed with Perl, XML and web
services technologies, such as SOAP.
Utility and Discussion
MeRy-B fulfills two needs. First, each registered user, as
a project owner, creates projects and deposits his or her
own data and associated metadata into the application
for storage, consultation, visualization and analysis. At
this point, there is no curation team deciding whether
or not an upload should be allowed. However, the
administrator is alerted when a project is rend ered pub-
lic and he verifies this new inclusio n of data. Second, all
users are allowed to search the M eRy-B knowledgebase
constructed from the information provided by all pre-
vious project owners (public data), for the re-analysis
and comparison of data sets and to facilitate compound
identification. The utility of MeRy-B for each of these
cases is detailed below. A user manual illustrated with
screenshots is available from the MeRy-B website for a
more detailed description.
How to upload and consult a metabolomics project on
MeRy-B as project owner
Data uploading and consultation are illustrated here, as
a use case, with the data and metadata of a published
study on tomato [10]. Four main types of data were
entered through the Data capture module in the MeRy-
B database: (1) experimental design, (2) analytical
metadata, (3) spectral data, and (4) compounds (lists
and/or quantifications). Three main steps were used 1)
creation of the users account and project , 2) population
of the database with the user’s data, and 3) analysis and
visualization of the user’s data. The aim of the tomato
study was to characterize differences between the meta-
bolic profiles of two interdependent tissues, seeds and
flesh, from the same fruits, during fruit development, by
means of a metabolomics approach. Before the creation
of the MeRy-B project, it was necessary to define an
informative title and to decide which factors should be
taken into account for subsequent data visualization and
analysis. Two factors, tissue (Seed vs Flesh) and develop-
mental stage, were clearly identified and guided the cod-
ing of the biological samples and the organization of the
data in the database. Two experiments were created:
Tomato-Seed and Tomato-Flesh.
Once the user’ s account had been created by the
MeRy-B administrator, an acc ession number was allo-
cated: T06002 (T for tomato, 06 for year 2006 and 002
for the second project on tomato in 2006). The project
was created by uploading the three pro tocols describing
Growth, Harvest and Storage as pdf files through the
Protocols menu: PG- Tomato - Metabolomics - 2006,
PH- Tomato - Metabolomics - 2006 and PS-Tomato-
UMR619-1. The ‘ Environmental Condition’ , ‘ Study
Type’ and ‘Tissue/Organ’ were selected from dro p-down
lists: Normal , Growth chambe r study and Seed or Fruit.
Several controlled vocabularies were also required, such
as Culture Localization, Genotype Lycopersicum esculen-
tum var ‘Ailsa Craig’. These requests were sent to the
MeRy-B administrator who created and added this new
controlled vocabulary. The five Developmental stages
were then created by the user for each experiment: from
FF.01 fruit size 30% (8 days post anthesis or DPA) to
FR.04 fruit ripening complete (45 DPA) and the geno-
type was chose n (Ailsa Craig). The Analytical Metadata
component was then created and documented with a
description of the NMR spectrometer (in Instrument
Menu), NMR sample preparation (conditions of sample
preparation by resuspensi on or reconstitution in solvent
(in the Methods menu)), the protocols used for extrac-
tion/preparation of the samples (PE-Tomato - Metabo-
lomics -2006), NMR acquisition (PA- Tomato -
Metabolomics -2006) and NMR processing (PP- Tomato
- Metabolomics -2006). The next step was the creation
of Analytical Profiles. Sample coding was described in
the extraction protocol: e.g. Sx.y.z indicates Seed sample
at x days post anthesis, y indicates the pool or biological
replicate number and z, the technological replicate. Dur-
ing the transformation of NMR spectra from Bruker for-
mat to JCAMP-DX format, the spectra were renamed
with the above code. They were then imported into
MeRy-B through the Spectral Data module.
Ferry-Dumazet et al. BMC Plant Biology 2011, 11:104
/>Page 5 of 12
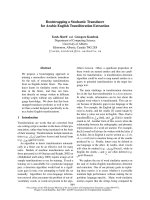
During the third step, within the Data consultation
menu, the overlay module was particularly useful for
checking the quality of spectra and the View module
for checking the consistency of biological replicates. In
addition, as spectra are colored according to criteria
chosen by the user, such as by experiment, develop-
mental stage or sample code, visual inspection and
identification of the spectral areas specific to a tissue
(Figure 2a) or a stage of development (Figure 2b) was
facilitated by this overlay module, which is much more
powerful than the dual function based exclusively on
sample code provided by the manufacturers of NMR
software. For instance, with MeRy-B Spectra overlay,
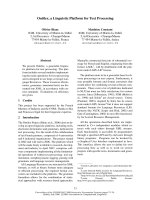
(Figure 2a and 2b) it was possible to identify develop-
mental stage biomarkers (e.g. dou blets at 7.66, 7.21,
7.13, 6.96 and 6.4 ppm, subsequently identified as
chlorogenic acid; and a multiplet at 1.9 and two tri-
plets at 2.3 and 3.01 ppm, subsequently identified as
gamma-aminobutyric acid or GABA) or tissue biomar-
kers (e.g. doublets at 5.44 and 5.00 ppm, putatively
identified as a pla nteose-like compound, a major oligo-
saccharide in tomato seed).
In addition to visual inspection, MeRy-B statistical
tools were applied to regions of the spectral signature or
buckets (data reduction using bucket size of 0.04 ppm,
bucket intensity normalized to total intensity; and water
signal region excluded from 4.97 to 4.7 ppm). These
tools included standardization of bucket intensities fol-
lowed by principal component analysis (PCA) or analysis
of variance (ANOVA) (Figures 2c and 2d), for the
identification of relevant spectral regions [52] and help
in targeting of the metabolite identification process.
This MeRy-B output for the T06002 tomato proje ct
was consistent with the findings of the previous study
[10], which highlighted the sam e developmental stage
biomarkers by a different approach: PCA and compari-
son of the means of absolute quantifications for the
identified metabolites with SAS version 8.01 software.
In addition, known or unknown compounds identified
on NMR spectra in [10] were documented in MeRy-B,
by selecting the menu Compound,andthenAdd com-
pound. The list of identified and/or quantified metabo-
lites established was downloaded via ‘Download the
quantifiable compounds list’ and opened with spread-
sheet software on a PC (e.g. MS Excel) for completion
with the quantification data from each NMR spectrum.
This file was then uploaded into MeRy-B. The quantita-
tive data can be visualized for the entire T06002 project
through the menu Data consultation, Proj ects, Com-
pounds (Figure 3b) or for each spectrum, by selecting
the spectrum and the Compounds menu (Figure 3e).
At this point, the pr oject owner decided to share the
data with the scientific community. In most cases, this
occurs at the time of publication of the corresponding
paper. Therefore, the reviewers will have had the oppor-
tunity to check the quality of the spectra and the meta-
data during the review process, as they will have been
provided with special logins. The curation process is
therefore partly carried out by the reviewers of the
scientific journal. Nevertheless, when the project owner
Ă
ď
Đ
Ě
Figure 2 Example of the MeRy-B NMR Spectra overlay and Statistical visualization tool. Overlay of a portion of the NMR spectra colored
according to the tissue (Flesh vs Seed, (a)) or developmental stage (b) criterion. (c) and (d) illustrate the ANOVA results of the spectral region
centered on 3 ppm (bucket size 0.04 ppm) as a box and whisker plot representation. These box and whisker plot representations provide a
graphical view of the multiple comparison results based on the tissue (c) or developmental stage (d) criterion.
Ferry-Dumazet et al. BMC Plant Biology 2011, 11:104
/>Page 6 of 12
Ěʹ ^ƚĂƚŝƐƚŝĐĂůŶĂůLJƐŝƐ
Ăʹ WƌŽũĞĐƚKǀĞƌǀŝĞǁ
ďʹ ŽŵƉŽƵŶĚƐ
Đʹ KǀĞƌůĂLJ
Ğʹ ^ƉĞĐƚƌĂKǀĞƌǀŝĞǁ
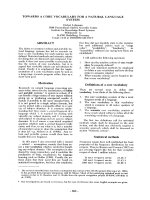
Figure 3 Examples of Visualization and Statistical Analysis results for the tomato project T06002. Screenshots from the various
visualization and statistical tools. The user selected the tomato project T06002 (a), the composition overview of the samples (b), visualization of
the NMR spectra according to tissue criteria (c), visualization of the statistical analysis results (d) and a zoom on one specific spectrum (e). MeRy-
B provides statistical analysis facilities within each project. First, the experimental factors and individual samples (rows) and the spectral region
variables (columns) for construction of the initial data matrix must be chosen. Second, a statistical analysis workflow must be selected from a list
of proposals. Workflow typically begins with standardization of the data, followed by data reduction by analysis of variance (ANOVA) to select
the meaningful variables (p-value threshold 0.05). An unsupervised method, such as principal component analysis (PCA), can then be used, if
desired, to determine a set of variables from the inputs that can be used to classify the samples into factor groups. An ANOVA test can then be
applied to each variable of the set, generating box and whisker plots making it possible to check the relevance of the discrimination. If variables
are of the analytical type, it may be important to ensure that they are not affected by an analytical artifact (such as chemical shift). Such checks
can be carried out with the Spectra overlay tool, which can be used to visualize all the spectra of an experiment, overlaid in a single graph.
Ferry-Dumazet et al. BMC Plant Biology 2011, 11:104
/>Page 7 of 12
renders the data publicly available, the system alerts the
administrator and allows him or her to curate the data
and to validate the definitive inclusion of the data into
MeRy-B.
Consulting a metabolomics project on MeRy-B
Once a project has been imported and rendered public
(i.e. after publication), the experi mental data and related
metadata can be consulted through the Data consulta-
tion module and its various interfaces, providing either a
global view or a detailed view. The complete experimen-
tal design, by project, is available through the Project
Details function, which provides an overview on a single
web page (Figure 3a). From this web pag e, a global view
of each experiment of the project, from which all related
information, such as experimental protocols or spectral
data, is accessible. All analytical protocols, including
processing protocol, relating to the spectral data can be
accessed through the Spectral data Interface.Aninter-
active graphical tool can be used to view either the
entire spectrum or to zoom in and focus on one part of
the spectrum (Figure 3e). Within a project (when avail-
able), all identified and possibly quantified compounds
are also available through the Compounds menu, via a
single web page (Figure 3b and above).
A knowledgebase for plant metabolites
All the data an d metadata deposited in projects (when
declared public) are shared with the me tabolomics com-
munity. Thus, MeRy-B can be used as a knowled gebase.
Three helpful tools allow the sorting, visualization and
export of the data already stored into the database: the
search Spectral Data and search Compound under the
tab labeled Data consultation and the Query builder
under the Tools menu.
The “Search spectral data“ tool can be used to visua-
lize a MeRy-B spectrum in a matrix of interest (e.g.
fruit, seed, leaf, epicarp) from a species of interest or a
related species. A multicriterion search of metadata
results in direct display of the corresponding spectra.
For example, 190 spectra of tomato (Lycopersicon escu-
lentum) pericarp obtained on a 500 MHz Bruker Avance
at pH 6 in D
2
O solvent were available for public consul-
tation on March 2011. In addition, users can obtain the
peak list for each spectrum, the corresponding identified
or unidentified compounds and their concentrations.
The graphical view of each spectrum is interactive, mak-
ing it possible to zoom in and focus on a region of the
spectrum, to overlay the spectrum and to observe
detected peaks. Figures containing NMR spectra in pub-
lications are often very small and not interactiv e. This
tool is of particular interest for “ be ginners” with no
experience with a particular tissue or plant matrix. In
addition, there are often few published data dealing with
the composition of the plant tissue, organ or biofluid
and literature searches are time-consuming. MeRy-B
currently compiles data for hundred metaboli tes in fo ur
species and eight tissues or organs, together with the
corresponding metadata.
The “Search compound“ tool enables users to carry
out searches of previously detected compounds stored
in the MeRy-B knowledgebase. Three types of search
maybecarriedout:(i) a compound search (by name,
synonym or elemental formula, according to Hill nota-
tion), (ii) a chemical shift search for
1
H-NMR data (by
chemical shift +/- tolerance, multiplicity, pH, solvent)
after the selection of the
1
H NMR technique and (iii)
advanced searches corresponding to a combination of
both these types of search. F or example, a new user
observes a singlet at 9.08 ppm in tomato at pH 6. He or
she then tries to identify this compound by looking for
identified compounds described in the MeRy-B knowl-
edgebase as a singlet close to 9.08 ppm ± 0.2. The
search returns one compound: trigonelline, with an
external link to the KEGG compound card. The user
can then check whether the other three c hemical shifts
of trigonelline were also detected on his/her NMR spec-
trum. In addition, another link provides all the informa-
tion available about each compound in MeRy-B via a
“MeRy-B card” (MBC) (Figure 4). Chemical Translation
Service (CTS, [53]) and HMDB IDs are also provided
when available. For a given compound, the “ MeRy-B
card” displays the list of experiments in which it was
detected and, for each experiment, additional metadata
are listed (species, tissue/organ, a nd project name),
together with a summary of the analytical results (e.g.
for
1
H-NMR: chemical shift, multiplicity, minimum and
maximum values for quantification). This card also
highlights quantitative differences between species, tis-
sues, organs or experiments for a given compound. One
or several “MeRy- B cards” are returned for each chemi-
cal shift and/or compound search. Comparisons must
take into account the possible use of different quantifi-
cation units. Units are always provided on MeRy-B
cards to prevent inappropriate comparisons.
Finally, Query Builder is a useful tool for queries and
for the export of -omics data. We may need to add to
the statistical treatments currently included in MeRy-B,
nonlinear unsupervised multivariate methods, such as
those based on neural netwo rks, or super vised methods,
such as the partial least s quare (PLS) method, included
in tools such as Multi Experiment Viewer http://www.
tm4.org/mev/ or MetaboAnalyst [40], or other statistical
packages or software. MeRy-B therefore includes a mul-
ticriterion search tool for the construction of queries to
extract all the corresponding data stored in the database.
After initial ly planning to use BioMART [54], we devel-
oped our own query tool with complex filters. Query
Ferry-Dumazet et al. BMC Plant Biology 2011, 11:104
/>Page 8 of 12
building is based on the selection of attributes (from
project name to compound quantification, multiplicity
or chemical shift) collected into logical attribute sets, for
selection of the data to extract. Constraints on these
attributes can be added, to filter the query results,
which are then displayed as an exportable table suitable
for analysis with standard statistical analysis tools, such
as R software. This query builder has not been devel-
oped especially for MeRy-B and is still being developed,
to provide a robust and flexible generic tool http://www.
cbib.u-bordeaux2.fr/x2dbi/. An example of the use of
this module is provided in the Additional file 1.
&ŝůƚĞƌŽŶ
͞ƐĞĞĚ͟ ƚŝƐƐƵĞ
^ĞĂƌĐŚŽŵƉŽƵŶĚ
Figure 4 The MeRy-B card. The MeRy-B card displays all public data stored in the MeRy-B knowledgebase for a given compound. For each
species and tissue in which a given compound is found, this card displays data concerning
1
H-NMR chemical shifts, multiplicity and
quantification. Data may be filtered and sorted by species and/or tissue.
Ferry-Dumazet et al. BMC Plant Biology 2011, 11:104
/>Page 9 of 12
Discussion
A number of other databases worldwide are concep-
tually related to that presented here. However, MeRy-B
has several advantages for plant metabolomics and for
data management and analysis. MeRy-B is a single tool
meeting the needs of the research community in this
domain: one or several spectral databases, a knowledge-
base for plants with an experimental design description,
compound quantification files (when available) and
search tools, several tools for spectrum visualization and
statistics and one or several metabolite identification
tools. These needs were previously met by using a series
of databases and applications. Furthermore, MeRy-B was
designed to improve the re porting of metabolomics
research, based on MIBBI requirements: the MSI. Spe-
cial ized ontological terms are used where applicable, for
experimental design and analytical metadata for NMR,
for example. Furthermore, MeRy-B can be used in three
main ways: consultation within a project, consultation
between projects and consultation of all the data present
in the knowledgebase. When compared to human meta-
bolite-oriented HMDB, MeRy-B is metabolomic pro-
files-oriented and dedicated to plants. When compared
to the MetaboAnalyst web tool that handles processed
data (peak lists or bucket lists), MeRy-B handles NMR
spectra from visualization to statistical analysis using the
corresponding metadata.
One key feature of MeRy-B is the Data consultation
menu, with the Spectra Overlay module. Spectra are dis-
played in color according to the criteria chosen by the
user, facilitating the visual inspection and identification
of spect ral regions varying as a function of the level of a
given factor. This ready-to-use tool is much more
powerful than the ‘dual function’ proposed by the man-
ufacturers of NMR software, which is based exclusively
on sample code. To our knowledge, this is the only
spectrum visualization tool with this overlay feature
available.
In publications, NMR metabo lomic profiles are gener-
ally reduced to one or two representative spectra. These
spectra are not interactive and their resolution is often
too low for the reader to extract all the information
they contain. In this context, MeRy-B is of particular
interest for newcomers with no experience with a part i-
cular tissue or plant matrix, because it provides access
to detailed experimental and analytical protocols,
together with the composition of the corresponding
plant sample. Such composition data are scarce in publi-
cations and their provision by MeRy-B is therefore of
great potential utility. As in the HMDB database, the
precise tissue or organ distribution of a compound
within a plant, together with its quantification, consti-
tute crucial information for MeRy-B users. Indeed, the
level of quantification varies as a function of the tissue,
organ or species of interest, and users can compare the
amounts of a given compound between situations for
the identification of potential biomarkers.
Inthenearfuture,weplantomakeitpossibleto
import and expo rt experiment description data with the
emerging ISA-tab format [55], which was developed for
the description of invest igations, studies and assays for
-omics approaches. We will expand the scope of Me Ry-
B, by extending spectrum management to other analyti-
cal techniques, such as GC-MS, LC-MS and
13
CNMR.
The objective is to gather datasets generated by different
analytical techniques, making it possible to benefit from
their complementarity, as shown by recent publications
[56,57]. We also plan to enlarge the MeRy-B knowledge-
base by the inclusion of libraries of reference com-
pounds from MeRy-B users or from other available
libraries.
Conclusion
MeRy-B is a web-based application and database for the
management and analysis of NMR plant metabolomics
profiles, filling the gap in centralized informat ion in this
area. This platform manages all the data produced by a
metabolomics experiment, from biological source
description to compound identification. It also helps the
user to analyze and to understand the data, by providing
a number of visualization tools, for the visualization of
NMR data by spectra overlay or multivariate statistical
analyses, for example. By creating integrated visualiza-
tions, MeRy-B can provide biological insight. Further-
more, it provides information abou t metabolite
quantification, making it possible to make comparisons
between developmental stages, tissues, or environmental
conditions. In March 2011, 20 users had a MeRy-B
account, and 12 projects, 962 spectra and 100 com-
pounds were available for public consultation in MeRy-
B (for an update, see the home page). All these data, cle-
verly exploited with MeRy-B tools, provide a useful
knowledgebase for the sharing of plant NMR profiles
and information relating to metabolites. This knowl-
edgebase facilitates the identification of metabolites
through comparisons between the spectra obtained for
plant extracts and those present in the MeRy-B
knowledgebase.
Availability and requirements
Project name: MeRy-B
Project home page: />MERYB/home/home.php
Browser requirement: the application is optimized for
Firefox. However, it also works satisfactorily with Micro-
soft Internet Explorer version 7 and Safari.
Ferry-Dumazet et al. BMC Plant Biology 2011, 11:104
/>Page 10 of 12
The user’ s web browser should support JAVA, to
make it possible to benefit fully from MeRy-B.
Users can cre ate an account by submitting a form on
the MeRy-B website. The user may populate the data-
base him or herself, or assistance can be provided (see
link on the website). MeRy-B is free to all academic
users for data submission and their visualization and
analysis.
Additional material
Additional file 1: One example of use of Query Builder module in
MeRy-B. This workflow tutorial with step-by-step and with screenshots
illustrates how to reach the objective of extracting the list of the
metabolites identified in the
1
H-NMR spectra of project T06002: name,
chemical shifts, groups and multiplicity.
List of abbreviations
D
2
O: deuterium oxide; DSS: 4,4-dimethyl-4-silapentane-1-sulfonic acid
sodium salt; JCAMP-DX: the Joint Committee on Atomic and Molecular
Physical data - Data Exchange format; KEGG: Kyoto Encyclopedia of Genes
and Genomes. KEGG COMPOUND Database: />compound/; MS: mass spectrometry; NMR: nuclear magnetic resonance;
ppm: parts per million; SOAP: Simple Object Access Protocol; XML: Extensible
Markup Language; TSP: (trimethylsilyl)propionic-2,2,3,3-d
4
acid sodium salt;
Acknowledgements and Funding
We thank the META-PHOR EU project (FOOD-CT-2006-036220) for providing
data, Isabelle Quintana for uploading some data, Dr Cécile Cabasson for
fruitful discussions and database testing, Alain Girard for providing the logo
and the members of the Genoplante GEN036 consortium for initiating this
project. This work was partly supported by Genoplant e [GEN036 to H. F D.].
Author details
1
Université de Bordeaux, Centre de Bioinformatique de Bordeaux,
Génomique Fonctionnelle Bordeaux, F-33076 Bordeaux, France.
2
INRA, UMR
1332 Biologie du Fruit et Pathologie, Centre INRA de Bordeaux, F-33140
Villenave d’Ornon, France.
3
Plateforme Métabolome-Fluxome Bordeaux,
Génomique Fonctionnelle Bordeaux, IBVM, Centre INRA de Bordeaux, BP 81,
F-33140 Villenave d’Ornon, France.
4
Université de Bordeaux, UMR 1332
Biologie du Fruit et Pathologie, Centre INRA de Bordeaux, F-33140 Villenave
d’Ornon, France.
5
Université de Bordeaux, Laboratoire Bordelais de
Recherche en Informatique, UMR 500, F-33405 Talence, France.
Authors’ contributions
ADD and AM initiated the project. HFD, DJ and LG designed the DB. LG and
DJ designed the web interface and implemented the DB and associated
tools and developed the source code of the web application. CD actively
populated the DB, tested the application and tools and provided feedback.
HFD, LG, CD prepared the manuscript. DJ and SB participated in the drafting
of the manuscript and its figures. CD provided studies for use cases. AM, CD
and MN contributed to the critical reading of the manuscript. AM, DR, ADD
and MN served as project advisors. All authors have read and approved the
final submitted version.
Received: 17 December 2010 Accepted: 13 June 2011
Published: 13 June 2011
References
1. Oliver SG, Winson MK, Kell DB, Baganz F: Systematic functional analysis of
the yeast genome. Trends Biotechnol 1998, 16:373-378.
2. Fiehn O, Kopka J, Dörmann P, Altmann T, Trethewey RN, Willmitzer L:
Metabolite profiling for plant functional genomics. Nat Biotechnol 2000,
18:1157-1161.
3. Hall RD: Biology of plant metabolomics Wiley-Blackwell; 2011.
4. Hardy NW, Hall RD: Plant Metabolomics Methods Otawa, USA: Humana Press;
2011.
5. Saito K, Dixon RA, Willmitzer L: Plant Metabolomics Berlin/Heidelberg:
Springer-Verlag; 2006.
6. Allwood J, de Vos C, Moing A, Deborde C, Erban A, Kopka J, Goodacre R,
Hall R: Plant metabolomics and its potential for systems biology
research: background concepts, technology and methodology. In
Methods in Systems Biology. Edited by: Westerhoff H, Hayes N. Elsevier Inc;
2011:.
7. Doehlemann G, Wahl R, Horst RJ, Voll LM, Usadel B, Poree F, Stitt M, Pons-
Kühnemann J, Sonnewald U, Kahmann R, Kämper J: Reprogramming a
maize plant: transcriptional and metabolic changes induced by the
fungal biotroph Ustilago maydis. Plant J 2008, 56:181-195.
8. Pereira GE, Gaudillère JP, Pieri P, Hilbert G, Maucourt M, Deborde C,
Moing A, Rolin D: Microclimate influence on mineral and metabolic
profiles of grape berries. J Agric Food Chem 2006, 54:6765-6775.
9. Sanchez DH, Siahpoosh MR, Roessner U, Udvardi M, Kopka J: Plant
metabolomics reveals conserved and divergent metabolic responses to
salinity. Physiol Plant 2008, 132:209-219.
10. Mounet F, Lemaire-Chamley M, Maucourt M, Cabasson C, Giraudel J,
Deborde C, Lessire R, Gallusci P, Bertrand A, Gaudillère M, Rothan C,
Rolin D, Moing A: Quantitative metabolic profiles of tomato flesh and
seeds during fruit development: complementary analysis with ANN and
PCA. Metabolomics 2007, 3:273-288.
11. Tarpley L, Duran AL, Kebrom TH, Sumner LW: Biomarker metabolites
capturing the metabolite variance present in a rice plant developmental
period. BMC Plant Biol 2005, 5:8.
12. Hall RD, Brouwer ID, Fitzgerald MA: Plant metabolomics and its potential
application for human nutrition. Physiol Plant 2008, 132:162-175.
13. Cuny M, Vigneau E, Gall G, Colquhoun I, Lees M, Rutledge DN: Fruit juice
authentication by 1H NMR spectroscopy in combination with different
chemometrics tools. Anal Bioanal Chem 2007, 390:419-427.
14. Catchpole GS, Beckmann M, Enot DP, Mondhe M, Zywicki B, Taylor J,
Hardy N, Smith A, King RD, Kell DB, Fiehn O, Draper J: Hierarchical
metabolomics demonstrates substantial compositional similarity
between genetically modified and conventional potato crops. Proc Natl
Acad Sci USA 2005, 102:14458-14462.
15. Hirai MY, Klein M, Fujikawa Y, Yano M, Goodenowe DB, Yamazaki Y,
Kanaya S, Nakamura Y, Kitayama M, Suzuki H, Sakurai N, Shibata D,
Tokuhisa J, Reichelt M, Gershenzon J, Papenbrock J, Saito K: Elucidation of
gene-to-gene and metabolite-to-gene networks in Arabidopsis by
integration
of
metabolomics and transcriptomics. J Biol Chem 2005,
280:25590-25595.
16. Malitsky S, Blum E, Less H, Venger I, Elbaz M, Morin S, Eshed Y, Aharoni A:
The transcript and metabolite networks affected by the two clades of
Arabidopsis glucosinolate biosynthesis regulators. Plant Physiol 2008,
148:2021-2049.
17. Saito K, Matsuda F: Metabolomics for functional genomics, systems
biology, and biotechnology. Annu Rev Plant Biol 2010, 61:463-89.
18. Fernie AR, Schauer N: Metabolomics-assisted breeding: a viable option
for crop improvement? Trends Genet 2009, 25:39-48.
19. Harrigan GG, Martino-Catt S, Glenn KC: Metabolomics, metabolic diversity
and genetic variation in crops. Metabolomics 2007, 3:259-272.
20. Hall RD: Plant metabolomics: from holistic hope, to hype, to hot topic.
New Phytol 2006, 169:453-468.
21. Sumner LW, Mendes P, Dixon RA: Plant metabolomics: large-scale
phytochemistry in the functional genomics era. Phytochemistry 2003,
62:817-836.
22. Krishnan P, Kruger NJ, Ratcliffe RG: Metabolite fingerprinting and profiling
in plants using NMR. J Exp Bot 2005, 56:255-265.
23. Ward J, Beale M: In Plant Metabolomics. Volume 57. Berlin/Heidelberg:
Springer-Verlag; 2006.
24. Kim HK, Choi YH, Verpoorte R: NMR-based metabolomic analysis of
plants. Nat Protoc 2010, 5 :536-549.
25. Moing A, Maucourt M, Renaud C, Gaudillère M, Brouquisse R, Lebouteiller B,
Gousset-Dupont A, Vidal J, Granot D, Denoyes-Rothan B, Lerceteau-Köhler E,
Rolin D: Quantitative metabolic profiling by 1-dimensional 1H-NMR
analyses: application to plant genetics and functional genomics.
Functional Plant Biol 2004, 31:889.
26. Kopka J, Schauer N, Krueger S, Birkemeyer C, Usadel B, Bergmüller E,
Dörmann P, Weckwerth W, Gibon Y, Stitt M, Willmitzer L, Fernie AR,
Ferry-Dumazet et al. BMC Plant Biology 2011, 11:104
/>Page 11 of 12
Steinhauser D: : the Golm Metabolome Database.
Bioinformatics 2005, 21:1635-1638.
27. de Vos RCH, Moco S, Lommen A, Keurentjes JJB, Bino RJ, Hall RD:
Untargeted large-scale plant metabolomics using liquid chromatography
coupled to mass spectrometry. Nat Protoc 2007, 2 :778-791.
28. Dettmer K, Aronov PA, Hammock BD: Mass spectrometry-based
metabolomics. Mass Spectrom Rev 2007, 26:51-78.
29. Nakamura Y, Kimura A, Saga H, Oikawa A, Shinbo Y, Kai K, Sakurai N,
Suzuki H, Kitayama M, Shibata D, Kanaya S, Ohta D: Differential
metabolomics unraveling light/dark regulation of metabolic activities in
Arabidopsis cell culture. Planta 2007, 227:57-66.
30. Zulak KG, Weljie AM, Vogel HJ, Facchini PJ: Quantitative 1H NMR
metabolomics reveals extensive metabolic reprogramming of primary
and secondary metabolism in elicitor-treated opium poppy cell cultures.
BMC Plant Biol 2008, 8 :5.
31. Viant MR, Bearden DW, Bundy JG, Burton IW, Collette TW, Ekman DR,
Ezernieks V, Karakach TK, Lin CY, Rochfort S, de Ropp JS, Teng Q,
Tjeerdema RS, Walter JA, Wu H: International NMR-based environmental
metabolomics intercomparison exercise. Environ Sci Technol 2009,
43:219-225.
32. Ward J, Baker J, Miller S, Deborde C, Maucourt M, Biais B, Rolin D, Moing A,
Moco S, Vervoort J, Lommen A, Schäfer H, Humpfer E, Beale M: An inter-
laboratory comparison demonstrates that
1
H-NMR metabolite
fingerprinting is a robust technique for collaborative plant metabolomic
data collection. Metabolomics 2010, 6:263-273.
33. Wishart DS, Tzur D, Knox C, Eisner R, Guo AC, Young N, Cheng D, Jewell K,
Arndt D, Sawhney S, Fung C, Nikolai L, Lewis M, Coutouly M, Forsythe I,
Tang P, Shrivastava S, Jeroncic K, Stothard P, Amegbey G, Block D, Hau DD,
Wagner J, Miniaci J, Clements M, Gebremedhin M, Guo N, Zhang Y,
Duggan GE, Macinnis GD, Weljie AM, Dowlatabadi R, Bamforth F, Clive D,
Greiner R, Li L, Marrie T, Sykes BD, Vogel HJ, Querengesser L: HMDB: the
Human Metabolome Database. Nucleic Acids Res 2007, 35:D521-526.
34. Wishart DS, Knox C, Guo AC, Eisner R, Young N, Gautam B, Hau DD,
Psychogios N, Dong E, Bouatra S, Mandal R, Sinelnikov I, Xia J, Jia L, Cruz JA,
Lim E, Sobsey CA, Shrivastava S, Huang P, Liu P, Fang L, Peng J, Fradette R,
Cheng D, Tzur D, Clements M, Lewis A, De Souza A, Zuniga A, Dawe M,
Xiong Y, Clive D, Greiner R, Nazyrova A, Shaykhutdinov R, Li L, Vogel HJ,
Forsythe I: HMDB: a knowledgebase for the human metabolome. Nucleic
Acids Res 2009, 37:D603-610.
35. Ulrich EL, Akutsu H, Doreleijers JF, Harano Y, Ioannidis YE, Lin J, Livny M,
Mading S, Maziuk D, Miller Z, Nakatani E, Schulte CF, Tolmie DE, Kent
Wenger R, Yao H, Markley JL: BioMagResBank. Nucleic Acids Res 2008, 36 :
D402-408.
36. Neuweger H, Albaum SP, Dondrup M, Persicke M, Watt T, Niehaus K,
Stoye J, Goesmann A: MeltDB: a software platform for the analysis and
integration of metabolomics experiment data. Bioinformatics 2008,
24:2726-2732.
37. Scholz M, Fiehn O: SetupX– a public study design database for
metabolomic projects. Pac Symp Biocomput 2007, 12:169-180.
38. Akiyama K, Chikayama E, Yuasa H, Shimada Y, Tohge T, Shinozaki K,
Hirai MY, Sakurai T, Kikuchi J, Saito K: PRIMe: a Web site that assembles
tools for metabolomics and transcriptomics. Silico Biol (Gedrukt) 2008,
8:339-345.
39. Neveu V, Perez-Jiménez J, Vos F, Crespy V, du Chaffaut L, Mennen L,
Knox C, Eisner R, Cruz J, Wishart D, Scalbert A: Phenol-Explorer: an online
comprehensive database on polyphenol contents in foods. Database
2010 [ />40. Xia J, Psychogios N, Young N, Wishart DS: MetaboAnalyst: a web server
for metabolomic data analysis and interpretation. Nucleic Acids Res 2009,
37:W652-660.
41. Gehlenborg N, O’Donoghue SI, Baliga NS, Goesmann A, Hibbs MA,
Kitano H, Kohlbacher O, Neuweger H, Schneider R, Tenenbaum D,
Gavin AC: Visualization of omics data for systems biology. Nat Methods
2010, 7:S56-68.
42. Bino RJ, Hall RD, Fiehn O, Kopka J, Saito K, Draper J, Nikolau BJ, Mendes P,
Roessner-Tunali U, Beale MH, Trethewey RN, Lange BM, Wurtele ES,
Sumner LW: Potential of metabolomics as a functional genomics tool.
Trends Plant Sci 2004, 9:418-425.
43. Jenkins H, Hardy N, Beckmann M, Draper J, Smith AR, Taylor J, Fiehn O,
Goodacre R, Bino RJ, Hall R, Kopka J, Lane GA, Lange BM, Liu JR, Mendes P,
Nikolau BJ, Oliver SG, Paton NW, Rhee S, Roessner-Tunali U, Saito K,
Smedsgaard J, Sumner LW, Wang T, Walsh S, Wurtele ES, Kell DB: A
proposed framework for the description of plant metabolomics
experiments and their results. Nat Biotechnol 2004, 22:1601-1606.
44. Lindon JC, Nicholson JK, Holmes E, Keun HC, Craig A, Pearce JTM, Bruce SJ,
Hardy N, Sansone S, Antti H, Jonsson P, Daykin C, Navarange M, Beger RD,
Verheij ER, Amberg A, Baunsgaard D, Cantor GH, Lehman-McKeeman L,
Earll M, Wold S, Johansson E, Haselden JN, Kramer K, Thomas C, Lindberg J,
Schuppe-Koistinen I, Wilson ID, Reily MD, Robertson DG, Senn H, Krotzky A,
Kochhar S, Powell J, van der Ouderaa F, Plumb R, Schaefer H, Spraul M:
Summary recommendations for standardization and reporting of
metabolic analyses. Nat Biotechnol 2005, 23:833-838.
45. Sansone S, Fan T, Goodacre R, Griffin JL, Hardy NW, Kaddurah-Daouk R,
Kristal BS, Lindon J, Mendes P, Morrison N, Nikolau B, Robertson D,
Sumner LW, Taylor C, van der Werf M, van Ommen B, Fiehn O: The
Metabolomics Standards Initiative. Nat Biotechnol 2007, 25:846-848.
46. Fiehn O, Sumner LW, Rhee SY, Ward J, Dickerson J, Lange BM, Lane G,
Roessner U, Last R, Nikolau B: Minimum reporting standards for plant
biology context information in metabolomic studies. Metabolomics 2007,
3:195-201.
47. Jenkins H, Johnson H, Kular B, Wang T, Hardy N: Toward supportive data
collection tools for plant metabolomics. Plant Physiol 2005, 138:67-77.
48. Sumner L, Amberg A, Barrett D, Beale M, Beger R, Daykin C, Fan T, Fiehn O,
Goodacre R, Griffin J, Hankemeier T, Hardy N, Harnly J, Higashi R, Kopka J,
Lane A, Lindon J, Marriott P, Nicholls A, Reily M, Thaden J, Viant M:
Proposed minimum reporting standards for chemical analysis. Chemical
Analysis Working Group (CAWG) Metabolomics Standards Initiative
(MSI). Metabolomics 2007, 3:211-221.
49. Liu B, Sera Y, Matsubara N, Otsuka K, Terabe S: Signal denoising and
baseline correction by discrete wavelet transform for microchip capillary
electrophoresis. Electrophoresis 2003, 24:3260-3265.
50. Levenberg K: A method for the solution of certain problems in least
squares. Quart Appl Math 1944, 2:164-168.
51. Goto S, Okuno Y, Hattori M, Nishioka T, Kanehisa M: LIGAND: database of
chemical compounds and reactions in biological pathways. Nucleic Acids
Res 2002, 30:402-404.
52. van den Berg R, Hoefsloot HCJ, Westerhuis JA, Smilde AK, van der Werf MJ:
Centering, scaling, and transformations: improving the biological
information content of metabolomics data. BMC Genomics 2006, 7:142.
53. Wohlgemuth G, Haldiya PK, Willighagen E, Kind T, Fiehn O: The Chemical
Translation Service–a web-based tool to improve standardization of
metabolomic reports. Bioinformatics 2010, 26:2647-8[hnlab.
ucdavis.edu:8080/cts/homePage].
54. Haider S, Ballester B, Smedley D, Zhang J, Rice P, Kasprzyk A: BioMart
Central Portal–unified access to biological data. Nucleic Acids Res 2009,
37:W23-27.
55. Rocca-Serra P, Brandizi M, Maguire E, Sklyar N, Taylor C, Begley K, Field D,
Harris S, Hide W, Hofmann O, Neumann S, Sterk P, Tong W, Sansone S: ISA
software suite: supporting standards-compliant experimental annotation
and enabling curation at the community level. Bioinformatics 2010,
26:2354-2356.
56. Biais B, Allwood JW, Deborde C, Xu Y, Maucourt M, Beauvoit B, Dunn WB,
Jacob D, Goodacre R, Rolin D, Moing A: 1H NMR, GC-EI-TOFMS, and data
set correlation for fruit metabolomics: application to spatial metabolite
analysis in melon. Anal Chem 2009, 81:2884-2894.
57. Moing A, Aharoni A, Biais B, Rogachev I, Meir S, Brodsky L, Allwood JW,
Erban A, Dunn WB, Kay L, de Koning S, de Vos CHR, Jonker H, Mumm R,
Deborde C, Maucourt M, Bernillon S, Gibon Y, Hansen TH, Husted S,
Goodacre R, Kopka J, Schjoerring JK, Rolin D, Hall R: Extensive metabolic
cross talk in melon fruit revealed by spatial and developmental
combinatorial metabolomics. New Phytol 2011, 190:683-696.
doi:10.1186/1471-2229-11-104
Cite this article as: Ferry-Dumazet et al.: MeRy-B: a web knowledgebase
for the storage, visualization, analysis and annotation of plant NMR
metabolomic profiles. BMC Plant Biology 2011 11:104.
Ferry-Dumazet et al. BMC Plant Biology 2011, 11:104
/>Page 12 of 12