báo cáo khoa học: "Fatty acid profiles and their distribution patterns in microalgae: a comprehensive analysis of more than 2000 strains from the SAG culture collection" docx
Bạn đang xem bản rút gọn của tài liệu. Xem và tải ngay bản đầy đủ của tài liệu tại đây (799.79 KB, 16 trang )
RESEARCH ARTICLE Open Access
Fatty acid profiles and their distribution patterns
in microalgae: a comprehensive analysis of more
than 2000 strains from the SAG culture collection
Imke Lang
1,2
, Ladislav Hodac
3
, Thomas Friedl
3
and Ivo Feussner
1*
Abstract
Background: Among the various biochemical markers, fatty acids or lipid profiles represent a chemically relatively
inert class of compounds that is easy to isolate from biological material. Fatty acid (FA) profiles are considered as
chemotaxonomic markers to define groups of various taxonomic ranks in flowering plants, trees and other
embryophytes.
Results: The fatty acid profiles of 2076 microalgal strains from the culture collection of algae of Göttingen
University (SAG) were determined in the stationary phase. Overall 76 different fatty acids and 10 other lipophilic
substances were identified and quantified. The obtained FA profiles were added into a database providing
information about fatty acid composition. Using this database we tested whether FA profiles are suitable as
chemotaxonomic markers. FA distribution patterns were found to reflect phylogenetic relationships at the level of
phyla and classes. In contrast, at lower taxonomic levels, e.g. between closely related species and even among
multiple isolates of the same species, FA contents may be rather variable.
Conclusion: FA distribution patterns are suitable chemotaxonomic markers to define taxa of higher rank in algae.
However, due to their extensive variation at the species level it is difficult to make predictions about the FA profile
in a novel isolate.
Background
The analysis of the overall fatty acid profiles as well as the
occurrence of fatty acids (FAs) in different lipid classes in
microalgae is an emerging field which is expected to reveal
the identification of novel FAs with a variety of new func-
tional groups [1] . Despite a number of reports has been
carried out and published, describing the contents as well
as the composition of polyunsaturated fatty acids (PUFAs)
in mostly marine microalgae [2-4], systematic approaches
that include different or even many genera of microal gae
and particularly those from freshwaters or terrestrial habi-
tats are still missing [5].
Based on current knowledge, FA composition divides
microalgae roughly into two groups, i.e. on one hand the
cyano bacteria and green algae (Ch loroph yta and Strepto-
phyta) which contain low amounts of FAs, predominantly
saturated and mono unsaturated FAs as well as trace
amounts of PUFAs, m ostly linoleic ac id (LA, 18:2(9 Z,
12Z): where x:y(z) is a fatty acid containing X carbons
and y double bonds in position z counting from the car-
boxyl end)). On the other hand Chromalveolate algae
contain significant amounts of PUFAs [6].
Among the various biochemical markers, FA or lipid
profiles represent a chemically relatively inert class of
compounds that is easy to isolate from biological material
and FA profiles are considered as chemotaxonomic mar-
kers to define groups of various taxonomic ranks in flow-
ering plants, trees and other Embryophytes [7,8].
Beside the identification of novel FAs, some recent stu-
dies report on the use of FAs and lipid profiles of algae as
biomarkers [1,9-11]. Viso et al. determined profiles of FAs
of nine different marine algal groups and they were able to
define even species-specific lipid compositions [4]. More-
over they found a roughly taxon specific profile when the
cells were cultured under identical growth conditions.
Various strains and species of the cyanobacterium Nostoc
* Correspondence:
1
Georg-August-University, Albrecht-von-Haller-Institute for Plant Sciences,
Department of Plant Biochemistry, Göttingen, Germany
Full list of author information is available at the end of the article
Lang et al. BMC Plant Biology 2011, 11:124
/>© 2011 Lang et al; licensee BioMed Central Ltd. This is an Open Access article distributed under the terms of the Creative Commons
Attribution License (http://creativecomm ons.org/licenses/by/2.0), which permits unrestricted use, distribution, and reproduct ion in
any medium, provided the original work is properly cited.
were screened for their FA content and the application of
a FA-based cluster analysis has been d escribe d for their
identification [12].
FA and lipid composition have also been used as bio-
markers to distinguish closely related microalgae a t the
species and the generic l evels [11,13]. Hitherto no sys-
tematic analysis has been carried out on a large scale basis
on either the profiles of lipids or FAs in microalgae.
Therefore, we determined the FA profiles of all available
microalgal strains of the SAG culture collection of micro-
algae http://www.e psag.uni-goettingen.de which i s one of
the most diverse and comprehensive resources of microal-
gae. At present (March 2011) 2291 strains of mainly
microscopic algae including a considerable variety of cya-
nobacteria is available. They comprise almost all phyla and
classes of eukaryotic algae, but an emphasis is put on algae
from freshwaters and terrestrial habitats.
Distribution patterns of FAs may be valuable also as a
proxy to identify certain groups, species and strains of
microalgae of particular interest for applied research, i.e.
due to the presence of certain FAs and/or high percen-
tages of total FA content. We also tested whether the
detected FA distribution patterns are meaningful in a phy-
logenetic context at various taxonomic levels, i.e. to define
taxonomic groups of microalgae by their FA patterns. It
would assist predicting FA content and/or presence of
other valuable compounds if the phylogenetic relation-
ships of algae were reflected in their FA distribution
patterns.
Here the focus was set on esterified long chain FAs (C-
14 - C-24), which were analysed via Gas chromatography
(GC) with or without mass spectrometry (MS). The large
number of data obtained, were added into a database to
document the FA profiles of the studied microalgal strains.
Results and Discussion
1. A database of FA profiles from diverse microalgae
The characterisation of FA profiles of the SAG microalgal
strains was performed by screening long chain FAs (C-14
- C-24) esterified within lipids. A total of 2076 culture
strains from t he SAG (equal 91% of the SAG’sholding)
were screened. A database was established which con-
tained all identified FAs and some other hydrophobic
metabolites. An overview of all substances identified in the
algal strains screened is shown in Table 1. A total of 86
different substances were identified by mass spectrometry,
76 of which represent methyl esters of FAs. Out of the 76
fatty acids, 36 substances were identified by their mass
spectrum and by retention time according to a standard
substance, and the other 40 fatty acids were identified by
their mass spectra only. The remaining 10 substances
were identified by their mass spectra only as well. In com-
parisons with a standard substance, the compound was
identified by comparison to mass spectra with highest
similarity to the proposed substance in the MS-library
(Nist02 or Wiley98). By this some methyl esters of
branched FAs were detected, for example 12-methyl-14:0
or 3, 7, 11, 15-tetramethyl-16:0. Whereas for most of the
FAMEs, authentic standards or MS references were avail-
able, for some oth er substances only “best hi t” identifica-
tion was possible. The DMOX derivatives enabled the
identification of the remaining 12 FAMEs. Unidentified
substances have yet to be verified with authentic stan-
dards, which are not available at this time point. The com-
plete database is shown as additional file 1.
Bacteria in algal cultures (as conta minations or some-
times even through symbiosis) are well known and can be
found in culture strains of almost any algal culture collec-
tion. Only a small fraction (about 20%) of the studied SAG
strains may be in axenic state. Therefore, also the FA con-
ten t of the contaminating bacteria may have contributed
to the obtained FA profile. To test this, we measured
methyl-15:0 and methyl 17:0 that are regarded as markers
for bacterial contaminations [4]. Only 34 strains out of the
2076 analyzed strains contained small amounts methyl-
15:0. This observed low rate of contaminating bacteria was
supported by microscopic controls which are routine in
the perpetual maintenance o f algal strains (data not
shown). In s ummary, we conclude that only 1-2% of the
strains may have been contaminated and that there is only
a minor influence of bacterial contaminations on the
observed algal culture FA profiles.
In additio n we compared the measured major FA pro-
files of 10 randomly chosen strains from different classes
with published data (Table 2), and it should be noted that
only one out of the 10 strains that were chosen fro m the
published data originated from the SAG collection. For 6
strains the FA profiles were very similar. In case of the 4
remaining strains major differences were observed in the
degree of desaturation of the FAs with different chain
lengths, which may be explained by the different cultiva-
tion conditions used in the different studies.
2. Patterns of fatty acid composition
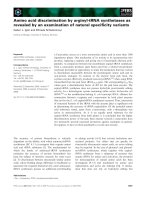
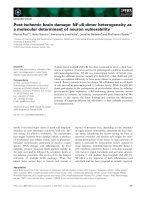
FAME profiles were rather different among strains. As an
example, FAME profiles from four different genera, i.e.
Chroococcus (Cyanob acteria), Closteriopsis ( Chlo rophyta,
Trebouxiophyceae), Pseudochantransia (Rhodophyta)
and Prymnesium (Chromalveolates, Haptophyta) are pre-
sented in Figure 1. Therefore it was anticipated to
recover certain different FA distribution patterns
between phyla, classes and genera of microalgae. In addi-
tion, it was tested whether differences in FA patterns can
also be found for groups at lo wer taxonomic rank, i.e.
between species of the same genus or even among multi-
ples isolates of the same species.
Lang et al. BMC Plant Biology 2011, 11:124
/>Page 2 of 16
2.1 Distribution of four important PUFAs among strains of
the SAG algal culture collection
The distribution patterns of FAs among and with in the
17 groups (phyla or classes) of microalgae and the cya-
nobacteria comprised by the examined strains was
investigated in more detail fo r four PUFAs which are of
high nutritional interest (Table 3). The frequency of
occurrence of these four PUFAs in a certain group of
microalgae is given as the percentage of strains with a
certain FA from all examined strains in Table 3.
Because the SAG culture collec tion focuses on micro-
scopic algae from terrestrial habitats, the Haptophyta,
Dinophyta and Phaeophyceae were just poorly repre-
sented. Therefore, the recovered distribution patterns in
Table 1 Overview of the FAMEs identified and other substances found in the analysed SAG microalgal strains
86 substances, 76 methyl esters of FAs
methyl esters of saturated straight-chain FAs methyl esters of branched chain FAs methyl esters of monoenoic FAs
14:0 12-methyl-14:0 14:1 (7Z)
16:0 13-methyl-14:0 14:1 (9Z)
17:0 14-methyl-15:0 15:1 (10Z)
18:0 14-methyl-16:0 16:1 (5Z)
19:0 methyl-3, 7, 11, 15-tetramethyl-16:0 16:1 (7Z)
20:0 16- o. 15-methyl-17:0 16:1 (9Z)
21:0 17-methyl-18:0 16:1 (11Z)
22:0 6, 10, 14 trimethyl-2-pentadecanone 17:1 (8Z)
23:0 17:1 (9Z)
24:0 17:1 (10Z)
18:1 (9E)
methyl esters of dienoic FAs methyl esters of trienoic FAs 18:1 (9Z)
15:2 16:3 (4Z,7Z,10Z) 18:1 (11Z)
16:2 (7Z,10Z) 16:3 (6Z,9Z,12Z) 19:1 (11Z)
16:2 (9Z,12Z) 16:3 (7Z,10Z,13Z) 20:1 (11Z)
17:2 (7Z,10Z) 17:3 22:1 (13Z)
17:2 (9Z,12Z) 18:3 (5Z,9Z,12Z) 24:1 (15Z)
18:2 (6Z,9Z) 18:3 (6
Z,9Z,1
2Z)
18:2 (8Z,xZ)* 18:3 (8Z,11Z,14Z)
18:2 (9E,12E) 18:3 (9Z,12Z,15Z)
18:2 (9Z,12Z) 19:3
18:2 (9Z,14Z) 19:3
18:2 (11Z,14Z) 20:3 (7Z,10Z,13Z)
19:2 (9Z,12Z) 20:3 (8Z,11Z,14Z)
20:2 (11Z,14Z) 20:3 (11Z,14Z,17Z)
22:2 (13Z,16Z) 22:3
methyl esters of tetra-, penta-, and hexaenoic FAs other substances
16:4 (4Z,7Z, 10Z, 13Z) (8Z,11Z)-heptadeca-8, 11-dienal
16:4 (6Z,9Z,12Z,15Z) 3-(3, 5-ditertbutyl-4-hydroxyphenyl) propionate
18:4 (5Z, 9Z, 12Z,15Z) 3, 7, 11, 15-tetramethyl-2-hexadecen-1-ol
18:4
(6Z,9Z,12Z,15Z) 8-(2-octylcyclopropyl) octadecanoate
19:4 2, 3, 4, 5- tetramethyl-3-hexen
20:4 (5Z,8Z,11Z,14Z)(5Z,8Z,11Z)-15, 16 epoxy 5, 8, 11-octadecadienoate
20:4 (8Z,11Z,14Z,17Z) Tetradecanamide
22:4 (7Z,10Z,13Z,16Z) Hexadecanamide
18:5 (3Z,6Z,9Z,12Z,15Z)(9Z)-Octadecenamide
20:5 (5Z,8Z,11Z,14Z,17Z) 9, 10-methylene tetradecanoate
22:5 (4Z,7Z,10Z,13Z,16Z)
22:5 (7Z,10Z,13Z,16Z,19Z)
22:6 (4Z,7Z,10Z,13Z,16Z,19Z)
For the marked (*) FAMEs the double bond positions were only tentatively assigned.
Lang et al. BMC Plant Biology 2011, 11:124
/>Page 3 of 16
these and other poorly represented groups may not be
representative for the whole group. For instan ce, for
Phaeophyceae mainly microscopic forms (e.g., Ectocar-
pus and the freshwater gen us Bodanella) were available
and the examined Rhodophyta strains covered mo stly
freshwater forms or those from terrestrial habitats (e.g.,
Porphyridium). Although diatoms are very diverse in
terrestrial habitats, the examined small sample of avail-
able diatom strains (18) does by far not adequately
represent this group which is probably the most species-
rich algal group. Also, for each of the two classes of
Stramenopiles (heterokont algae), Phaeothamniophyceae
and Raphidophyceae, just two strains are m aintained at
the SAG and, therefore, are not further discussed here.
Similarly, there is only a single strain of Chlora rachnio-
phyta (Rhizaria supergroup) in the SAG.
The very long chain PUFA do cosahexaenoic acid
(DHA, 22:6(4Z,7Z,10Z,13Z,16Z,19Z)) was t he third
most frequent FA, present in 15 out of 20 examined
groups (Table 3). In the Dinophyta, Haptophyta and
Euglenoids DHA-containing strains were particularly fre-
quentandDHAwasfoundthere in relatively high per-
cent ages of total FA co ntent, i.e. in 60% or more of these
strains the DHA proportion was higher than 5%. In the
single studied dinophyte strain of Ceratium horridum the
DHA proportion was even 29.3%. In the other groups
DHA was found in rather low frequencies and also
mostly in rather small proportions, i.e. less than 1% of
total FA cont ent. Although DHA was found in the Cryp-
tophyta and Bacillariophyceae in about every fifth strain,
its percentage of total FA content was less than 5% there,
except in Cryptomonas baltica SAG 18.80 (Cryptophyta)
where it is was 13.7%. Despite DHA was found in rather
low frequencies in the green algae (Chlorophyta), the sec-
ond highest DHA content of all SAG strains, 18.9% of
total FA, was found in the chlorophyte Chlorococcum
Table 2 Comparison of the major FA composition of algae observed in this study against data published previously
Species FA (% of total) Ref
14:0 16:0 16:1 16:2 16:3 16:4 18:0 18:1 18:2 18:3 18:4 20:4 20:5 22:6
Bacillariophyceae
Phaeodactylum 9.2 26.8 45.4 - - - 0.7 4.6 - - - - 12.3 1.1 a
tricornutum 9.4 23.7 35.8 - - - 6.0 3.3 4.4 3.2 0.2 - 13.3 0.9 b
6.7 14.7 43.6 2.0 - - - 15.8 0.5 0.4 1.1 - 14.4 0.7 e
Thalassiosira weissflogii 25.9 28.8 28.7 - - 7.4 1.5 3.3 - 0.3 - - 4.0 0.1 b
8.8 36.6 40.5 - - - - 14.0 - - - - - - e
Chlorophyceae
Dunaliella primolecta 0.4 21.8 4.5 0.9 2.5 12.3 0.8 6.4 6.2 41.1 4.1 - - - b
0.6 26.0 0.9 - - - 1.6 16.3 7.0 38.7 0.6 - - - e
Nannochloris sp. 1.8 15.1 16.6 - 0.2 - 1.0 57.7 0.6 0.8 0.3 5.9 - - b
13.3 17.8 - - - - - 23.9 10.8 28.2 6.1 - - - e
Parietochloris incisa - 10.0 2.0 1.0 1.0 - 3.0 16.0 17.0 3.0 - 46.0 1.0 - c
0 19.8 - 5.2 - - 18.2 10.2 14.3 14.3 - 14.0 4.3 - e
Cyanophyceae
Nostoc commune 0.3 43.5 11.3 0.4 - - 1.5 6.9 19.3 16.3 - - - - d
- 25.3 24.1 - - - - - 12.5 38.1 - - - - e
Synechocystis sp. 13.4 26.5 43.6 - - - 3.5 8.0 0.2 4.7 - - - - b
42.5 18.8 30.1 - - - - - - 14.2 - - - - e
Haptophyceae
Pavlova lutheri 11.8 23.6 28.3 - - - 2.0 12.4 - - - - 12.1 9.7 a
10.1 11.1 26.3 - - - - 5.2 0.6 0.5 9.1 0.3 18.0 9.7 e
Prymnesiophyceae
Emiliana huxleyi 41.7 17.7 5.5 - - - 2.1 21.7 0.9 5.5 5.0 - - - b
18.8 10.3 - - - - 10.8 42.2 - - 8.7 - - 9.2 e
Raphidophyceae
Heterosigma akashiwo 6.2 46.3 21.3 - - 0.4 0.5 2.7 1.6 4.2 7.3 - 8.7 0.7 b
6.6 40.0 12.7 4.0 - - - - 4.5 6.7 5.2 3.5 14.8 - e
a[3]
b[4]
c [20]
d [12]
e this work
Lang et al. BMC Plant Biology 2011, 11:124
/>Page 4 of 16
novae-angliae SAG 5.85, followed by the trebouxio phyte
Prototheca zopfii SAG 263-8 with 14.2%. Together these
find ings are in accordance with DHA amounts described
before for specific groups of alga [3,4,14,15].
Eicosapentaenoic acid (EPA, 20:5(5Z,8Z,11Z,14Z,
17Z)) was one of the most common PUFAs, found in all
of the 17 groups covered by our study (Table 3). EPA-
containing stra ins were particularly frequen t in the
Eustigmatophyceae, Glaucophyta, Xanthophyceae and
Rhodophyta. The highest EPA propor tions of total FA
content were in the Rhodophyta, with about 81% of the
strains exhibiting more than 10% EPA. The highest
values were 52.4% in Compsopogonopsis leptoclados
SAG 106.79 and 44.9% in Acrochaetium virgatulum
SAG 1.81. Also strains of three species of Porphyridium
contained high amounts of EPA (31.2% in P. sordidum
SAG O 500, 27.5% i n P. aerugineum SAG 110.79, 26.7%
in P. purpureum SAG1380-1a).Thisisinagreement
with a report on P. cruentum suggesting that red algae
are a rich source of EPA [16]. Despite EPA was rather
frequently found in the Glaucophyta, only about half of
all st rains had EPA pro portions greater than 10% (maxi-
mum 31.1% in Glaucocystis nostochinearum SAG 28.80).
This is in agreement with another study which showed
high amounts of EPA (besides ARA) in the glaucophyte
Cyanophora paradoxa [17]. The highest percentage
(87%) of strains with an EPA proportion of greater than
10% was in the Dinophyta, but with a maximum of just
24.3% in Pyrocystis lunula SA G 2014. In the Euglenoids,
Xantho phyceae and Eustigmatophyceae about 67% of all
strains had an EPA proportion of greater than 10% with
maximum values of about 31% (31.4% in Heterococcus
fuornensis SAG 835-5, 31.6% in Euglena proxima SAG
1224-11a) and 34.6% in Goniochloris sculpta SAG 29.96.
EPA was rarely found and mostly in insignificant
amounts (< 5%) in most green algae, but three strains
had an exceptionally higher content of about 20% of
total FAs (24.2%, Chlorella sp. SAG 242.80; 24.0%, Chla-
mydomonas allensworthii SAG 28.98; 22.3%, Cylindro-
capsa involuta SAG 314-1). EPA w as the only FA
recovered from Chlorarachnion re pens SAG 26.97
(Chlorarachniophyta). That Xanthophyceae and Eustig-
matophyc eae contain EPA in relatively high proportions
while gr een algae rarely accumulate EPA supports pre-
vious studies [3,4,14,15,18].
Arachidonic acid (ARA, 20:4(5Z,8Z,11Z,14Z)) was
most frequently found in the Phaeophyceae where it
was p resent in all strains except one investigated strain
(Table 3); in about 54% of all Phaeophyceae strains the
proportion of ARA was higher than 10%, but with a
maximum of just 17.7% in Halopteris filicina SAG
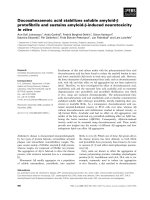
Figure 1 Representative gas chromatograms of fatty acid
methyl esters from four species belonging to different algal
groups. a) Cyanobacteria, Chroococcus minutus SAG 41.79; b)
Chlorophyta, Closteriopsis acicularis SAG 11.86; c) Rhodophyta,
Pseudochantransia spec. SAG 14.96; d) Chromalveolates
(Haptophyta), Prymnesium parvum SAG 127.79. Fatty acid methyl
esters: a) 14:0, b) 14:1n-5, c) 16:0, d) 16:1n-9, e) 16:1n-7, f) 16:2n-6, g)
16:4n-3, h) 18:0, i) 18:1n-9, j) 18:1n-7, k) 18:2n-6, l) 18:3n-6, m) 18:3n-
3, n) 18:4n-3, o) 18:5n-3, p) 20:3n-6, q) 20:4n-6, r) 20:5n-3, s) 22:5n-3,
t) 22:6n-3.
Lang et al. BMC Plant Biology 2011, 11:124
/>Page 5 of 16
10.96. ARA had the highest pr oportion of total FA in
the Rhodophyta; there even about 77% of all strains had
an ARA content of more than 10% with a maximum of
68.3% in Pseudochantransia sp. SAG 19.96. Interestingly,
the ARA content was rather high but variable among
the eight examined multiple isolates of the rhodophyte
Porphyridium purpureum.WhiletheaverageARApro-
portion was about 31% in six strains, it was just 3.8% in
SAG 1380-1d, but 44.5% in SAG 1380-1e. We have no
explanation for this variation yet; both strains were iso-
lated from marine habitats and are kept under the same
culture conditions. High proportions of ARA (as well as
EPA) were already found characteristic of another spe-
cies of Porphyridium cruentum [16]. ARA was present
in about half of all investigated Euglenoid strains and
with relatively high proportions of total F A content, i.e.
about one third of the strains exhibited more than 5%
ARA with extraordinarily high values of 41.3% and
34.3% in Rhabdo monas incurva SAG 1271-8 and Khaw-
kinea quartana SAG 1204-9. Interestingly, another
strain of the same species K. quartana, SAG 1204-9,
had less than half (13.3%) of ARA content and in five
other species of Rhabdomonas no ARA was detected.
This demonstrate s that FA contents may be rat her vari-
able between species of the same genus and even among
multiple isolates of the sam e species. Although a bout
half of all examined strains for the Xanthophyceae and
Eustigmatophyceae contained ARA (Ta ble 3), they had
this FA in relatively low proportions. Only one fourth of
the ARA-containing Xanthophy ceae strains exhibited
more than 5% and in the Eustigmatophyceae even no
strain reached 5%. ARA was rarely found in the green
algae, i.e. with an average frequency of about 14% in the
phyla Chlorophyta and Streptophyta, except for prasino-
phyte green algae where ARA was present in 42.9% of
all strains (Table 3). However, there were a few single
green algal examples with extraordinarily high ARA
contents, i.e. 73.8% (co rresponding to 102 μg/mg of dry
weight , the highest ARA content detected in all investi-
gated SAG strains) in the chlorophyte Palmodictyon var-
ium SAG 3.92, followed by 52.9% in the chlorophyte
Trochisciopsis tetraspora SAG 19.95 and 51.8% in the
trebouxiophyte Myrmecia bisecta SAG 2043. That a
high ARA conte nt was f ound in the latter strain is in
agreement with that it has been found a close rela tive
with Pa rietochloris incisa (syn. Lobosphaeropsis incisa,
Myrmecia incisa) [19]. P. incisa has been assigned an
“oleaginous microalga” and the richest plant source of
ARA known so far due to its capability to accumulate
high amounts of ARA (up to 59% of its total FA con-
tent) [20]. Interestingly, the SAG strain of P. incisa
(Lobosphaera incisa SAG 2007) had with 13.2% a much
lower ARA content (Table 2).
g-Linoleni c acid (GLA, 18:3(6Z,9Z,12Z)) was the third
most common FA in the studied sample of SAG microal-
gal strains, missing only in the Haptophyta, Dinophyta
and Euglenoids (Table 3). It was most frequently detected
in two lineages of green al gae, the prasinophytes and the
Streptophyta. In prasinophytes, however, GLA was pre-
sent only in one out of five genera available for that
Table 3 Frequency of four selected PUFAs in 17 taxonomic groups of microalgae on which the examined 2071 strains
of the SAG culture collection were distributed, and the size of each group (in total number of strains)
no. of strains DHA EPA ARA GLA
Cyanobacteria 223 1.3 0.9 0.4 12.1
Plantae Glaucophyta 15 80.0 46.7 6.7
Chlorophyta Chlorophyceae 927 5.1 6.9 5.7 26.2
Trebouxiophyceae 253 4.3 16.6 22.9 6.3
Ulvophyceae 70 4.3 22.9 12.9 7.1
prasinophytes 21 14.3 33.3 42.9 57.1
Charophyta 159 1.3 17.6 13.8 31.4
Rhodophyta 78 70.5 67.9 3.8
Excavates Euglenoids 131 42.7 44.3 51.1
Chromalveolates Stramenopiles Bacillariophyceae 18 22.2 44.4 11.1 11.1
Xanthophyceae 81 4.9 75.3 49.4 16.1
Eustigmatophyceae 17 88.2 41.2 5.9
Phaeophyceae 12 58.3 91.7 16.7
Chryso-/Synurophyceae 12 16.7 33.3 8.3 16.7
Haptophyta 13 84.6 61.5 7.7
Cryptophyta Cryptophyta 27 22.2 66.7 3.7 3.7
Alveolates Dinophyta 14 64.3 57.1 14.3
2071
The frequency of PUFAs is shown as the percentage of the total number of strains examined per group.
Lang et al. BMC Plant Biology 2011, 11:124
/>Page 6 of 16
group, Tetraselmis, and there in 12 out of the 17 available
strains and with variable proportions, i.e. 0.5 - 7.3% of
total FA content. In the Streptophyta, GLA was more
widely distributed, i.e. it was detected in 17 out of 41
examined genera. GLA distribution was rather variable
within strains and species of a certain streptophyte
genus, similar to findings of ARA in other genera. Rela-
tively high percentages of GLA were found in species/
strains of Closterium (16.5% in C. baillyanum SAG 50.89,
8% in C. lunula SAG 7.84), but GLA was not found in
the other 12 strains of that genus. Similarly, in the many
strains available for Cosmarium (25) and Micrasterias
(16), GLA was found in only 11 and 2 strains, respec-
tively. The highest percentages of GLA were found in the
green algal class Chlorophycea e (29.9% in Deasonia mul-
tinucleata SAG 25.95, 28.5% in Desmodesmus multifor-
mis SAG 26.91) and in Cyanobacteria (24.8% in Spirulina
maxima SAG 84.79). In a bout one third (32%) of all
chlorophyte GLA strains this FA had precentages of 5%
and higher. Distribution of GLA in the cyanobacteria was
rather patchy, i.e. the 27 cyanobacteria strains with GLA
were mainly restricted to three genera, Calothrix (8
strains), Microcystis (7 strains) and Spirulina (6 strains).
Also within each of these genera the GLA percentages
were quite variable, e.g. in Spirulina it varied from 4.6%
to 24.8%, and three strains where without GLA. FA com-
position has previously been used to discriminate cyano-
bacteria in isolates and natural samples at the generic
level [21,22]. To discriminate species of cyanobact eria, as
an additional marker the hydrocarbon composition was
used in an earlier study, but in our study we failed to
detect any substance out of this group [23]. Interestingly,
GLA was the only FA that was detected in more than
three out of the 223 examined strains. Therefore, the
SAG cyanobacteria strains may be roughly divided into
those with GLA present (few genera) and those where
almost no PUFAs were present. This corresponds to the
earlier findings that described a bipartition of cyanobac-
teria, independent of their taxonomic position, into gen-
era producing C-18 PUFA and those which do not
[24,25].
TheprasinophytegenusTetraselmis presented an
interesting example to test for FA variation among clo-
sely related isolates. Nine strains assigned to that genus
have been isolated from the same (marine) locality and
regarded as the same species by the isolator (U.G.
Schlösser, pers. comm.). Only in two strains DHA was
present, but in very small traces (0.3% and 0.4%). In
contrast, ARA and GLA were found in all isolates with
percentages varying from 0.8% to 2.7% and 0.5% to
7.3%, respectively.
2.2 Analysis of FA distribution patterns
The detected fatty acid (FA) composition of the 2076
investigated strains was statistically a nalyzed to test
whether certain patterns of FA distribution among the
various investigated algal groups are present that may
correspond to their phylogenetic relationships. In a first
set of three analyses (higher taxonomic levels) it was
tested 1) whether FA distribution patterns may reflect
differences among algal phyla derived from primary
(Plantae supergroup) or secondary endocytobiosis (Chro-
malveolates, Euglenoids) compared to cyanobacteria
representing the plastid origin, 2) the distinction of phyla
within the Plantae supergroup (Chlorophyta, Strepto-
phyta, Rhodophyta/Glaucophyta) and 3) major evolution-
ary lineages (classes) within the Chlorophyta. A second
set of analyses focused at the generic level, i.e.it was
tested whether separation of genera as based on previous
18S rDNA sequence analyses suggested for Chlamydo-
monas s.l., Chlorella s.l. and Scenedesmus s.l. are reflected
in the FA distribution patterns. For the first set of ana-
lyses the many species (266) which were represe nted as
multiple strains (e.g., Chlamydo monas moewusii, 28) had
to be reduced to only a single strain per species to avoid
biases. This included also the multiple strains unidenti-
fied at the species level, i.e. labelled with “ sp.” instead a
species name (e.g., Chlorogonium sp., 26). The SAG’s
Chl orophyta strains were part icularly rich in such multi-
ple strains. Also excluded were those strains where only a
single FA was detected. This reduced the total number of
strains considered in our calculations to 1193. The
strains were then divided into eleven groups roughly cor-
responding to phy la or classes (Additional file 2). Strains
belonging to the Chlorophyta ( 61% of all investigated
strains) were further subdivided into the three c lasses,
Chlorophyceae, Trebouxiophyceae, and Ulvophyceae,
whereas the prasinophyte SAG green algal strains (1.7%
of all considered Chlorophyta strains) were excluded
from the analyses because they comprised only very few
specie s (10). The strains of Glaucophyta (1 5) and Rhodo-
phyta (81) were collectively treated as one composite
unit. The Rhizaria - Chlorarachniophyta, was represented
just by a single strain and, thus, was omitted from th e
statistical analyses.
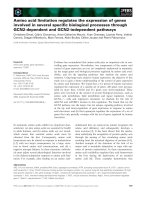
Higher taxonomic levels analyses It was te sted whether
distribution patterns of FA composition on the investi-
gated strains delineate the three “ super groups” of
eukaryotic algae, Plantae, Chromalveolates and Exca-
vates (Euglenoids), and the cyanobacteria from each
other. The Plantae super group comprises exclusively
eukaryotes with plastids derived from primary endocyto-
biosis, i.e. a cyanobacterium was transformed into an
organelle through uptake and retention by the host cell
followed by the loss of much of its genome [26]. Chro-
malveolate algae as well as the Euglenoids (the only
algal lineage of Excavates) acquired their plastids
through secondary endocytobiosis from rhodophyte and
a green alga, respectively [26,27]. To consider almost
Lang et al. BMC Plant Biology 2011, 11:124
/>Page 7 of 16
equa l numbers of strains for all four gr oups, 100 strains
of Plantae, Chromalveol ates and Cyanobacteria were
randomly selected which closely amounts the total num-
ber of considered euglenoi d strains (73). The o rdina tion
which resulted from CVA (Canonical Variates Analysis,
multigroup discriminant analysis) pointed out a strong
difference between cyanobacteria/primary endocytobiosis
(Plantae) and the two groups representing secondary
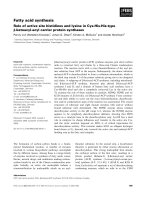
endocytobiosis (Chromal veolates/Euglenoids) (Figure 2).
The observed difference was without exception
supported by non-parametric significance tests for mul-
tidimensional data (NP-MANOVA and ANOSIM). Fol-
lowing SIMPER, the lowest observed dissimilarity
(63.55%) was between Cyanobacteria and Plantae, while
the highest (77.29%) was between Plantae and Chromal-
veolates. The first canonica l variate (CV1) involved
99.99% of all possible differences among t he four
groups, hence we examined for possible c orrelations
between this axis and FAs. Four FAs were significantly
and exclusively correlated with the first canonical variate
Figure 2 Discrimination of cyanobacteria and three algal eukaryotic supergroups (Plantae, Chromalveolates, Excavates/Euglenoids) as
based on fatty acid distribution patterns of 373 investigated cyanobacterial and algal strains using Canonical Variates Analysis. The
two vectors shown indicate FAs significantly correlated with canonical axis 1. Lines encircle 95% of members of a particular group. Circles,
Cyanobacteria; crosses, Plantae; arrowheads, Excavates/Euglenoids; diamonds, Chromalveolates.
Lang et al. BMC Plant Biology 2011, 11:124
/>Page 8 of 16
(CV1), i.e. 16:0 (r
CV1
= -0.61/p < 0.001), 18:2(9Z,12Z)
(r
CV1
= -0.46/p < 0.001), 9-octadecanamid (r
CV1
= 0.41/
p < 0.001), and 18:1(9Z)(r
CV1
= -0.17/p = 0.001). In a
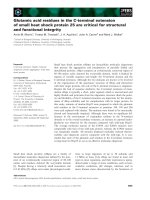
second analysis it was tested whether FA distribution
patterns distinguish phyla of the Plantae super group,
i.e. the two lineages of green algae, Chlorophyta and
Streptophyta [28,29], and the composite Rhodophyta/
Glaucophyta group. Because the latter was with 54
strains the smallest group, it was compared with equally
large random s amples from ea ch the Chlorophyta and
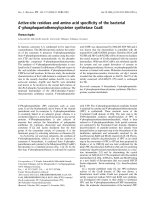
Streptophyta (Table 3). The ordination diagram from a
CVA of the total of 162 investigated strains c learly sepa-
rated the Rhodophyta/Glaucophyta group from both
green algal phyla (Figure 3). CV1 involved 79% of all pos-
sible differences and even CV2 was with 21% not negligi-
ble. The significance tests, NP-MANOVA and ANOSIM,
supported the distinction of all three groups. SIMPER
showed the Rhodophyta/Glaucophyta composite group
Figure 3 Discrimination of 162 algal strains of the Plantae supergroup into three subgroups representing the Rhodophyta/
Glaucophyta composite group (arrowheads) and both green algal phyla, Chlorophyta (diamonds) and Streptophyta (circles) as based
on their fatty acid distribution patterns using Canonical Variates Analysis. The vectors shown indicate FAs significantly correlated with CV1
and CV2. Lines encircle 95% of members of a particular group.
Lang et al. BMC Plant Biology 2011, 11:124
/>Page 9 of 16
rather dissimilar from both green algal phyla, i.e. there
were dissimilarities of 70.55% and 71.53% with the Chlor-
ophyta and Streptophyta, respectively. The lowest dissim-
ilarity ( 55.41%) among the three tested groups was
between C hlorophyta and Streptophyta. There were f ive
FAs significantly and exclusively correlated with CV1, i.e.
18:3(9Z,12Z,15Z)(r
CV1
= 0.77/p < 0.001), 20:4 (r
CV1
=
-0.49/p < 0.001), 20:5(5Z,8Z,11Z,14Z,17Z)(r
CV1
=
-0.59/p < 0.001), 18:1(9Z)(r
CV1
= 0.30/p = 0.001) and
16:0 ( r
CV1
= -0.56/p = 0, 001). Two FAs were correlated
exclusively with CV2, i.e. they discriminated Chlorophyta
and Streptophyta, 18:1(9Z)(r
CV2
= -0.4477/p < 0 .001)
and 9-octadecanamid (r
CV2
= 0.34/p < 0.001). The by far
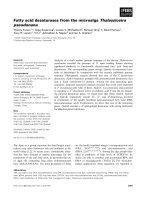
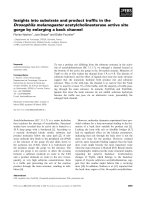
largest fraction of all considered strains (60.3%) were
from the Chlorophyta which made it interesting to test
whether FA distribution patterns can discriminate
between the three classes of Chlorophyta, the Chlorophy-
ceae, Trebouxiophyceae and Ulvophyceae. Ulvophyceae
was the smallest of the three with just 49 strains and,
therefore, random samples of almost the same size (54)
from each of the other two classes were used for the s ta-
tistical analyses. The CVA did not reveal any distinct
groups, i.e. the analyzed strains tended to form three
groups corresponding to the three green algal classes, but
with a considerable overlap among them (Figure 4).
However, the three classes were found significantly dis-
tinct from each other in both employed significance tests
and SIMPER. The latter and correlation analyses allowed
to consider 9-octadecanamid (r
CV1
= -0.58/p < 0.001;
r
CV2
= -0.22/p < 0.010) and the FA 18:2(9Z,12Z)(r
CV1
=
-0.44/p < 0.001; r
CV2
= -0.53/p < 0.001) as the only vari-
ables to discriminate well Ulvophyceae from Chlorophy-
ceae/Trebouxiophyceae and Trebouxiophyceae from
Ulvophyceae/Chlorophyceae, respectively.
Generic level analyse s The three previous analyses
showed that phylogenetic relationships at the level of
phyla and classes among algal groups were reflected in FA
distribution patterns us ing a large sample of strains.
Therefore, in a second group of analyses, we tested
whether differences in FA distribution patterns may
resolve the same distinction of genera as in rRNA gen e
sequence analyses. To test this, we selected three genera
which are widely used in biotechnological applications and
well represented by SAG strains, i.e. Chlorella s.l., Scene-
desmus s.l.andChlamydomonas s.l Recent18S rRNA
gene sequence analyses revealed each of the three as para-
or polyphyletic assemblages encompassing several distinct
genera. For Chlamydomonas we selected 17 species
(53 strains ), out of which 9 were represented by multiple
strains (e.g., C. reinhardtii, 16), which were distributed on
five independent lineages/clades (= genera) in the 18S
rDNA phylogeny [30]. To better represent the “Oogamo-
chlamys“ clade also two strains from the UTEX collection
(2213, 1753) were included. The NMDS ordination clearly
separated the members of the “Reinhar dtii“ clade (upper
right in Figure 5), except for three strains, from those of
the “Chloromonas“ clade (lower left in Figure 5). However,
the “Chloromonas“ group as revealed by the FA patterns
also included the three investigated strains of the “Moewu-
sii“ and four of the “Oogamochlamys“ clades which was in
contrast to the 18S rDNA phylogenies of [30]. Also in
contrast to the rDNA phylogenies, the FA analyses split
the genus Lobochlamys,i.e.L. culleus was part of the
“ Chloromonas “ group while L. segnis belonged to the
“Reinhardtii“ group. Strains of Oogamochlamys were also
separated on both FA groups, in contrast to their species
assignments as based on the 18S rDNA analyses.
Species and strains formerly assigned to a single genus
Scenedesmus were shown to be actually distributed on sev-
eral genera by rRNA gene sequence analyses. For example,
the ge nus Acutodesmus has been segregate d from Scene-
desm us [31,32]. A NMDS ordination plot of FA distribu-
tion patterns revealed a tendency among the studied
strains to be distributed on two clusters, i.e. one cluster of
8strainsofAcutodesmus (mainly including multiple
strains of A. obliquus) was clearly separated from another
cluster containing mainly strains of Scenedesmus s.str.
(Figure 6). The multiple strains of S. vacuolatus were
grouped together with four other st rains of the genus,
except for SAG 211-11n which was close to the Acutodes-
mus cluster. The multiple strains of A. obliquus, however,
were distributed on both clusters (Figure 6). Seven strains
of A. obliquus mainly formed up the Acutodesmus cluster,
whereas five other A.
obliquus strains grouped together
with strains of Scenedesmus s.str. This means that within
the same green algal species, A. obliquus, two distinct FA
patterns exist. AFLP fingerprints already showed extensive
genetic variation among the multiple strains of A. obliquus
while ITS2 rDNA sequen ce comparisons demonstrated
conspecificity of the multiple strains, except for SAG 276-
20 (T. Friedl, unpubl. observation). Therefore, the finding
of A. obliquus strains being separated in two FA pattern
groups favours the view that genetic differences resolved
by AFLPs may correspond to different phenotypic proper-
ties. Consequently, it may be crucial to carefully record
which strain has been used in any application [33].
Though strain SAG 276-20 was found not to belong to
the same species, A. obliquus, its FA pattern suggests that
it may still be a member of Acutodesmus because it was
grouped in the Acutodesmus cluster (Figure 6).
Chlorella vulgaris forms another example where exten-
sive genetic variation am ong multiple strains of the same
species has been detected by AFLP analyses [33]. The 15
multiple SAG st rains of C. vulgaris were compared to 19
other Chlorella and Chlorella-like strains, i.e. their closest
relatives as seen in 18S rDNA phylogenies, C. sorokiniana
Lang et al. BMC Plant Biology 2011, 11:124
/>Page 10 of 16
and C. lobophora,membersoftheParachlorella clade
sensu [34] as well as more distantly related strains, i.e.
from the Watanabea and Prasiola c lades sensu [35].
NMDS ordination based on FA distribution pattern
showed almost no variation within the multiple strains of
C. vulgaris and clustered them together, except for strain
SAG 211-1e (Figure 7). Another cluster distant from C.
vulgaris was formed by members of the Watanabea-
clade, whereas Chlorella-like algae of the Prasiola-clade
were not clustered together.
Conclusion
The algae collection at the SAG represen ts a va luable
resource of natural productsasshowninthepresent
study for FAs and other hydrophobic metabolites. Sev-
eral general trends in FA distribution re flect phyloge-
netic relationships among phyla and cl asses as seen in
genomic an d molecular phylogenies and this makes FA
distribution patterns an additional feature to define taxa
of higher rank in algae. However the FA profile alone
may be no useful marker to distinguish among different
Figure 4 Discrimination of 162 alg al strains of the Chlorophyta into three subgroups representing the three green algal classes
Chlorophyceae (diamonds), Trebouxiophyceae (arrowheads) and Ulvophyceae (circles) as based on their fatty acid distribution
patterns using Canonical Variates Analysis. Both vectors correspond to variables (fatty acids) correlated with both canonical axes. Lines
encircle 65% of members of a particular group.
Lang et al. BMC Plant Biology 2011, 11:124
/>Page 11 of 16
genera and speci es. For this , the compari son of furt her
metabolites, like sterols, entire lipids and hydrocarbons
should be consider ed. Thus, PUFA contents in microal-
gae are rather difficult to predict at the levels of genera
and species, making it difficult to select appropriate
strains for b iot echnological research/applications which
aim at yielding high lipid contents. Therefore, each addi-
tional or novel isolate will be worth of examination for
its PUFA content.
Methods
Preparation of microalgal cultures
The microalgal cells were harvested from cultures at the
stationary phase and stored at -20°C. Stationary phase
was reached after different periods of culturing ranging
from three months to about one year, depending on t he
strain-specific SAG’s standard maintenance protocols.
Before FA extraction t he algal material was lyophilised
for two days until the cell pellets were totally dry.
Figure 5 Distinction of 54 strains previously assigned to Chlamydomonas s.l. (Chlorophyceae), into the “Reinhardtii“ (upper right) and
“Chloromonas“ (lower left) groups as based on fatty acid distribution patterns (non-metric multidimensional scaling, NMDS;
Manhattan distance, Kruskal’s stress = 0.17). Symbols indicate the lineages and genera as resolved in the rDNA analyses of Pröschold et al.
(2001); circles, “Reinhardtii“ clade; empty arrowheads, Lobochlamys; filled circles, Oogamochlamys; filled arrowheads, Chloromonas; filled arrowhead
down, “Moewusii“ clade.
Lang et al. BMC Plant Biology 2011, 11:124
/>Page 12 of 16
Alkaline hydrolysis, transesterification and extraction of
FA methyl esters (FAMEs)
Prior to FAME extraction the dry weight of lyophilised
algal material was determined and then the samples were
transferred into a 2 ml tube. The samples were extracted
by adding 405 μl of methanol/toluol 2: 1 (v/v) followed by
homogenisation of t he cells with a potter (Heidolph RZR
2020, Schwabach) for 30 s. To avoid autoxidation, the
samples were overlaid with argon. As internal standard,
10 μg of tripentadecanoate (diluted in 10 μltoluol)was
added. Transesterification of lipid bound FAs to their
corresponding FAMEs was accomplished b y adding
150 μl sodium metho xide [36]. After 20 min shaking at
RT t he FAMEs were extracted two times with 500 μln-
hexane and 500 μl 1 M NaCl. The hexane phases were
transferred into a 1.5 ml tube and dried under streami ng
nitrogen. Finally the FAMEs were redissolved in 10 μl
acetonitrile and analysed by GC.
Preparation of 4, 4-dimethyloxaline (DMOX) derivatives
The position of double bonds of unknown FAME iso-
mers was determined by analysing the corresponding
Figure 6 Separation of Acutodesmus (empty circles) from Scenedesmus s.str. strains (filled arrowheads) as seen in FA pattern
distribution. Multiple strains of A. obliquus are indicated by abbreviation “Aobl”, those of S. vacuolatus by “Svac”. E, P, T, strains of the genera
Enallax, Pectinodesmus and Tetradesmus (Non-metric multidimensional scaling, NMDS; Manhattan distance, Kruskal’s stress = 0.16).
Lang et al. BMC Plant Biology 2011, 11:124
/>Page 13 of 16
DMOX derivatives to allow identification by MS [37].
FAMEs were prepared as described, but the hexane
phases were transferred into a 1.5 ml glass tube. Sam-
ples were dried under streaming nitrogen and 200 μl2-
alkenyl-4, 4-dimethyloxazoline (Sigma, München) were
added. After incubation at 180°C over night in a heating
block, the samples were cooled to RT and transferred
with 2 ml dichloromethane into a 12 ml glass tube and
reextr acted with 5 ml hexane and 2 ml water. The hex-
ane phase was dried under streaming nitrogen and
redissolved with 50 μl chloroform. The DMOX deriva-
tives were separated on a 20 cm × 20 cm silica gel 60
TLC plate (Merck) with petrol ether/diethyl ether 2:1
(v/v) as a developing solvent. The plate was sprayed
with 0.2% 8-anilino-1-naphthalene-sulfonic acid to
visualize the DMOX derivatives under UV-light. The
blue/yellow band of the DMOX derivatives was scraped
out and the derivatives extracted by consecutive addition
of 0.4 ml water, 2 ml methanol, 2 ml chloroform and 2
ml saturated NaCl solution. Between each step the
Figure 7 Comparison of FA patterns of multiple strains of Chlorella vulgaris (arrowheads) and their closer relatives (filled circles) with
more distantly related Chlorella-like green algae of the Watanabea- (empty circles) and Prasiola-clades (diamonds) sensu Darienko et
al., 2010 (non-metric multidimensional scaling, NMDS; Manhattan distance, Kruskal’s stress = 0.12).
Lang et al. BMC Plant Biology 2011, 11:124
/>Page 14 of 16
sample was vigorously mixed and finall y centrifuged for
5 m in at 3220 × g to separ ate phases. The lower phase
was transferred into a new glass tube and dried under
nitrogen stream, redissolved in 10 μl acetonitrile and
analysed with GC/MS.
Identification of FAMEs by GC with flame ionisation
detection (FID)
The prepared FAMEs were analysed by GC/FID using a
capillary DB-23 column (30 m × 0.25 mm, 0.25 μmcoat-
ing thickness, J&W, Scientif ic, Agilent, Waldbronn)
according to H ornung et al. (2002). Helium was used as
carrier gas with a flow of 0.1 ml/min. The temperature
gradient was 150°C for 1 min, 150-200°C at 4 K/min, 200-
250°C at 5 K/min and 250°C for 6 min. Tripentadecanoate
was added to each sample for quantification and the
FAMEs were identified according to the retention time of
the correspondin g peaks in the standard “F.A.M.E. Mix
C4-C24” (Sigma, München), which was injected before
every 50
th
run. The injection volume depended on the
concentration of FAMEs within in the sample.
Identification of FAMEs by GC/MS
FID signals which were not identified by their retention
times on GC and either represented FAMEs or other
unpolar substances were further analy sed by their mass
spectra using a 6890 Gas Chromatograph/5973 Mass
Selective Detector system (Agilent, Waldbronn). The
GC/MS conditions were the same as for GC-analysis.
The electron energy was 70 eV, the ion source tempera-
ture 230°C, and the temperature for the transfer line
added up to 260°C. The identification of unknown sub-
stances was done by comparison of the obtained mass
spectra with the mass s pectra library NIST98 and the
“ Lipid Library” of the Scottish Crop Science research
Institute />Analysis of FAMEs
All chromatograms of the microalgal samples were ana-
lysed by using the ChemStation software version 9.03
(Agilent, Waldbronn). All peaks spanning a peak area of
more than 50 units were integrated. The amount of each
FAME was calculated using a defined amount (1 μg) of
the internal standard tripentadecanoate and the dry weight
(DW) of each sample: area of peak × 1 μg/area of tripenta-
decanoate/mg d.w = μgFAME/mgDW
Statistical analyses of FA distribution patterns
For each detected fatty acid (FA) its percentage of the
total FA content of a strain was used as variable. For the
investigation of the general structure of the data sets,
common indirect ordination techniques were used, i.e.
Principal Components Analysis (PCA), Correspondence
and Detrended Correspondence Analysis, and Non-
Metric Multidimensional Scaling (NMDS). The signifi-
cance of the differences among a priori predefined algal
groups were tested using non-parametric multidimen-
sional significance tests (Non-Parametric Multivariate
Analysis of Variance, Analysis of Similarity) and visua-
lised as ordinations from multigroup discriminant analy-
sis (Canonical Variates Analysis). The percentages of
dissimilarity between group pairs were investigated con-
ducting SIMPER analysis. To link the significant differ-
ences among algal groups with particular variables/fatty
acids possibly contributing to the observed difference,
correlation analyses w ere conducted (Spearman’ srank
correlation coefficient, r/rho), permutation significance
tests). All statistical analyses and graphical visualisations
have been conducted in PAST version 2.07 software
package. Final graphical attributes required for publica-
tion were adapted in vector graphics editor Inkscape ver-
sion 4.7 and CorelDraw X3 Graphic suite.
Additional material
Additional file 1: FAME database established of all SAG microalgal
strains screened. The database contains information about clade,
phylum, class, genus and species identification (1
st
to 5
th
column) as well
as SAG strain number (6
th
column) and the amount of the different
substances given as relative proportion (following columns).
Additional file 2: Reduced FAME database for statistical analyses.
The database contains information about clade, phylum, class, genus and
species identification (1
st
to 5
th
column) as well as SAG strain number
(6
th
column) and the amount of the different substances given as
relative proportion (following columns).
List of abbreviations
ALA: α-linolenic acid; ARA: Arachidonic acid; CVA: canonical variance analysis;
DHA: docosahexaenoic acid; DMOX: 4, 4-dimethyloxaline; EPA:
Eicosapentaenoic acid; FA: fatty acid; FAME: fatty acid methyl ester; GC: gas
chromatography; GLA: γ-Linolenic acid; MS: mass spectrometry; NMDS: non-
metric multidimensional scaling; PA: palmitic acid; PUFAs: polyunsaturated fatty
acids; SAG: culture collection of microalgae in Göttingen; SDA: stearidonic acid.
Acknowledgements and Funding
The authors are grateful to Dr. Fredi Brühlmann (Geneva) and Dr. Cornelia
Göbel (Göttingen) for their continuous support with analytical methods and
interpretation of data, Dr. Maike Lorenz (Göttingen) for continuous support
with microalgal handling, database work and interpretation of data, Prof. Dr.
Rüdiger Hardeland (Göttingen) for providing with dinophyte strains. This
work was supported by Firmenich SA, Geneva.
Author details
1
Georg-August-University, Albrecht-von-Haller-Institute for Plant Sciences,
Department of Plant Biochemistry, Göttingen, Germany.
2
Cyano-Biofuels
GmbH, Magnussstrasse 11, 12489 Berlin, Germany.
3
Georg-August-University,
Albrecht-von-Haller-Institute for Plant Sciences, Department of Experimental
Phycology and Culture Collection of Algae in Göttingen (EPSAG), Göttingen,
Germany.
Authors’ contributions
IL carried out the fatty acid analysis of all algal strains and drafted the
manuscript. LH performed the statistical analysis. IF and TF conceived of the
study, and participated in its design and coordination and helped to draft
the manuscript. All authors read and approved the final manuscript.
Lang et al. BMC Plant Biology 2011, 11:124
/>Page 15 of 16
Received: 6 May 2011 Accepted: 6 September 2011
Published: 6 September 2011
References
1. Bergé J-P, Barnathan G: Fatty acids from lipids of marine organisms:
Molecular biodiversity, roles as biomarkers, biologically active
compounds, and economical aspects. Adv Biochem Eng/Biotechnol 2005,
96:49-125.
2. Dunstan GA, Volkman JK, Barret SM, Leroi J-M, Jeffrey SW: Essential
polyunsaturated fatty acids from 14 species of diatom
(Bacillariophyceae). Phytochemistry 1994, 35:155-161.
3. Tonon T, Harvey D, Larson TR, Graham IA: Long chain polyunsaturated
fatty acid production and partitioning to triacylglycerols in four
microalgae. Phytochemistry 2002, 61:15-24.
4. Viso A-C, Marty J-C: Fatty acids from 28 marine microalgae. Phytochemistry
1993, 34:1521-1533.
5. Harwood JL, Guschina IA: The versatility of algae and their lipid
metabolism. Biochimie 2009, 91:679-684.
6. Watson SB: Cyanobacterial and eukaryotic algal odour compounds:
signals or by-products? A review of their biological activity. Phycologia
2003, 42:332-350.
7. Mongrand S, Badoc A, Patouille B, Lacomblez C, Chavent M, Bessoule J-J:
Chemotaxonomy of the Rubiaceae family based on leaf fatty acid
composition. Phytochemistry 2005, 66:549-559.
8. Spitzer V: Screening analysis of unknown seed oils. Fett/Lipid 1999,
101:2-19.
9. Rossi S, Sabates A, Latasa M, Reyes E: Lipid biomarkers and trophic
linkages between phytoplankton, zooplankton and anchovy (Engraulis
encrasicolus) larvae in the NW Mediterranean. J Plankton Res 2006,
28:551-562.
10. Schweder T, Lindequist U, Lalk M: Screening for new metabolites from
marine microorganisms. In Marine Biotechnology I. Volume 96. Springer
Berlin/Heidelberg; 2005:1-48, Advances in Biochemical Engineering/
Biotechnology.
11. Volkman JK, Barrett SM, Blackburn SI, Mansour MP, Sikes EL, Gelin F:
Microalgal biomarkers: A review of recent research developments. Org
Geochem 1998, 29:1163-1179.
12. Temina M, Rezankova H, Rezanka T, Dembitsky VM: Diversity of the fatty
acids of the Nostoc species and their statistical analysis. Microbiol Res
2007, 162:308-321.
13. Leblond JD, Dahmen JL, Seipelt RL, Elrod-Erickson MJ, Kincaid R, Howard JC,
Evens TJ, Chapman PJ: Lipid composition of chlorarachniophytes
(Chlorarachniophyceae) from the genera Bigelowiella, Gymnochlora, and
Lotharella. J Phycol 2005, 41:311-321.
14. Dunstan GA, Brown MR, Volkman JK: Cryptophyceae and Rhodophyceae;
chemotaxonomy, phylogeny, and application. Phytochemistry
2005,
66:2557-2570.
15. Shiran D, Khozin I, Heimer YM, Cohen Z: Biosynthesis of eicosapentaenoic
acid in the microalga Porphyridium cruentum.1. The use of externally
supplied fatty acids. Lipids 1996, 31:1277-1282.
16. Cohen Z: The production potential of eicosapentaenoic and arachidonic
acids by the red alga Porphyridium cruentum. J Am Oil Chem Soc 1990,
67:916-920.
17. Zook D, Schenk HEA: Lipids in cyanophora paradoxa. III. Lipids in cell
compartments. Endocyt C Res 1986, 3:203-211.
18. Cavalier-Smith T: The origin of eukaryotic and archaebacterial cells. Ann N
Y Acad Sci 1987, 503:17-54.
19. Neustupa J, Elias M, Skaloud P, Nemcova Y, Sejnohova L: Xylochloris
irregularis gen. et sp. nov. (Trebouxiophyceae, Chlorophyta), a novel
subaerial coccoid green alga. Phycologia 2011, 50:57-66.
20. Bigogno C, Khozin-Goldberg I, Boussiba S, Vonshak A, Cohen Z: Lipid and
fatty acid composition of the green oleaginous alga Parietochloris incisa,
the richest plant source of arachidonic acid. Phytochemistry 2002,
60:497-503.
21. Caudales R, Wells JM: Differentiation of free-living Anabaena and Nostoc
cyanobacteria on the basis of fatty-acid composition. Int J Syst Bacteriol
1992, 42:246-251.
22. Krüger G, De Wet H, Kock J, Pieterse A: Fatty acid composition as a
taxonomic characteristic for Microcystis and other coccoid cyanobacteria
(blue-green alga) isolates. Hydrobiologia 1995, 308:145-151.
23. Dembitsky VM, Srebnik M: Variability of hydrocarbon and fatty acid
components in cultures of the filamentous cyanobacterium Scytonema
sp. isolated from microbial community “black cover” of limestone walls
in Jerusalem. Biochemistry (Mosc) 2002, 67:1276-1282.
24. Kenyon CN: Fatty acid composition of unicellular strains of blue-green
algae. J Bacteriol 1972, 109:827-834.
25. Kenyon CN, Stanier RY: Possible evolutionary significance of
polyunsaturated fatty acids in blue-green algae. Nature 1970,
227:1164-1166.
26. Keeling PJ: Diversity and evolutionary history of plastids and their hosts.
Am J Bot 2004,
91:1481-1493.
27. Gould SB, Waller RF, McFadden GI: Plastid evolution. Annu Rev Plant Biol
2008, 59:491-517.
28. Friedl T: The evolution of the green algae. Plant Syst Evol 1997, 11:87-101.
29. Lewis LA, McCourt RM: Green algae and the origin of land plants. Am J
Bot 2004, 91:1535-1556.
30. Pröschold T, Marin B, Schlosser UG, Melkonian M: Molecular phylogeny
and taxonomic revision of Chlamydomonas (Chlorophyta). I. Emendation
of Chlamydomonas Ehrenberg and Chloromonas Gobi, and description
of Oogamochlamys gen. nov. and Lobochlamys gen. nov. Protist 2001,
152:265-300.
31. Elias M, Nemcova Y, Skaloud P, Neustupa J, Kaufnerova V, Sejnohova L:
Hylodesmus singaporensis gen. et sp. nov., a new autosporic subaerial
green alga (Scenedesmaceae, Chlorophyta) from Singapore. Int J Syst
Evol Microbiol 2010, 60:1224-1235.
32. Hegewald E, Wolf M: Phylogenetic relationships of Scenedesmus and
Acutodesmus (Chlorophyta, Chlorophyceae) as inferred from 18S rDNA
and ITS-2 sequence comparisons. Plant Syst Evol 2003, 241:185-191.
33. Müller J, Friedl T, Hepperle D, Lorenz M, Day JG: Distinction between
multiple isolates of Chlorella vulgaris (Chlorophyta, Trebouxiophyceae)
and testing for conspecificity using Amplified Fragment Length
Polymorphism and its rDNA sequences. J Phycol 2005, 41:1236-1247.
34. Krienitz L, Hegewald EH, Hepperle D, Huss VAR, Rohrs T, Wolf M:
Phylogenetic relationship of Chlorella and Parachlorella gen. nov
(Chlorophyta, Trebouxiophyceae). Phycologia 2004, 43:529-542.
35. Pröschold T, Darienko T, Gustavs L, Mudimu O, Menendez CR, Schumann R,
Karsten U, Friedl T: Chloroidium, a common terrestrial coccoid green alga
previously assigned to Chlorella (Trebouxiophyceae, Chlorophyta). Eur J
Phycol 2010, 45:79-95.
36. Hornung E, Pernstich C, Feussner I: Formation of conjugated Δ
11
Δ
13
-
double bonds by Δ
2
-linoleic acid (1, 4)-acyl-lipid-desaturase in
pomegranate seeds. Eur J Biochem 2002, 269:4852-4859.
37. Fay L, Richli U: Location of double bonds in polyunsaturated fatty acids
by gas chromatography-mass spectrometry after 4, 4-dimethyloxazoline
derivatization. J Chromatogr A 1991, 541:89-98.
doi:10.1186/1471-2229-11-124
Cite this article as: Lang et al.: Fatty acid profiles and their distribution
patterns in microalgae: a comprehensive analysis of more than 2000
strains from the SAG culture collection. BMC Plant Biology 2011 11:124.
Submit your next manuscript to BioMed Central
and take full advantage of:
• Convenient online submission
• Thorough peer review
• No space constraints or color figure charges
• Immediate publication on acceptance
• Inclusion in PubMed, CAS, Scopus and Google Scholar
• Research which is freely available for redistribution
Submit your manuscript at
www.biomedcentral.com/submit
Lang et al. BMC Plant Biology 2011, 11:124
/>Page 16 of 16