báo cáo khoa học: " From RNA-seq to large-scale genotyping genomics resources for rye (Secale cereale L.)" pot
Bạn đang xem bản rút gọn của tài liệu. Xem và tải ngay bản đầy đủ của tài liệu tại đây (804.96 KB, 13 trang )
RESEARCH ARTICLE Open Access
From RNA-seq to large-scale genotyping -
genomics resources for rye (Secale cereale L.)
Grit Haseneyer
1†
, Thomas Schmutzer
2†
, Michael Seidel
3
, Ruonan Zhou
4
, Martin Mascher
2
, Chris-Carolin Schön
1
,
Stefan Taudien
5
, Uwe Scholz
2
, Nils Stein
4
, Klaus FX Mayer
3
and Eva Bauer
1*
Abstract
Background: The improvement of agricultural crops with regard to yield, resistance and environmental adaptation
is a perpetual challenge for both breeding and research. Exploration of the genetic potential and implementation
of genome-based breeding strategies for efficient rye (Secale cereal e L.) cultivar improvement have been hampered
by the lack of genome sequence information. To overcome this limitation we sequenced the transcriptomes of five
winter rye inbred lines using Roche/454 GS FLX technology.
Results: More than 2.5 million reads were assembled into 115,400 contigs representing a comprehensive rye
expressed sequence tag (EST) resource. From sequence comparisons 5,234 single nucleotide polymorphisms (SNPs)
were identified to develop the Rye5K high-throughput SNP genotyping array. Performance of the Rye5K SNP array
was investigated by genotyping 59 rye inbred lines including the five lines used for sequencing, and five barley,
three wheat, and two triticale accessions. A balanced distribution of allele frequencies ranging from 0.1 to 0.9 was
observed. Residual heterozygosity of the rye inbred lines varied from 4.0 to 20.4% with higher average
heterozygosity in the pollen compared to the seed parent pool.
Conclusions: The established sequence and molecular marker resources will improve and promote genetic and
genomic research as well as genome-based breeding in rye.
Keywords: EST resource, next generation sequencing, Secale cereale L., Rye5K SNP array, single nucleotide
polymorphisms
Background
The improvement of agricultural crops with regard to
yield, resistance and environmental adaptation is a per-
petual challenge for both breeding and research. With
regard to prospect ed climate c hanges, improved toler-
ance against abiotic stresses like drought, low soil ferti-
lity, and extreme temperatures is required in crop
improvement. The outcrossing species rye shows the
highest freezing tolerance among small grain cereals [1]
and exhibits excellent tolerance agains t many biotic and
abiotic stresses. Understanding the functional genetic
basis of stress tolerance in rye will facilitate the
improvement of stress tolerance in wheat (Triticum aes-
tivum L.) and barley (Hordeum vulgare L.). As a genetic
research system, rye is intriguing due to its high genetic
variability. In addition to being an economically impor-
tant crop for Middle and Eastern Europe, rye provides
valuable traits for other crops, as a parent of the amphi-
ploid triticale, and as a donor of translocated chromo-
some segments in wheat [2]. Rye benefits from being
diploid and closely related to the more extensively char-
acterized species wheat and barley. While reference
sequences of grass genomes have become available for
rice [3,4], sorghum [5], Brachypodium [6] and maize [7],
sequence information for rye is sparse which hampers
the exploitation of its genetic potential.
Thehaploidgenomesizeofryeismorethan8Gbp
[8] which is one of the largest among cereal crops. In
addition, 92% of the genome is composed of repetitive
sequences [9]. Genetic and genomic resources are lim-
ited compared to other Triticeae. Currently, 1,073,668
wheat and 501,620 barley ESTs are publicly available
* Correspondence:
† Contributed equally
1
Plant Breeding, Technische Universität München, Centre of Life and Food
Sciences Weihenstephan, 85354 Freising, Germany
Full list of author information is available at the end of the article
Haseneyer et al. BMC Plant Biology 2011, 11:131
/>© 2011 Haseneyer et al; licensee BioMed Central Ltd. This is an Open Access article distribu ted under the terms of the Creative
Commons Attribution License ( .0), which permits unrestricted use, distribution, and
reproduction in any medium, provided the original work is properly cited.
whereas only 9,298 rye ESTs are deposited in public
databases />summary. html (release 070111). Publicly available geno-
mic resources for rye are restricted to one BAC library
[10], a limited number of genetic markers http://wheat.
pw.usda.gov/GG2/index.shtml, and genetic maps with
low marker density [11-15].
Next-generation sequencing (NGS) technologies such
as Illumina’s Genome Analyzer and Roche’s 454 sequen-
cing platforms have opened the way to tackle sequen-
cing of large genomes like those of barley and wheat
which would be impossible to address by Sanger
sequencing [16]. NGS platforms produce hundreds of
thousands of sequenc es in a massively parallel ma nner,
are cost and labour effective and were proven to be reli-
able and accurate. Several studies have highlighted the
success and usefulness of NGS for extending available
genomics resources by transcriptome [e.g. [17,18]] and
whole-genome [19] sequencing. Furthermore, NGS has
been used for gene expression profiling [20], a nalysis of
genome organisat ion [21], DNA methylation st udies
[22], and molecular marker development [23], to name
few.
Given the large genome size and the lack of sequence
information and genomic resources in rye, identification
and targeted isolation of genes underlying agronomic
traits and understanding of gene function and trai t var-
iation is greatly hampered. The aim of the present study
was to promote rye genome analysis through massive
improvement of the public rye EST resource and devel-
opment of the first high-throughput SNP genotyping
array.
Methods
Plant material, RNA and sequencing
Five winter rye inbred lines Lo7, Lo152, Lo225, P87, and
P105 were used for cDNA sequencing. Lo7, Lo152, and
Lo225 were provided by KWS LOCHOW GMBH (Ber-
gen, Germany) and represent lines from the seed parent
and the po llen parent pool of the company’s hybrid rye
breeding program. P87 and P105 were develo ped at the
Institute of Genetics and Cytology, Minsk, Belarus, and
are parents of the mapping population P87 × P105 [24].
Inbred lines Lo7, Lo152, and Lo225 were generated b y
six selfing generations, whereas P87 and P105 were
selfed seven and eight times, respectively. In addition,
54 proprietary inbred lines from the breeding material
of KW S LOCHOW GMBH, representing the two breed-
ing pools were investigated. Lines from the pollen par-
ent pool were generated by two to three selfing
generations, whereas lines from the seed parent pool
have undergone five selfing steps.
To capture a comprehensive part of the rye tran-
scriptome 20 s amples of total RNA per inbred line
were obtained from a set of plant tissues harvested at
five developmental stages and after three stress treat-
ments, respectively (Additional file 1). Three plants per
inbred line w ere pooled to obtain each of the 20 RNA
samples. For all non-stress treatments tissue samples
from leaves, stems and/or roots were harvested at
three- to four-leaf stage, tillering, stem extension,
heading and harvest ripe stage. Coleoptiles, florets,
early and mature spikes were harvested. To enrich
stress induced genes in the cDNA sample, cold stress,
dehydration shock, and nutrient-starvation stress treat-
ments were applied in the three- to four-leaf stage.
Cold stress was induced by placing plants in a freezer
at -15°C. Root, stem and leaf tissues were harvested
after 1, 3, and 6 hours of stress treatment and pooled.
Dehydration shock experiments were conducted by
removing well-watered plants from soil and leaving
them on Whatman
®
3 MM paper (Whatman GmbH,
Dassel, Germany) at room temperature [25]. Root,
stem, and leaf tissues were harvested after 3, 6, and 12
hours of stress a nd pooled. Three plants per inbred
line were densely planted leading to nutrient-starvation
stress. Root and leaf tissues were harvested and pooled.
All tissue samples were frozen in liquid nitrogen and
stored at -80°C until use. Total RNA was isolated
according to manufacturer’ s instructions using the
NucleoSpin RNA Plant kit (#740949, Macherey-Nagel,
Düren, Germany) and quantified with the SPECTRO-
NIC GENESYS™ 10 BIO spectrometer (Thermo
ELECTRON CORPORATION, Madison, USA).
Five micrograms of the 20 RNA samples of each
inbred line were pooled and 100 μg total RNA per
inbred line was sent for cDNA synthesis to vertis Bio-
technology AG (Freising, Germany). Poly(A)+ RNA was
prepared from total RNA. First-strand cDNA synthesis
wasprimedwithrandomhexanucleotideprimers.Then
454 sequencing adapters A (5’ -GCCTCCCTCGC
GCCATCAG-3’ )andB(5’ -CTGAGCGGGCTGGCA
AGGC-3’ ) were ligated to the 5’ and 3 ’ cDNA ends.
Finally, cDNAs were ampl ified in 20 (Lo152) and 21
(Lo7, Lo225, P87, P105) PCR cycles using a proof read-
ing enzyme. Normalization was carried out by one cycle
of denaturation and reassociation of the cDNA. Reasso-
ciated ds-cDNA was separated from the ss-cDNA on
hydroxylapatite columns to obtain the normalized
cDNA samples. Aft er hydroxylapatite chromatography,
the ss-cDNA samples were amplified in 8 PCR cycles.
ThecDNAfractioninthesizerangeof600to800bp
was eluted from preparative agarose gels. As a control,
aliquots of the fractionated cDNAs were analyzed on
1.5% agarose gels. Approximately 150 to 250 μgofthe
normalized, adapter-ligated, and size selected cDNA
samples were used for GS F LX 454 seque ncing. All 454
sequence raw data were submitted to the EBI sequence
Haseneyer et al. BMC Plant Biology 2011, 11:131
/>Page 2 of 13
read archive (SRA) and are available under the study
accession number ERP000274.
EST resource
De novo sequence assembly
After 454 sequencing, raw sequence reads we re passed
through quality filtering where cDNA synthesis primer
and sequencing adapter sequences were removed. After
pre-processing, cleaned and trimmed reads were sub-
jected to inbred line-specific assemblies. Therefore, we
adapted the strategy of Kumar and Blaxter [26] for
assembling transcriptome data using multiple assembly
programs and combining the outcomes to create longer
contigs that are less li kely to be in-silico artefacts
brought forth by a single algorithm. The strategy has
been modified to be applicable for various lines (Figure
1). We used t hree independent assemblers to achieve
most credible consensus contig sequences. Initially, all
reads from each of the five lines were assembled sepa-
rately into first-order contigs with the programs CLC
assembly cell v3. 20 , Mira v3.21
[27] and Newble r v2.5 [2 8]. While MIRA and Newbler
follow the overlap-consensus-layout paradigm (OLC),
CLC attempts to find paths in De Bruijn graphs. To
obtain line-specific assemblies, all first-order contigs
constructed by the three assemblers were merged using
theOLCassemblerCAP3[29].Weconsideredonly
line-specific contigs whose constituents included first-
order contigs from all three assemblers. For EST
resource generation (Sce_Assembly03), we employed
CAP3 a second time to co-assemble the high confidence
line-specific contigs and denoted those supported by
constituents from more than one line as multi-line con-
tigs, while contigs with evidence from only one line
were deemed single-line contigs. T he assembly pr ocess
of Sce_Assembly03 has been accomplished with a
screening for potential DNA and foreign RNA contami -
nation. We appli ed a BlastN against chloroplast genome
sequences of barley (GenBank: NC_008590) and wheat
(GenBank: NC_002762), mitochondrial genome
sequences of rice (GenBank: AP011077), sorghum (Gen-
Bank: DQ984518), and wheat (GenBank: GU985444),
and plastids genome sequences of Brachypodium (Gen-
Bank:EU325680), rice (GenBank: GU592207), sorghum
(GenBank: NC_008602), and wheat (GenBank:
AB042240). Further purity was gained by exclud ing hits
against CDS sequences of Acyrthosiphon pisum (Gen-
Bank: ACFK000 00000), Buchnera aphidicola (GenBank:
AE013218), Fusarium graminearum (GenBank:
AACM00000000), and the draft seque nce of Puccinia
triticina available at the Broad Institute. We discarded
contigs from the Sce_Assembly03 sequence set that
showed E-values larger than E-20 and the pro posed best
hits representing at least 10% of the full contig size. The
established EST resource Sce_Assembly03 is available
from the GABI primary database [30], http://www.
gabipd.org.
Sequence comparisons
Sequences between the five rye inbred lines potentially
differ to a degree that prevents the de novo assembly of
two lines. Blast [31] comparisons which do not require
strict sequence identity were carried out to analyze for
overlaps between the different assemblies. Line-specific
assemblies generated by CAP3 were used together with
the Sce_Assembly03 in an “all versus all” BlastN analy-
sis. Each line-specific assembly as well as the multi-line
and single-line contigs of the Sce_Assembly03 were
used as both, subject and query sequences. The best
query hit to a subject sequence was counted to identify
homologs in the respective assemblies. Hits were consid-
ered significant when they exceeded a conservative cut-
off value of > = 70% identity and 30 bp coverage.
Comparisons of the Sce_Assembly03 a gainst the four
currently available protein databases of maize
[ZmB73_v5b.60, ], rice
[RAP2, [32]], sorghum [5], and Brachypodium [6], two
EST databases of barley and wheat (Barley assembly 35
and Wheat assembly WK, ), and
two full length cDNA (flcDNA) library databases of bar-
ley [33] and wheat [34] were performed using BlastX
and tBlastX, respectivel y. Hits were only considered sig-
nificant when they exceeded a conse rvative cut-off value
of > 70% identity and 30 bp coverage. To prevent hits
found based on low-complexity sequences or repeats the
Sce_Assembly03 was masked using RepeatMasker [35]
and the internal MIPS repeat database [36].
Genome-wide distribution of the Sce_Assembly03
contig sequences was investigated by chromosome-wise
BlastX analysis comparing multi-line and single-line
contigs with Brachypodium protein sequences. Sce_As-
sembly03 sequences were mapped onto the Brachypo-
dium g enome by using a sliding window approach with
a window size of 0.5 Mb and a shift of 0.1 Mb along the
Brachypodium chromosomes. The number of BlastX
hits and the percent bp coverage o f the respective Bra-
chypodiu m genes were determined. These density values
were corrected for the number of Ns per window, if the
N content exceeded 60% the value was set to zero. Den-
sity values were extrapolated to genes [6] or hits (rye)
per Mb to facilitate comparisons. To visualize the map-
ping results heatmaps were created from the density
values using the Python matplotlib module in combina-
tion with the jet colormap [37].
Functional gene annotation
The 115,400 sequences of the Sce_Assembly03 were
functionally annotated performing a Blast search with
Blast2GO default parameters against the non-redun-
dant (nr) protein sequence database [38] after masking
Haseneyer et al. BMC Plant Biology 2011, 11:131
/>Page 3 of 13
repetitive sequences and excluding the singletons.
Gene ontology (GO) terms were assigned using
B2G4PIPE and a locally
installed Blast2GO database. The annotation file was
extended by its respective GO category - biological
process, cellular component, and molecular function -
using a custom built Python script that is available
upon request.
SSR mining and SNP discovery
Simple sequence repeat (SSR) motifs within 338,536
contigs of the line-specific assemblies were identified by
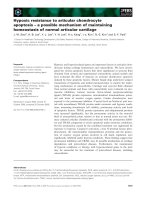
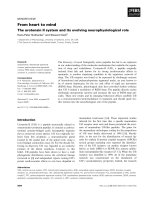
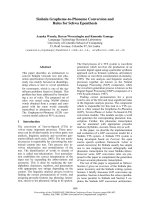
Figure 1 Pipeline for the assembly procedure of Roche/454 sequence reads. After dat a generation [A], sequence (fasta), quality (qual) and
trace file information were extracted. Low quality regions, vector and adaptor sequences were removed from raw reads [B]. Preprocessing was
finished by subjecting trimmed reads to the line-specific assembly. For establishment of the SNP resource Sce_Assembly02 [C] only reads
assembled in contigs of line-specific assemblies were subjected to the merging process of the second assembly using Mira. For establishment of
the EST resource Sce_Assembly03 [D] assemblies were computed for each of the five lines separately with CLC assembly cell, Mira, and Newbler
and merged by CAP3 assembly. Consensus sequences of all lines were passed to a second CAP3 assembly combining sequences over multiple
lines. The resulting sequence set comprises contigs that were confirmed by consensus sequences from two to five lines (multi-line contigs) or
contigs that contain reads originating from one line (single-line contigs).
Haseneyer et al. BMC Plant Biology 2011, 11:131
/>Page 4 of 13
MISA [39] under standard settings. Out of the five
inbred lines, Lo225 was selected as reference dataset as
it provided the highest number of SSR containing con-
tigs. The MISA output of the four remaining lines was
cross-matched with the Lo225 dataset to detect redun-
dan t SSRs. A non-redundant SSR dataset was generated
by combining “ unique” SSR motifs detect ed in Lo7,
Lo152, Lo225, P87, and P105. Mononucleotide repeat
motifs were discarded since monomer runs are known
to be the most frequent sequencing errors in Roche/454
data. For experimental validation of in silico detected
SSRs, primers flanking the SSR motifs were designed
using Primer3 [40]. Amplification of the fragments was
performed in Lo7, Lo225, P87, and P10 5 as they are the
parents of two mapping populations. Thus, polymorph-
isms detected between Lo7 and Lo225 and/or P87 and
P105 enable the genetic mapping of discovered SSRs.
PCR was conducted in a total volume of 20 μl, including
20 ng of genomic DNA, 1× HotStar Taq PCR buffer
(Qiagen, Hilden, Germany), 250 nM of each primer, 200
μM dNTPs, and 0.5 U HotStar Taq DNA polymerase
(Qiagen, Hilden, Germany). Using a touch-down PCR
profile, an initial denaturation step of 15 min at 95°C
was followed by 45 cycles of denaturation at 94°C for 1
min, annealing for 1 min, and extension at 72°C for 1
min. Annealing temperature was decreased by 1°C per
cycle from 65°C to 55°C and was kept constant for 35
subsequent cycles. A final extension step was performed
at 72°C for 10 min. Successful amplification was
checked on 1.5% agarose gels.
For the discovery of SNPs in assembled sequences, a
second assembly strategy was pursued. Reads assembled
in line-specific contigs were selected from all reads and
subjected to an overall assembly, merging the extracted
reads of all five ge notypes (Sce_Assembly02, Figu re 1).
With this strategy information about nucleotide cover-
age is maintained which is important for reliable SNP
discovery. The Sce_Assembly02 is described in Addi-
tional file 2 and is available from the GABI primary
database . The workflow from in
silico SNP discovery in the Sce_Assembly02 to sel ection
of high confidence SNP candidates was a three-step pro-
cedure: First, the tool GigaBayes V0.4.1 [41] was applied
with parameter settings given in Additional file 3. Sec-
ond, characteristics for discovered SNPs were extracted
by in-house implementations to compute defined selec-
tion criteria for candidate SNPs. Candidate SNPs were
filtered by these selection criteria to meet the following
requirements: SNPs should be bi-allelic and poly-
morphic between parents of the two mapping popula-
tions Lo7 × Lo225 and/or P87 × P105. For successful
probe design they s hould have a distance to homopoly-
meres > 5 bp, to the next Indel > 60 bp, and to the con-
tig end > 60 bp. Third, filtered SNPs were manually
inspected in the assembled sequences using EagleView
[42] to ensure high quality of the SNP genotyping array.
We considered putative se quencing errors, SNP position
in individual reads, and haplotype information. Oligo-
probes for 5,234 SNP were designed and the Rye5K
array was produced by Illumina Inc. (San Die go, USA)
as Infinium iSelect HD Custom BeadChip. To demon-
strate genome-wide coverage of the SNPs represente d
on the genotyping array SNP containing contig
sequences were in silico mapped against the Brachypo-
dium genome by BlastN analysis.
SNP array performance was assessed by analyzing 59
rye inbred lines including the five inbred lines used for
sequencing as well as accessions from barley (Barke,
Morex, OWB Dom, OW B Rec, Steptoe), wheat (Chinese
Spring, Dream, Mulgara), and tritic ale (Modus, breeding
line SaKa3006). A total of 300 ng genomic DNA per
plant was used for genotyping on the Illumina iScan
platform and the Infinium HD assay following manufac-
turer’ s protocol. The fluorescence images of an array
matrix carrying Cy3- and Cy5-labeled beads were gener-
ated with the two-channel scanner. Raw hybridization
intensity data processing, clustering and genotype calling
(AA, AB, BB) were performed using the genotyping
module in the GenomeStudio software V2009.1 (Illu-
mina, San Diego, USA). Genotype data were cleaned
through exclusion of all SNP assays with more than 5%
missing data. Frequencies o f the A and B allele for a
given SNP were calculated directly by dividing the num-
ber of occurrences of one allele (A A + 1/2 AB or BB +
1/2 AB) by twice the number of assayed lines per SNP.
Residual heterozygosity of 59 inbred lines was calculated
by the relation of heterozygous SNPs (AB) to the num-
ber of assayed SNPs per inbred line. Significant devia-
tion of the observed value from the expecte d value was
tested with an exact binomial test using R [43]. Geno-
typing data of the 10 non-rye accessions were analyzed
to investigate the applicability of the Rye5K SNP array
to other small grain cereals.
Results
Establishment and description of the rye EST resource
Assembly
The five independent sequencing runs produced
between 364,343 and 681,787 reads corresponding to
~87 and ~166 Mb of raw data per inbred line (Table 1).
Subsequent quality filtering and removal of sequencing
adapters and cDNA synthesis primers resulted in ~75 to
~145 Mb of high quality sequences per inbred line with
median read lengths between 213 and 222 bp. Overall,
2,573,590 high quality reads with a median length of
216 nucleotides were obtained, totalling 548 Mb. The
quality filtered reads of the five line-specific cDNA
libraries were assembled separately generating between
Haseneyer et al. BMC Plant Biology 2011, 11:131
/>Page 5 of 13
51,462 and 78,813 contig sequences per line-specific
assembly, summing up to 338,536 contigs (Additional
file 2). On average each nucleotide in the five line-speci-
fic assemblies was covered by 4.5 to 6.2 reads.
Consensus sequences created by multiple assembly
programs and merged by CAP3 were used to generate
the Sce_Assembly03 (Figure 1, Table 2). 89.0% of the
reads were assembled into conti gs originating from two,
three, four, or five inbred lines (multi-line contigs) or
from one single inbred line (single-line contig s), respec-
tively. The Sce_Assembly03 resulted in 115,400
sequences including 33,352 multi-line contigs (77.8% of
all reads) and 82,048 single-line contigs (11.1% of all
reads). 11.0% of all reads failed the quality criteria and
were remo ved from the assembly. The multi-line contig
sequence length ranged from 201 bp to 8,636 bp with a
L50 length of 1,070 bp. On average, each contig was
built from sixty reads in the multi-line contigs and three
reads in the single-line contigs.
Sequence comparisons
We compared the fiv e line-specific assemblies genera ted
by CAP3 against each other and against the multi-line and
single-line consensus sequences of the Sce_Assembly03
(Table 3). This revealed 52.16% to 78.72% hits between
the line-specific assemblies. BlastN analysis of the line-spe-
cific assemblies against the multi-line contigs reached up
to 87.79% hits. Thus, as expected, a large overlap of repre-
sented genes between single-line assemblies can be con-
cluded. However, the remaining 12.21% revealed either
pronounced sequence differences (highly polymorphic
genes/alleles) or genes that are represented (expressed) in
only one of the five rye inbred line samples.
The sequence homology between the line-specific
assemblies and the Sce_Assembly03 with the reference
genomes of Brachypodium, maize, rice, and sorghum,
and available flcDNA and EST collections from wheat
and barley, respectively, was investigated by (t)BlastX
comparisons (Figure 2). Most homologs were identified
in compa rison to barley sequences, followed by Brachy-
podium,wheat,sorghum,maizeandrice.Contig
sequences of the line-specific assemblies and multi-line
contigs of the Sce_Assembly03 showed a high ho mology
to the public sequence databases. Low homology was
detected for the single-line contigs of the Sce_Assem-
bly03. This finding can be attributed to the sequence
length which is about two thirds shorter than that of
multi-line contigs (Table 2). Multi-line contigs of the
Sce_Assembly03 yielded more than 65% hits with either
barley or wheat flcDNA and HarvEST assemblies (data
not shown). Through tBlastX comparisons of the
Sce_Assembly03 against the genome sequences of Bra-
chypodium,maize,sorghum,andricewewereableto
tag fragments from about 46.3%, 35.9%, 37.2% and
36.2% of the reference gene repertoires. From 33,352
multi-line and 82,048 single-line contigs 22,926 (68.7%)
and23,406(28.5%)revealedahittoatleastoneofthe
public grass sequence resources. The genes comprised
in the rye cDNA libraries indicated no bias for or
against a certain region of the rye genome when com-
paring the Sce_Assembly03 contig sequences to the Bra-
chypodium genome (Additional file 4). The dense gene
content in the distal regions of the Brachypodium
Table 1 Descriptive statistics of five independent Roche/454 GS FLX sequencing runs
Inbred line
Lo7 Lo152 Lo225 P87 P105
Raw sequence data
Number of sequences 364,343 469,345 572,518 488,829 681,787
Average read length [bp] 239 248 242 240 244
After quality filtering
Number of sequences 363,681 469,208 571,433 488,132 681,136
Average read length [bp] 207 220 213 208 214
Total bp 75,281,967 103,225,760 121,715,229 101,531,456 145,763,104
25% quantile [bp] 203 210 208 203 207
Median [bp] 213 222 218 213 217
75% quantile [bp] 223 236 229 223 228
Table 2 Description of the Sce_Assembly03
Multi-line contigs Single-line contigs
Number of reads 2,000,855 286,386
Number of reads/contig 60 3
L30 [bp] 1,527 505
L50 [bp] 1,070 333
L70 [bp] 727 247
Number of contigs 33,352 82,048
< 500 bp 11,188 71,581
501-1000 bp 12,679 8,347
1001-2000 bp 7,693 1,952
2001-5000 bp 1,767 166
> 5000 bp 25 2
Longest sequence [bp] 8,636 5,721
Haseneyer et al. BMC Plant Biology 2011, 11:131
/>Page 6 of 13
chromosomesaswellasthegenepoorregionsaround
the centromeres were well covered by Sce_Assembly03
contig sequences.
Functional gene annotation
After masking repetitive sequences of the Sce_Assem-
bly03 111,150 sequences (32,725 multi-line and 78,425
single-line contigs) remained for Blast2GO analysis. Out
of these sequences 49,294 revealed a hit against the nr
database and subsequently 35,356 (71.7%) unique rye
contig sequences (16,970 multi-line and 18,386 single-
line contigs) were assigned to one or more GO annota-
tions. In total 35,186, 38,280 and 51,950 GO terms were
obtained for biological processes, cellular components
and molecul ar functions, respectively (Additional file 5).
Table 3 BlastN comparisons of the five line-specific assemblies generated with CAP3 and the Sce_Assembly03
Query
Line-specific assembly Sce_Assembly03
Subject Lo7 Lo152 Lo225 P87 P105 Multi-line contigs Single-line contigs
Line-specific assembly
Lo7 52.2 56.1 61.8 56.9 76.1 35.5
Lo152 67.7 54.3 59.6 56.0 77.1 49.5
Lo225 77.6 58.3 68.7 63.8 84.2 53.5
P87 74.4 55.4 59.9 60.9 82.8 40.6
P105 78.7 59.5 63.8 70.2 87.8 47.5
Sce_Assembly03
Multi-line contigs 85.2 64.4 69.6 78.0 72.3 35.3
Single-line contigs 59.1 64.4 67.3 59.2 62.4 58.5
Values show percent hits of query sequences counting the first best hit in each comparison.
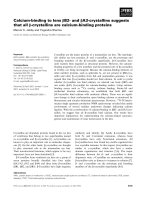
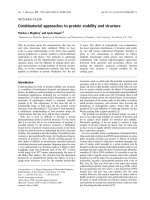
Figure 2 Heatm ap of (t)BlastX analysis results to public model grass genomes and T riticeae EST and full length cDNA (flcDNA)
resources. Contig sequences from the line-specific assemblies generated by CAP3 and the Sce_Assembly03 were aligned to public barley and
wheat EST and flcDNA sequences and to Brachypodium, maize, rice, and sorghum genomic sequences. Percent hits to individual databases were
counted using a 70% similarity cutoff and visualized in colours (colour code shown on the right).
Haseneyer et al. BMC Plant Biology 2011, 11:131
/>Page 7 of 13
Across the three GO categories, 4,997 unique GO terms
were identified. More than 350 sequences in the
Sce_Assembly03 were related to biotic and abiotic stress
response (data not shown).
Marker discovery, SNP array design and high-throughput
genotyping
SSR marker development
Within the 338,536 contigs of the line-specific assemblies
a fraction of 12,317 (3.6%) contigs contained SSR motifs.
Primer sequences could be designed for 5,230 of these
contigs. Restriction to di-, tri-, tetra-, penta- or hexa-
nucleotide motifs reduced the number of SSR candidates
to 3,799. Cross-match analysis filtered a final SSR dataset
comprising 1,385 unique, non-redundant SSRs (Addi-
tional file 6). A random subset of 155 SSRs was chosen
for experimental validation by PCR amplification of the
fourparentalgenotypesLo7,Lo225,P87,andP105.146
primer pairs (94%) immediately amplified fragments of
expected size without further optimization of PCR condi-
tions. Twelve primer combinations produced fragments
larger than expected indicating the presence of introns.
These were excluded from further analyses. Finally, 61
(46%) out of 134 PCR products with expe cted fragment
size revealed naked-eye polymorphisms on agarose gels
between either P87 and P105 (29) or Lo7 and Lo225 (37).
SNP discovery
SNP discovery requires sufficient coverage with high
quality sequence reads in orde r to allow for distinguish-
ing true SNPs from sequencing errors. Therefore, the
assembly Sce_Assembly02 was performed that excluded
singletons from the line-specific assemblies when mer-
ging sequences of the five inbred lines. Overall 27 7,033
putative polymorphisms in 138,339 contigs cumulating
55 Mb consensus sequences were identified in a first
data mining step using GigaBayes. The number of SNP
candidates was reduced to 17,917 by filtering those
SNPs that fulfilled the selection criteria and quality
requirements such as bi-allelic and polymorphic
between parents of the two mapping populations Lo7 ×
Lo225 and/or P87 × P105, distance to homopolymeres >
5 bp, distance to the next Indel > 60 bp, and distance to
the contig end > 60 bp. Subsequent manual inspection
in the Sce_Assembly02 reduced the dataset to 5,211
SNP candidates from 3,961 contig s. This dataset
together with additional 23 SNPs discovered in non-
public rye sequences was used for the design and pro-
duction of the Rye5K SNP genotyping arr ay. Out of the
3,961 unique contigs, 2,835 contigs (71.6%) were in
silico mapped to the Brachypodium genome. The con-
tigs were evenly distributed with 826, 641, 688, 416, and
262 hits on chromosomes Bd1 to 5, respectively (Addi-
tional file 4). Blast2GO analysis of 3,961 contig
sequences represented on the Rye5K array assigned
2,096 sequences with associated GO identifiers (Addi-
tional file 7).
Application of the Rye5K SNP array
The performance of the Rye5K SNP array was tested on
the five inbred lines selected for RNA-seq, 54 additional
rye inbred lines, and 10 non-rye accessions. Out of the
5,234 SNPs, 4,557 (87%) generated signals and between
2,970 (57%) and 3,148 (60%) were successfully called for
the 59 rye inbred lines representing the hybrid rye seed
parent and pollen parent pools (Table 4 Additional file
8). Based on genotyping results for the five inbred lines
used for SNP discovery, 3% of the in silico detected
SNPs turned out to be false positives. Allele frequencies
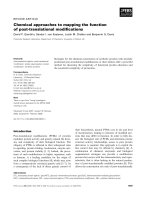
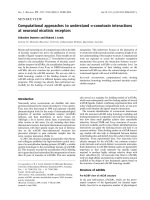
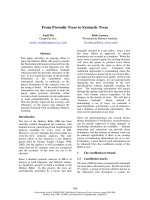
in rye were evenly distributed from 0.1 to 0.9 (Figure 3).
A small proportion of 12.3% called SNPs turned out to
be monomorphic in the independent set of 54 inbred
lines not used for SNP discovery with slightly increasing
values when looking separately at the pollen parent
(15.7%) and the seed parent (13.7%) pools.
Genotyping data were us ed to calculate t he observed
residual heterozygosity of the rye inbred lines. The
observed percentage of heterozygous loci for each line
varied between 4.1 and 4.8% in the five rye inbred lines
used for 454 sequencing and between 4.0 to 20.4% in
the 54 inbred lines from the two heterot ic breeding
pools. On average, a higher level of residual heterozyg-
osity was observed for the pollen parent pool (11.5%)
than for the seed parent pool (5.5%).
Applicability of the Rye5K SNP array to other small
grain cereals was investigated. Out of the 4,557 SNP assays
that generated a signal in rye, 63.0% (2,871), 75.8% (3,452),
and 84.1% (3,831) could be scored in barley, wheat, and
triticale, respectively. However, 86.7, 91.6, and 76.5% of
the scored SNPs did not show a polymorphism between
the investigated barley, wheat, and triticale accessions.
Discussion
Dual-purpose transcriptome sequencing
In this study we report the establishment of rye genomic
resources comprising 115,400 EST sequences, 1,385
Table 4 Heterozygosity of five sequenced rye inbred
lines after genotyping with the Rye5K array
Inbred line
Lo7 Lo152 Lo225 P87 P105
Loci total 3,145 3,133 3,134 3,148 3,127
Homozygous loci 3,004 3,005 2,987 2,997 2,988
Heterozygous loci 141 128 147 151 139
Generation F
7
F
7
F
7
F
7:10
F
6:9
Expected heterozygosity [%] 1.6 1.6 1.6 1.6 3.1
Observed heterozygosity [%] 4.5*** 4.1*** 4.7*** 4.8*** 4.4*
Significant (***: p-value < 0.01, *: p-value < 0.05) deviation from the expected
level of heterozygosity is indicated.
Haseneyer et al. BMC Plant Biology 2011, 11:131
/>Page 8 of 13
SSRs, more than 5,000 SNPs, and the Rye5K SNP array
for large-scale genotyping. NGS was used to generate
transcriptome sequences of the five rye inbred lines Lo7,
Lo152, Lo225, P87, and P105. The number of reads per
sequencing run of the present study was in line or even
surpassedresultsobtainedin other studies [17,23,44].
Due to the massive number of 2.5 Mio read sequences
obtained by 454 sequencing the de novo assembly of
such datasets remains a computational and bioinfor-
matic challenge. Two purpose-oriented assembly strate-
gies were follo wed in order to first provide a
comprehensiv e EST resource and second enable discov-
ery of polymorphisms between inbred lin es. A second
assembly on top of the five line-specific assemblies
reduced the possibility of creating chimeric artefacts in
the Sce_Assembly03. In addition, sequence redundanc y
introduced by variations between lines is removed. This
was achieved by bring ing together related seque nces
while accepting line specific nucleotide differences. In
contrast this fact wa s essential for SNP detection, where
only reads that were pre-a ssembled in line-specific con-
tigs were subjected to the Sce_As sembly02. Thus, infor-
mation about allele coverage at the SNP po sition was
retained which increased the reliability o f SNP candi-
dates. A challenge in our study was the detection of
SNPs without a reference sequence. Many SNP
detection tools such as GMAP [45] or MAQ [46] are
only applicable to de novo assemblies that are aligned to
a reference sequence. This was a strong challenge in our
approach and much effort was invested in the detection
of high confidence SNPs. Manual inspection of SNP
candidates in more than 10,000 contigs indicated that
many sequencing errors occurred in the beginning of
read sequences which, as a consequence, lead to false
positives. Exclusion of SNP candidates detected in such
regions of read sequences might reduce the false posi-
tive rate and improve automated tools that detect poly-
morphisms in de novo assembled sequence data without
a reference sequence.
Genome sequencing has progressed rapidly in model
plants. G iven the increased sequencing throughput and
the decreasing costs, NGS technologies pave the way for
sequencing even large genomes [47-49]. Although of
major importance for research and breeding, sequence
resources for rye were sparse imposing serious limita-
tions for trait mapping, association studies, and func-
tional genomics in rye. Rye is of interest especially for
Middle and Eastern European economic markets due to
its high tolerance to abiotic stresses. As a first step
towards deciphering the rye genome we aimed to
sequence a large portion of the rye transcriptome. To
achieve this we first sampled RNA from plants under
Figure 3 Distribution of allele frequencies for evaluable SNPs on the Rye5K SNP array. Allele frequencies observed in total and separately
in the rye breeding seed parent and pollen parent pools belong to one category if the value is > the left category border and ≤ the right
category border. Allele frequency values equal to 0 and 1 fall into the first and last category, respectively.
Haseneyer et al. BMC Plant Biology 2011, 11:131
/>Page 9 of 13
various stress conditions, different plant tissues and
developmental stages. Rye-specific sequences e.g. related
to stress tolerance were generated in the present study
which are indispensable for functional genomic studies
in rye. Second, we reduced thecomplexityofthetran-
scriptome by cDNA normalization prior to sequencing.
cDNA normalization lead to a significa nt increase in
transcriptome sequencing efficiency by equalizing the
representation of high, medium and rarely expressed
transcripts in the cDNA population [50-52]. Since many
transcripts are temporally and/or spatially expressed
during plant development, RNA pooled from different
tissues at different developmental stages ensured the
coverage of temporal- and spatial-specific transcripts.
Linking rye to grass genome sequence resources
To assess, how much of the rye transcriptome is repre-
sented by the esta blished EST resource, we compared
the Sce_Assembly03 sequences to currently available
grass genome, flcDNA, and EST sequences. Generally,
the number of sequences with significant BlastX hit in
public databases was higher for multi-line contigs than
for single-line contigs. This finding is in line with results
of Schafleitner et al. [53] who compared EST sequences
of sweet potato (Ipomea batatas) with sequences con-
tained in the UniRef100 protein database.
The overall gene content across the grass subfamilies
Ehrhartoideae (rice), Panicoideae (maize, sorghum), and
Pooideae [6] is in a similar range. A total of 25,532 pro-
tein coding gene loci were found for Brachypodium [6]
which is in line with rice [RAP2, 28,236 protein coding
gene loci, [32]], maize [ZmB73_v5b.60, 39,656 protein
coding loci, [7]], and sorghum [v1.4, 27,640 protein cod-
ing gene loci, [5]]. Due to a close evolutionary relation-
ship with these model genomes a pronounced overlap
with rye transcripts was expected. The comparison of
the Sce_Assembl y03 against flcDNA, EST, and genomic
sequences revealed a higher homology to barley, Brachy-
podium,andwheatthantomaize,rice,andsorghum
which was expected, as rye is phylogenetically more clo-
sely related to other members of the Pooideae than to
maize, rice, and sorghum [54,55]. The GO annotation
analysis reveals that a broad spectrum of genes was
sampled in our normalized cDNA pool from multiple
tissues and developmental stages. The large number of
reads g enerated by 454 sequencing entails a substantial
gain at the level of gene discovery which provides a
valuable resource for forward and reverse genetics
approaches in rye as well as for comparative gene ana-
lyses. A significant fraction of multi-line contigs (31%)
gave no hits with the public grass sequence resources.
In part this finding can be attributed to species specific
and tribe specific genes and gene families. The Pooideae
contain 265 subfamily-specific gene families leading to
subfamily-specific Blast hits [6]. Given our stringent
BlastX/tBlastX cut-off value of > 70% sequence identity,
non-conserved and non-coding sequences such as 3’-or
5’ - untranslat ed regions and non-coding RNAs are
assumed to contribute to the fraction that lacks homol-
ogy with other grass species. Around 2 % of all rye 4 54
reads revealed hits to the MIPS Repeat Element data-
base [36], suggesting that transcriptional activity of ret-
rotransposons contributed to the sampled RNA pool.
Transcriptome sequencing in two rice subspecies
detected alternative splicing patterns in about half of the
rice genes and more than 15,000 novel t ranscriptional
active regions of which more than half had no homolog
in public protein data [56]. This might suggest that the
rye EST resource contains rare, t issue-specific and/or
stress-related transcripts that are not represented in
sequence resources of the closely related species wheat
and barley despite their extensive EST resources. It is
anticipated that rye transcriptome sequence analysis will
greatly benefit from a reference genome sequence for a
membe r of the Triticeae family. Whole genome sequen-
cing is in progress for barley [49,57] and wheat [58] and
exploratory BAC end sequencing of rye 1RS-specific
BAC libraries [59] has been reported. In si lico mapping
of rye ESTs to the model genome of Brachypodium
revealed an even distribution of rye transcripts when
anchored to their Brachypodium homologs. The large
extent of synteny between grass genomes will facilitate
the construction of a virtual gene map of rye represent-
ing the ancestral gene scaffold. Genetic mappin g of the
SNPs represented on the Rye5K array and of SSRs
developed from our rye ESTs is underway and will lead
to fine-scale comparative maps between rye and other
grasses. A fully an notated genome sequence for rye is
still out of reach due to the complexity and highly repe-
titive nature of the rye genome. However, with the tools
established in our study, rye catches up with other grass
genome resources and a far more detailed glimpse into
the rye genome and its evolution will be possible.
Molecular toolbox for rye
Sequence inform ation of the five rye in bred lines was
used to detect sequence variation that was transferred
into more than 1,300 SSRs and about 5,000 SNPs. Mole-
cular markers have been developed for a range of crop
species and play an essential role in modern plant
breeding. They have been used to monitor DNA
sequence diversity within and among species, to identify
genes responsible for desired traits, to disclose sources
of genetic variation that allow for the production of new
varieties by introducing favorable traits from landraces
and related grass species, and to manage backcrossing
programs [60]. T ogether with am plified fragm ent length
polymorphisms (AFLPs), SSRs are currently the most
Haseneyer et al. BMC Plant Biology 2011, 11:131
/>Page 10 of 13
popular marker system in cereals. They have been devel-
oped for major crop plants including cereals and when
applied in breeding programs this mark er system is pre-
dicted to lead to accelerated progress [61]. Currently,
the availability of public rye SSRs is very limited. Our
resource significantly increases this marker resource that
might facilitate the assessment of genetic variability and
the estimation of genetic distances between populations.
Besides SSRs the marker system receiving the greatest
attention nowadays are SNPs [62]. SNPs have shown
huge potential in highly efficient finge rprinting, genetic
map construction, marker assisted selection as well as
population and evolutionary genetics. The Rye5K SNP
array provides a powerful new resource for large-scale
genotyping in molecular and genome-centric research in
rye. Recently whole-ge nome genotyping arrays became
available for crops and livestock and are used for gen-
ome-wide association studies and to investigate genetic
variation [e.g. [63]]. In a pilot experiment, we analyzed
59 rye inbred lines including the five lines used for
sequencing with the Rye5K SNP array to estimate the
degree of residual heterozygosity. Theoretical expecta-
tion after two, three or six cycles of selfing is about
12.5%, 6.3%, and 1.6%, respectively. Genotyping of these
59 lines using the Rye5K array showed that the degree
of heterozygosity significantly (p-value < 0 .05) exceeds
this theoretical expectation. This might be in part
explained by the allogamous behaviour of rye resulting
in remaining heterozygosity [64]. Despite forced selfing
during inbred line production some degree of cross-pol-
lination cannot be excluded as the seed was produced as
single-ear progenies in a comm ercial breedi ng program.
The l ower levels of residual heterozygosity observed for
the seed parent pool is in agreement with the higher
advanced selfing gene rations in rye seed parent lines (P.
Wilde, personal communication). A detailed analysis of
sequences that remained heterozygous indicated
sequences belonging to large gene families, such as
transferases and hydroxylases. Detection of SNPs in
paralogs or members of gene families may mimic a sub-
stantial part of the detected hetero zygosity, thus leading
to an overestimation of the true remaining heterozyg os-
ity in the rye inbred lines.
Conclusions
In conclusion, the Sce_Assembly03 provides a new and
comprehensive EST resource that integrates rye in the
comparative analysis between small grain cereals. The
Rye5K SNP array allows the analysis of large sets of indi-
viduals to obtain genotyping data for association studies,
estimating linkage disequilibrium, and population genetic
approaches. Our genomic resources comprise 115,400
EST sequences, 1,385 SSRs, more than 5,000 SNPs, and
the Rye5K SNP array for large-scale genotyping that will
improve and promote genetic and genomic research as
well as genome-based breeding in rye.
Additional material
Additional file 1: Set of plant tissues for RNA extraction. RNA of
each rye inbred line was extracted from plant tissues exposed to various
stress treatments and harvested at different developmental stages.
Additional file 2: Establishment and description of the
Sce_Assembly02 generated for in silico SNP mining. The
Sce_Assembly02 was performed in three steps using the MIRA assembler
V2.9 on integrated standard settings: Firstly, raw sequence reads
surpassed a quality filtering process where 454 sequencing adapter and
cDNA synthesis primer sequences as well as low quality reads were
removed. Secondly, the cleaned and trimmed sequence reads were
subjected to a line-specific assembly where reads of each inbred line
were aligned in a separate assembly run. Non-aligned reads in the line-
specific assemblies, i.e. singletons, were rejected. Thirdly, those reads that
merged into contigs in the line-specific assemblies were moved further
to the Sce_Assembly02 starting again with the cleaned and trimmed
reads, but now from all five inbred lines. This strategy resulted in contig
sequences that were used for SNP detection and subsequently for the
design of the high-throughput genotyping SNP array. With regard to
SNP discovery this assembly allowed the deduction of critical information
about the SNP position like allele coverage.
Additional file 3: GigaBayes parameters. Only parameters different
from GigaBayes program default settings are listed.
Additional file 4: Association of multi-line and single-line contigs of
the Sce_Assembly03 to the Brachypodium chromosomes Bd1 to
Bd5. The four heatmaps per chromosome are depicting the density of
Brachypodium genes, homologous rye sequences, contigs represented on
the Rye5k SNP array, and SNPs that were heterozygous among 59 rye
inbred lines (from top to bottom) by going along the Brachypodium
chromosomes in a sliding window with 0.5 Mb window size and a 0.1
Mb shift and determining for each window the number and percent bp
coverage of the respective tagged genes. The density values were
corrected for the number of Ns per window, if the N content exceeded
60% the value was set to zero and drawn in white color. The number
was extrapolated to number per Mb to facilitate comparisons. The
heatmaps were created from density values using the Python pylab
module in combination with the jet colormap (low to high values from
blue to red). Minimum, maximum, and mean number of genes/Mb in
Brachypodium and hits/Mb in rye, respectively, were given on the left of
each map. The ruler on top gives the chromosome length in Mb.
Additional file 5: GO categories found in the Sce_Assembly03
multi-line and single-line contig sequences on Blast2GO level 2.
Categories with an occurrence less than 0.05% were summarized in
“others”.
Additional file 6: SSR motifs detected in 338,536 contigs of the five
line-specific assemblies. Mononucleotide repeat motifs were discarded.
Mixed motifs describe two close SSR motifs which are separated by less
than 100 bp.
Additional file 7: Description of the Rye5K SNP array. SNP containing
contigs represented on the Rye5K SNP array were listed including
candidate SNP position, probe design sequences provided to Illumina
Inc. (San Diego, USA), and GO annotations.
Additional file 8: Observed residual heterozygosity of 54 rye inbred
lines representing the two heterotic pools. Heterozygosity was
calculated based on genotyping data obtained with the Rye5K SNP
array. Lines from the pollen parent pool were in generations F
3
to F
4
,
lines from the seed parent pool were in generation F
6
.
Acknowledgement
We thank Fritz Thümmler (vertis AG, Freising, Germany) for synthesizing and
normalizing the cDNA samples, KWS LOCHOW GMBH for providing seed
Haseneyer et al. BMC Plant Biology 2011, 11:131
/>Page 11 of 13
and DNA samples, and Christof Pietsch for his initial work on the SNP
discovery pipeline. This work was supported by a grant [0315063A to E.B.,
0315063B to N.S., 0315063C to K.M.] in the framework of the initiative ‘GABI-
Future’ of the German Ministry of Education and Research (BMBF).
Author details
1
Plant Breeding, Technische Universität München, Centre of Life and Food
Sciences Weihenstephan, 85354 Freising, Germany.
2
Bioinformatics and
Information Technology, Leibniz-Institute of Plant Genetics and Crop Plant
Research (IPK), D-06466 Gatersleben, Germany.
3
MIPS/IBIS, Institute for
Bioinformatics and Systems Biology, Helmholtz Centre Munich, German
Research Centre for Environmental Health (GmbH), 85764 Neuherberg,
Germany.
4
Genome Diversity, Leibniz Institute of Plant Genetics and Crop
Plant Research (IPK), 06466 Gatersleben, Germany.
5
Genome Analysis, Leibniz
Institute for Age Research, Fritz-Lipmann-Institute (FLI), 07745 Jena, Germany.
Authors’ contributions
GH prepared the sequencing samples, participated in the bioinformatic
analyses, conducted the genotyping, and evaluated the genotyping data. TS,
MM, and US carried out the processing and assembly of 454 reads and gave
the descriptive statistics for them. KFXM and MS performed the BLAST
analyses, functional annotations, and sequence comparisons along the
Brachypodium chromosomes. NS and RZ developed and examined the SSR
markers. EB, GH, and TS developed the Rye5k SNP array. CCS, EB, KFXM, NS,
and US designed the study. EB, GH, MS, RZ, and TS drafted the manuscript.
All authors read and approved the final manuscript.
Received: 16 February 2011 Accepted: 28 September 2011
Published: 28 September 2011
References
1. Limin AE, Fowler DB: Cold hardiness of forage grasses grown on the
canadian prairies. Can J Plant Sci 1987, 67(4):1111-1115.
2. Ko JM, Seo BB, Suh DY, Do GS, Park DS, Kwack YH: Production of a new
wheat line possessing the 1BL.1RS wheat-rye translocation derived from
Korean rye cultivar Paldanghomil. Theor Appl Genet 2002, 104(2-
3):171-176.
3. Goff SA, Ricke D, Lan TH, Presting G, Wang R, Dunn M, Glazebrook J,
Sessions A, Oeller P, Varma H, et al: A draft sequence of the rice genome
(Oryza sativa L. ssp. japonica). Science 2002, 296(5565):92-100.
4. Yu J, Hu S, Wang J, Wong GK, Li S, Liu B, Deng Y, Dai L, Zhou Y, Zhang X,
et al: A draft sequence of the rice genome (Oryza sativa L. ssp. indica).
Science 2002, 296(5565):79-92.
5. Paterson AH, Bowers JE, Bruggmann R, Dubchak I, Grimwood J,
Gundlach H, Haberer G, Hellsten U, Mitros T, Poliakov A, et al: The Sorghum
bicolor genome and the diversification of grasses. Nature 2009,
457(7229):551-556.
6. The International Brachypodium Initiative: Genome sequencing and
analysis of the model grass Brachypodium distachyon. Nature 2010,
463(7282):763-768.
7. Schnable PS, Ware D, Fulton RS, Stein JC, Wei F, Pasternak S, Liang C,
Zhang J, Fulton L, Graves TA, et al: The B73 maize genome: complexity,
diversity, and dynamics. Science 2009, 326(5956):1112-1115.
8. Doležel J, Greilhuber J, Lucretti S, Meister A, Lysák MA, Nardi L,
Obermayer R: Plant genome size estimation by flow cytometry: Inter-
laboratory comparison. Ann Bot 1998, 82(suppl 1):17-26.
9. Flavell RB, Bennett MD, Smith JB, Smith DB: Genome size and the
proportion of repeated nucleotide sequence DNA in plants. Biochemical
Genetics 1974, 12(4):257-269.
10. Shi B, Collins N-C, Langridge P, Gustafson J: Construction of a rye cv.
Blanco BAC library, and progress towards cloning the rye Alt3
aluminium tolerance gene. Vortr Pflanzenzuchtg 2007, 71:205-209.
11. Hackauf B, Rudd S, van der Voort JR, Miedaner T, Wehling P: Comparative
mapping
of DNA sequences in rye (Secale cereale L.) in relation to the
rice genome. Theor Appl Genet 2009, 118(2):371-384.
12. Khlestkina EK, Than MH, Pestsova EG, Roder MS, Malyshev SV, Korzun V,
Borner A: Mapping of 99 new microsatellite-derived loci in rye (Secale
cereale L.) including 39 expressed sequence tags. Theor Appl Genet 2004,
109(4):725-732.
13. Korzun V, Malyshev S, Voylokov AV, Börner A: A genetic map of rye (Secale
cereale L.) combining RFLP, isozyme, protein, microsatellite and gene
loci. Theor Appl Genet 2001, 102(5):709-717.
14. Ma XF, Wanous MK, Houchins K, Milla MAR, Goicoechea PG, Wang Z, Xie M,
Gustafson JP: Molecular linkage mapping in rye (Secale cereale L.). Theor
Appl Genet 2001, 102(4):517-523.
15. Senft P, Wricke G: An extended genetic map of rye (Secale cereale L.).
Plant Breeding 1996, 115(6):508-510.
16. Metzker ML: Sequencing technologies - the next generation. Nat Rev
Genet 2010, 11(1):31-46.
17. Meyer E, Aglyamova GV, Wang S, Buchanan-Carter J, Abrego D,
Colbourne JK, Willis BL, Matz MV: Sequencing and de novo analysis of a
coral larval transcriptome using 454 GSFlx. BMC Genomics 2009, 10:219.
18. Sun C, Li Y, Wu Q, Luo H, Sun Y, Song J, Lui EM, Chen S: De novo
sequencing and analysis of the American ginseng root transcriptome
using a GS FLX Titanium platform to discover putative genes involved in
ginsenoside biosynthesis. BMC Genomics 2010, 11:262.
19. Hillier LW, Marth GT, Quinlan AR, Dooling D, Fewell G, Barnett D, Fox P,
Glasscock JI, Hickenbotham M, Huang W, et al: Whole-genome sequencing
and variant discovery in C. elegans. Nat Methods 2008, 5(2):183-188.
20. Torres TT, Metta M, Ottenwalder B, Schlotterer C: Gene expression profiling
by massively parallel sequencing. Genome Res 2008, 18(1):172-177.
21. Wicker T, Taudien S, Houben A, Keller B, Graner A, Platzer M, Stein N: A
whole-genome snapshot of 454 sequences exposes the composition of
the barley genome and provides evidence for parallel evolution of
genome size in wheat and barley. Plant J 2009.
22. Lister R, Ecker JR: Finding the fifth base: genome-wide sequencing of
cytosine methylation.
Genome Res 2009, 19(6):959-966.
23.
Novaes E, Drost D, Farmerie W, Pappas G, Grattapaglia D, Sederoff R,
Kirst M: High-throughput gene and SNP discovery in Eucalyptus grandis,
an uncharacterized genome. BMC Genomics 2008, 9(1):312.
24. Korzun V, Malyshev S, Kartel N, Westermann T, Weber WE, Börner A: A
genetic linkage map of rye (Secale cereale L.). Theor Appl Genet 1998,
96(2):203-208.
25. Oztur ZN, Talame V, Deyholos M, Michalowski CB, Galbraith DW,
Gozukirmizi N, Tuberosa R, Bohnert HJ: Monitoring large-scale changes in
transcript abundance in drought- and salt-stressed barley. Plant Mol Biol
2002, 48(5-6):551-573.
26. Kumar S, Blaxter ML: Comparing de novo assemblers for 454
transcriptome data. BMC Genomics 2010, 11:571.
27. Chevreux B, Pfisterer T, Drescher B, Driesel AJ, Muller WE, Wetter T, Suhai S:
Using the miraEST assembler for reliable and automated mRNA
transcript assembly and SNP detection in sequenced ESTs. Genome Res
2004, 14(6):1147-1159.
28. Margulies M, Egholm M, Altman WE, Attiya S, Bader JS, Bemben LA, Berka J,
Braverman MS, Chen YJ, Chen Z, et al: Genome sequencing in
microfabricated high-density picolitre reactors. Nature 2005,
437(7057):376-380.
29. Huang X, Madan A: CAP3: A DNA sequence assembly program. Genome
Res 1999, 9(9):868-877.
30. Riano-Pachón DM, Nagel A, Neigenfind J, Wagner R, Basekow R, Weber E,
Mueller-Roeber B, Diehl S, Kersten B: GabiPD: the GABI primary database -
a plant integrative ‘omics’ database. Nucleic Acids Res 2009, , 37 Database:
D954-959.
31. Altschul SF, Gish W, Miller W, Myers EW, Lipman DJ: Basic local alignment
search tool. J Mol Biol 1990, 215(3):403-410.
32. Rice Annotation Project: The Rice Annotation Project Database (RAP-DB):
2008 update. Nucleic Acids Res 2008, 36(suppl_1):D1028-1033.
33. Matsumoto T, Tanaka T, Sakai H, Amano N, Kanamori H, Kurita K, Kikuta A,
Kamiya K, Yamamoto M, Ikawa H, et al: Comprehensive sequence analysis
of 24,783 barley full-length cDNAs derived from 12 clone libraries. Plant
Physiology 2011, 156(1):20-28.
34. Mochida K, Yoshida T, Sakurai T, Ogihara Y, Shinozaki K:
TriFLDB: a
database
of clustered full-length coding sequences from Triticeae with
applications to comparative grass genomics. Plant Physiology 2009,
150(3):1135-1146.
35. Jurka J: Repeats in genomic DNA: mining and meaning. Curr Opin Struct
Biol 1998, 8(3):333-337.
36. Spannagl M, Noubibou O, Haase D, Yang L, Gundlach H, Hindemitt T,
Klee K, Haberer G, Schoof H, Mayer KF: MIPSPlantsDB–plant database
Haseneyer et al. BMC Plant Biology 2011, 11:131
/>Page 12 of 13
resource for integrative and comparative plant genome research. Nucleic
Acids Res 2007, , 35 Database: D834-840.
37. Hunter JD: Matplotlib: A 2D Graphics Environment. Comput Sci Eng 2007,
9(3):90-95.
38. Conesa A, Gotz S, Garcia-Gomez JM, Terol J, Talon M, Robles M: Blast2GO: a
universal tool for annotation, visualization and analysis in functional
genomics research. Bioinformatics 2005, 21(18):3674-3676.
39. Thiel T, Michalek W, Varshney RK, Graner A: Exploiting EST databases for
the development and characterization of gene-derived SSR-markers in
barley (Hordeum vulgare L.). Theor Appl Genet 2003, 106(3):411-422.
40. Rozen S, Skaletsky H: Primer3 on the WWW for general users and for
biologist programmers. Methods Mol Biol 2000, 132:365-386.
41. Marth GT, Korf I, Yandell MD, Yeh RT, Gu Z, Zakeri H, Stitziel NO, Hillier L,
Kwok PY, Gish WR: A general approach to single-nucleotide
polymorphism discovery. Nat Genet 1999, 23(4):452-456.
42. Huang W, Marth G: EagleView: a genome assembly viewer for next-
generation sequencing technologies. Genome Res 2008, 18(9):1538-1543.
43. R Development Core Team: R: A language and environment for statistical
computing. R Foundation for Statistical Computing, Vienna, Austria 2004
[], ISBN 3-900051-07-0.
44. Zagrobelny M, Scheibye-Alsing K, Jensen NB, Moller BL, Gorodkin J, Bak S:
454 pyrosequencing based transcriptome analysis of Zygaena
filipendulae with focus on genes involved in biosynthesis of cyanogenic
glucosides. BMC Genomics 2009, 10:574.
45. Wu TD, Watanabe CK: GMAP: a genomic mapping and alignment
program for mRNA and EST sequences. Bioinformatics 2005,
21(9):1859-1875.
46. Li H, Ruan J, Durbin R: Mapping short DNA sequencing reads and calling
variants using mapping quality scores. Genome Res 2008,
18(11):1851-1858.
47. Huang S, Li R, Zhang Z, Li L, Gu X, Fan W, Lucas WJ, Wang X, Xie B, Ni P,
et al: The genome of the cucumber, Cucumis sativus L. Nat Genet 2009,
41(12):1275-1281.
48. Li R, Fan W, Tian G, Zhu H, He L, Cai J, Huang Q, Cai Q, Li B, Bai Y, et al:
The sequence and de novo assembly of the giant panda genome. Nature
2010, 463(7279):311-317.
49. Mayer KF, Taudien S, Martis M, Simkova H, Suchankova P, Gundlach H,
Wicker T, Petzold A, Felder M, Steuernagel B, et al: Gene content and
virtual gene order of barley chromosome 1H. Plant Physiol 2009,
151(2):496-505.
50. Coche T, Dewez M: Reducing bias in cDNA sequence representation by
molecular selection. Nucleic Acids Res 1994, 22(21):4545-4546.
51. Emrich SJ, Barbazuk WB, Li L, Schnable PS: Gene discovery and annotation
using LCM-454 transcriptome sequencing. Genome Res 2007, 17(1):69-73.
52. Patanjali SR, Parimoo S, Weissman SM: Construction of a uniform-
abundance (normalized) cDNA library. Proc Natl Acad Sci USA 1991,
88(5):1943-1947.
53. Schafleitner R, Tincopa LR, Palomino O, Rossel G, Robles RF, Alagon R,
Rivera C, Quispe C, Rojas L, Pacheco JA, et al: A sweet potato gene index
established by de novo assembly of pyrosequencing and Sanger
sequences and mining for gene-based microsatellite markers. BMC
Genomics 2010, 11:604.
54. Bolot S, Abrouk M, Masood-Quraishi U, Stein N, Messing J, Feuillet C, Salse J:
The ‘inner circle’ of the cereal genomes. Curr Opin Plant Biol 2009,
12(2):119-125.
55. Gaut BS: Evolutionary dynamics of grass genomes. New Phytologist 2002,
154(1):15-28.
56. Lu T, Lu G, Fan D, Zhu C, Li W, Zhao Q, Feng Q, Zhao Y, Guo Y, Huang X,
et al: Function annotation of the rice transcriptome at single-nucleotide
resolution by RNA-seq. Genome Res 2010, 20(9):1238-1249.
57. Steuernagel B, Taudien S, Gundlach H, Seidel M, Ariyadasa R, Schulte D,
Petzold A, Felder M, Graner A, Scholz U, et al: De novo 454 sequencing of
barcoded BAC pools for comprehensive gene survey and genome
analysis in the complex genome of barley. BMC Genomics 2009, 10:547.
58. Paux E, Sourdille P, Salse J, Saintenac C, Choulet F, Leroy P, Korol A,
Michalak M, Kianian S, Spielmeyer W, et al: A physical map of the 1-
gigabase bread wheat chromosome 3B. Science 2008, 322(5898):101-104.
59. Bartos J, Paux E, Kofler R, Havrankova M, Kopecky D, Suchankova P, Safar J,
Simkova H, Town C, Lelley T, et al: A first survey of the rye (Secale cereale)
genome composition through BAC end sequencing of the short arm of
chromosome 1R. BMC Plant Biol 2008,
8(1):95.
60. Korzun V: Molecular markers and their application in cereals breeding. In
Proceedings of the workshop “Marker assisted selection: A fast track to increase
genetic gain in plant and animal breeding?": 17-18 October 2003; University of
Turin, Italy Edited by: Lanteri S 2003, 18-22, Electronic forum on
biotechnology in food and agriculture.
61. Gupta PK, Varshney RK, Sharma PC, Ramesh B: Molecular markers and their
applications in wheat breeding. Plant Breeding 1999, 118(5):369-390.
62. Schulman AH: Molecular markers to assess genetic diversity. Euphytica
2007, 158(3):313-321.
63. Matukumalli LK, Lawley CT, Schnabel RD, Taylor JF, Allan MF, Heaton MP,
O’Connell J, Moore SS, Smith TPL, Sonstegard TS, et al: Development and
Characterization of a High Density SNP Genotyping Assay for Cattle.
PLoS ONE 2009, 4(4):e5350.
64. Adams MW, Shank DB: The relationship of heterozygosity to homeostasis
in maize hybrids. Genetics 1959, 44(5):777-786.
doi:10.1186/1471-2229-11-131
Cite this article as: Haseneyer et al.: From RNA-seq to large-scale
genotyping - genomics resources for rye (Secale cereale L.). BMC Plant
Biology 2011 11:131.
Submit your next manuscript to BioMed Central
and take full advantage of:
• Convenient online submission
• Thorough peer review
• No space constraints or color figure charges
• Immediate publication on acceptance
• Inclusion in PubMed, CAS, Scopus and Google Scholar
• Research which is freely available for redistribution
Submit your manuscript at
www.biomedcentral.com/submit
Haseneyer et al. BMC Plant Biology 2011, 11:131
/>Page 13 of 13