báo cáo khoa học: " Identification and analysis of common bean (Phaseolus vulgaris L.) transcriptomes by massively parallel pyrosequencing" doc
Bạn đang xem bản rút gọn của tài liệu. Xem và tải ngay bản đầy đủ của tài liệu tại đây (1.17 MB, 18 trang )
RESEARCH ARTICLE Open Access
Identification and analysis of common bean
(Phaseolus vulgaris L.) transcriptomes by
massively parallel pyrosequencing
Venu Kalavacharla
1,4*
, Zhanji Liu
1
, Blake C Meyers
2
, Jyothi Thimmapuram
3
and Kalpalatha Melmaiee
1
Abstract
Background: Common bean (Phaseolus vulgaris) is the most important food legume in the world. Although this
crop is very important to both the developed and developing world as a means of dietary protein supply,
resources available in common bean are limited. Global transcriptome analysis is important to better understand
gene expression, genetic variation, and gene structure annotation in addition to oth er important features. However,
the number and description of common bean sequences are very limited, which greatly inhibits genome and
transcriptome research. Here we used 454 pyrosequencing to obtain a substantial transcriptome dataset for
common bean.
Results: We obtained 1,692,972 reads with an average read length of 207 nucleotides (nt). These reads were
assembled into 59,295 unigenes including 39,572 contigs and 19,723 singletons, in addition to 35,328 singletons
less than 100 bp. Comparing the unigenes to common bean ESTs deposited in GenBank, we found that 53.40% or
31,664 of these unigenes had no matches to this dataset and can be considered as new common bean transcripts.
Functional annotation of the unigenes carried out by Gene Ontology assignments from hits to Arabidopsis and
soybean indicated coverage of a broad range of GO categories. The common bean unigenes were also compared
to the bean bacterial artificial chromosome (BAC) end sequences, and a total of 21% of the unigenes (12,724)
including 9,199 contigs and 3,256 singletons match to the 8,823 BAC-end sequences. In addition, a large number
of simple sequence repeats (SSRs) and transcription factors were also identified in this study.
Conclusions: This work provides the first large scale identification of the common bean transcriptome derived by
454 pyrosequencing. This research has resulted in a 150% increase in the number of Phaseolus vulgaris ESTs. The
dataset obtained through this analysis will provide a platform for functional genomics in common bean and
related legumes and will aid in the development of molecular markers that can be used for tagging genes of
interest. Additionally, these sequences will provide a means for better annotation of the on-going common bean
whole genome sequencing.
Background
Phaseolus vulga ris or common bean is the most impor-
tant edible food legume in the world. It provide s 15% of
the protein and 30% of the caloric requirement to the
world’ s population, and represents 50% of the grain
legumes consumed worldwide [1]. Common bean has
several market classe s, which include dry beans, cann ed
beans, and green beans. The related legume soybean
(Glycine max), which is one of the most important
sources of s eed protein and oil cont ent belongs to the
same group of papilionoid legumes as common bean.
Common bean and soybean diverged nearly 20 million
years ago around the time of the maj or duplication
event in soybean [2,3]. Synteny analysis in dicates that
most segments of any one common bean linkage group
are highly similar to two soybean chromosomes [4].
Since P. vulgaris is a true diploid with a genome size
estimated to be between 588 and 637 mega base pairs
(Mbp) [5-7], it will serve as a m odel for understanding
the ~1,100 m illion base pairs (Mbp) soybean genome
* Correspondence:
1
College of Agriculture & Related Sciences, Delaware State University, Dover,
DE 19901, USA
Full list of author information is available at the end of the article
Kalavacharla et al. BMC Plant Biology 2011, 11:135
/>© 2011 Kalavacharla et al; licensee BioMed Central Ltd. This is an Open Access article distributed under the terms of the Creative
Commons Attribution License (http://creativeco mmons.org/lic enses/by/2.0) , which permits unrestricted use, distribut ion, and
reproduction in any medium, provided the original work is properly cited.
[1]. Common bean is also related to other members of
the papilionid legumes including cowpea (Vigna ungui-
culata) and pigeon pea (Vigna radiata). Therefore, bet-
ter knowledge of the common bean genome will
facilitate better understanding of other important
legumesaswellasthedevelopmentofcomparative
genomics resources.
The common bean genome is currently being
sequenced [8]. When the sequencing of the genome is
complete, this will require the prediction, annotation
and validation of the expressed genes in common bean.
The availability of large sets of annotated sequences as
derived by identification, sequencing, and validation of
genesexpressedinthecommonbeanwillhelpinthe
development of an accurate and complete structural
annotation of the common bean genome, a valid tran-
scriptome map, and the identification of the genetic
basis of agriculturally important traits in common bean.
The tran scriptome sequences will also help in the iden-
tification of transcription factors and small RNAs in
comm on bean, understanding of gene families, and very
importantly the development of molecular markers for
common bean.
To date there are several relevant and important p ub-
lications in common bean transcriptome sequencing and
bioinformatics analyses. Ramirez et al. [9] sequenced
21,026 ESTs from various cDNA libraries (nitrogen-fix-
ing root no dules, phosphorus-deficient roots, developing
pods, and leaves) derived from the Meso-American
common bean genotype Negro Jamapa 81, and leaves
from the Andean genotype G19833. Approximately
10,000 of these identified ESTs were classified into 2,226
contigs and 7,969 singletons.
Melotto et al. [10] constructed three cDNA libraries
from the common bean breeding line SEL1308. These
libraries were comprised of 19-day old trifoliate leaves,
10-day old shoots, and 13-day old shoots (inoculated
with Colletotrichum lindemuthianum). Of the 5,255 sin-
gle-pass sequences obtained from this work, trimming
and clustering helped identify 3,126 unigenes, and of
these only 314 unigenes showed similarity to sequences
from the existing database.
Tian et al. [11] constructed a sup pression substractive
cDNA library to identify genes involved in response to
phosphorous st arvation. Six-day old seedlings from the
genotype G19833 were exposed to high and low phos-
phorus (five and 1,000 μmol/L) respectively and the poly
(A+) RNA derived from total shoot and root RNA from
plants in these conditions was used for construction of
the librari es. After dot-blot hybridization and identifica-
tion of differentially expressed clones, full-length cDNAs
were identified from cDNA libraries constructed from
the low and high P exposure experim ents. Differentially
expressed genes were characterized into five functional
groups, and these authors were able to further classify
72 genes by comparison to the GenBank non-redundant
database using BLASTx values less than 1.0 × 1e
-2
).
Thibivilliers et al. [7] identified 6, 202 new common
bean ESTs (out of a total of 10,221 ESTs) by using a
substractive cDNA library constructed from the com-
mon bean rust resistant-cultivar Early Gallatin. This cul-
tivar was inoculated with races 49 (avirulent on
gen otypes such as Early Gallatin carrying the rust resis-
tance locus Ur-4) and 41 (a virulent race that is not
recognized by Ur-4). In order to identify genes which
aredifferentiallyexpressed, suppression substractive
expression experiments were carried out to identify
sequences which were up-regulated in response to sus-
ceptible and resistant host-pathogen interactions.
Despite these studies in common bean, there is still a
paucity in the number of common bean ESTs and genes
that have been deposited in GenBank (~83,448 ESTs, as
of September, 2010) compared to other legume and
plant models. T herefore, there is a need for deeper cov-
erage and EST sequences from diverse common bean
tissues and genotypes.
There has been an evolution in sequen cing technolo-
gies starting with the traditional dideoxynucleotide
sequencing to capillary-based sequencing to current
“next-generation” sequencing [12,13]. The emergence of
next-generation sequencing technologies has substan-
tially helped advance plant genome research, particularly
for non-model plant species [14]. Next generation
sequencing strategies typically have the ability to gener-
ate millions of reads of sequences at a time, without the
need for cloning of the fragment libraries; these are fas-
ter than traditional capillary-based methods which may
be limited to 96 samples in a run and require the
nucleic acid material (DNA or complementary DNA;
cDNA) to be c loned into a plasmid and amplified by
Escherichia coli (E. coli). Therefore, cloning bias that is
typically present in genome s equencing projects can be
avoided, although depending on the specific platform
used for next generation sequencing, there may be other
specific biases involved. An advantage of some next gen-
eration sequencing technologies is that information on
genome organization and layout may not be necessary a
priori. The Roche 454 method uses the pyrophosphate
molecule released when nucleotides are incorporated by
DNA polymerase into the growing DNA c hain to fuel
reactions that result in the detection of light resulting
from cleavage of oxyluciferin by luciferase [15]. Using
an emulsion PCR approach, it has the ability to
sequence 400 to 500 nucleotides of paired ends and pro-
duces approximately 400-600 Mbp per run. This
method has been applied to genome [16] and transcrip-
tome [17-19] sequencing due to its high throughput,
coverage, and savings in cost.
Kalavacharla et al. BMC Plant Biology 2011, 11:135
/>Page 2 of 18
In A. thal iana, pyrosequencing has been tested suc-
cessfully to verify whether this technology is able to pro-
vide an unbiased representation of transcripts as
compared to the sequenced genome. Using messenger
RNA (mRNA) derived from Arabidop sis seedlings,
Weber and colleagues [20] identified 541,852 ESTs
which accounted for nearly 17,449 gene loci and thus
provided very deep coverage of the transcriptome. The
analysis also revealed that all regions of the mRNA tran-
script were equally represented therefore removing
issues of bias, and very importantly, over 16,000 of the
ESTs identif ied in this research were novel and did not
exist in the existing EST database. Therefore , these
researchers concluded that the pyrosequencing platform
has the ability to aid in gene discovery and expression
analysis for non-model plants, and could be used for
both genomic and transcriptomic analysis.
In the legume Medicago truncatula, the 454 technol-
ogy has been used to generate 252,384 reads with a ver-
age (c leaned) read length of 92 nucleotides [16], with a
total o f 184,599 unique sequences gene rated after clus-
tering and assembly. Gene ontology (GO) assignments
from matches to the completed Ar abidopsis sequence
showed a broad coverage of the GO categories. Cheung
and colleagues [17] were also able to map 70,026 reads
generated in this research to 785 Medicago BAC
sequences. In their a nalysis of the maize shoot apical
meristem, Emrich and colleagues [16] discovered
261,000 ESTs, annotat ed more than 25,000 maize geno-
mic sequences, and identified ~400 maize transcripts for
which homologs have not been identified in any other
species. The value of this approach in novel gene/EST
discovery is underlined by the fact that nearly 30% of
the ESTs identified in this study did not match the
~648,000 maize ESTs in the databases. Velasco and col-
leagues [21] generated a draft genome of grape, Vitis
vinifera Pinot Noir by using a combination of Sanger
sequencing and 454 sequencing. They identified
approximately 29,585 predicted genes of which 96.1%
could be assigned to genetic linkage groups (LGs). Many
of the genes identified have potential implications on
grapevine cultivation including those that influence wine
quality, and response to pathogens. Detailed analysis
was also carried out to identify sequences related to dis-
ease resistance, phenolic and terpenoid pathways, tra n-
scription factors, repetitive elements, and non-coding
RNAs (including microRNAs, transfer RNAs, small
nuclear RNAs, ribosomal RNAs and small nucleolar
RNAs).
Sequences obtained in common bean by deep sequen-
cing can be mapped onto common bean maps by using
syntenic relationships between common bean and soy-
bean; these two species diverged over 19 MYA. McClean
et al. [22] determined syntenic relationships between
common bean and soybean by taking genetically posi-
tioned transcript loci and mapping to the soybean 1.01
pseudochromosome assembly. Since prior evidence has
shown that almost every common bean locus maps to
two soybean locations (recent diploidy and polyploidy
respectively), and a genome assembly is not yet available
in common bean, this synteny can be effectively utilized.
Therefore, by referencing common bean loci with
unknown physical map positions (in common bean) to
syntenic regions in soybean, and then referencing back
to the common bean genet ic map, approximate loca-
tions of common bean transcript loci were determined.
Using this method, the authors [22] were able to deter-
mine median physical-to-genetic distance ratio in com-
mon bean to be ~120 Kb/cM (based on the soybean
physical distance derived from the pseudochromosome
assembly). This allowed the placing of ~15,000 EST con-
tigs and singletons on the common bean map, and this
strategy will allow for the discovery and chromosomal
locations of genes controlling important tr aits in both
common bean and soybean. Therefore, until the com-
mon bean genome is completed, we can now use syn-
teny with soybean to determine more accurate locations
of common bean transcripts.
Results and Discussion
Generation of ESTs from Phaseolus vulgaris
Since the combined total number of common bean
ESTs that have been deposited in Genbank (as of Sep-
tember 2010) is ~83,000, we sought to increase the
diversity and number of these sequences to be useful for
functional genomics and molecular breeding studies.
We generated cDNA libraries from four plant tissues:
leaves, flowers, roots derived from the common bean
cultivar “Sierra” , and pods derived from the common
bean breeding line “BAT93.” Even though the genotype
that was chosen for the common bean genome sequen-
cing project is G19833, there is considerable valu e in
generating transcriptomic sequences from these addi-
tional genotypes. Sierra is a common bean cultivar
released by Michigan State University with improved
disease resistance, competitive yield, and upright growth
habit. Additionally, disease resistance in Sierra includes
rust resistance, field tolerance to white mold, and resis-
tance to Fusarium wilt [23]. The breeding line BAT93 is
one of the parents of the core common bean mapping
populations, and therefore, understanding and identifica-
tion of sequences expressed in the developing pod is
very useful. BAT93 also carries resistances to multiple
diseases. The sequence data obtained from this work
will also be very useful in identifying single nucleotide
polymorphism (SNP) loci when compared to sequences
derived from other genotypes in the work by Ramirez et
al. [9], Melotto et al. [10] and Thibivilliers et al. [7].
Kalavacharla et al. BMC Plant Biology 2011, 11:135
/>Page 3 of 18
The use of next-generation sequencing for transcrip-
tome and genome st udies has been well documented (as
discussed in background). Given the paucity of available
common bean sequences and our interest in generating
sequence reads long enough to be useful for the design
of primers for mapping onto the common bean map, we
chose the Roche 454 sequencing method (see materials
and methods). cDNAs derived from the RNA of the
four tissues were tagged with sequence tags that would
help identify tissue of origin after sequencing and
assembly of data. After normalization, library construc-
tion and sequencing, sequences were assembled and
annotated (see materials and methods) resulting in the
generatio n of ~1.6 million reads, with an averag e length
of 207 nu cleotide s (nt) and a total length of 350 Mbp
derived from three bulk 454 runs. These reads were
assembled using gsAssembler (Newbler, from Roche,
), into 39,572 con-
tigs and 55,051 singletons. Of these singletons, 35,328
were determined to be less than 100 nucleotides (nt).
Therefore, sequences derived from this study serve as an
important first step to deriving a larger transcriptomic
set of sequences in common bean and additionally
demonstrate the value of next-generation sequencing.
Further, these common bean sequences will be impor-
tant for discovery of orthologous genes in other so-
called “orphan legumes” [24]. Assembly statistics for the
454 reads are shown in Table 1. Of the 1.6 million
reads, we were able to assemble 75% of the reads. The
average length of contigs was 473 nt and for singletons
103 nt (Table 2). For the purposes of this work, we con-
sider the 39,572 contigs and 19,723 singletons which are
longer than 100 nt collectively as unigenes (totalling 59,
295). The number of contigs and singletons with respec-
tive sizes are shown in Table 2. The largest number of
contigs (11,597) was in the 200-299 nt range, followed
by 9,696 contigs in the 100-199 nt range. There were
5,438 contigs which wer e > 1,000 nt. The longest contig
length was 3,183 nt.
In order to determine the number of reads which
make up any particular contig in the assembly, we
determined the n umber of reads versus number of con-
tigs (Table 3). In our unigenes sequences, 22,723 contigs
were comprised of 2-10 reads (minimum read range).
Comparative analysis with existing Phaseolus vulgaris
ESTs
Most of the common b ean ESTs available in GenBank
are derived from genotypes such as Early Gallatin, Bat
93, Negro Jamapa 81, and G19833 [7]. In order to iden-
tify new P. vulgaris sequences among the 454 unigene
set that we generated, a BLASTn search (e-value < 1e
-
10
) against the common bean ESTs in GenBank was car-
ried out and revealed that 27,631 (46.60%) of the 454
unigenes matched known ESTs. Thus 31,664 unigenes
(18,087 contigs and 13,577 singletons; 53.40%) can be
considered as new P. vulgaris unigenes.
The 83,947 common bean EST sequences (as of Octo-
ber 1, 2010) can be assembled into about 20,000 un ique
sequences. These new sequences significantly enrich by
approximately 150% the number of transcripts of this
important legume and provide a significant resource for
discovering new genes, developing molecular markers
Table 1 Assembly statistics of common bean 454 reads
Name No.
Total reads 1,692,972
Reads fully assembled 1,280,774
Reads partially assembled 245,452
Repeats 53,136
Outliers 58,559
Contigs 39,572
Singletons 55,051
Singletons above 100 bp 19,723
Unigenes (contigs + singletons above 100 nt) 59,295
Table 2 Sequence length distribution of assembled
contigs and singletons
Nucleotide length (nt) Contigs Singletons
< 100 19 35,328
100-199 9,496 5,064
200-299 11,597 14,639
300-399 3,376 20
400-499 2,451 -
500-599 1,808 -
600-699 1,489 -
700-799 1,329 -
800-899 1,294 -
900-999 1,275 -
> 1000 5,438 -
Total 39,572 55,051
Maximum length 3,183 nt -
Average length 473 103
Table 3 Summary of component reads per contig.
Number of reads Number of contigs
2-10 22,723
11-20 3,920
21-30 2,087
31-40 1,526
41-50 1,137
51-100 3,332
101-150 1,435
151-200 715
> 200 1,999
Kalavacharla et al. BMC Plant Biology 2011, 11:135
/>Page 4 of 18
for future genetic linkage and QTL analysis, and com-
parative studies with other legumes, and will help in the
discovery and understanding of genes underlying agri-
culturally important traits in common bean.
Comparison with common bean BAC-end sequences
Recently, a BAC library for common bean genotype
G19 833 was constructed [25], and a draft FingerPrinted
Contig (FPC) physical map has been released using the
BAC-end sequences from this work (Genbank
EI415689-EI504705). This data set contains 89,017
BAC-end sequences. The FPC physical map makes it
possible to map some 454 unigenes into the bean physi-
cal map. All the 454 unigenes were compared to the
BAC-end sequences by BLASTN (e-value < 1e
-10
)
according to McClean et al [22]. As a result, a total of
12,725 unigenes including 9,199 contigs and 3,256 sin-
gletons (21% of the unigenes), were mapped to the avail-
able 8,823 BAC-end sequences.
Functional annotation of the P. vulgaris unigenes-
Comparison to Arabidopsis
The common bean unigene set was compared to pre-
dicted Arabidopsis protein sequences by using BLASTX.
A total of 26,622 (44.90%) of the unigenes had a signifi-
cant match with the annotated Arabidopsis proteins,
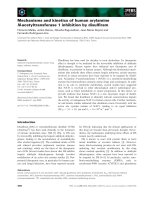
and were assigned putative functions (Figure 1). How-
ever, 55.10% (32,673) of the common bean unigenes had
no significant match and therefore could not be classi-
fied into gene ontology (GO) categories. The compari-
son of the distribution of P. vulgaris unigenes among
GO molecular function groups with that of A. thali ana
suggests that this 454 unigene set is broadly representa-
tive of the P. vulgaris transcriptome. Uni genes with
positive matches to the Arabidopsis proteins were
grouped into 20 catego ries (Figure 1). The largest
proportion of the functionally assigned unigenes fell into
seven categories: unknown (30.13%), nucleotide metabo-
lism (9.50%), protein metabolism (9.41%), plant develop-
ment and senescence (7.27%), stress defense (9.04%),
signal transduction (7.11%) and transport (7.67%).
Functional comparison to soybean
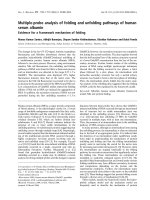
All of the common bean unigenes were used to compare
with soybean peptide sequences (55,787) by BLASTX
(Figure 2). As a result, a total of 63.31% (37,53 8) uni-
genes have a goo d match to soybean peptide sequences.
Therefore the number of common bean matches to soy-
bean sequences was significantly higher (~1.4×) com-
pared to Arabidopsis and may reflect the larger number
of predicted genes in soybean compared to Arabidopsis.
These sequences can be used for discovery of not only
comm on bean genes but also for validation of predicted
soybean genes.
Comparison of P. vulgaris unigenes with those in M.
truncatula, G. max, L japonicus, A. thaliana and O. sativa
We wer e also interested in understanding the relation-
ship of common bean unigenes in this study to t hose
that have been identified in other legume models and
the model plants Arabidopsis and rice with larger
sequence collections. We also wanted to determine the
unique and shared sequences between common bean,
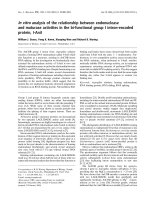
Medicago, lotus and soybean, and also those that are
shared between common bean, Arabidopsis and rice.
Nearly 54% (31,880) of the common bean unigenes have
homology to Medicago, 44% (25,837) have homology to
lotus, and 63% (37,538) have homology to soybean (Fig-
ure 3A). Approximately 72% (42,270) of common bean
unigenes are shared between the four legume species
(common bean, lotus, Medicago and soybean). We also
determined that 54% (31,992) of the common bean uni-
genes are shared with Arabidopsis and 99% (58,716) are
Figure 1 Functional classification of P. vulgaris unigenes according to the Arabidopsis peptide sequences.
Kalavacharla et al. BMC Plant Biology 2011, 11:135
/>Page 5 of 18
shared with rice. When compared to Medicago, soybean
and lotus, 2 8% (16,525) of the unigenes are unique to
common bean whereas only 0.43% (254) of the unigenes
are unique to common bean when compared to Arabi-
dopsis and rice (Figure 3B).
As seen in the comparison to the Arabidopsis tran-
scriptome , the most a bundan t category was comprised
of 30.13% of the unigenes with unknown functions
which was consistent with the previous study by Thibi-
villiers et al. [7], who found that 31.9% of common bean
ESTs from bean rust-inf ected plants had an unknown
function. They also found that 15.3% of those ESTs fell
into signal transduction and nucleotide metabolism
classes. Similarly, our results found that 16.61% of 454
unigenes belonged to signal transduction and nucleotide
metabolism. Additionally, thisanalysisshowedthat
9.04% of the unigenes belong to the stress defense cate-
gory. These unigenes provide a new and additional
source for mining stress-regulated and defense response
genes. Interestingly, Wong et al. [26] identified a com-
mon bean antimicrobial peptide with the ability to inhi-
bit the human immunodeficiency virus (HIV)-1 reverse
transcriptase. This 47-amino acid peptide was also
found to inhibit fungi such as Botrytis cinerea , Fusarium
oxysporum and My cosphaerella arachidicola.Weused
the corresponding nucleotide sequence from t his pep-
tide to search against the 454 sequences in this report,
and discovered one unigene represented by contig03541
with a nucleotide length of 450 bases. Search of this
sequence against the NCBI non-redundant database
identified homology to a plant defensin peptide from
legumes such as mung bean, soybean, Me dicago,and
yam-bean (Pachyrhizus erosus), and it is possible that
this is a gene that is specific to legumes.
Validation of common bean reference genes
Thibivilliers et al. [7] compared several housekeeping
genes for use as a common bean reference for qRT-PCR
experiments. They tested three bean genes TC197 (gua-
nine nucleotide-binding protein beta subunit-like pro-
tein),TC127(ubiquitin), and TC185 (tubulin beta
chain), and the c ommon bean homologs of the soybean
genes cons6 (coding for an F-box protein family),cons7
(a metalloprotease), and cons15 (a peptidase S16). These
researchers concluded that cons7 was the most stably
expressed for their experimental conditions. Likewise,
Libault et al. [27] also identified cons7 to be stably
expressed and to be useful as a reference gene for quan-
titative studies in soybean, and with the confirmation in
our studies can possibly be used for other legume gene
expression experiments. Therefore, for our experiments,
we used the Gmcons7 primers and verified expression in
the Sierra geno type (please see Figure 4, lane 57); this
was then used as an endogenous control, and used in
leaf tissue as a reference gene for expression analysis of
common bean contigs.
Quantification of tissue-specific expression of the common
bean transcriptome
When the cDNA libraries were created, the four tissues
were tagged using a molecular barcode, based on their
source of either leaves, roots, flowers or pods (see materi-
als and methods) so that we could determine possible
origin of tissues of the transcripts. The tags can be used
to describe the presence or degree of tissue-specific
expression of the unigenes. The distribution of these tags
among the four tissues is shown in Figure 5. About 69%
(41,161 unigenes) of the unigenes were present in leaves,
52% (30,914 unigenes) were present in flowers, 42%
(24,725 unigenes) were present in roots, and 36% (21,063
unigenes) were present in pods. Among all the unigenes,
27% (16,155 unigenes) were observed only in leaves, 8%
(4,805 unigenes) only in roots, 11% (6,810 unigenes) onl y
in flowers, and 6% (3,321 unigenes) only in pods.
In our analysis of the 454 data, we found that 28,204
contigs were composed of transcripts that were derived
Figure 2 Functional classification of P. vulgaris unigenes according to the soybean peptide sequences.
Kalavacharla et al. BMC Plant Biology 2011, 11:135
/>Page 6 of 18
from multiple tissues (Table 4). The tagging of the
cDNA libraries will be very useful in orde r to verify and
validate global gene expression patterns and understand-
ing both shared and unique transcripts between and
among the tissues in this study. Equally significant is the
ability to cap ture rarely expressed transcripts. Since nor-
malization was carried out (as seen in methods), the
large number of transcripts derived from leaves is
A
B
Figure 3 Venn diagram of P. vulgaris unigenes showing common and unique unigenes compared to legume and non-legume species.
(A) P. vulgaris unigenes compared to soybean, Medicago and lotus. (B) P. vulgaris unigenes compared to Arabidopsis and rice. Numbers in the
Venn diagram refer to the number of P. vulgaris unigenes having hits to each plant species, as labeled.
Kalavacharla et al. BMC Plant Biology 2011, 11:135
/>Page 7 of 18
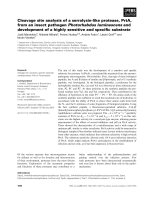
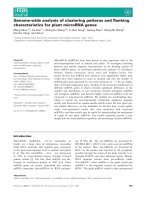
Figure 4 Experimental validation of 48 common bean 454-sequencing derived unigenes by RT-PCR. Lanes with 50 bp ladder are lanes 1,
20, 21, 40, 41, and 60; Confirmation of absence of DNA contamination is shown in lanes 2-5 where RT-PCR amplification was carried out with
primers designed from contig11286 in lanes with genomic DNA, leaf cDNA, leaf cDNA control (no reverse transcriptase added to reaction), and
water as template to check DNA contamination. In lanes 6-19, 22-39, and 42-56, 58 and 59 RT-PCR products derived by amplification from an
additional 47 common bean unigenes using leaf cDNA as a template are shown (complete list of contigs shown in Table 4). Lane 57 is
amplification by the cons7 primers.
Figure 5 Tissue-specific expr ession of common bean unigenes. cDNA libraries were tagged during libra ry construction; in the figure, blue
represents transcripts present in leaves, yellow represents transcripts present in roots, green represents transcripts present in flower, and red
represents transcripts present in pods.
Kalavacharla et al. BMC Plant Biology 2011, 11:135
/>Page 8 of 18
interesting. The contigs and singletons which contain
flower, root, and pod-specific transcripts will be very
useful to understand and compare with transcriptomic
sequences derived from other temporal and spatial con-
ditions from other studies.
SSR analysis
Simple sequence repeats (SSR s), or microsatellites con-
sist of repeat s of short nucleotide motifs with two to six
base pairs in length. In the present study, the 59,295
454-derived sequences from common bean (estimated
length of 22.93 Mbp) and 92,124 common bean geno-
mic sequences (validated September 2010; estimated
length of 64.67 Mbp) were analyzed for SSR sequences
using the software MISA />misa. We surveyed these and all other sequences men-
tioned in this analysis for di-, tri-, tetra-, penta- and
hexa-nucleotide type of SSRs. We detected a total of
1,516 and 4,517 SSRs in 454-derived and genomic
sequences respectively (Table 5). In order to determine
the identification of SSR sequences from other plants
with both transcriptome and genomic resources, we
analyzed 33,001 unigenes and 973.34 Mbp of genomic
sequences from G. max, 18,0 98 unigenes and 105.5
Mbp of genomic sequences from M. truncatula,and
30,579 unigenes and the whole genome from Arabidop-
sis.InG. max, we found 3,548 SSRs in the unigenes,
and 14 3,666 SSRs in genomic sequences. In M. trunca-
tula, we found 1,470 SSRs in the unigenes, and 10,412
SSRs in the genomic sequences, and finally we found
5,586 SSRs in Arabidopsis unigenes, and 14,110 SSRs in
Arabidopsis genomic sequences (Table 5).
We then analyzed the average distance betwee n any
two SSRs and found that this differed among species.
The average distance between two SSRs in unigenes and
genomic sequences of P. vulgaris w as 15.13 kb and
14.32 kb respectively, higher than that of the other three
species. However, the average distance between two
SSRs was quite similar between unigenes and genomic
sequences for common bean, soybean, Medicago,and
lotus (Table 5).
The frequency of SSRs in terms of repeat motif length
(di-, tri-, tetra-, penta-, and hexa- nucleotide) was differ-
ent. Of all the SSRs found in common bean unigenes,
dinucleotide, trinucleotide, tetranucle otide, pentanucleo-
tide and hexanucleotide repeats account for 36.15%,
59.50%, 2.57%, 0.79%, and 0.99%, respectively, while
repeats account for 70.02%, 26.85%, 2.17%, 0.51% and
0.44% in genomic sequences. In G. max unigenes, dinu-
cleotide, trinucleotide, tetranucleotide, pentanucleotide
and hexanucleotide repeats account for 42.64%, 54.20%,
2.00%, 0.51%, and 0.65%, respectively, and was 69.50%,
26.74%, 2.75%, 0.81% and 0.20% in genomic se quences.
In M. truncatula unigenes, dinucleotide, trinucleotide,
tetranucleotide, pentanucleotide and hexanucleotide
repeats account for 35.03%, 59.66%, 3.33%, 1.16%, and
0.82%, respectively, and was 62.06%, 33.92%, 3.02%,
0.61% and 0.39% in genomic seque nces. In Arabidopsis
unigenes, dinucleotide, trinucleotide, tetranucleotide,
pen tanucleotide and hexanucle otid e repeats account for
Table 4 Identification of tissue-specific unigenes from common bean 454 sequences
Tissue-specific unigenes No. of unigenes Average reads No. of reads in the largest contigs
Leaf-specific 16,155 1.99 96
Root-specific 4,805 2.21 502
Pod-specific 3,321 3.63 650
Flower-specific 6,810 1.87 231
Mixed-tissue unigenes 28,204 59.83 2,484
All unigenes 59,295 29.60 2,484
Table 5 SSR survey in unigenes and genomic sequences from P. vulgaris, G. max, M. truncatula, and A. thaliana.
Type P. vulgaris G. max M. truncatula A. thaliana
Unigene Genome Unigene Genome Unigene Genome Unigene Genome
Dinucleotide 548 3163 5944 99856 1903 6462 1914 8686
Trinucleotide 902 1213 5771 38411 2999 3532 3600 5180
Tetranucleotide 39 98 238 3954 165 314 34 155
Pentanucleotide 12 23 66 1161 53 63 8 38
Hexanucleotide 15 20 100 284 65 41 30 51
Total SSR 1516 4517 12119 143666 5158 10412 5586 14110
Total length (Mbp) 22.94 64.68 71.80 973.34 51.93 105.52 43.58 111.14
Average distance (kb) 15.13 14.32 5.92 6.78 10.07 10.13 7.80 7.88
Kalavacharla et al. BMC Plant Biology 2011, 11:135
/>Page 9 of 18
34.26%, 64.45%, 0.61%, 0.14%, and 0.54%, respectively,
which was different from 61.56%, 36.71%, 1.10%, 0.27%
and 0.36% in genomic sequences. The most frequent
type of repeat motif between unigenes and genomic
sequences was different. Trinucleotide SSRs were the
most common type in unigenes in all the four species,
while dinucleotide SSRs were the most common type in
genomic sequences. These EST-SSRs will help to
develop SSR markers with high polymorphism for com-
mon bean.
Tri-nucleotides were found to be the most abundant
repeats and AAG/CTT repeats were the most frequent
motifs in the tri-nucleotides. The prevalence of tri-
nucleotide over di-nucleotide or other SSRs was also
observed in the unigenes of G. max, M. truncatula and
A. thaliana, and also may be characte ristic of EST-SS Rs
of maize, wheat, rice, sorghum, barley [28] and many
other plant species [29,30]. In contrast, di-nucleotides
were the most common repeats in the genomic
sequences of the four species and AT/AT was the most
dominant repeat. Blair et al. [30,31] and Cordoba et al.
[32] identified 184 gene-based SSRs and 875 SSRs from
common bean ESTs and BAC-end sequences, respec-
tively. They also fo und that tri-nucleotide SSRs were
more common in ESTs, while di-nucleotide SSRs were
more dominant in GSSs. The frequency of SSR-contain-
ing ESTs in the c ommon bean unigenes as shown in
this study was 2.37% and m uch lower than that of rice
[28], bre ad wheat [33], and other plants [ 29]. The SSRs
identified in the present study can be used by the com-
mon bean community as molecular markers for
mapping of important agronomic traits and for integra-
tion of common bean genetic and physical maps.
Validation of selected bean 454 transcripts
We wanted to verify the expression of common bean
ESTs identified in this work, before which we ensured
that the procedures that we were following in the
laboratory were consistent a nd that the re was no con-
tamination of the c DNA with genomic DNA. Figures
6A and 6B show that the cDNA that we have used for
our gene expression experiments is contamination free.
We wanted to test the accuracy of the contigs
assembled by the gsAssembler with reverse tran scriptase
(RT)-PCR. We designed PCR primers for 48 randomly
selected contigs (Table 6) and analyzed the cDNA under
standard PCR conditions and electrophoresed the pro-
ducts on a 2% agarose gel (Figure 4).
Almost all of the amplifications yielded single pro-
ducts ranging from 100 bp-150 bp showing that these
are real transcripts derived from mRNA.
Quantitative PCR analysis of 23 common bean contigs
Of the 48 contigs whose amplification is shown in Fig-
ure4,werandomlychose23contigs(Table7)for
further analysis with quantitati ve PCR. Randomly
selected contigs were tested to determine if they were
derived from RNA sequences and for their expression
pattern in common bean plant parts under ambient
conditions. Relative quantification of contig expression
was performed by comparative ΔΔC
T
analysis from leaf,
flower, pod and root tissues using leaf as a reference
sample.
1 2 3 4 5 6
A
1 2
3
4
5
B
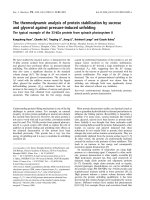
Figure 6 Tests for DNA contamination in reverse transcriptase PCR. (A) Common bean sequence characterized amplified repeat (SCAR)
marker SK14, linked to the Ur-3 rust resistance locus. From our experiments, SK14 amplifies from genomic DNA but not from cDNA, presumably
because SK14 is from the intronic region of the gene. Forward and reverse primers derived from the SK14 sequence were used to amplify a 600
bp product from genomic DNA and cDNA; no amplification from cDNA was observed. Lane 1, 100 bp ladder; Lane 2, genomic DNA; Lane 3, leaf
cDNA; Lane 4. Negative cDNA control (no reverse transcriptase was added to cDNA synthesis reaction); Lane 5, H
2
O only control; Lane 6, 100 bp
ladder. (B) Primers from contig32565, a sequence with homology to a MADS transcription factor amplified long flanking intronic genomic DNA
yielding a 1200 bp amplicon from genomic DNA and a short 300 bp amplicon from cDNA. The order and contents of lanes 1 to 5 are identical
to those in panel A.
Kalavacharla et al. BMC Plant Biology 2011, 11:135
/>Page 10 of 18
Table 6 Description of unigenes randomly selected for validation
Lane No. Unigene Name Annotation
2 contig11286 MLO8 (MILDEW RESISTANCE LOCUS O 8); calmodulin binding [Arabidopsis thaliana]
3 contig11286 MLO8 (MILDEW RESISTANCE LOCUS O 8); calmodulin binding [Arabidopsis thaliana]
4 contig11286 MLO8 (MILDEW RESISTANCE LOCUS O 8); calmodulin binding [Arabidopsis thaliana]
5 contig11286 MLO8 (MILDEW RESISTANCE LOCUS O 8); calmodulin binding [Arabidopsis thaliana]
6 contig33974 MLO1 [Lotus corniculatus var. japonicus]
7 contig32923 ATMLO1/MLO1 (MILDEW RESISTANCE LOCUS O 1); calmodulin binding [Arabidopsis thaliana]
8 contig01942 resistance gene analog NBS1 [Helianthus annuus]
9 contig04562 R 10 protein [Glycine max]
10 contig05928 MLO1 [Lotus corniculatus var. japonicus]
11 contig28775 L6-like resistance gene
12 contig35803 Mlo-like resistance gene
13 contig36500 Hm1-like resistance gene
14 contig39371 N-like resistance gene
15 FFSTDNT01C34EJ Fls2-like resistance gene
16 FGQI37401AS3FB Pto-like kinase OG10 [Phaseolus vulgaris]
17 contig29749 Phaseolin
18 contig38383 fructokinase-like protein [Cicer arietinum]
19 contig04711 alcohol dehydrogenase [Prunus armeniaca]
22 contig20010 ABC transporter family protein [Arabidopsis thaliana]
23 contig14749 senescence-associated nodulin 1A [Glycine max]
24 contig28207 Late embryogenesis abundant protein Lea14-A, putative [Ricinus communis]
25 contig07734 phosphoenolpyruvate carboxylase kinase [Glycine max]
26 contig28742 fructokinase-like protein [Cicer arietinum]
27 contig33251 sucrose synthase [Vigna angularis]
28 contig38427 senescence-associated nodulin 1A [Glycine max]
29 contig28548 nodulin-26
30 contig08830 WRKY35 [Glycine max]
31 contig14217 NAC domain protein NAC1 [Phaseolus vulgaris]
32 contig32665 transcriptional factor NAC11 [Glycine max]
33 contig17174 dihydroflavonol-4-reductase 2 [Glycine max]
34 contig29672 glutathione S-transferase GST 19 [Glycine max]
35 contig13083 4-hydroxyphenylpyruvate dioxygenase [Glycine max]
36 contig32781 WRKY23 [Glycine max]
37 contig30192 WRKY54 [Glycine max]
38 contig05219 zinc finger (CCCH-type) family protein [Arabidopsis thaliana]
39 contig35898 bZIP transcription factor bZIP80 [Glycine max]
42 contig12172 WRKY9 [Glycine max]
43 contig34970 MYB transcription factor MYB57 [Glycine max]
44 contig29192 MYB transcription factor MYB183 [Glycine max]
45 contig29047 GAMYB-binding protein [Glycine max]
46 contig07725 MYB transcription factor MYB150 [Glycine max]
47 contig27846 MYB transcription factor MYB57 [Glycine
max]
48 contig02140 MYB transcription factor MYB93 [Glycine max]
49 contig04868 flavonoid 3’-hydroxylase [Glycine max]
50 contig00375 flavonoid 3-O-galactosyl transferase [Vigna mungo]
51 contig35817 microsomal omega-6 fatty acid desaturase [Glycine max]
52 contig17418 omega-3 fatty acid desaturase [Vigna unguiculata]
53 contig08522 (iso)flavonoid glycosyltransferase [Medicago truncatula]
54 contig09139 enoyl-ACP reductase [Malus x domestica]
55 contig10732 peroxisomal fatty acid beta-oxidation multifunctional protein [Glycine max]
56 contig33363 beta-ketoacyl-CoA synthase family protein [Arabidopsis thaliana]
Kalavacharla et al. BMC Plant Biology 2011, 11:135
/>Page 11 of 18
Table 6 Description of unigenes randomly selected for validation (Continued)
57 cons7 reference gene
58 contig11286 MLO8 (MILDEW RESISTANCE LOCUS O 8); calmodulin binding [Arabidopsis thaliana]
59 contig33974 MLO1 [Lotus corniculatus var. japonicus]
Table 7 Expression analysis of common bean contigs
454 Contig
Number
2
-ΔΔCT
Values Functional Annotation Primer Sequences
Flower Pod Root
contig04711 3.43 ± 0.04 -2.20 ± 0.09 -0.82 ± 0.26 Alcohol dehydrogenase [Prunus armeniaca]5’-ATA TGC CTC TGT CTT GGC AGG AGT-3’
5’-ACC TCG GGC AAT AGC ATT GAC TCT-3’
contig07734 2.16 ± 0.19 1.52 ± 0.07 -0.45 ± 0.1 Phosphoenolpyruvate carboxylase kinase
[Glycine max]
5’-AGA ATG TGC GAA ACG CTG AAG ACG-3’
5’-AGG ATG GAA ACA CCG GAA GAT GGT-3’
contig08043 3.78 ± 0.18 -1.46 ± 0.17 -0.28 ± 0.18 Starch synthase III [Phaseolus vulgaris]5’-AAG AAC TTG CTA GGG TGC AAG CTG-3’
5’-CTT TGC AGC TCT GTC TGC CTC AAT-3’
contig08830 -5.22 ± 0.14 6.91 ± 0.17 -1.24 ± 0.04 WRKY35 [Glycine max]5’-TCA GCC TTG ACC TTG GTA TGG GAA-3’
5’-TTG CTG GTA TGA GCT TGG CTG TCA-3’
contig01300 * -10.28 ± 0.07 1.32 ± 0.26 MADS box protein SEP3 [Lotus corniculatus
var. japonicus]
5’-AAT TGC TCA TGC TTG GAC CTG CTG-3’
5’-TGA AGA CAT GGG ATA TGG CAG GCA-3’
contig13083 -0.69 ± 0.17 2.55 ± 0.12 1.49 ± 0.11 4-hydroxyphenylpyruvate dioxygenase [Glycine
max]
5’-TTA TGC CAA CCT TCA CAA GCG TGC-3’
5’-TGC CCT GAT CGT CTC TGT CAA CAA-3’
contig14749 6.66 ± 0.08 0.17 ± 0.09 3.07 ± 0.27 Senescence-associated nodulin 1A [Glycine
max]
5’-TTC TTC TTC CCT GCA CAC GAC ACT-3’
5’-TTG CTG CCC TTT CTA CGG ACA AGA-3’
contig17174 -1.41 ± 0.24 -6.58 ± 0.07 3.63 ± 0.12 Dihydroflavonol-4-reductase 2 [Glycine max]5’-TGG TAG CCT CAT GCG AAC AGC ATA-3’
5’-AGG CCA GTT CGT GCA CTT AGA TGA-3’
contig14217 -1.88 ± 0.14 9.86 ± 0.1 1.15 ± 0.04 NAC domain protein NAC1 [Phaseolus
vulgaris]
5’-TGG GTG CCC TTC CTT GAT AGA ACA-3’
5’-TGC AAC AGG GTT ACG CAC AAA TCG-3’
contig20010 6.07 ± 0.05 0.36 ± 0.08 1.34 ± 0.27 ABC transporter family protein [Arabidopsis
thaliana]
5’-ACA
ACC TTT GTT TCA GCA CGG AGC-3’
5’-GAG ACA TGG GCA ACT CAT TTG GCA-3’
contig28207 1.40 ± 0.19 -2.44 ± 0.12 -2.38 ± 0.1 Late embryogenesis abundant protein Lea14-
A, putative [Ricinus communis]
5’-TGA CAG TCT GTT CTC CGT GTG CAT-3’
5’-TAA AGA ACC CAA ATC CGG TGC CGA-3’
contig28548 * -1.99 ± 0.06 -0.33 ± 0.1 nodulin-26 5’-TTG GTC CAG GTC CAG CTA ACA ACA-3’
5’-CCC ATC GCC ATT GGT TTC ATC GTT-3’
contig29672 1.51 ± 0.24 3.16 ± 0.11 1.01 ± 0.07 glutathione S-transferase GST 19 [Glycine max]5’-AGC TCT TCA AGG ACA CTG AGC CAA-3’
5’-AAA GGC TGT GGA TGC TGC ACT AGA-3’
contig28742 -0.84 ± 0.21 -6.13 ± 0.07 -4.19 ± 0.1 Fructokinase-like protein [Cicer arietinum]5’-TGA GTA TTT GCT GAC GCG CTT CCT-3’
5’-GCA CAC CTG AAG GCA ATG GAA GTT-3’
contig28845 -0.98 ± .014 0.51 ± 0.1 -2.96 ± 0.04 NAC domain protein [Glycine max]5’-TGG TGT GGT CCT GCA GAG TGT AAA-3’
5’-AAC GTC GGT GAT TGG GAG GAG AAA-3’
contig28932 4.83 ± 0.24 4.73 ± 0.07 3.81 ± 0.07 Nodule-enhanced protein phosphatase type
2C [Lotus japonicus]
5’-AAC GTC GGT GAT TGG GAG GAG AAA-3’
5’-CTT GCT GCT TCG CTT TGT CAC TGT-3’
contig28932 -4.04 ± 0.16 7.80 ± 0.12 -5.34 ± 0.12 nodule-enhanced protein phosphatase type
2C [Lotus japonicus]
5’-AAC GTC GGT GAT TGG GAG GAG AAA-3’
5’-ATC CCT CTC TCC TTC GCA GCA AAT-3’
contig30192 1.61 ± 0.22 * 0.58 ± 0.11 WRKY54 [Glycine max]5’CAA CAC ACA CAT CCA AGC CCA GTT3’
5’TGG TTC TGC TGC TGC TGA TAC TGT3’
contig30958 1.17 ± 0.15 11.91 ± 0.11 3.89 ± 0.08 WRKY27 [Glycine max]5’ACG GAA ACT CTG AGA GCA GCT CAA3
’
5’ TGC
TTC CGT CCT CAC GTA AAC TCT3’
contig32565 -8.41 ± 0.15 -10.63 ± 0.11 0.90 ± 0.37 MADS transcription factor [Glycine max]5’-TGC CTC ACC TAG CAA GTG TTC CTT-3’
5’-AGA TCT TGG CCC TCT AAG CAG CAA-3’
contig32665 1.26 ± 0.24 4.39 ± 0.09 0.33 ± 0.07 Transcriptional factor NAC11 [Glycine max]5’-AAT GTG GTC TGA GGA GGT GGT GTT-3’
5’-ATG CTC TAA CTT CAG CGG AGG CAA-3’
contig32781 1.33 ± 0.17 1.82 ± 0.12 -2.89 ± 0.12 WRKY23 [Glycine max]5’GCA TGT TGC TGT CAG GGT CAA TGT3’
5’TGG TGC TGA AGC TGA AAG TGT TGC3’
contig33251 -0.09 ± .019 -3.93 ± 0.06 -4.10 ± 0.1 Sucrose synthase [Vigna angularis]5’-ACG GCT AGT TTC CTT GTG GGA GAA-3’
5’-TCT CAC ACA GCT TTC ACC CTT CCT-3’
* Data not available (inadequate replicates)
Kalavacharla et al. BMC Plant Biology 2011, 11:135
/>Page 12 of 18
Almost all of the contigs showed e xpression as illu-
strated in Table 7. We highlight a few contigs here
including contig28742 (fructose-like protein), con-
tig2884 (NAC domain protein), contig33251 (sucrose
synthase) and contig04711 (alcohol dehydrogenase) for
which the expression levels were lower in flowers,
pods and roots compared to leaves. Contig29672 (glu-
tathione S-tranferase GST 19), contig28932 (nodule-
enhanced protein phosphatase type C), contig30958
(WRKY27), and contig38427 (senescence-associated
nodulin 1A) showed higher expression levels in flower,
pod and roots compared to leaves. Expression levels of
contig30958 with homology to a WRKY-27 transcrip-
tion factor involved in bacterial wilt resistance [34]
and contig08830 with homology to another WRKY35
transcription factor were high (119-fold) in pods com-
pared to leaves. Expression levels of contig14749
(senescence-associated nodulin 1A), contig20010 (ABC
transporter family protein) and contig38383 (fructoki-
nase-like protein) were higher (64 fold) in flower than
leaf, pods, and roots. Interestingly PCR primers
designed from contig32565 showed a size difference
whenamplifiedfromgenomicandcDNA,anditis
possible that the primers were designed from a region
flanking an intron (example shown in Figure 6B).
Identification of transcription factors
Putative co mmon bean transcription factors (TFs) were
identified by comparing Arabidopsis transcription fac-
tors against the
454 sequencing-derived unigenes in this study [35]. A
tota l of 2,516 unigenes coding for putative transcription
factors were identified in common bean, which is similar
to the 2,758 transcription factors discovered in Arabi-
dopsis. However, these numbers represent about half of
the transcription factors (5,671) discovered in soybean.
In Table 8 we show the 16 most common transcription
factor families found in common bean and correspond-
ing TFs identified from Arabidopsis [35] and soybean
[36].
The largest share of common bean transcription fac-
tors (169) shows homology to the MYB super family
similar to soybean (586) and Arabidopsis thaliana
(266) which show the same abundance. This high
number of MYB transcription factor identification
may be due to their abundance in the genome as well
as identification a nd characterization in model organ-
isms. MYB genes are involved in regulation of various
metabolic pathways and developmental regulation by
determining cell fate and identity [37,38]. Study of
these genes in common bean will help in the identifi-
cation and analysis of important developmental
pathways.
The second largest TF family in common bean (77)
has similarity with the (NAM, ATAF1, 2 and CUC2)
family as compared to 205 in soybean and 126 in Arabi-
dopsis thaliana as shown in Table 8. The NAC gene
family is reported to be composed of plant-specific tran-
scription factors with a broad role in plant development
(especially in lignocelluloses and cell wall development)
and response to external stimuli [39]. Several NAC
genes were induced by cold and dehydration in Brassica
napus [40], by abscisic acid (ABA) and salt stress in rice
[41], drought and developmental processes in chickpea
[42], salinity and osmotic stress [43] and stripe rust in
wheat [44].
Table 8 Comparison of most common transcription factor families among common bean, soybean, and Arabidopsis
derived by screening of the P. vulgaris 454 unigenes set against Arabidopsis transcription factors
Number TF family Number in P. vulgaris unigenes Number in G. max Number in Arabidopsis
1 MYB 169 586 266
2 NAC 77 205 126
3 bHLH 75 390 177
4 WRKY 71 219 88
5 HB 68 279 109
6 ARF 67 75 24
7 AUX/IAA 61 97 36
8 FAR1 59 0 24
9 CCCH 58 176 85
10 PHD 50 288 59
11 Ap2/EREBP 48 405 168
12 bZIP 48 191 111
13 SET 44 0 46
14 mTERF 40 0 36
15 SNF2 32 0 45
16 MADS box 32 220 132
Kalavacharla et al. BMC Plant Biology 2011, 11:135
/>Page 13 of 18
Wefound44SET,40mTERF,32SNF2and59FAR1
unigenes in our study from common bean. There are 46
SET, 36 mTERF, 45 SNF2 and 24 FAR1 transcription
factors f rom Arabidopsis which are not represented in
the soybean and Medicago transcription factor databases
to date. The SET TF
family is involved in methylation of lysine residues on
histone tails. As of now the SET family has been found
only in a few species />v3.0/. It is important to reveal the structural and func-
tional details of these transcription factors as studies on
epigenetics are expanding [45]. The SNF2 family of pro-
teins which are DNA-dependent ATPases play an
important role in chromatin remodelling complexes that
areinvolvedinepigeneticgeneregulation.ThemTERF
family contains leucine zipper-like heptads that may be
involved in mtDNA transcription and replication [46]
while the FAR1 family is involved in regulation of the
circadian clock in Arabidopsis [47].
Identification and analysis of nodulation-specific contigs in
the unigene dataset
The 52 soybean nodulation genes discovered by
Schmutz et al. [48] were compared to the common
bean unigenes, using the TBLASTN algorithm. We con-
sidered as orthologs, hits with an E-value of < 1 × 10
-20
as per McClean et al. (22). A total of 67 hits were iden-
tified and the average E-value for these hits was 3.3 ×
10
-69
(Table 9). Sixteen unigenes are seen to be
expressed more abundantly in root tissues and this gene
family will be investigated in further detail in subse-
quent studies.
Conclusions
Genomic resources in legume crops are lacking with the
exception of soybean and Medicago for which whole-
genome sequences are now available. Since the common
bean genome is relatively small compared to other
legumes, there is a great potential to utilize and apply
the information from common bean to other legume
crops such as soybea n, cowpea, mung be an, rice bean
and lentils. We have partially made up for this lack of
genomic information by sequencing a large number of
cDNAs. In summary, we identified 59,295 common
bean unigenes of which 31,664 unigenes are newly dis-
covered sequences. Combined with existing transcrip-
tomic and genomic sequences available for common
bean, this dataset will be very useful for functional geno-
mics research in common bean.
Comparison of the number of common bean unigene
matches to other legumes shows that there may be
many more legume unigenes that are yet to be discov-
ered. Therefore, high t hroughput transcriptome sequen-
cing will continue to help in identifying genes associated
with biotic and abiotic stress, development of high
resolution genetic maps, and automated phenotyping
which will lead to crop improvement.
Methods
Plant materials
Common bean plants were grown in the greenhouse
and leaves, flowers, and root tissues (from common
bean cultivar Sierra) and pods (from common bean gen-
otype BAT93) were collected into envelopes and frozen
in liquid nitrogen for further processing.
RNA isolation, cDNA synthesis and normalization
Total RNA was extracted from the four t issues using
Plant RNA Reagents (Invitrogen; Carlsbad, CA). mRNAs
(PolyA RNA) were isolated by using Oligotex Mini Kit
(Qiagen; Valencia, CA). cDNA was synthesized from
500 ng of mRNA following Clontech’s(MountainView,
CA) Creator SMART cDNA synthesis system using
modified Oligo-dT (to make compatible with 454 GS
FLX) and 5’ RACE primers. The primer sequences are:
CDSIII-First 454: 5’ TAG AGA CCG AGG CGG CCG
ACA TGT TTT GTT TTT TTT TCT TTT TTT TTT
VN 3’ and SMARTIV: 5’ AAG CAG TGG TAT CAA
CGC AGA GTG GCC ATT ACG GCC GGG 3’.
For norma lization, 300 nanograms (ng) of cDNA was
denatured and allowed to self-anneal in a 1 × hybridiza-
tion buffer (50 mM Hepes, pH7.5 and 0.5 M NaCl) for
a period of 4 hrs. Within this hybridization period, most
of the abundant transcripts found their homologs to
form double stranded (ds) molecules but the unique/
rare transcripts and their homologs remain as single
stranded (ss). After hybridization, duplex/double
stranded specific Nuclease-DSN (Evrogen, Russia) was
added to the reaction to degrade ds-cDNAs. Single
stranded transcripts and their homologs that remained
in the treated reactions were PCR amplified to make
normalized ds-cDNA.
Library preparation (DNA processing) for 454 (GSFLX)
sequencing
cDNA was nebulized and size selected for an average
size of 400-500 bp. 454 GSFLX specific adapters, Adap-
terA and Adapter B, with 10 bp MIDs in Adapter A were
ligated to the cDNA ends after end-polishing reaction.
The adapter ligated DNAs were then mobilized to the
library preparation beads and ss-cDNAs were captured.
Number of molecules of the ss-cDNAs was calculated
using the concentration and average fragment length.
emPCR, Enrichment and DNA Bead Loading
Emulsion PCR (emPCR) reactions were set up for titra-
tion run using 6 × 10
5
,2.4×10
6
,4.8×10
6
and 9.6 ×
10
6
molecules of ss-cDNAs that corresponds to 0.5, 2, 4
and 8 copies, respectively, of the ss-cDNA per bead.
Kalavacharla et al. BMC Plant Biology 2011, 11:135
/>Page 14 of 18
Table 9 Analysis of tentative nodulation genes from 454 unigenes of common bean
unigenes matched soybean sequences score E-value 454 sequencing reads
leaf root Pod flower
contig34312 Glyma01g03470.1/N36a 440 3.00E-124 40 24 26 63
contig34712 Glyma01g03470.1/N36a 181 4.00E-46 1 9 12 9
contig04894 Glyma02g43860.1 499 5.00E-142 42 69 35 4
FF0DN3U02HB71T Glyma02g43860.1 119 5.00E-29 0 1 0 0
contig27995 Glyma04g00210.1 196 1.00E-50 1 4 0 1
contig37370 Glyma05g250100.1/Nodulin-21 116 3.00E-27 6 1 1 0
contig06012 Glyma07g33070.1/SAN1B 430 2.00E-121 61 5 6 2
contig14749 Glyma07g33070.1/SAN1B 463 3.00E-131 17 1 7 4
contig38427 Glyma07g33070.1/SAN1B 607 7.00E-175 83 0 13 0
FGQI37402G5N7N Glyma07g33070.1/SAN1B 117 1.00E-28 0 1 0 0
contig06610 Glyma07g33090.1/SAN1A 128 1.00E-30 0 25 0 0
contig31277 Glyma07g33090.1/SAN1A 409 5.00E-115 32 30 15 24
FF0DN3U02F89J3 Glyma07g33090.1/SAN1A 89 6.00E-20 0 1 0 0
contig07549 Glyma08g05370.1 328 2.00E-90 12 29 16 1
contig28119 Glyma08g05370.1 191 6.00E-49 0 8 3 2
contig30228 Glyma08g05370.1 279 2.00E-75 62 22 33 5
FF0DN3U02G2ENE Glyma08g05370.1 117 2.00E-28 1 0 0 0
contig14951 Glyma08g12650.1/Nodulin-26a 351 1.0E-97 102 11 49 20
contig19563 Glyma08g12650.1/Nodulin-26a 119 7.00E-28 0 3 0 2
contig33328 Glyma09g33510.1/NORK 202 1.00E-53 0 56 13 0
contig05955 Glyma10g06610.1 395 3.00E-110 18 3 64 18
contig16149 Glyma10g06610.1 164 1.00E-40 19 1 45 43
FFSTDNT01DSPY6 Glyma10g06610.1 138 7.00E-35 0 1 0 0
contig05559 Glyma10g23790.1/Nod35 584 6.00E-168 54 25 13 33
contig35956 Glyma10g39450.1/Nodulin-33 251 7.00E-68 109 44 42 6
contig36020 Glyma10g39450.1/Nodulin-33 450 1.00E-127 6 27 21 195
contig14075 Glyma11g06740.1 148 2.00E-36 0 3 0 0
contig37552 Glyma11g09330.1 178 2.00E-45 5 0 53 122
FF0DN3U01DKJ7W Glyma11g09330.2 92.4 7.00E-21 4 0 0 0
contig29881 Glyma12g04390.1/GmNARK 428 3.00E-120 24 15 34 4
contig38136 Glyma12g04390.1/GmNARK 387 7.00E-108 205 193 377 122
FGQI37401C0XA9 Glyma12g04390.1/GmNARK 100 4.00E-23 0 0 1 0
contig06199 Glyma12g05390.1 284 5.00E-77 15 2 1 0
FFSTDNT01A6UXI Glyma12g05390.1 111 2.00E-26 0 0 1 0
contig11587 Glyma12g28860.1 143 1.00E-34 2 0 1 0
contig33251 Glyma13g17420.1/Nod100 447 5.00E-126 8 14 27 58
contig36251 Glyma13g17420.1/Nod100 344 3.00E-95 19 10 14 21
contig36660 Glyma13g17420.1/Nod100 358 2.00E-99 11 10 27 119
FFSTDNT01BOZRN Glyma13g17420.1/Nod100 113 2.00E-27 0 1 0 0
FFSTDNT02HOGJ9 Glyma13g17420.1/Nod100 114 2.00E-27 1 0 0 0
FGQI37402JLLRK Glyma14g01160.1 144 1.00E-36 0 0 1 0
contig02608 Glyma14g23780.1 365 5.00E-102 61 54 83 85
contig08886 Glyma14g23780.1 292 8.00E-80 69 1 6 0
FF0DN3U02FPA3G Glyma14g23780.1 142 5.00E-36 0 0 1 0
contig28379 Glyma14g38170.1 380 2.00E-106 95 85 73 76
contig33554 Glyma14g38170.1 338 1.00E-93 0 63 40 8
FF0DN3U01BBYR5 Glyma14g38170.1 112 5.00E-27 0 1 0 0
contig18937 Glyma15g00620.1 113 4.00E-26 3 0 0 0
contig01826 Glyma15g35070.1 170 5.00E-43 17 10 17 0
contig05700 Glyma15g35070.1 202 2.00E-52 49 34 35 10
Kalavacharla et al. BMC Plant Biology 2011, 11:135
/>Page 15 of 18
Amount of ss DNA needed for the bulk run depends on
the results of the titration run. In emPCR individual ss-
DNA fragments were first annealed to an oligonucleo-
tide complementary to ‘B’ adapter covalently bound to
DNA capture beads. An emulsion was then prepared by
vigorous shaking which created water-in-oil microreac-
tors, each containing a DNA bead with attached ss-
cDNA fragment and all necessary PCR reagents. T his
emulsion went thr ough a ther mocycling reaction that
clonally amplified the attached DNA fragments to gen-
erate millions of copies of DNA on each bead. After
amplification, the emulsion was broken and the beads
were recovered and then washed by filtration.
The biotinylated Adapter A, also added during ss-
cDNA c onstruction, was utilized next to facilitate cap-
ture and recovery of all DNA positive beads using a
streptavidin-coated magnetic bead. The capture beads
without bound DNA did not bind to the streptavidin
beads and were washed away. T he remaining beads
were then subjected to a chemical melt which denatured
the bound ds-cDNA and thus separated the amplified
capture beads from the magnetic beads. The mixture
was magnetized a gain and the supernata nt was recov-
ered. This recovered supernatant contained the collec-
tion of ss-cDNA positive beads. A sequencing primer
was then annealed to Adapter A and approximately
40,000 and 1,500,000 beads were loaded into a 1/16
th
region (for titration) and into two half regions (Bulk
run) respectively, of a 70 × 75 PicoTiterPlate (PTP)
which contains approximately 1 million wells with an
average diameter of 44 μm. This was followed by load-
ing of the packing beads and e nzyme beads. The PTP
was then placed onto the GSFLX G enome Sequencer
and bases (TACG) are seque ntially flowed (100 cycles)
across the plate. Each time a base is incorporated a che-
mical re action occurs resulting in the emission of light.
As chemilluminescent signal i s generated it is captured
by the onboard camera and processed in real time by
the on-rig computer into dig ital images, from which
DNA sequence and quality scores are generated. The
raw sequences are available in SRA at NCBI under the
accession number SRA028837.
SSR analysis
To find SSRs in the data sets, the MISA program (a
PERL-program written by Thomas Thiel; http://pgrc.
ipk-gatersleben.de/misa) was used. The program can
identify not only perfect SSRs but also compound SSRs
which are interrupted by a certain number of bases.
SSRs were considered to contain motifs which were
between two and six nucleotides in size in this study.
Dinucleotide, trinucleotide, tetranucleotide, pentanucleo-
tide, and hexanucleotide repeats with minimum lengths
of 12 bp, 15 bp, 20 bp, 25 bp and 30 bp, respectively,
were considered as SSRs, as similarly defined in barley
studies [49].
Assembly and annotation of 454-reads
The adaptor sequences are identified and trim positions
are changed in sff files using cross_match http://www.
phrap.org, sff tools from Roche he-
applied-science.com/index.jsp and in-house Java scripts.
Short sequences (less than 25 nt) were filtered and then
sequences are assembled using Newbler software from
Roche, using the modified sff files and default para-
meters. The resulting c ontigs and singletons that are
more than 100 nt were annotated separately using
BLAST [50]. The databases used were non-red undant
Table 9 Analysis of tentative nodulation genes from 454 unigenes of common bean (Continued)
FF0DN3U02GRTQS Glyma15g35070.1 112 9.00E-27 0 1 0 0
contig04872 Glyma16g21620.1 699 0 13 10 26 35
contig10706 Glyma16g21620.1 229 1.00E-60 6 1 0 0
contig28435 Glyma16g21620.1 182 2.00E-46 8 28 29 1
contig06537 Glyma17g03340.1 144 6.00E-36 7 16 14 77
contig29092 Glyma17g03340.1 220 1.00E-58 6 11 3 2
contig01836 Glyma17g08110.1/Nod55-2 94.4 1.00E-20 2 1 0 18
contig06642 Glyma17g14220.1 397 3.00E-111 183 165 374 19
contig08079 Glyma17g14220.1 315 1.00E-86 3 2 4 0
FF0DN3U01DP3JJ Glyma17g14220.1 108 1.00E-25 0 0 1 0
contig04461 Glyma17g27490.1 415 1.00E-116 6 5 19 5
contig34068 Glyma18g02230.1/N70 324 2.00E-89 75 64 19 0
contig36321 Glyma18g02230.1/N70 318 4.00E-92 16 9 16 12
FFSTDNT01DXXI7 Glyma18g02230.1/N70 99 7.00E-23 1 0 0 0
contig34962 Glyma18g14750.1 197 1.00E-93 25 16 55 41
contig08052 Glyma19g45310.1 333 6.00E-92 3 1 1 2
contig12852 Glyma19g45310.1 495 1.00E-140 9 0 5 1
Kalavacharla et al. BMC Plant Biology 2011, 11:135
/>Page 16 of 18
protein database and bean ESTs from NCBI http://www.
ncbi.nlm.nih.gov, Arabido psis protein database from
TAIR Soybean, Medicago
and Lotus gene indices from DFCI i.
harvard.edu/tgi/ and rice protein database from Gra-
mene In all cases the E-value
cut off was 10
-5
. Top1 hits from the BLAST were parsed
and used for annotation and further analysis of bean
454- contigs and singletons. The GO annotation was
carried out using BLAST results against Arabidopsis
protein sequences.
Transcription factor analysis
We used BLAST results of bean unique sequences
against Arabidopsis proteins, to identify bean sequences
homologous to Arabidopsis transcription factor genes
from PlnTFDB .uni-potsdam.de/v3.0/
[35].
Validation of expression patterns of selected unigenes
TotalRNAwasisolatedfromleaf,flower,podandroot
tis sues using TRI zol reagent (Invitrogen, Carlsbad, CA).
Total RNA was digested with rDNAse (Ambion Inc,
USA) to remove contaminated DNA. RNA concentra-
tion was measured by ND-2000 spectrophotometer
(NanoDrop products, Wilmington, DE) and 10 μgof
total RNA was reverse transcribed using ProtoScript
®
M-MuLV First Strand cDNA Synthesis Kit (New Eng-
land BioLabs, Beverley, MA). Removal of genomic DNA
in RNA samples was further confirmed by amplifying
the genomi c DNA, positive cDNA, negative cDNA con-
trol with common bean molecular marker SK14 (Figure
6A) and contig 32,565 primers designed to amplify
intron flanking region (Figure 6B). The 48 contigs were
ver ified as shown in Figure 4. Randomly chosen contigs
listed in Table 4 were selected for expression analysis by
quantitative PCR. Concentrations of cDNA from all the
tissues were equalized for reverse transcriptase and
quantitative PCR experiments. The gene cons7 was used
as an endogenous control [7,27] and leaf tissue was used
as a reference sample. Real time PCR analysis was per-
formed in 96 well format (7500 Real-Time system,
Applied Biosystems, Foster City, C A) using SYBR dye.
Gene expression analysis was carried out by Compara-
tive 2
-ΔΔCT
method [51] where ΔΔCT = (CT of contig -
CT of cons7) tissue to be observed - (CT of contig.x -
CT of cons7) leaf tissue.
Acknowledgements
VK acknowledges funding by NSF grant EPS-0814251. Support for KM was
provided by USDA grant 2007-03409 to VK. Support for ZL was provided by
USDA grant 2008-02675 to VK. The authors also acknowledge the assistance
of Mollee Crampton and Meredith Biedrzycki in editing of the manuscript.
Author details
1
College of Agriculture & Related Sciences, Delaware State University, Dover,
DE 19901, USA.
2
Department of Plant & Soil Sciences and Delaware
Biotechnology Institute, University of Delaware, Newark, DE 19711, USA.
3
W.
M. Keck Center for Comparative and Functional Genomics, University of
Illinois, Urbana-Champaign, IL 61801, USA.
4
Center for Integrated Biological
and Environmental Research, Delaware State University, Dover, DE 19901,
USA.
Authors’ contributions
VK conceived and designed the research, and contributed to coordination of
the analysis and experimental validation, and to the writing of the
manuscript. ZL helped with experimental verification, analysis of sequence
data, and contributed to writing of the manuscript. BM helped with
conceiving and analysis of the research, and editing of the manuscript. JT
conducted the bioinformatics analysis and contributed to the writing of the
methods for 454 sequencing and the manuscript. KM helped with
experimental verification and contributed to the writing of the manuscript.
All authors read and approved the final manuscript.
Received: 22 June 2011 Accepted: 11 October 2011
Published: 11 October 2011
References
1. McConnell M, Mamidi S, Lee R, Chikara S, Rossi M, Papa R, McClean P:
Syntenic relationships among legumes revealed using a gene-based
genetic linkage map of common bean (Phaseolus vulgaris L.). Theor Appl
Genet 2010, 121:1103-1116.
2. Lavin M, Herendeen PS, Wojjciechowski MF: Evolutionary rate analysis of
leguminosae implicates a rapid diversification of lineages during the
tertiary. Syst Biol 2005, 54:575-594.
3. Schlueter JA, Dixon P, Granger C, Grant D, Clark L, Doyle JJ, Shoemaker RC:
Mining the EST databases to determine evolutionary events in the
legumes and grasses. Genome 2004, 47:868-876.
4. Galeano CH, Fernandez AC, Gomez M, Blair MW: Single strand
conformation polymorphism based SNP and Indel markers for genetic
mapping and synteny analysis of common bean (Phaseolus vulgaris L.).
BMC Genomics 2009, 10:629.
5. Arumuganthan K, Earle E: Nuclear DNA content of some important plant
species. Plant Mol Biol Rep 1991, 9:208-218.
6. Bennett MD, Leitch IJ: Nuclear DNA amounts in angiosperms. Annals of
Botany 1995, 76:113-116.
7. Thibivilliers S, Joshi T, Campbell KB, Scheffler B, Xu D, Coopers B,
Nguyen HT, Stacey G: Generation of Phaseolus vulgaris ESTs and
investigation of their regulation upon Uromyces appendiculatus infection.
BMC Plant Biol 2009, 9:46.
8. McClean PE, Cannon S, Gepts P, Hudson M, Jackson S, Rokhsar D,
Schmutz J, Vance C: Towards a whole genome sequence of common
bean (Phaseolus vulgaris): Background, Approaches, Applications.[http://
www.csrees.usda.gov/business/reporting/stakeholder/pdfs/
pl_common_bean.pdf], Executive Summary.
9. Ramirez M, Graham MA, Blanco-Lopez L, Silvente S, Medrao-soto A,
Blair MW, Hernandez G, Vance CP, Lara M: Sequencing and analysis of
common bean ESTs. Building a foundation for functional genomics.
Plant Physiology 2005, 137:1211-1227.
10. Melotto M, Monteiro-Vitorello CB, Bruschi AG, Camargo LE: Comparative
bioinformatic analysis of genes expressed in common bean (Phaseolus
vulgaris L.) seedlings. Genome 2005, 48:562-570.
11. Tian J, Venkatachalam P, Liao H, Yan X, Raghothama K: Molecular cloning
and characterization of phosphorous starvation responsive genes in
common bean (Phaseolus vulgaris L.). Planta 2007, 227:151-165.
12. Sanger F, Nicklen S, Coulson AR: DNA sequencing with chain-terminating
inhibitors. Proc Natl Acad Sci USA 1977, 74:5463-5467.
13. Mardis ER:
The impact of next-generation sequencing technology on
genetics. Trends
in Genetics 2008, 24:133-141.
14. Vera J, Wheat C, Fescemyer H, Frilander M, Crawford D, Hanski I, Marden J:
Rapid transcriptome characterization for a nonmodel organism using
454 pyrosequencing. Mol Ecol 2008, 17:1636-1647.
15. Margulies M, Egholm M, Altman WE, Attya S, Bader JS, Bemben LA, Berka J,
Braverman MS, Chen YJ, Chen Z, Dewell SB, Du L, Fierro JM, Gomes XVs,
Goodwin BC, He W, Helgesen S, Ho CH, Irzyk GP, Jando SC, Alenquer MLI,
Kalavacharla et al. BMC Plant Biology 2011, 11:135
/>Page 17 of 18
Jarvie TP, Jirage KB, Kim JB, Knight JK, Lanza JR, Leamon JH, Lefkowitz SM,
Lei M, Li J, Lohman KL, Lu H, Makhijani VB, McDade KE, McKenna MP,
Myers EW, Nickerson E, Nobile JR, Plant R, Puc BP, Ronan MT, Roth GT,
Sarkis GJ, Simons JF, Simpson JW, Srinivasan M, Tartaro KR, Tomasz A,
Vogt KA, Volkmer GA, Wang SH, Wang Y, Weiner MP, Yu P, Begley RF,
Rothberg JM: Genome sequencing in microfabricated high-density
picolitre reactors. Nature 2005, 4437:376-80.
16. Macas J, Neumann P, Navratilova A: Repetitive DNA in the pea (Pisum
sativum L.) genome: comprehensive characterization using 454
sequencing and comparison to soybean and Medicago truncatula. BMC
Genomics 2007, 8:427.
17. Cheung F, Haas B, Goldberg S, May G, Xiao Y, Town C: Sequencing
Medicago truncatula expressed sequenced tags using 454 Life Science
technology. BMC Genomics 2006, 7:272-282.
18. Emrich SJ, Barbazuk WB, Li L, Schnable PS: Gene discovery and annotation
using LCM-454 transcriptome sequencing. Genome Res 2007, 17:69-73.
19. Vega-Arreguin J, Ibarra-Laclette E, Jimenez-Moraila B, Martinez O, Vielle-
Calzada J, Herrera-Estrella L, Herrera-Estrella A: Deep sampling of the
Palomero maize transcriptome by a high throughput strategy of
pyrosequencing. BMC Genomics 2009, 10:299.
20. Weber AP, Weber KL, Carr K, Wilkerson C, Ohlrogge JB: Sampling the
Arabidopsis transcriptome with massively parallel pyrosequencing. Plant
Physiol 2007, 144:32-42.
21. Velasco R, Zharkikh A, Troggio M, Cartwright DA, Cestaro A, Pruss D,
Pindo M, Fitzgerald LM, Vezzulli S, Reid J, Malacarne G, Iliev D, Coppola G,
Wardell B, Micheletti D, Macalma T, Facci M, Mitchell JT, Perazzolli M,
Eldredge G, Gatto P, Oyzerski R, Moretto M, Gutin N, Stefanini M, Chen Y,
Segala C, Davenport C, Demattte L, Mraz A, Battilana J, Stormo K, Costa F,
Tao Q, Si-Ammour A, Harkins T, Lackey A, Perbost C, Taillon B, Stella A,
Solovyev V, Fawcett JA, Sterck L, Vandepoele K, Grando SM, Toppo S,
Moser C, Lanchbury J, Bogden R, Skolnick M, Sgaramella V, Bhatnagar SK,
Fontana P, Gutin A, Van de Peer Y, Salamini F, Viola R: A high quality draft
consensus sequence of the genome of a heterozygous grapevine
variety. PLoS ONE 2007, 2:e1326.
22. McClean PE, Mamidi S, McConnell M, Chikara S, Lee R: Synteny mapping
between common bean and soybean reveals extensive blocks of shared
loci. BMC Genomics 2010, 11:184.
23. WebReference 1: Sierra a new pinto bean for Michigan. Michigan State
University;[ />finished_pubs/e2494/e2494-1994.pdf].
24. Varshney R, Close T, Singh N, Hoisington D, Cook D: Orphan legume crops
enter the genomics era! Curr Opin Plant Biol 2009, 12:202-210.
25. Schlueter JA, Goicoechea JL, Collura K, Gill N, Lin JY, Yu Y, Kudrna D,
Zuccolo A, Vallejos CE, Munoz-Torres M, Blair MW, Tohme J, Tomkins J,
McClean P, Wing RA, Jackson SA: BAC-end sequence analysis and a draft
physical map of the common bean (Phaseolus vulgaris L.) genome. Trop
Plant Biol 2008, 1:40-48.
26. Wong JH, Zhang XQ, Wang HX, Ng TB: A mitogenic defensin from white
cloud beans (Phaseolus vulgaris).
Peptides 2006, 27:2075-2081.
27. Libault M, Thibivilliers S, Bilgin DD, Radwan O, Benitez M, Clough SJ,
Stacey G: Identification of four soybean reference genes for gene
expression normalization. The Plant Genome 2008, 1:44-54.
28. Kantety RV, La Rota M, Matthews DE, Sorrells ME: Data mining for simple
sequence repeats in expressed sequence tags from barley, maize, rice,
sorghum and wheat. Plant Mol Biol 2002, 48:501-510.
29. Gao L, Tang J, Li H, Jia J: Analysis of microsatellites in major crops
assessed by computational and experimental approaches. Mol Breeding
2003, 12:245-261.
30. Blair MW, Torres MM, Giraldo MC, Pedraza F: Development and diversity of
Andean-derived, gene-based microsatellites for common bean
(Phaseolus vulgaris L.). BMC Plant Biol 2009, 9:100.
31. Blair MW, Hurtado N, Chavarro CM, Munoz-Torres MC, Giraldo MC,
Pedraza F, Tomkins J, Wing R: Gene-based SSR markers for common bean
(Phaseolus vulgaris L.) derived from root and leaf tissue ESTs: an
integration of the BMC series. BMC Plant Biol 2011, 11:50.
32. Cordoba JM, Chavarro C, Schlueter JA, Jackson SA, Blair MW: Integration of
physical and genetic maps of common bean through BAC-derived
microsatellite markers. BMC Genomics 2010, 11:436.
33. Gupta PK, Rustgi S, Sharma S, Singh R, Kumar N, Balyan HS: Transferable
EST-SSR markers for the study of polymorphism and genetic diversity in
bread wheat. Mol Genet Genomics 2003, 270:315-323.
34. Mukhtar MS, Deslandes L, Auriac MC, Marco Y, Somssich IE: The Arabidopsis
transcription factor WRKY27 influences wilt disease symptom
development caused by Ralstonia solanacearum. Plant J 2008, 56:935-947.
35. Perez-Rodriguez P, Riano-Pachon DM, Correa LGG, Rensing SA, Kersten B,
Mueller-Roeber B: PlnTFDB: updated content and new features of the
plant transcription factor database. Nucleic Acids Res 2009, 38:D822-D827.
36. Mochida K, Yoshida T, Sakurai T, Yamaguchi-Shinozaki K, Shinozaki K,
Tran LS: LegumeTFDB: an integrative database of Glycine max, Lotus
japonicus and Medicago truncatula transcription factors. Bioinformatics
2010, 26:290-291.
37. Borevitz JO, Xia Y, Blount J, Dixon RA, Lamb C: Activation tagging
identifies a conserved MYB regulator of phenylpropanoid biosynthesis.
Plant Cell 2000, 12:2383-2394.
38. Oppenheimer D, Herman PL, Sivakumaran S, Esch J, Marks MD: A myb
gene required for leaf trichome differentiation in Arabidopsis is
expressed in stipules. Cell
1991, 67:483-493.
39. Olsen AN, Ernst HA, Leggio LL, Skriver K: NAC transcription factors:
structurally distinct, functionally diverse. Trends in Plant Sci 2005, 10:79-87.
40. Hegedus D, Yu M, Baldwin D, Gruber M, Sharpe A, Parkin I, Whitwill S,
Lydiate D: Molecular characterization of Brassica napus NAC domain
transcriptional activators induced in response to biotic and abiotic
stress. Plant Mol Biol 2003, 53:383-397.
41. Ohnishi T, Sugahara S, Yamada T, Kikuchi K, Yoshiba Y, Hirano HY,
Tsutsumi N: OsNAC6, a member of the NAC gene family, is induced by
various stresses in rice. Genes Genet Syst 2005, 80:135-139.
42. Peng H, Cheng HY, Yu XW, Shi QH, Zhang H, Li JG, Ma H: Characterization
of a chickpea (Cicer arietinum L.) NAC family gene, CarNAC5, which is
both developmentally-and stress-regulated. Plant Physiol Biochem 2009,
47:1037-1045.
43. Pinheiro GL, Marques CS, Costa MD, Reis PA, Alves MS, Carvalho CM,
Fietto LG, Fontes EP: Complete inventory of soybean NAC transcription
factors: sequence conservation and expression analysis uncover their
distinct roles in stress response. Gene 2009, 444:10-23.
44. Xia N, Zhang G, Liu XY, Deng L, Cai GL, Zhang Y, Wang XJ, Zhao J,
Huang LL, Kang ZS: Characterization of a novel wheat NAC transcription
factor gene involved in defense response against stripe rust pathogen
infection and abiotic stresses. Mol Biol Rep 2010, 37(8):3703-12.
45. Marmorstein R: Transcription initiation at its most basic level. Cell 2003,
115:370-372.
46. Roberti M, Polosa PL, Bruni F, Manzari C, Deceglie S, Gadaleta MN,
Cantatore P: The MTERF family proteins: mitochondrial transcription
regulators and beyond. Biochim Biophys Acta 2009, 1787:303-311.
47. Lin R, Ding L, Casola C, Ripoll DR, Feschotte C, Wang H: Transposase-
derived transcription factors regulate light signaling in Arabidopsis.
Science 2007, 318:1302-1305.
48. Schmutz J, Cannon SB, Schlueter J, Ma J, Mitros T, Nelson W, Hyten DL,
Song Q, Thelen JJ, Cheng J, Xu D, Hellsten U, May GD, Yu Y, Sakurai T,
Umezawa T, Bhattacharyya MK, Sandhu D, Valliyodan B, Lindquist E, Peto M,
Grant D, Shu S, Goodstein D, Barry K, Futrell-Griggs M, Abernathy B, Du J,
Tian Z, Zhu L, Gill N, Joshi T, Libault M, Sethuraman A, Zhang XC,
Shinozaki K, Nguyen HT, Wing RA, Cregan P, Specht J, Grimwood J,
Rokhsar D, Stacey G, Shoemaker RC, Jackson SA: Genome sequence of the
palaeopolyploid soybean. Nature 2010, 463:178-183.
49. Thiel T, Michalek W, Varshney RK, Graner A: Exploiting EST databases for
the development and characterization of gene-derived SSR-markers in
barley (Hordeum vulgare L.). Theor Appl Genet 2003, 106:411-422.
50. Altschul SF, Gish W, Miller W, Myers EW, Lipman DJ: Basic local alignment
search tool. J Mol Biol 1990, 215:403-410.
51. Livak KJ, Schmittgen TD: Analysis of relative gene expression data using
real-time quantitative PCR and the 2 (-ΔΔ C(T)) Method. Methods 2001,
25:402-408.
doi:10.1186/1471-2229-11-135
Cite this article as: Kalavacharla et al.: Identification and analysis of
common bean (Phaseolus vulgaris L.) transcriptomes by massively
parallel pyrosequencing. BMC Plant Biology 2011 11:135.
Kalavacharla et al. BMC Plant Biology 2011, 11:135
/>Page 18 of 18