báo cáo khoa học: "Localization of QTLs for in vitro plant regeneration in tomato" potx
Bạn đang xem bản rút gọn của tài liệu. Xem và tải ngay bản đầy đủ của tài liệu tại đây (955.72 KB, 13 trang )
Localization of QTLs for in vitro plant
regeneration in tomato
Trujillo-Moya et al.
Trujillo-Moya et al. BMC Plant Biology 2011, 11:140
(20 October 2011)
RESEARCH ARTICLE Open Access
Localization of QTLs for in vitro plant
regeneration in tomato
Carlos Trujillo-Moya
†
, Carmina Gisbert
*†
, Santiago Vilanova and Fernando Nuez
Abstract
Background: Low regeneration ability limits biotechnological breeding approaches. The influence of genotype in
the regeneration response is high in both tomato and other important crops. Despite the various studies that have
been carried out on regeneration genetics, little is known about the key genes involved in this process. The aim of
this study was to localize the genetic factors affecting regeneration in tomato.
Results: We developed two mapping populations (F
2
and BC
1
) derived from a previously selected tomato cultivar
(cv. Anl27) with low regeneration ability and a high regeneration accession of the wild species Solanum pennellii
(PE-47). The phenotyp ic assay indicated dominance for bud induction and additive effects for both the percentage
of explants with shoots and the number of regenerated shoots per explant. Two linkage maps were developed
and six QTLs were identified on five chromosomes (1, 3, 4, 7 and 8) in the BC
1
population by means of the Interval
Mapping and restricted Multiple QTL Mapping methods. These QTLs came from S. pennellii, with the exception of
the minor QTL located on chromosome 8, which was provided by cv. Anl27. The main QTLs correspond to those
detected on chromosomes 1 and 7. In the F
2
population, a QTL on chromosome 7 was identified on a similar
region as that detected in the BC
1
population. Marker segregation distortion was observed in this population in
those areas where the QTLs of BC
1
were detected. Furthermore, we located two tomato candidate genes using a
marker linked to the high regeneration gene: Rg-2 (a putative allele of Rg-1) and LESK1, which encodes a serine/
threonine kinase and was proposed as a marker for regeneration competence. As a result, we located a putative
allele of Rg-2 in the QTL detected on chromosome 3 that we named Rg-3. LESK1, which is also situated on
chromosome 3, is outside Rg-3. In a preliminary exploration of the detected QTL peaks, we found several genes
that may be related to regeneration.
Conclusions: In this study we have ident ified new QTLs related to the complex process of regeneration from
tissue culture. We have also located two candidate genes, discovering a putative allele of the high regeneration
gene Rg-1 in the QTL on chromosome 3. The identified QTLs could represent a significant step toward the
understanding of this process and the identification of other related candidate genes. It will also most likely
facilitate the development of molecular markers for use in gene isolation.
Background
In vitro regeneration of cultivated tomato (Solanum
lycopersic um L.) has been a constant subject of research
because of the commercial value of the crop. Conse-
quently, numerous studies on plant regeneration from a
wide range of tissues and organs of wild and cultivated
tomato germplasm have been published [1]. These
studies demonstrate that organogenesis, the common
tomato regeneration pathway, is strongly influenced by
genotype as well as by several physical and chemical fac-
tors. These reports also document the existence of recal-
citrance (partial or total inability to respond to in vitro
culture), w hich greatly limits biotechnological breeding.
High regeneration is crucial to the success of techniques
such as haploid regeneration, genetic transformation,
propagation, somatic hybridization, mutation selection
and germplasm storage [2,3]. For example, the low effi-
ciency of tomato transformation has b een associated
with the low regeneration potential of the cultivars used
* Correspondence:
† Contributed equally
Instituto de Conservación y Mejora de la Agrodiversidad Valenciana
(COMAV) Universitat Politècnica de València, Camino de Vera, 14 46022
Valencia, Spain
Trujillo-Moya et al. BMC Plant Biology 2011, 11:140
/>© 2011 Trujillo-Moya et al; licensee BioMed Central Ltd. This is an Open Access article distr ibuted under the terms of the Creative
Commons Attribution License ( which permits unrest ricted use, distribution, and
reproduction in any medium, provided the original work is properly cited.
[4,5]. In addition, in some cultivars, buds may be
induced but do not develop into shoots [6]. In order to
increase regeneration ability in low regenerating tomato
cultivars, several introgression programs have been
documented [7-10].
The process of in vitro shoot organogenesis usually
involves a hormonal response of somatic cells, the dedif-
ferentiation of differentiated cells i n order to acquire
organogenic competence, cell division of t he responding
cell(s) and initiation an d development of new shoots
from the newly dividing cell(s), either directly or indir-
ectly through a callus stage [11,12]. Thus, many genes
may be involved at different steps of this complex pro-
cess. For instance, the cdc2 gene expression, which
encodes p34, a key cell cycle regulator, has been pro-
posed as an indicator of the state of competence to
divide [13]. G enes that encode or regulate cytokinins
and auxin may clearly influence regeneration. Both types
of growth regulators act synergistically to promote cell
division and antagonistically to promote shoot and root
initiation from callus cultures [14]. In Arabidopsis,a
Histidine Kinase (AHK) gene that encodes a cytokinin
receptor (CRE1/AHK4) has been identified [15,16] and
linked, like other AHKs, to cell division and regulation
[17]. With regard to the initiation of shoot formation,
the most characterized gene reported is ESR1,which
confers, when overexpressed, cytokinin-independent
shoo t formation in Arabidopsis root explants [18]. ESR1
encodes a transcription factor belonging to the ethylene-
responsive factor (ERF) family and is classified in sub-
group VIII-b. The ESR2 gene that encodes a protein
that is very similar to ESR1 appears to have redundant
functions that regulate shoot regeneration [19]. The
expression patterns of other Arabidopsis ERF VIII-b
subgroup genes may also be involved in early events of
shoot regeneration [20].
Genetic analysis of regener ationintomatosuggests
that dominant alleles determine high regener ation capa-
city [7,21-24]. However, there is no consensus about the
number of genes involved. For instance, Koorneef et al.
[25] obtained regeneration segregation ratios in accor-
dance with ei ther a monogenic, digenic or trigenic
model depending on the tester tomato line, despite the
fact that none of the lines themselves were able to
regenerate shoots from root explants. In this study, a
dominant allele of S. peruvianum L. (Rg-1), which deter-
mines efficient sho ot regeneration in t omato root
explants, was mapped near the middle of c hromosome
3. In addit ion, a putative allele of Rg-1 from S. chilense
(Dunal) Reiche (Rg-2) w as reported by Takashina et al.
[9] and Satoh et al. [22]. Both alleles may act in combi-
nation with other alleles of either tomato or the wil d
relatives S. peruvianum or S. chilense [22,25]. On the
other hand, Torelli et al. [26] identified a cDNA by
mRNA-differential display that corresponded to the
LESK1 gene and w hose expression is specifica lly and
transiently enhanced by the exposure to the hormonal
treatment leading to caulogenesis (shoot induction).
This gene encodes a putative serine-threonine kinase
and has been reported as an in vitro caulogenesis mar-
ker in tomato [27,28].
Despite ongoing research into the genetic control of in
vitro culture traits in tomato and other crops, there is
still not enough information regarding which key genes
are responsible for low or high regeneration ability, nor
even the number of genes involved. The study and char-
acterization of the reported genes and others that mi ght
be identified could greatly improve our understanding of
the molecular mechanism underlying the different
phases of tomato in vitro organogenesis. In the p resent
study, we developed two mapping populations (F
2
and
BC
1
)fromS. lycopersicum ( as the recurrent parent) and
S. pennellii Correll (as the regenerating parent) and con-
ducted a QTL-based analysis. We hereby report the
identification o f six QTLs on five chromosomes. These
QTLs present high signi ficant LOD scores and togeth er
represent a high percentage of phenotypic variance. We
also report markers associated with QTL peaks. In addi-
tion, we located two candidate genes, Rg-2 and LESK1,
and performed a preliminary search for genes situated
at QTL peaks. Our findings will complement the cur-
rent knowledge of the genetics of regeneration and facil-
itate the development of molecular markers for use in
tomato breeding and gene isolation.
Results
Development of populations and evaluation of the
regeneration ability
Two mapping populat ions, F
2
and BC
1
,wereobtained
from a low regenerating cultivar of tomato (cv. Anl27)
and the organogenic accession of S. pennellii (PE-47).
The BC
1
population was obtained using the tomato cul-
tivar as the recurrent parent. In the f irst assay, the
regeneration ability of the parents and the F
1
plant used
for obtaining the mapping populations was checked by
culturing leaf explants on shoot induction medium.
Regeneration occurred with little callus development
and can be considered as direct. As expected, S. pennel-
lii and F
1
explants manifested a higher regeneration
potential versus S. lycopersicum explants (P<0.001). The
percentage of explants with buds (B) in S. pennellii was
100%, whereas only 10% was obtained in tomato cv.
Anl27 (Table 1). Data obtained in F
1
for B do not signif-
icantly differ from those obtained for S. pennellii.The
percentage of explants with shoots (R) and the number
of regenerated plants per explant with shoots, consid-
ered to be the productivity rate (PR), was also higher in
S. pennellii and F
1
than in cv. Anl27. However, for these
Trujillo-Moya et al. BMC Plant Biology 2011, 11:140
/>Page 2 of 12
traits (R and PR), the F
1
values differ significantly from
those of S. pennellii (Table 1).
The F
2
and BC
1
populations were evaluated for regen-
eration using explants from the parents and F
1
plants as
controls (Ta ble 1). The phenotypes are shown in Addi-
tional File 1. The distribution obtained for each indivi-
dua l trait as well as the means for controls in this assay
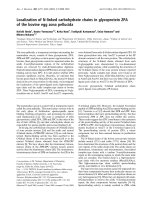
are presented in Figure 1. Mean values for B, R and PR
in the F
2
population are between F
1
and tomato ( P1),
but skewed towards F
1
. For the PR trait, some F
2
plants
were in a range higher than the S. pennellii parent (P2).
This can be considered transgressive segregation. BC
1
yielded mean values for B, R and PR that were inter-
mediate between F
1
and cv. Anl27 (Figure 1).
B and R show a high correlation (r = 0.88/0.79 p < 0,
001 for F
2
and BC
1
data, respectively), which suggests
common or linked genes controlling these traits. The
correlation between PR and both B and R was lower (r
= 0.56/0.52 p < 0, 001; 0.66/0.66 p < 0, 001 for PR and
B and R for F
2
and BC
1
, respectively) indicating that dif-
ferent genes may influence the PR trait and/or variations
between different biological samples are higher in PR.
Linkage maps
Genetic linkage maps were constructed from 106 F
2
and
113 BC
1
plants genotyped with SSR, COSI, COSII,
CAPS and AFLP markers (Figure 2). Of the 149 SSR
and 97 other markers (86 COSII, 6 COSI, 5 CAPS)
assayed, 78 SSR and 59 (51 COSII, 4 COSI, 4 CAPS)
markers exhibited codominant polymorphisms. These
markers were obtained from the Sol Genomics Network
(SGN) webpage at the
exception of 60 SSRs that were designed following the
procedure described in Materials and Methods (see
Additional File 2).
For the F
2
linkage map (Figure 2a), a total of 246
polymorphic loci were used, including 151 AFLP, 53
SSR, 35 COSII, 3 COSI and 4 CAPS markers. The mar-
kers were aligned in 12 linkage groups, with LOD scores
≥ 3.0. The average number of markers per linkage group
was 20 and markers were well distributed over all the 12
linkage groups. The F
2
map spans 963.85 cM with an
average interval of 3.72 cM between adjacent markers.
Table 1 Phenotyping parental genotypes and mapping population
First Assay
Phenotyping parental genotypes and F
1
Second Assay
Phenotyping mapping populations
B
a, c
R
a, c
PR
b, c
B
a, c
R
a, c
PR
b, c
S. pennellii 100 b 96 c 6.36 c 100.00 c 95.00 d 6.74 c
S. lycopersicum 10 a 6 a 0.30 a 7.50 a 2.50 a 0.12 a
F1 90 b 78 b 3.17 b 87.50 c 70.0 c 3.08 b
F
2
- - - 76.91 bc 63.92 c 2.65 b
BC
1
- - - 59.48 b 36.65 b 1.67 b
Means of the traits: percentage of explants with buds (B), percentage of explants with shoots (R) and number of shoots per explant with shoots (PR) for the
parent genotypes (S. pennellii and S. lycopersicum), F
1
,F
2
and BC
1
.
a
B and R are the percentages of explants able to develop buds and shoots, respectively.
b
PR is the number of shoots per explant with shoots.
c
Mean values
within a column separated by different letters are significantly different (P < 0.05) according to Duncan’s multiple range test.
0
5
10
15
20
25
30
35
40
45
50
55
60
Number of plants
Bud percentage
BC1
F2
a)
0
5
10
15
20
25
30
35
40
45
50
55
60
Number of plants
Regeneration percentage
BC1
F2
b)
0
5
10
15
20
25
30
Number of plants
Pr oductivity rate
BC1
F2
c)
P1
P2 BC
1
F
1
F
2
P1
P2 BC
1
F
1
F
2
P2 BC
1
F
1
F
2
P1
BC
1
F
2
BC
1
F
2
BC
1
F
2
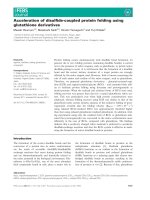
Figure 1 Population distributions for regeneration traits. a) The
percentage of explants with buds (B), b) The percentage of explants
with plants (R) and c) The percentage of plants per explant with
shoots (PR). The F
2
population (dark) is derived from selfing an F
1
,
the result of a cross between the tomato cv. Anl27 (P1) and S.
pennellii PE-47 (P2). The BC
1
population (grey) is the result of
crossing the tomato cv. Anl27 and the F
1
plants. Maternal (P1),
Paternal (P2), F
1
,F
2
and BC
1
mean values are indicated by arrows.
Trujillo-Moya et al. BMC Plant Biology 2011, 11:140
/>Page 3 of 12
SSR92
ME21-244
ME21-105
ME21-265
ME24-69
ME20-201
ME1-95 ME17-241 ME24-207
ME24-169 ME4-194 ME6-130
ME19-171 ME26-143 ME17-60
ME24-161 SSR266
ME22-145 ME20-289
ME20-115
ME21-177
SSR316
ME24-66
C2_At 3g 60300
SSR75
C2_At 1g 48050
C2_At 1g 65520
C2_At 2g 45910
T1409
ME17-70
SSR222
SSR150
SSR346
ME9-76
SSR595
SSR288
Chr-1
ME21-203 ME20-269 SS R586
ME25-76 ME6-125 ME25-209
ME22-177
ME6-137
SSR66
SSR5
SSR26
ME6-284
ME4-262
ME21-263
ME22-262
TAHINA-2-118
TAHINA-2-139,5b
Chr-2
C2_At 4g 18230
TAHINA-3-44
C2_At 5g 23880
ME23-185
ME21-134 ME20-67 ME21-142
ME1-208 ME6-134 ME25-81
ME24-112 ME26-159 inv
penn
SSRB50753
ME20-199
C2_At 4g 39630
ME4-100
SSR22
C2_At 5g 62440
ME17-80
C2_At3g17970
SSR320
Chr-3
ME21-89 ME17-117
SSR72
SSR593
C2_At 2g 39580
ME25-230
ME1-373
ME20-95
ME17-105
ME17-138 ME 17-181 SSR306
ME19-71 ME24-74 ME1-101
ME21-102 ME 20-317 ME24-346
ME20-205
ME24-68
TAHINA-4-71,3
SSR214
SSR146
SSR293
C2_At 1g 75350
C2_At 1g 30755
Chr-4
ME20-232
SSR325
SSR602
SSR115
C2_At 4g 24830
ME24-98
ME21-164 ME1-168 ME4-85
ME24-132 ME17-303 ME24-117
ME19-212 ME25-237 ME9-234
ME1-175
ME4-313
C2_At 3g 26085
ME9-307
ME1-317
C2_At 1g 10500
SSR49
SSRB18031
Chr-5
ME22-280
SSR48
ME20-145 ME17-249 ME 17-22
0
ME4-90 ME4-108 ME24-216
ME1-76
ME18-76
ME17-195
T0507
SS R578
ME17-239
C2_At 5g 62530
C2_At 1g 12060
C2_At 1g 18640
C2_At 4g 03180
Chr-6
0
5
10
15
20
25
30
35
40
45
50
55
60
65
70
75
80
85
90
95
100
105
SSR52
ME17-111
ME9-176
ME16-176 ME17-98
ME26-92
C2_At 4g 26680
ME16-215
ME19-122 ME19-101
ME4-227 ME16-269 ME18-104
ME1-84 ME1-87
ME18-87
ME25-246 ME25-219
ME25-192
ME1-255
ME17-268
ME18-255
So ly c07g049350
TAHINA -7-4 3
C2_At 1g 17200
C2_At 3g 14770
C2_At 3g 14910
C2_At 3g 15290
C2_At 5g 54310
C2_At 5g 56130
Chr-7
ME26-162
ME22-193
ME22-194 ME22-155 ME 22-146
ME21-146ME21-155 ME1-154
ME16-160
ME16-62 ME9-141
SSR15
ME25-291
C2At5g47010
C2_At 4g 12230
ME1-120
C2_At 5g 41350
C2_At 1g 64150
C2_At 4g 23840
SS RB105694
Chr-8
C2_At 5g 02740
SSR73
ME21-128
ME25-190
ME22-286 ME22-270 ME20-134
ME20-261 ME21-260 ME17-96
ME4-118 ME18-161 ME4-88
ME25-220 ME4-110 ME1-170
ME25-65
SSR383
C2_At 1g 07310
TAHINA-9-90
SSR599
Chr-9
ME26-130
ME19-75
ME25-309
ME20-115
ME21-256
ME9-222 ME21-110 ME1-71
ME24-119 ME6-126 ME19-222
ME19-81 ME9-323
ME9-151
C2_At 4g 04930
SSR85
SSR223
TG233
Chr-10
SSR136
C2_At 2g 22570
ME25-338
ME20-213
ME21-216
ME26-260 ME 17-132
ME16-233
ME1-326
ME9-331
ME4-415
C2_At 5g 20890
C2At 2g 28490
C2At 5g 59960
Chr-11
TAHINA-12-12,5a
C2_At3g 25910
TAHINA-12-39
C2_At1g06550
ME25-145
ME23-64
ME24-387
ME17-306 ME16-158 ME16-182
ME25-203 ME16-226 ME18-139
ME17-168 ME22-171 ME22-301
ME20-301 ME22-254
ME18-201
ME17-189
T0801
C2_At2g 25740
C2_At1g 48300
C2_At5g 21170
Chr-12
0
5
10
15
20
25
30
35
40
45
50
55
60
65
70
75
80
85
90
95
100
105
^ƉZŐͲϭ
ZWZ
ZŐͲϯ
WZ
^ƉZŐͲϰĂ
^ƉZŐͲϰď
Z
WZ
^ƉZŐͲϳ
ZWZ
Z
^ůZŐͲϴ
ME13-430
SSR52
ME4-410
ME15-213
ME11-84
ME7-126 ME4- 230 ME14-281
ME8-61 M E8- 211 ME1-85
ME12-183
ME12-115
C2_At2g 26590
ME11-380
SSR304
ME10-187 ME13- 120 M E3- 157
ME10-141
C2_At4g 26680
Solyc07g 049350
TAHINA-7-43
T1651
C2_At1g 17200
C2_At3g 14770
ME6-172
C2_At3g 15290
TAHINA-7-73
C2_At5g 54310
C2_At5g 56130
Chr-7
ME6-83
ME6-85
C2_At1g 18480
SSR15
TAHINA-6-74
ME4-85 M E4- 360 M E1- 359
ME12-230 ME9- 141 ME10-331
ME1-283
ME1-214
SSR63
C2_At5g 47010
ME15-201
ME7-205
SSRB105694
Chr-8
C2_At5g 02740
SSR73
ME13-342
ME5-441 ME6- 136
ME2-233 ME8- 231 ME8-233
ME8-294 ME8- 300 ME9-118
ME14-143 ME11- 355 ME2-294
ME3-73 M E2- 300
ME8-182
ME15-83 ME15- 138
ME6-127 ME5- 105 ME5-246
ME10-340 ME2- 182
ME7-246
ME15-78
SSR383
C2_At1g 07310
TAHINA-9-90
SSR599
Chr-9
SSRB102358
TG230
TG303
C2_At 5g 60990
C2_At 4g 04930
SSR248
ME13-88
ME5-238
ME3-321
SSR85
SSR223
TG233
Chr-10
SSR136
ME12-273
SSR80
C2_At 2g 22570
ME2-138 ME2- 256 ME8-138
ME8-68 M E8-256 ME8-79
ME1-191 ME1- 328
ME3-204 ME3- 219
ME1-286
SSR46
TAHINA-11-61
C2_At5g 20890
C2_At2g 28490
C2_At 5g 59960
Chr-1 1
TAHINA-12-12,5a
C2_At3g 25910
TAHINA-12-39
ME10-384
C2_At1g 06550
ME8-133 ME10- 136 M E1-159
ME11-152 ME15- 133 M E6- 195
ME7-299 ME5- 390
ME3-333 ME2- 133
ME5-393 ME6- 217
C2_At3g 24490
ME3-79
T0801
C2_At2g 25740
C2_At 1g 48300
C2_At5g 21170
Chr-12
0
5
10
15
20
25
30
35
40
45
50
55
60
65
70
75
80
85
90
95
100
105
110
SSR92
SSR266
SSR316
ME12-247
SSR75
C2_At 2g 45910
SSR222
ME4-374
ME7-112
SSR150
ME12-377
ME12-387
ME2-322
ME9-73
ME12-92
SSR288
Chr-1
ME1-284 ME1- 261 ME8- 251
ME11-209
ME2-250 ME8- 250 ME6- 230
SSR586
SSR356
SSR5
SSR26
ME4-217
ME14-124
ME4-266 ME4- 276
TAHINA-2-118
ME13-61
TAHINA-2-139,5b
Chr-2
C2_At4g 18230
ME4-99
ME8-270
TAHINA-3-30 ME4-271 M E2- 270
ME12-68
ME14-192
ME13-252
ME5-199 ME5- 203
ME7-84 M E4-386
ME10-176
ME14-102
ME15-400
ME4-260
SSR22
ME10-149
C2_At5g 62440
C2_At3g 17970
SSR320
SSR601
Chr-3
SSR72
ME1-188
SSR593
ME13-310
ME5-346 ME6- 116 ME6- 231
ME4-269 ME3- 194
ME8-290
ME2-290 ME6- 158 ME5- 76
ME5-348
SSR306
ME1-305
TAHINA-4-71,3
SSR214
SSR293
ME2-316
ME8-316
C2_At1g 30755
Chr-4
C2_At1g 60440
ME5-367
SSR325
SSR602
SSR115
TAHINA-5-60b
C2_At 3g 26085
ME5-98 M E8-425 ME9- 236
ME12-245 ME12- 95 ME1-176
ME1-167
ME2-425
ME1-318
ME11-385
ME15-90
ME11-231
C2_At 1g 10500
SSR49
SSRB18031
Chr-5
ME3-70
ME2-402 ME3- 142 ME8- 401
SSR48
T0507
SSR578
C2_At 5g 62530
C2_At 1g 12060
C2_At 1g 18640
C2_At4g 03180
Chr-6
0
5
10
15
20
25
30
35
40
45
50
55
60
65
70
75
80
85
90
95
100
105
110
ZWZ
^ƉZŐͲϳ
ĂͿ
ďͿ
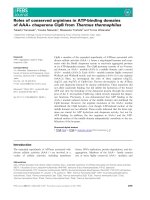
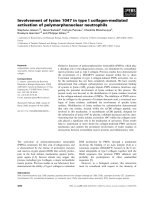
Figure 2 a) Tomato genetic linkage map of F
2
population derived from S. lycopersic um (cv. Anl27) × S. pennelli i (PE-47) and QTLs
detected for regeneration traits by IM. b) Tomato genetic linkage map of BC
1
population derived from S. lycopersicum (cv. Anl27) × F
1
(cv.
Anl27 × PE-47) and QTLs detected for regeneration traits by rMQM. The segregated data were classified into 12 linkage groups, which
corresponded to the Tomato-EXPEN 2000 map; italics indicate markers with segregation significantly skewed (P < 0.05) in favour of parent alleles.
The colors specify the direction of the segregation distortion (red: markers skewed toward the alleles of cultivated tomato; green: markers
skewed toward the alleles of the wild parent). Green bars reflect QTLs from S. pennellii: SpRg-1, Rg-3, SpRg-4a, SpRg-4b and SpRg-7; the red bar
reflects the SlRg-8 QTL from S. lycopersicum. Regeneration traits: B (Bud percentage), R (Regeneration percentage) and PR (Productivity rate). The
black star labels the acid invertase gene (inv
penn
) mapped on chromosome 3 included in the Rg-3 QTL range.
Trujillo-Moya et al. BMC Plant Biology 2011, 11:140
/>Page 4 of 12
There were five intervals > 25 cM in chromosomes 2, 4,
5 and 11. A total of 268 polymorphic loci were used to
assemble the genetic linkage map of BC
1
(Figure 2b),
including 174 AFLP, 46 SSR, 43 COSII, 3 COSI and 2
CAPS markers. The markers were distributed over 12
linkage groups with LOD scores ≥ 3.0. The average
number of markers per linkage group was 22. The total
genetic distance covered by the markers was 1014.94
cM, with an average interval of 4 .12 cM between adja-
cent markers. The markers were well distributed over all
the 12 linkage groups with only two intervals ≥ 25 cM
in chromosomes 5 and 10. Marker distribution in both
maps indicates that they will be useful for tagging the
traits studied.
The order and placement of SSR markers were in
agreement with the S. lycopersicum x S. pennellii refer-
ence tomato-EXPEN 2000 map (SGN) with the excep-
tion of TAHINA-6-64 (in silico designed), which was
expected to be positioned on chromosome 6 (position
64) but is positioned on chromosome 8 (po sition 8.85)
in our F
2
map.
Distorted segregation
42.45% of the mapped markers deviated significantly
from the expected 1:2:1 segregation ratio for the F
2
gen-
eration at P < 0.05 (Figure 2a). Segregation distorted
markers (SDMs) were mainly observed on chromosomes
1 (0.00-63.17 cM), 3 (33.24-38.85 cM), 4 (19.74-92.09
cM), 5 (12.60-72.26 cM), 6 (0.00-55.38 cM) and 10
(0.00-51.24 cM). SDMs were generally caused by a sur-
plus of S. pennellii homozygotes, with the exception of
that observed on chromosome 5.
In the BC
1
population (Figure 2b), SDMs were fewer
(30.3%) than in F
2
, and were observed mainly on chro-
mosomes 6 (0.00-6.75 cM), 8 (0.00-15.40 cM), 11
(25.80-27.48 cM) and 12 (28.23-60.63 cM). The distor-
tion on chromosome 8 was caused by a surplus of
tomato homozygotes, whereas distortions on the other
chromosomes were caused by an excess of hybrid
genotypes.
QTL Identification
In order to identify QTLs, we first used Interval Map-
ping (IM) analysis that resulted in the identification of
one QTL in the F
2
population and six in the BC
1
popu-
lation (See Additional Files 3, 4, 5 and 6). The QTL
identified in F2, located on chromosome 7, overlapped
for the three traits. In the BC
1
analysis, this QTL also
appeared for the R and PR traits. However, in this
population, another five QTLs were identified on chro-
mosomes 1, 3, 4 (at two different areas: 4a and 4b) and
8. All these QTLs were confirmed by restricted Multiple
QTL Mapping (rMQM) analysis (Figure 2b, Table 2).
With the exception of the QTL on chromosome 8, all
QTLs come from S. pennellii. These QTLs were named
by their origin, Sp for S. pennellii or Sl for S. lycopersi-
cum, followed by Rg (referring to regeneration) and the
number of the chromosom e on which they were
located.
QTLs for regeneration traits in the BC
1
population
Bud percentage (B)
IM analysis identified two QTLs on chromosomes 1 and
8(SpRg-1 and SlRg-8; Additional File 4). SpRg-1 has a
maximum LOD score of 5.87 and is spanned by markers
SSR316 and ME17-70. This QTL explained 22.9% of the
phenotypic variation of the B trait. SpRg-8, with a maxi-
mum LOD score of 2.8, including just the
C2_At1g64150 marker, explained 11.7% of the phenoty-
pic variation in B. rMQM analysis, using C2_At2g45910
(chromosome 1) and C2_At1g64150 (chromosome 8)
markers as cofactors, co nfirmed those QTLs detected by
IM and detected a new one on chromosome 3 (Figure
2b, Additional File 4). QTL characteristics are shown in
Table 2. Collectively, these QTLs explained 34.6% and
48.3% of phenotypic variance in IM and rMQM,
respectively.
Regeneration percentage (R)
IM analysis identified three QTLs located on chromo-
somes 1, 4 and 7 denominated SpRg-1, SpRg-4a and
SpRg-7, respectively. The three QTLs had maximum
LOD scores of 4.20, 3.92 and 3.86, and each explained
around 16-17% of the phenotypic variation (see Addi-
tional File 5). rMQM analysis, using C2_At2g45910
(chromosome 1), TAHINA-4-71.3 (chromosome 4) and
TAHINA-7-43 (chromosome 7) markers as cofactors,
confirmed all QTLs detected by IM and detected the
SlRg-8 QTL (Figure 2b, Additional File 5, Table 2). In
this case, the percentage of the phenotypic variation
explained b y each QTL was 15% for SpRg-1, 13.3% for
SpRg-4a,14.9%forSpRg-7 and 9.3% for SlRg-8. Collec-
tively, these QTLs explained 48.7% and 52.5% of the
phenotypic variance in IM and rMQM, respectively.
Productivity rate (PR)
IM detected the QTLs located previously for B and R on
chromosomes 1, 3 and 7 (Figure 2b, Additional File 6),
as well as another QTL on chromosome 4, denominated
SpRg-4b. The maximum phenotypic variation for PR
(17.4%) is explained by SpRg -7,andthelowest(11.9%)
by a QTL on chromosome 3. rMQM analysis, using
SSR92 (chromosome 1), ME20-199 (chromosome 3),
SSR146 (chromosome 4) and TAHINA-7-43 (chromo-
some 7) markers as cofactors, confirmed the QTLs
detected by IM (Table 2).
Mapping tomato candidate genes
We selected the acid invertase gene linked to the Rg-2
regeneration gene of S. chilense [22] and the LESK1
Trujillo-Moya et al. BMC Plant Biology 2011, 11:140
/>Page 5 of 12
gene, described as a marker in tomato for in vitro
regeneration competence [27], as the tomato candidate
genes.
The amplification products of the ac id invertase g ene
marker (inv
penn
) produce fragments of different sizes:
162 bp for S. lycopersicum cv. Anl27 and 173 bp for S.
pennellii (see Additional File 7). Thus, inv
penn
was used
for mapping the BC
1
population (Figure 2b, Additional
Files 4 and 6). It was located in the QTL detected o n
chromosome 3, between the C2_At5g23880 and
SSRB50753 markers, at positions 49.9 cM and 49.93 cM,
respectively. For this reason, we named this QTL Rg-3
(a putative allele of Rg-2).
The LESK1 gene is located in the SGN Tomato-
EXPEN 2 000 map on chromosome 3 between markers
C2_At4g18230 and cLPT-5-e7 (7 - 15 cM). As a
result, in our BC
1
map, LESK1 must be placed
between C2_At4g18230 and TAHINA-3-44 (7 - 44
cM). Thus, this candidate gene is outside the located
Rg-3 QTL.
Exploring QTLs
The official annotation for the tomato genome provided
by the International Tomato Anno tation Group at the
SGN was used to carry out a preliminary search for
related regeneration genes near the identified QTL
peaks. We found a histidine kinase in SpRg-7, several
seri ne/threonine kinases in all identif ied QTLs, ethylene
response factors (ERFs) in all identified QTLs with the
exception of SpRg-4b, cyclines in SpRg-1, Rg-3, SpRg-4a
and SpRg-7 and MADS-box in SpRg-1, SpRg-4a and
SpRg-7.
Discussion
The wild tomato species S. peruvianum, S. pimp inel lifo-
lium L. and S. chilense were used as sources of regen-
eration genes in order to study the genetics of the in
vitro regeneration in tomato [7,9,21]. In this study, w e
used one accession of S. pennellii (PE-47) as the high
regeneration parent [29]. This accession, along w ith a
previously selected low regenerating tomato cultivar (cv.
Table 2 QTLs for shoot regeneration traits (Bud percentage (B), Regeneration percentage (R) and Productivity Rate
(PR)) found to be significant at the empirical genome wide mapping threshold by restricted Multiple QTL Mapping
(rMQM) in BC
1
and Interval Mapping (IM) in F
2
Test QTL
analysis
Trait QTL Genome
wide
significant
threshold
level (P <
0.05)
Chr Start
(cM)
Finish
(cM)
Coverage
(cM)
LOD
Peak
Position
of LOD
peak
(cM)
Peak marker
a
%
variance
explained
Estimated
additive
effect
Estimated
dominance
effect
BC
1
rMQM B SpRg-
1
2.7 1 3.87 44.42 40.55 7.12 22.47 C2_At1g65520/
C2_At2g45910
23.9 -31.56
BC
1
rMQM R SpRg-
1
2.7 1 3.87 43.42 39.55 5.52 24.47 C2_At1g65520/
C2_At2g45910
15.0 -24.10
BC
1
rMQM PR SpRg-
1
2.8 1 3.87 34.42 30.55 4.19 22.47 C2_At1g65520/
C2_At2g45910
10.2 -0.70
BC
1
rMQM B Rg-3 2.7 3 42.41 55.80 13.39 4.64 50.47 ME20-199 12.2 -21.60
BC
1
rMQM PR Rg-3 2.8 3 32.77 63.10 30.33 4.26 50.47 ME20-199 10.6 -0.68
BC
1
rMQM R SpRg-
4a
2.7 4 44.39 61.24 16.85 4.94 50.24 TAHINA-4-71, 3 13.3 -22.29
BC
1
rMQM PR SpRg-
4b
2.8 4 81.33 93.18 11.85 3.08 86.33 SSR214/SSR146 7.4 -0.63
F
2
IM B SpRg-
7
3.7 7 2.20 40.28 38.08 6.84 19.51 ME10-141/
C2_At4g26680
27.0 -22.20 12.32
F
2
IM R SpRg-
7
3.6 7 4.50 40.28 35.78 6.18 19.51 ME10-141/
C2_At4g26680
24.8 -23.29 13.63
F
2
IM PR SpRg-
7
4.4 7 19.51 36.28 16.77 5.72 28.28 C2_At1g17200 23.1 -1.53 -0.55
BC
1
rMQM R SpRg-
7
2.7 7 0.00 25.08 25.08 5.47 13.44 TAHINA-7-43 14.9 -23.13
BC
1
rMQM PR SpRg-
7
2.8 7 3.54 28.23 24.69 5.28 13.44 TAHINA-7-43 13.5 -0.77
BC
1
rMQM B SpRg-
8
2.7 8 41.18 53.37 12.19 3.84 46.37 C2_At1g64150 12.2 21.25
BC
1
rMQM R SpRg-
8
2.7 8 42.18 58.90 16.72 4.25 53.37 C2_At1g64150/
C2_At4g23840
9.3 19.35
a
In case of the absence of a peak marker, loci flanking the likely peak of a QTL are shown.
Trujillo-Moya et al. BMC Plant Biology 2011, 11:140
/>Page 6 of 12
Anl27), was used to develo p two mapping populations
(F
2
and BC
1
). The use of the introgression lines of S.
pennellii in the M82 tomato background [30] had been
previously ruled out for this analysis because of the hig h
regeneration ability of both parent lines (data not
shown). Data in Figure 1 and Table 1 seem to indicate
comp lete dominance for B, partial dominance for R and
additive effects f or PR. This is in agreement with other
reported studies on tomato where dominance, to d iffer-
ent degrees, depending on the regeneration trait studied,
was also reported [21,22,24,25]. B and R traits show a
high correlation in b oth populations, suggesting that
common or linked genes control these traits. The corre-
lation between PR and both B and R was lower. This
coul d imply that other genes may be influencing the PR
trait and/or variat ions between different biological sam-
ples are higher in PR (for instance, competition for
development due to the presence of different shoots in a
similar explant area). Thus, the low sample size may be
also a possible explanation for the lower correlation.
Some descendants in the F
2
population showed phe-
notypes for the PR trait that are more extreme that
those shown by the regenerating parent line (Figure 1).
Transgressive segregation has already been described in
other reports in relation to the genetic control of plant
regeneration [31-33] , and suggests poligenic inheritance
[34]. It also suggests the existence of alleles that pro-
mote, and others that inhibit, in vitro regeneration, with
only some of the alleles with positive effects occurring
in the same parent [ 34]. In fact, in this study, the SlRg-8
QTL that contributes to regeneration came from the
low regenerating parent.
Plant regeneration from cultured tissues is assumed to
fall under quantitative genetics [34], although evidence
in tomato [22,25] and ot her vegetables [35-37] indicates
that just a few genes could be responsible for regenera-
tion. We identified 6 QTLs in the BC
1
analysis, whi ch is
indicative of the participation of a large number of
genes in this character. These QTLs are situated on
chromosomes 1, 3, 4, 7 and 8 (F igure 2b). The percen-
tage of variance explained by each QTL ranges from 7.4
to 27%, which is in accordance with the most common
range (6-26%) reported in the genetic mapping of QTLs
for tissue culture response in plants [34]. We used three
traits (B, R and PR) as a measurement of regeneration
capability that could be useful for detecting chromo-
some regions that act at different times.
In the F
2
population, only the QTL of chromosome 7
was identified for all analyzed traits (Additional File 3);
the SDMs observed in most chromosome areas where
QTLs were detected in the BC
1
population are most
likely the cause (Figure 2). The S DMs on chromosomes
1, 3, 6, 10 and 11 were also observed in similar areas in
the Tomato-EXPEN 2000 map [38]. SDMs affect the
detection power of QTLs when QTLs and SDMs are
closely linked [39], as occurred in our case. Deviation
from the expected segregation ratio is a common feature
ofinter-specifictomatocrosses[40].Towit:inaF
2
population from S. lycopersicum x S. pennellii, De Vice-
nte and Tanskley [41] reported a skewness rate of up to
80%.
In the BC1 popu lation, three QTLs were detect ed for
B: SpRg-1, SpRg-3 and SlRg-8. T hese QTLs may be asso-
ciated with the first stages of regeneration, that is, hor-
monal induction response and bud formation. SpRg-1,
which explained the highest percentage of variation for
B (23.9%), was also identified for the R and PR traits.
Given that bud formation is a necessary prerequisite for
the production of shoots, it was expected that this
majorQTLforBwouldbefoundforRandPR,which
in fact turned out to be the case (Table 2). For R and
PR, a common QTL on chromosome 7 (SpRg-7)was
also identified. In addition, two QTLs were detected for
R(SpR g-4a and SlRg-8)andPR(SpRg-4b and Rg-3). All
these QTLs seem to be involved in the development of
buds into shoots. As can also be observed in this study,
common QTLs for the different regeneration traits, as
well as a h igher number of QTLs f or traits related to
plant development compared to those associated with
bud induction, have been reported in different studies
[42,43]. For instance, in Arabidopsis, Schianterelli et al.
[43] found a common area of chromosome 1 in all ana-
lyzed parameters, a peak in chromosome 4 and another
in chromosome 5 when t hey analyzed the total number
of regenerated shoots. In wheat, Ben Amer et al. [42]
identified three Q TLs, two that affect green spot initia-
tion and shoot regeneration and a third that only influ-
ences plant formation.
A partial common genetic system controlling the
regeneration frequency of diverse types of explants has
been reported by Molina and Nuez [36] in melon. This
indicates that using different explants for loci detection
may lead to the identification of some common QTLs,
but also to the possible identificatio n of other new
QTLs. Root explants were used by Koo rnneef et al. [25]
and Satoh et al. [22] for phenotyping, at which point
two alleles for regeneration ability were located on chro-
mosome 3 of tomato. In the present study, leaves were
used for phenotyping and a QTL (Rg-3) in a similar area
of chromosome 3 was detected in addition to other
QTLs that influence regeneration and were identified on
chromosomes 1, 4, 7 and 8. Differences in root and leaf
explants for QTL identificati on were also found in Ara-
bidopsis thaliana [43].
Koornneef et al. [25] located a dominant allele from S.
peruvianum (Rg-1) near the middle of chromosome 3
that determines efficient shoot regeneration in tomato
root explants. Satoh et al. [22] mapped a putative allele
Trujillo-Moya et al. BMC Plant Biology 2011, 11:140
/>Page 7 of 12
( Rg-2 )fromS. chilense on this chromosome. The acid
invertase gene, reported as a marker linked to Rg-2,was
chosen for mapping Rg-2 in our population derived
from S. pennellii. The polymorphisms detected in our
parents a llow us to map this gene in the QTL detected
on chromosome 3 that we named Rg-3.Weconsider
Rg-3 to be a putative allele of the Rg-2 gene. Allelism
must be confirmed.
The other gene chosen as a candidate was LESK1,
which encodes a serine/threonine kinase, and was
reported as a marker of competence for in vitro
regeneration in tomato [27,28]. This gene was posi-
tioned on chromosome 3, b ut it is not located in the
Rg-3 QTL.
The recent release of the entire genome sequence of
tomato provides a powerful tool for interro gating QTL
data. In this re spect, we have taken a preliminary look
at genes located at the peak areas of the detected QTLs,
and which could be related to organogenesis. Histidine
kinases were reported as cytokinin receptor s [15- 17]. In
our QTL peaks, only one histidine kinase is located in
the SpRg-7 QTL. The candidate tomato gene, LESK1,
which has been described as a marker for in vitro com-
petence, encodes a serine/threonine kinase. We looked
for serine/threonine kinases and found this kind of pro-
tein in all identified QTLs. Other putative candidate
genes could be ESR1 and its paralogue, ESR2,fromAra-
bidopsis, w hich are the best-characterized genes related
to regeneration [18,19]. These genes code for ethylene
response factors (ERF). We found ERFs, which contain
the AP2 domain, in all analysed QTLs with the excep-
tion of SpRg-4b. Cyclines related to cell division [13]
were found in SpRg-1, Rg-3, SpRg-4a and SpRg-7.
MADS-box genes, which have been correlated to adven-
titious regeneration induction a nd regulation [44,45],
were found in the SpRg-1, SpRg-4a and SpRg-7 QTL
peaks.
Conclusions
The results obtained in this study may very well repre-
sent a significant step towar d the goal of understanding
the processes underlying tomato tissue culture and
regeneration responses. We have situated six QTLs on
chromosomes 1, 3, 4, 7 and 8, five from S. pennellii and
one from S. lycopersicum. The most important QTLs
are SpRg-1, which is most likely associated with the
morphogenetic response, and SpRg-7, which promotes
bud development. A QTL detected on chromosome 3,
Rg-3, likely contains a putative allele of the Rg-1 and Rg-
2 genes, as is shown by mapping the acid invertase gene
linked to Rg-2. QTLs detected on chromosomes 8 and 4
most likely contain genes influencing bud formation and
development, respectively.
Methods
Plant materials and growing conditions
S. pennellii PE-47, which showed a high ability for
regeneration [29], and the tomato cultivar Anl27 (cv.
Anl27), w ith a l ow ability for regeneration, were chosen
for obtaining the mapping population. The initial geno-
types w ere established in vitro, starting with the sterili-
zation of seeds by immersion for 10 min in a solution of
25% commercial bleach (40 g L
-1
active chlorine), being
then washed twice with sterile deionized water for 5
min each and then sown in Petri dishes containing
nutrient medium (Murashige and Skoog [46] salts
including vitamins, 2% sucrose, 0.6% plant agar (DUCH-
EFA, the Netherland s). The pHs of the media were
adjusted to 5.8 before sterilization at 121°C for 20 min.
Cultures were incubated in a growth chamber at 26°C ±
2°C under a 16h photop eriod with cool white ligh t pro-
videdbySylvaniacoolwhiteF37T8/CWfluorescent
lamps (90 μmol m
-2
s
-1
). Clones of one plant of each
genotype were obtained and maintained i n in vitro cul-
ture. The clones were multiplied by transferring nodes
to tubes with fresh basal medium (BM: Murashige and
Skoog -[46]- salts including vitamins, 1.5% sucrose and
7gL
-1
plant agar) every 3-4 weeks. The tubes were 15
cm in length and 22 mm in diameter, with 15 ml of
medium per tube.
Mapping population
One clone of to mato and another of S. pennellii were
transferred to a greenhouse in order to obtain the F
1
plant that was reintroduced in vi tro by disinfection of
shoots following a similar procedure as that carried out
for seed sterilization. F
2
and BC
1
populations were
obtained and seeds were germinated in vitro as
described above.
The F
2
mapping population was composed of 106
individuals obtained from selfing one F
1
plant, the result
of a cross between the tomato cv. Anl27 (P1) and S.
pennellii PE-47 (P2). The backcross (BC
1
) mapping
population, composed of 113 plants, was obtained by
crossing the cv. Anl27 and the F
1
plant. To allow the
test to be reproduced, the F
1
plant and F
2
and BC
1
indi-
viduals were clonally replicated and maintained in vitro
as described above.
Evaluation of the regeneration capacity
A first assay was performed with cloned P1, P2 and F
1
plants. Leaf disk s (0.6-0.8 cm
2
) obtained from in vitro
cultured plants that were at a similar growing stage
were placed with the abaxial side in contact with the
shoot induction medium (SIM) containing Murashige
and Skoog salts [46], 3% sucrose, 7% plant agar and 0.2
mg L
-1
zeatin riboside (ZR). This growth regulator was
Trujillo-Moya et al. BMC Plant Biology 2011, 11:140
/>Page 8 of 12
sterilized by filtration and added to the sterile SIM.
After 30 days of culture o n SIM, the explants were
transferred to BM for 20 days. In this medium, buds
develop into shoots. For each genotype, five explants per
plate (90 × 25 mm with 40 ml of medium per plate) and
10 repetitions per genotype were evaluated. At the end
of the experiment, the following variables were analyzed:
-Bud percentage (B): number of explants with buds ×
100/total number of cultured explants.
-Regeneration perce ntage (R): number of cultures that
differentiated into completely developed shoots × 100/
total number of cultured explants.
-Productivity rate (PR): total number of completely
developed shoots/total number of cultured explants that
regenerated plants.
In a second assay , leaf explants of F
2
,BC
1
, P1, P2 and
F
1
plants were tested as explained above. In this case,
for each genotype, five explants per plate and 4 repeti-
tions per genotype were evaluated. Data for regeneration
was obtained for 102 genotypes of the F
2
population and
104 genotypes of BC
1
. The average value for each trait
and genotype was used for QTL analysis.
To assess the effect of genotype on regeneration abil-
ity, data from the genetically uniform classes (P1, P2
and F
1
) w ere subjected to a unifactorial analysis of var-
iance (ANOVA), and then means for t he different traits
were separated by a Duncan test. The correlations
between the different traits were calculated using the
Statgraphics Plus 4.0 software.
Genotyping
Preparation of genomic DNA
Young leaves from in vitro-cultured plants were col-
lected and immediately frozen with liquid nitrogen and
then stored at -80°C. DNA w as prepared based on the
modified CTAB method of Do yle and Doyle [47]. Sub-
sequently, quality and quantity of the DNA was evalu-
ated on 0.8% agarose gel stained with ethidium
bromide and using the NanoDrop
®
ND-1000
Spectrophotometer.
Amplified fragment length polymorphism (AFLP) procedure
AFLPs were obtained following de Vos et al. [48] proce-
dure. Fifteen and sixteen selective combinations of pri-
mers were used for the F
2
and BC
1
populations,
respectively. The code of each selective combination is
specified in Table 3. Each code followed by the number
corresponding to each obtained band (size in bp) is
used to name the polymorphic AFLPs. Electrophoresis
of the PCR products was conducted using an ABI
PRISM 310 Genetic Analyzer (Pe rkinElmer Applied Bio-
systems, Foster City, California, USA). GeneScan™ 600
LIZ
®
Size Standard, with fluorophore LIZ, was used as a
molecular size marker. Raw data were anal yzed with the
GeneScan 3.1.2 a nalysis software (PerkinElmer Applied
Biosystems) and the resulting GeneScan trace files were
imported into Genographer 1.6.0. The AFLP fragments
between 60 to 380 bp were scored in Genographer as
present (1) or absent (0).
Microsatellites (SSRs)
One hundred and forty-nine SSR markers were used to
detect polymorphism between P1 and P2, which
includ ed 89 S SRs previously reported and mapped onto
the Tomato-EXPEN 2000 available at SGN [49,50],
along with 60 new SSRs: 18 from the COMAV resea rch
group “ Aprovechamiento de la variabilidad estraespecí-
fica en la mejora del tomate” and 42 designed from
sequences deposited in Genbank (see Additional File 2).
Primer pairs were designed from these sequences using
the SSR Primer 3 tool The
criteria used for designing the primers were as follows:
the primer Tm ranged from 55 to 65°C and GC content
was 50%. The presence of G or C bases within the last
five bases from the 3’ end of primers (GC clamp), which
helps promote specific binding at the 3’ end, was taken
into account. In order to design the SSRs, wherever pos-
sible the AT/TA repetitions were selected based on t he
results obtained by Frary et al. [49].
Table 3 Selective combinations of primers used for F
2
and BC
1
genotyping
Code Mapping population Selective primers combination
ME1 F
2
,BC
1
MseI CTA-EcoRI AAC
ME2 F
2
MseI CAA-EcoRI ACC
ME3 F
2
MseI CAA-EcoRI ACG
ME4 F
2
,BC
1
MseI CAA-EcoRI AGC
ME5 F
2
MseI CAC-EcoRI ACA
ME6 F
2
,BC
1
MseI CAC-EcoRI ACG
ME7 F
2
MseI CAC-EcoRI AGC
ME8 F
2
,BC
1
MseI CAA-EcoRI ACA
ME9 F
2
,BC
1
MseI CAA-EcoRI AAC
ME10 F
2
MseI CTA-EcoRI AGC
ME11 F
2
MseI CTC-EcoRI AGC
ME12 F
2
MseI CCG-EcoRI AAC
ME13 F
2
MseI CCG-EcoRI ACC
ME14 F
2
MseI CCG-EcoRI ACG
ME15 F
2
MseI CTC-EcoRI AGG
ME16 BC
1
MseI CAA-EcoRI ACT
ME17 BC
1
MseI CTA-EcoRI ACC
ME18 BC
1
MseI CTA-EcoRI ATG
ME19 BC
1
MseI CTA-EcoRI ACA
ME20 BC
1
MseI CCT-EcoRI ACC
ME21 BC
1
MseI CCT-EcoRI AAC
ME22 BC
1
MseI CCT-EcoRI ATG
ME23 BC
1
MseI CCT-EcoRI ACA
ME24 BC
1
MseI CAC-EcoRI ACC
ME25 BC
1
MseI CAC-EcoRI ATG
ME26 BC
1
MseI CAC-EcoRI AGG
Trujillo-Moya et al. BMC Plant Biology 2011, 11:140
/>Page 9 of 12
All the SSRs, with the exception of those specified
below, were labelled following the M13-tail method
described by Schuelke et al. [52]. DNA amplification
was carried out in volumes of 15 μLusingasampleof
10 ng of DNA. The reaction mixture contained 1.5 μL
10 × PCR buffer [75 mM Tris-HCl (Ph 9.0), 50 mM
KCl, 20 mM (NH
4
)
2
SO
4
and 0.001% BSA], 2 mM
MgCl
2
, 200 μM dNTPs, 0.133 μM of primers, 0.2 μ Mof
fluorescent labelled M13 primer and 0.3 units of TaqI
DNA polymerase (Need S. L., Valencia, Spain). An
Eppendorf 5333 Thermal Cycler was used. The PCR
parameters included the following: an initial 3 min at
94°C; 35 cycles, each with 30 s DNA denaturation at 94°
C; 45 s at an annealing temperature (depending on the
primer combination Tm) and a 1 min extension at 72°C,
and a final extension of 10 min at 72°C. Amplified
bands were visualized using a LI-COR sequencing gel
(DNA LI-COR 4300; LI-COR Biosciences, Lincoln,
Nebraska, USA); 10 μl of loading buffer (95% forma-
mide, 2 mM EDTA, 0.001% bro mophenol blue) and 5 μl
of deionized water were added to the 5 μl PCR mix (2.5
μl of each IRDye 700 or IRDye800-labeled) samples
which were denatured at 96°C for 8 min. Electrophoresis
was performed in denaturing conditions at 50°C, u sing
6% acrylamide gels in TBE buffer.
The SSR356, SSR73, SSR248, SSR46 markers in which
polymorphisms were visible in the agarose gels were
amplified in volumes of 23.32 μlwith:10ngofDNA,
1.6 mM MgCl
2
,171.52μMdNTPs,0.214μMofpri-
mers, 2.5 μlof10×PCRbuffer,and0.6UTaqIDNA
polymerase. The PCR conditions were similar to those
applied before, with the exception of a final extension of
30 min in this case. Amplified bands were run in stan-
dard agarose gels (1 or 2%) in TAE buffer at 100V and
visualized by ethidium bromide staining.
Conserved ortholog set (COS) and cleaved amplified
polymorphic sequence (CAPS) markers
Ninety-six markers (86 COSII, 6 COSI, 4 CAPS) from
the Tomato-EXPEN 2000 map [53,54] and one devel-
oped CAPS marker (Solyc07g049350) were tested for
polymorphism between the P1 and P2 parents. The
restriction enzymes used when required were those indi-
cated in the SGN database. When restriction enzymes
was needed, the protocol described in the commercial
product’s instructions (Fermentas, York, UK or Biolabs,
Takara, Japan) was followed.
The PCR reaction was performed in a total volume of
12 μLusingasampleof10ngofDNA.Thereaction
mixture contained 1.5 mM MgCl
2
,200μMdNTPs,0.25
μmofprimers,1.2μL PCR buffer 10X, and 0.3 U TaqI
DNA polyme rase. Amplification was performed using an
Eppendorf 5333 Thermal Cycler, which was programmed
as follows: 5 min at 9 4°C, 35 30-s cycles each at 94°C, 1
min at Ta (depending on the primer combination Tm)
and a 2 min extension at 72°C, with a final stage of 10
min at 72°C. Amplified bands were separated by 1 or 2%
agarose electrophoresis in TAE buffer at 100V, and visua-
lized by ethidium bromide staining.
Map construction and QTL mapping
Linkage analysis for both mapping populations was per-
formed with the JoinMap
®
4.0 software [55]. Markers
were grouped into linkage groups at LOD ≥ 3, with the
exception of those in chromosomes 9 and 10 of the BC
1
mapping population w ith LOD ≥ 2. Order was deter-
mined with a recombination threshold of 0.40 and dis-
tances w ere calculated using the Kosambi mapping
function (Kosambi 1944). For the genetic map construc-
tion, AFLP, SSR, COS and CAPS markers were used
(Additional File 8). The segregati on ratio of allel es was
evaluated for each locus b y the Chi-square test with a
significance threshold of P < 0.05. The expected segrega-
tion ratios were 3:1 and 1:1 for F
2
and BC
1
, re spectively.
Visu al representations of the marker maps were created
with the MapChart software [56].
QTL analys is on the F
2
and BC
1
phenotypic data sets
was performed with the MapQTL
®
6.0 software [57].
Significance thresholds for th e LOD values, correspond-
ing to a genome-wide false discovery rate of 5% (p <
0.05) were calculated by genome-wide permutation tests
using 1, 000 permutations. Firstly, IM analysis was per-
formed (simple Interval Mapping). Then, if many puta-
tive QTLs were detected by IM, markers close to the
likelihood peaks of the detected QTLs were used as
cofactors for rMQM (also called composite Interval
Mapping) analyses.
Locating candidate genes and looking for other
regeneration-related genes
The S. pennellii acid invertase gene (inv
penn
) was ana-
lyzed and mapped as a marker. Primers described by
Harada et al. [58] were used for DNA amplification
using conditions previously described for COS and
CAPS markers. Amplified bands were separated using
the multicapillary electrophoresis QIAxcel S ystem (Qia-
gen, Valencia, California, USA). We searched for the
location of the LESK1 gene at SGN and for its nearest
markers at International Tomato Annotation Group.
This database was also used for looking for genes puta-
tively related to organogenesis.
Additional material
Additional file 1: Regeneration response of leaf explants.
Regeneration response of leaf explants from parents [tomato (cv. Anl27);
S. pennellii (PE-47)], F
1
,F
2
and BC
1
populations, cultured on shoot
induction medium (SIM) for 30 days and transferred to basal medium
(BM) for 20 days.
Trujillo-Moya et al. BMC Plant Biology 2011, 11:140
/>Page 10 of 12
Additional file 2: In silico-designed SSR markers. Table with the
name, band size, repeat motif, temperature of annealing and primers
sequences of in silico-designed SSR markers.
Additional file 3: Genetic location and LOD score profile of the F
2
-
QTLs for regeneration components detected by Interval Mapping
on chromosome 7 (SpRg-7). Genetic location and LOD score profile of
the F
2
-QTLs for regeneration components (Bud percentage (B),
Regeneration percentage (R) and Productivity Rate (PR)). On the left,
projections of QTLs as black bars indicate the SpRg-7 for B, R and PR
traits. The vertical dotted line indicates the 95% significant threshold
value for declaring a QTL (B LOD threshold = 3.7) (R LOD threshold =
3.6) (PR LOD threshold = 4.4). Map position (cM) and distances are based
on the genetic linkage map developed in this study. QTLs characteristics
in attached table.
Additional file 4: Genetic location and LOD score profile of the BC
1
-
QTLs for Bud percentage (B), detected on chromosomes 1 (SpRg-1),
3(SpRg-3) and 8 (SlRg-8). Results from the Interval Mapping (IM) and
restricted Multiple QTL Mapping (rMQM) approaches. On the left,
projections as black bars (IM) and grey bars (rMQM) indicate the range of
SpRg-1, SpRg-3 and SlRg-8 QTLs for B. The vertical dotted line indicates
the 95% significant threshold value for declaring a QTL (B LOD threshold
= 2.7). The horizontal dotted line indicates the position of the acid
invertase gene (inv
penn
) marker included in the chromosome 3 QTL
range. Map position (cM) and distances are based on the genetic linkage
map developed in this study.
Additional file 5: Genetic location and LOD score profile of the BC
1
-
QTLs for Regeneration percentage (R), detected in this study on
chromosomes 1 (SpRg-1), 4 (SpRg-4a), 7 (SpRg-7) and 8 (SlRg-8).
Results from the Interval Mapping (IM) and restricted Multiple QTL
Mapping (rMQM) approaches. On the left, projections as black bars (IM)
and grey bars (rMQM) indicate the range of SpRg-1, SpRg-4a, SpRg-7 and
SlRg-8 QTLs for R. The vertical dotted line indicates the 95% significant
threshold value for declaring a QTL (R LOD threshold = 2.7). Map
position (cM) and distances are based on the genetic linkage map
developed in this study.
Additional file 6: Genetic location and LOD score profile of the BC
1
-
QTLs for Productivity Rate (PR), detected in this study on
chromosomes 1 (SpRg-1), 3 (SpRg-3), 4 (SpRg-4b) and 7 (SpRg-7).
Results from the Interval Mapping (IM) and restricted Multiple QTL
Mapping (rMQM) approaches. On the left, projections as black bars (IM)
and grey bars (rMQM) indicate the range of SpRg-1, SpRg-3, SpRg-4b and
SpRg-7 for PR. The vertical dotted line indicates the 95% significant
threshold value for declaring a QTL (PR LOD threshold = 2.8). Horizontal
dotted lines indicate the position of the acid invertase gene (inv
penn
)
marker included in the chromosome 3 QTL range. Map position (cM)
and distances are based on the genetic linkage map developed in this
study.
Additional file 7: Polymorphic acid invertase gene marker (inv
penn
).
Amplified bands separated using the multicapillary electrophoresis
QIAxcel System. Lane 1: S. lycopersicum L. (Anl27), band size (~162bp).
Lane 2: S. pennellii PE-47, band size (~173bp). Lane 3: F
1
Hybrid S.
lycopersicum L. (Anl27) × S. pennellii PE-47, both bands (~162bp-~173bp).
Lane 4: negative control.
Additional file 8: Markers used for genotyping the F
2
and BC
1
population. SSR, COS, COSII, CAP markers used for genotyping the F
2
and BC
1
population.
Acknowledgements
CG and CT thank the Spanish ‘Ministerio de Educación y Ciencia’ for a
Ramón y Cajal contract and a predoctoral fellowship, respectively. The
authors acknowledge the financial support of the Instituto de Conservación
y Mejora de la Agrodiversidad Valenciana (COMAV), suggestions from Dr. J.
Cañizares, SSRs designed by O. Julián and the technical assistance of N.
Palacios. The revision and the English revision of the manuscript by A.
Monforte and J. Bergen, respectively, are also acknowledged.
Authors’ contributions
CG obtained the mapping populations. CT conducted the population
phenotyping and genotyping and participated in the drafting. CT and SV
performed the map construction and QTL mapping. CG collaborated in the
phenotyping and genotyping and conceived, supervised and drafted the
manuscript. FN conceived of the study and contributed to critically
reviewing the manuscript. All authors read and approved the final
manuscript.
Received: 13 May 2011 Accepted: 20 October 2011
Published: 20 October 2011
References
1. Bhatia P, Ashwath N, Senaratna T, David M: Tissue culture studies of
tomato (Lycopersicon esculentum). Plant Cell Tissue Organ Cult 2004,
78:1-21.
2. Engelmann F: In vitro conservation of tropical plant germplasm.
Euphytica 1991, 57:227-243.
3. Benson EE: Special symposium: In vitro plant recalcitrance: An
introduction. In Vitro Cell Dev Biol Plant 2000, 36:141-148.
4. Hamza S, Chupeau Y: Re-evaluation of conditions for plant regeneration
and Agrobacterium-mediated transformation from tomato (Lycopersicon
esculentum). J Exp Bot 1993, 44:1837-1845.
5. Frary A, Earle ED: An examination of factors affecting the efficiency of
Agrobacterium-mediated transformation of tomato. Plant Cell Rep 1996,
16:235-240.
6. Peres LEP, Morgante PG, Vecchi C, Kraus JE, Sluys MAv: Shoot regeneration
capacity from roots and transgenic hairy roots of tomato cultivars and
wild related species. Plant Cell Tissue Organ Cult 2001, 65:37-44.
7. Koornneef M, Hanhart CJ, Martinelli L: A genetic analysis of cell culture
traits in tomato. Theor Appl Genet 1987, 74:633-641.
8. Wijbrandi J, Vos JGM, Koornneef M: Transfer of regeneration capacity
from Lycopersicon peruvianum to L. esculentum by protoplast fusion.
Plant Cell Tissue Organ Cult 1988, 12:193-196.
9. Takashina T, Suzuki T, Egashira H, Imanishi S: New molecular markers
linked with the high shoot regeneration capacity of the wild tomato
species Lycopersicon chilense. Breed Sci 1998, 48:109-113.
10. Faria RT, Destro D, Bespalhok JC, Illg RD: Introgression of in vitro
regeneration capability of Lycopersicon pimpinellifolium Mill. into
recalcitrant tomato cultivars. Euphytica 2002, 124:59-63.
11. Sugiyama M: Organogenesis in vitro. Curr Opin Plant Biol 1999, 2:61-64.
12. Zhang S, Lemaux PG: Molecular analysis of in vitro shoot organogenesis.
Crit Rev Plant Sci 2004, 23:325-335.
13. Hemerly AS, Ferreira P, de Almeida Engler J, Van Montagu M, Engler G,
Inze D: cdc2a expression in Arabidopsis is linked with competence for
cell division. Plant Cell 1993,
5:1711-1723.
14.
Skoog F, Miller CO: Chemical regulation of growth and organ formation
in plant tissue cultures in vitro. Symp Soc Exp Biol 1957, 11:118-131.
15. Inoue T, Higuchi M, Hashimoto Y, Seki M, Kobayashi M, Kato T, Tabata S,
Shinozaki K, Kakimoto T: Identification of CRE1 as a cytokinin receptor
from Arabidopsis. Nature 2001, 409:1060-1063.
16. Ueguchi C, Sato S, Kato T, Tabata S: The AHK4 gene involved in the
cytokinin-signalling pathway as a direct receptor molecule in Arabidopsis
thaliana. Plant and Cell Physiology 2001, 42:751-755.
17. Nishimura C, Ohashi Y, Sato S, Kato T, Tabata S, Ueguchi C: Genetic
analysis of Arabidopsis histidine kinase genes encoding cytokinin
receptors reveals their overlapping biological functions in the regulation
of shoot and root growth in Arabidopsis thaliana. Plant Cell 2004,
16:1365-1377.
18. Banno H, Ikeda Y, Niu QW, Chua NH: Overexpression of Arabidopsis ESR1
induces initiation of shoot regeneration. Plant Cell 2001, 12:2609-2618.
19. Ikeda Y, Banno H, Niu QW, Howell SH, Chua NH: The ENHANCER OF SHOOT
REGENERATION 2 gene in Arabidopsis Regulates CUP-SHAPED
COTYLEDON 1 at the transcriptional level and controls cotyledon
development. Plant Cell Physiol 2006, 47:1443-1456.
20. Mase H, Hashiba M, Matsuo N, Banno H: Expression patterns of
Arabidopsis ERF VIII-b subgroup genes during in vitro shoot
regeneration and effects of their overexpression on shoot regeneration
efficiency. Plant Biotechnol 2007, 24:481-486.
21. Faria RT, Illg RD: Inheritance of in vitro plant regeneration ability in the
tomato. Braz J Genet 1996, 19:113-116.
Trujillo-Moya et al. BMC Plant Biology 2011, 11:140
/>Page 11 of 12
22. Satoh H, Takashina T, Escalante A, Egashira H, Imanishi S: Molecular
markers mapped around the high shoot regeneration capacity gene Rg-
2 in Lycopersicon chilense. Breed Sci 2000, 50(4):251-256.
23. Pratta G, Cánepa LN, Zorzoli R, Picardi LA: Diallel analysis of in vitro
culture traits in the genus Lycopersicon. HortScience 2003, 38:110-112.
24. Marchionni BE, Pratta GR, Zorzoli R: Genetic analysis of the in vitro culture
response in tomato. Plant Cell Tissue Organ Cult 2007, 88:233-239.
25. Koornneef M, Bade J, Hanhart C, Horsman K, Schel J, Soppe W, Vekerk R,
Zabel P: Characterization and mapping of a gene controlling shoot
regeneration in tomato. Plant J 1993, 3:131-141.
26. Torelli A, Soragni E, Bolchi A, Petrucco S: New potential markers of in vitro
tomato morphogenesis identified by mRNA differential display. Plant Mol
Biol 1996, 32:891-900.
27. Torelli A, Soragni E, Borinato M, Branca C: The expression of LESK1
morphogenetic marker along the tomato hypocotyl axis is linked to a
position-dependent competence for shoot regeneration. Plant Sci 2004,
166(1):179-190.
28. Torelli A, Borinato M, Soragni E, Bolpagni R, Bottura C, Branca C: The delay
in hormonal treatment modulates the expression of LESK1, a gene
encoding a putative serine-threonine kinase, marker of in vitro
caulogenesis in tomato (Lycopersicon esculentum Mill.). Plant Sci 2004,
167(3):607-620.
29. Gisbert C, Arrillaga I, Roig LA, Moreno V: Adquisition of a collection of
Lycopersicon pennellii (Corr. D’Arcy) transgenic plants with uidA and nptII
marker genes. J Hortic Sci Biotechnol 1999, 74(1):105-109.
30. Eshed Y, Abu-Abied M, Saranga Y, Zamir D: Lycopersicon esculentum lines
containing small overlapping introgressions from L. pennellii. Theor Appl
Genet 1992, 83:1027-1034.
31. Komatsuda T, Annaka T, Oka S: Genetic mapping of a quantitative trait
locus (QTL) that enhances the shoot differentiation rate in Hordeum
vulgare L. Theor Appl Genet 1993, 86:713-720.
32. Taguchi-Shiobara F, Lin SY, Tanno K, Komatsuda T, Yano M, Sasaki T, Oka S:
Mapping quantitative trait loci associated with regeneration ability of
seed callus in rice, Oryza sativa L. Theor Appl Genet 1997, 95:828-833.
33. Flores Berrios E, Gentzbittel L, Mokrani L, Alibert G, Sarrafi A: Genetic
control of early events in protoplast division and regeneration pathways
in sunflower. Theor Appl Genet 2000, 101:606-612.
34. Bolibok H, Rakoczy-Trojanowska M: Genetic mapping of QTLs for tissue-
culture response in plants. Euphytica 2006, 149:73-83.
35. Molina RV, Nuez F: Respuesta correlacionada de la capacidad de
regeneración en distintos tipos de explante en Cucumis melo. Actas
Horticultura 1989, 3:111-118.
36. Molina RV, Nuez F: Correlated response of in vitro regeneration capacity
from different source of explants in Cucumis melo. Plant Cell Rep 1995,
15:129-132.
37. Molina RV, Nuez F: Sexual transmission of the in vitro regeneration
capacity via caulogenesis of Cucumis melo L. in a medium with a high
auxin/cytokinin ratio. Sci Hortic 1997, 70:237-241.
38. Shirasawa K, Asamizu E, Fukuoka H, Ohyama A, Sato S, ·Nakamura Y,
·Tabata S, Sasamoto S, Wada T, Kishida Y: An interspecific linkage map of
SSR and intronic polymorphism markers in tomato. Theor Appl Genet
2010, 121:731-739.
39. Zhang L, Wang S, Li H, Deng Q, Zheng A, Li S, Li P, Li Z, Wang J: Effects of
missing marker and segregation distortion on QTL mapping in F
2
populations. Theor Appl Genet 2010, 121:1071-1082.
40. Chaerani R, Smulders MJ, van der Linden CG, Vosman B, Stam P,
Voorrips RE: QTL identification for early blight resistance (Alternaria
solani)inaSolanum lycopersicum x S. arcanum cross. Theor Appl Genet
2006, 114:439-450.
41. de Vicente MC, Tanksley SD: QTL analysis of transgressive segregation in
an interspecific tomato cross. Genetics 1993, 134:585-596.
42. Ben Amer IM, Korzun V, Worland AJ, Börner A: Genetic mapping of QTLs
controlling tissue-culture response on chromosome 2B of wheat
(Triticum aestivum L.) in relation to major genes and RFLP markers. Theor
Appl Genet 1997, 94:1047-1052.
43. Schiantarelli E, De La Pena A, Candela M: Use of recombinant inbred lines
(RILs) to identify, locate and map major genes and quantitative trait loci
involved with in vitro regeneration ability in Arabidopsis thaliana. Theor
Appl Genet 2001, 102:335-341.
44. Prakash AP, Kumar PP: PkMADS1 is a novel MADS box gene regulating
adventitious shoot induction and vegetative shoot development in
Paulownia kawakamii. Plant J 2002, 29:141-151.
45. Bielenberg DG, Wang Y, Li Z, Zhebentyayeva T, Fan S, Reighard GL, et al:
Sequencing and annotation of the evergrowing locus in peach [Prunus
persica (L.) Batsch] reveals a cluster of six MADS-box transcription
factors as candidate genes for regulation of terminal bud formation. Tree
Genet Genomes 2008, 4(3):495-507.
46. Murashige T, Skoog F: A revised medium for rapid growth and bioassays
with tobacco tissue cultures. Physiol Plant 1962, 15:473-497.
47. Doyle JJ, Doyle JL: Isolation of plant DNA from fresh tissue. Focus 1990,
12:13-15.
48. Vos P, Hogers R, Bleeker M, Reijans M, van de Lee T, Hornes M, Frijters A,
Pot J, Peleman J, Kuiper M, et al: AFLP: a new technique for DNA
fingerprinting. Nucleic Acids Res 1995, 23(21):4407-4414.
49. Frary A, Xu Y, Liu J, Mitchell S, Tedeschi E, Tanksley S: Development of a
set of PCR-based anchor markers encompassing the tomato genome
and evaluation of their usefulness for genetics and breeding
experiments. Theor Appl Genet 2005, 111 :291-312.
50. Mueller LA, Solow TH, Taylor N, Skwarecki B, Buels R, Binns J, et al: The SOL
Genomics Network: a comparative resource for Solanaceae biology and
beyond. Plant Physiol 2005, 138:1310-1317.
51. Rozen S, Skaletsky HJ: Primer3 on the WWW for general users and for
biologist programmers. In Bioinformatics Methods and Protocols: Methods in
Molecular Biology. Edited by: Krawetz S, Misener S. Totowa, NJ: Humana
Press; 2000:365-386.
52. Schuelke M: An economic method for the fluorescent labelling of PCR
fragments. Nature Biotechnology 2000, 18:233-234.
53. Fulton TM, Van der Hoeven R, Eannetta NT, Tanksley SD: Identification,
analysis and utilization of a conserved ortholog set markers for
comparative genomics in Higher Plants. Plant Cell 2002, 14:1457-1467.
54. Wu F, Mueller LA, Crouzillat D, Petiard V, Tanksley SD: Combining
Bioinformatics and Phylogenetics to Identify Large Sets of Single Copy,
Orthologous Genes (COSII) for Comparative, Evolutinonary and
Systematics Studies: A Test Case in the Euasterid Plant Clade. Genetics
2006, 174(3):1407-1420.
55. Van Ooijen JW: JoinMap 4, Software for the calculation of genetic linkage
maps in experimental populations Wageningen, Netherlands: Kyazma BV;
2006.
56. Voorrips RE: MapChart: Software for the graphical presentation of linkage
maps and QTLs. J Hered 2002, 93(1):77-78.
57. Van Ooijen JW: MapQTL
®
6, Software for the mapping of quantitative trait
loci in experimental populations of diploid species Wageningen, Netherlands:
Kyazma BV; 2009.
58. Harada S, Fukuta S, Tanaka H, Ishiguro Y, Sato T: Genetic analysis of the
trait of sucrose accumulation in tomato fruit using molecular marker.
Breeding Sci 1995, 45:429-434.
doi:10.1186/1471-2229-11-140
Cite this article as: Trujillo-Moya et al.: Localization of QTLs for in vitro
plant regeneration in tomato. BMC Plant Biology 2011 11:140.
Submit your next manuscript to BioMed Central
and take full advantage of:
• Convenient online submission
• Thorough peer review
• No space constraints or color figure charges
• Immediate publication on acceptance
• Inclusion in PubMed, CAS, Scopus and Google Scholar
• Research which is freely available for redistribution
Submit your manuscript at
www.biomedcentral.com/submit
Trujillo-Moya et al. BMC Plant Biology 2011, 11:140
/>Page 12 of 12