báo cáo khoa học: " Identification, utilisation and mapping of novel transcriptome-based markers from blackcurrant (Ribes nigrum)" pdf
Bạn đang xem bản rút gọn của tài liệu. Xem và tải ngay bản đầy đủ của tài liệu tại đây (375.84 KB, 11 trang )
RESEARCH ARTICLE Open Access
Identification, utilisation and mapping of novel
transcriptome-based markers from blackcurrant
(Ribes nigrum)
Joanne R Russell
1*
, Micha Bayer
1
, Clare Booth
1
, Linda Cardle
1
, Christine A Hackett
2
, Pete E Hedley
1
,
Linzi Jorgensen
1
, Jenny A Morris
1
and Rex M Brennan
1
Abstract
Background: Deep-level second generation sequencing (2GS) technologies are now being applied to non-model
species as a viable and favourable alternative to Sanger sequencing. Large-scale SNP discovery was undertaken in
blackcurrant (Ribes nigrum L.) using transcriptome-based 2GS 454 sequencing on the parental genotypes of a
reference mapping population, to generate large numbers of novel markers for the construction of a high-density
linkage map.
Results: Over 700,000 reads were produced, from which a total of 7,000 SNPs were found. A subset of
polymorphic SNPs was selected to develop a 384-SNP OPA assay using the Illumina BeadXpress platform.
Additionally, the data enabled identification of 3,000 novel EST-SSRs. The selected SNPs and SSRs were validated
across diverse Ribes germplasm, including mapping populations and other selected Ribes species.
SNP-based maps were developed from two blackcurrant mapping populations, incorporating 48% and 27% of
assayed SNPs respectively. A relatively high proportion of visually monomorphic SNPs were investigated further by
quantitative trait mapping of theta score outputs from BeadStudio analysis, and this enabled additional SNPs to be
placed on the two maps.
Conclusions: The use of 2GS technology for the development of markers is superior to previously described
methods, in both numbers of markers and biological informativeness of those markers. Whilst the numbers of
reads and assembled contigs were comparable to similar sized studies of other non-model species, here a high
proportion of novel genes were discovered across a wide range of putative function and localisation. The potential
utility of markers developed using the 2GS approach in downstream breeding applications is discussed.
Background
In many species the main limitation to understanding
and characterising importanttraitsisthelackofsuffi-
cient genetic markers for the development of high-den-
sity genetic maps and association studies. Large
numbers o f markers, s uch as Simple Sequence Repeats
(SSRs) and Single Nucleotide Polymorphisms (SNPs),
are required to assist in identifying genes that underlie
genetic variation. For many crop and horticultural spe-
cies, genetic linkage maps have now been developed and
Quantitative Trait Loci (QTL) have been assigned to
large chromosomal regions, but so far candidate genes
have been identified for only a few of these [1]. The
need for more genetic markers is recognised and until
recently has been a major challenge and expense. With
the intro duction of new sequencing technologies, tradi-
tional low-throughput methods of marker development
have bee n superseded [2]. Th ese technologies are often
referred to as ‘Second Generation Sequencing’ (2GS)
and the platforms include the Illumina Genome Analy-
zer, the Roche 454 FLX and the Applied Biosystems
SOLiD systems, all of which are widely used for shotgun
genome sequencing and SNP discovery [3-9].
Deep-level 2GS technologies are now being applied to
non-model species as a vi able and favourable alternative
to Sanger sequencing, despite the absence o f a referenc e
* Correspondence:
1
Cell & Molecular Sciences, James Hutton Institute, Invergowrie, Dundee DD2
5DA, UK
Full list of author information is available at the end of the article
Russell et al . BMC Plant Biology 2011, 11:147
/>© 2011 Russell et al; l icensee BioMed Central Ltd. This is an Open Access article distributed under the terms of the Creative Commons
Attribution License (http://creati vecommons.org/licenses/b y/2.0), which permits unrestricted use, distribution, and repro duction in
any medium, provided the original work is properly cited.
genomic sequence on which to map the short reads.
Expressed Sequence Tags (ESTs), derived from the
RNA-based transcriptome, have been extremely useful
resources to assist ma rker development [10] and, by uti-
lising 2GS technologies, transcripts ca n be sequenced to
a greater depth, enabling discovery of novel gene
sequences at a fraction of the cost and time taken pre-
viously. This approach is particularly useful in species
wherethereislittlegenomeinformation,allowinga
largenumberofSNPstobeidentifiedfromacrossa
wide range of transcripts [11]. Recently, several such
studies based on high-throughput transcriptome sequen-
cing have been carried out in non-model plant species,
including maize, grapevine, eucalyptus, olive and com-
mon bean [3,6,4,7,12].
Blackcurrant (Ribes n igrum L.) is taxonomically iso-
lated within the Saxifragaceae and curren t genomics
resources are extremely limited. As wit h many eco-
nomically important woody perennial species, breeding
of Ribes is a long-term process due to the highly het-
erozygous g ermplasm available and the long generation
time, so there is an obvi ous incentive to develop mar-
ker-assisted breeding strategies to reduce the timescale
for selection of superior genotypes. Previously, we have
constructed cDNA libraries from developing fruit and
buds, and Sanger-sequenced several thousand ESTs
[13,14]. From these libraries, forty-three SSR and six-
teen SNP markers have been mapped genetically and,
together with AFLPs, a number of markers associated
with k ey phenological and fruit quality traits identified.
Despite these being relatively large sequencing efforts
at the time, we were still only able to generate a spar-
sely populated framework map of 538 cM with QTL
spanning 5 to 10 cM. 2GS technologies now offer the
opportunity to generate large numbers of novel mar-
kers from which to construct high-density genetic link-
age maps.
The aim of our c urrent study was to perform large-
scale SNP disco very from gene coding regions of black-
currant using 2GS 454 pyrosequencing. Once SNPs
were identified, an efficient means of genotyping was
required. Previous st udies have validated only a small
proportion of the identified SNPs, usually by Sanger re-
sequencing [4,15]. High-density assays for SNP detection
have recently been developed and one such platform
from Illumina enables simultaneousassaysof384mar-
kersfromasingleDNAsample.Asubsetofpoly-
morphic SNPs from blackcurrant, representi ng a diver se
set of genes, was therefore used to develop a 384 SNP
Oligo Pool All (OPA) assay on the Illumina BeadXpress
platform. In addition, 2GS transcriptome sequencing
facilitated identification of n ovel EST-SSRs which are
proven robust marker types [10,16,17]. To facilitate vali-
dation of these SNPs and SSRs, two segregating
mapping populations and a diverse set of germplasm,
480 samples in total, were assayed.
Results
The overall objective of this study was to determine
whether 2GS technology would enable significant gene
discovery in Ribes nigrum and whether these short reads
could be assembled de novo for efficient isolation and
development of novel genetic markers. In this study,
over 700,000 sequence reads gene rated from cDNA
derived from developing blackcurrant buds of parental
genotypes gave sufficient coverage to detect c. 7,000
SNP s, a subset of which w ere validated via the Illumina
BeadXpress genotyping platform.
Transcriptome sequencing, contig assembly and gene
annotation
A t otal of 712,814 high-quality sequence reads derived
from pooled RNA extracted from developing buds of
each of the Ribes parents S10 (226,248 reads) and S36
(485,566 reads) were screened for adaptor sequence
contamination, leaving 225,334 reads (S10) and 482,959
reads (S36), followed by re moval of ribosomal matches,
leaving 212,104 reads (S10) and 314,189 reads (S36). We
found significantl y higher levels of rRNA-derived con-
tamination in S36 (35%) compared to S10 (6%), which
was believed to be due to processing-related factors,
therefore a further run of S36 was necessary to boost fil-
tered read levels from this parent. The mean read length
of the final sets were 214 nt (S10) and 230 nt (S36)
respectively. These were subsequently assembled de
novo, resulting in 33,518 contiguous sequences (contigs)
and 12,893 singletons, with a mean contig length of 407
nt (range of 40 nt to 8,440 nt). These contigs and sin-
gleton sequences were annotated with descriptors of
their closest homologues by running BLASTX searches
against the non-redundant protein sequences from
NCBI and the peptide models for Arabidopsis thaliana
from TAIR [18,19], matching 21,527 and 17,280 pep-
tides respectively. The percentage of assembly products
scoring significant BLAST hits (i.e. with an e-value of
less than 10
-10
) was 52% and 64% respectively, reflecting
the high level of novel gene identification for Ribes in
this study. The BLAST hits resulting from the search
against the Arabidopsis peptides were also processed
further by extracting Gene Ontology (GO) terms for
each hit using the GO annotation provided by TAIR
(Additional File 1: Figure S1). There w as representation
of transcripts in all but one of the major GO categories
for biological processes, the exception being the “other
physiological proc esses” category. In addition to anno-
tating the assembled contigs, we also compared them
with the set of existing Sanger sequenced ESTs from the
cultivar Ben Hope (3,327 in total) [20], using the 454
Russell et al . BMC Plant Biology 2011, 11:147
/>Page 2 of 11
contigs as query sequences in a BLAST search against
the Sanger ESTs. A total of 2,688 of the exist ing Sanger
EST contigs were represented in the output from the
454 runs, leaving 639 (19%) without representation,
reflecting the difference in tissue provenance between
samples.
Marker development: Single Nucleotide Polymorphisms
and Simple Sequence Repeats
A set of 7,245 high-confidence (p > 0.9) Ribes SNPs were
disc overed using GigaBayes software. Parental genotypes
were also defined and for the majority of cases, either one
parent (4,239 out of 7,245) or b oth parents (2,684) were
heterozygous, and only a small proportion (202) was
found where both pare nts were homozygous. There were
only 120 cases where all the reads in the contig originated
from the same parent, and these were not considered for
further use in this study. As well as SNPs, many of the
EST sequences contained repeat motifs. Using Sputnik
software [21], 3,179 SSRs were identified, of which over
half were trinucleotide, a third dinucleotide, and a small
number were tetra- and pentanucleotide repeats.
The 384 SNP assay was designed using Illumina tech-
nical support (). As described
in the Methods section, the Illumina SNP selecti on was
based on an absence of neighbouring polymorphisms,
repetitive elements or palindrom es, which are known to
have an adverse effect on success of assays.
Preliminary analysis of SNPs in the mapping populations
From the 384 SNPs scored, 189 were identified as segre-
gating in mapping population SCRI 9328 using the
BeadStudio software (version 3.1). Of these, 75 were het-
erozygous in the seed parent only, 63 were heterozygous
in the pollen parent only and 51 were heterozygous in
both parents. Inspection of segregation ratios of the
individual markers showed four lines in the population
with unexpected genotypes for many SNPs, and these
were excluded from subsequent analysis. A cluster ana-
lysis of the remaining progeny based on the markers
that were heterozygous for the seed parent only showed
no particular groupings, but a cluster analysis based on
the markers heterozygous for the pollen parent showed
a distinct cluster of 46 offsprin g, none of which had
inherited any of the alleles specific to the pollen parent.
A chi-squared test was used to compare the segregation
ratio of these 46 offspring with the remaining 261 off-
spring for the markers heterozygous for the seed parent.
Thi s found that the segregation ratios were significantly
different (p < 0.001) for 72 of the 75 marke rs, with a
segregation ratio close to 1:2:1 for these 46 offspring,
but 1:1 for the remaining offspring. These results are
consistent with these 46 offspring being selfs and these
were excluded from the linkage analysis.
In the MP7 population, 118 of the 384 SNPs were
found to segregate using the BeadStudio software. Of
these, 50 were heterozygous in cv. Ben Finlay (seed par-
ent) only, 35 were heterozygous in cv. Hedda (pollen
parent) only and 33 were heterozygous in both parents.
A cluster analysis of the MP7 population showed three
lines in the population with unexpected genotypes for
many SNPs and these were excluded from subsequent
analysis. Cluster analysis showed no evidence for any
selfing or other grouping of individuals within this
population.
Linkage analysis of SCRI 9328
Both SNP and SSR markers were used in the linkage
analysis. No markers wer e isolated from this population:
all were linked with a lod of at least 11 to one or more
other markers. Two linkage groups formed at a lod
score of three, but the remaining markers only separated
at a higher l od, between 7 and 16. This gave ten linkage
groups, of which two were small, while the remaining
groups had 14-46 markers. The markers within each
linkage group were ordered together, rather than separ-
ating the markers from the two parent s as i s sometimes
necessary for this type of cross. The fit of the linkage
map was, in the authors’ experience, unusually good for
an outbreedin g species. Only five markers were omitted
as causing problems with t he fit, and JoinMap’smean
chi-squared criterion for the resulting maps was below
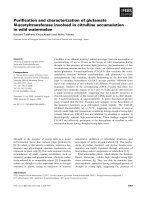
2.5 for each of the eight large linkage groups. Figure 1
shows the linkage maps, produced using the Mapchart
2.1software[22].Thelinkagegroupshavethesame
numbering as in [14], using the SSR markers for identi-
fication: the order of the SSR markers shows good
agreement with the smaller population. The total map
length is 605 cM.
Linkage analysis of MP7
In this population, six SNP markers were excluded as
having highly distorted ratios (p < 0.001). Five markers
were isolated at a lod of 4. The remaining markers
formed 9 linkage grou ps using a lod threshold between
5 and 7. There were two small groups, of two and three
markers, and seven larger ones of 8-21 markers. Two
markers were excluded as causing problems with the fit.
The remaining fits were good, again with all mea n chi-
squared criteria below 2.5. Figure 1 shows the linkage
maps, with lines connecting markers to the correspond-
ing ones o n SCRI 9328. These show good agreement
between the maps. The total map length is 355 cM.
Analysis of heterogeneity between recombination
frequencies
Where there are pairs of SNPs in common between the
corresponding linkage groups, the recombination
Russell et al . BMC Plant Biology 2011, 11:147
/>Page 3 of 11
frequencies can be tested for heterogeneity using a chi-
squared test implemented in JoinMap 3. A total of 360
pairs of SNPs were examined. Of these, there was no
significant heterogeneity (p > 0.05) for 339 pairs, while
15 pairs had significance between 0.05 and 0.01, i.e. a
similar number to that expected by chance. Six pairs
showed more significant heterogeneity, two pairs on
LG7 both involving CL113Contig1_641 were significant
CL1028Contig1_522
0.0
CL609Contig2_2658
7.3
CL2096Contig1_429
14.3
CL1694Contig2_353
16.2
CL1830Contig1_456
21.4
CL1323Contig1_649
26.7
CL222Contig2_432
29.9
g1_K04
38.7
CL79Contig5_337
39.4
g2_P03a
40.4
g1_O17
41.6
CL181Contig3_116
42.2
CL1Contig17_1834
44.0
g2_P03b
44.7
CL105Contig1_1202
45.5
e1_O20
47.2
gr2_J05_183
48.0
g2_P17
48.1
CL124Contig2_898
49.4
CL1199Contig1_699
51.0
CL1Contig181_880
51.5
CL1463Contig2_256
51.9
g2_D05
52.5
CL2643Contig1_468
54.2
g1_P05
54.9
CL1484Contig1_382
55.5
g1_M07
57.7
CL1092Contig1_971
76.0
CL177Contig2_445
76.8
CL1060Contig1_488
81.3
CL139Contig3_846
93.3
CL175Contig2_839, 83%
CL2516Contig1_469, 98%CL495Contig3_954, 89%
CL1913Contig1_419, 57%
CL1636Contig1_1112, 66%
CL115Contig4_555, 78%
CL186Contig2_1502, 84%
CL1247Contig1_287, 73%
SC
R I9328 L G 1
CL609Contig2_2658
0.0
CL2096Contig1_429
2.4
CL1694Contig2_353
5.1
CL1830Contig1_456
16.6
CL1323Contig1_649
22.3
CL222Contig2_432
28.1
CL1Contig17_1834
38.4
CL105Contig1_1202
39.1
CL1Contig181_880
43.5
CL1199Contig1_699
45.9
CL1092Contig1_971
55.7
CL177Contig2_445
59.1
CL1247Contig1_287
60.0
CL1060Contig1_488
65.9
CL139Contig3_846
79.2
CL2516Contig1_469, 99%
CL186Contig2_1502, 70%
CL124Contig2_898, 98%
MP 7 LG1
CL155Contig2_137
0.0
CL241Contig2_721
14.3
CL1Contig338_99
36.4
CL1Contig693_482
41.0
CL1Contig132_618
42.0
CL1Contig648_852
42.9
g2_H21
46.1
CL119Contig1_1274
50.9
g2_L17
52.0
g1_J11a
52.9
gr2_N15
53.1
CL188Contig2_571
53.2
g1_P08
53.3
e1_O21 g1_F04b
53.5
g1_F04a
53.7
CL126Contig3_276
53.8
CL1Contig1024_757
53.9
CL1827Contig1_545 CL1Contig861_213
54.0
CL118Contig4_162 CL295Contig1_1202
54.1
CL1071Contig1_950 CL1Contig653_353
54.2
CL1680Contig1_558
54.3
CL13Contig6_626
54.4
gr2_N24
54.7
g1_J11b
54.9
CL134Contig1_762
56.0
CL1192Contig1_848
70.6
CL1Contig255_477
72.3
CL1Contig138_1240
85.1
CL149Contig3_1467
85.2
CL1Contig337_459
88.1
CL879Contig1_208
102.8
CL225Contig2_220
102.9
CL155Contig1_696, 97%CL977Contig3_225, 64%
CL1Contig70_351, 62%
CL118Contig3_372, 83%
Cl1Contig51_503, 92%
S C R I9328 L G 4
CL1Contig648_852
0.0
CL118Contig3_372
3.2
CL1827Contig1_545 CL126Contig3_276
4.2
CL1680Contig1_558 CL1Contig1024_757
CL134Contig1_762 CL1071Contig1_950
5.1
CL1Contig861_213
6.6
CL119Contig1_1274
7.6
CL1Contig132_618
11.1
CL1Contig693_482
17.3
CL1192Contig1_848
23.6
CL1Contig255_477
27.6
CL1Contig337_459
37.1
CL1Contig138_1240
38.8
CL225Contig2_220
52.9
CL977Contig3_225, 88%
CL1Contig70_351, 76%
CL259Contig6_134, 95%
MP 7 LG4
erb3_J14b
0.0
e1_F04
5.5
CL1Contig775_278
11.5
erb1_M15
15.6
CL1Conti
g
1027_353
21.6
CL1166Contig1_780, 76%
S C R I9328 L G 9
CL837Contig3_185
0.0
CL219Contig1_986
6.6
MP 7 LG9
e4_D03
0.0
CL1397Contig1_475
10.8
CL2859Contig1_446 CL1Contig889_534
23.4
CL1259Contig1_117
26.8
CL1097Contig1_791
27.7
CL234Contig1_608
34.5
CL176Contig1_230
39.5
CL951Contig1_190
44.1
CL61Contig1_2372
46.6
CL2001Contig1_304
48.1
CL192Contig3_480
48.2
CL1343Contig1_574
48.9
CL1167Contig2_549 CL135Contig1_992
CL193Contig1_501 CL1212Contig1_1333
CL1033Contig2_690 CL196Contig1_344
CL657Contig2_887 CL1061Contig1_121
CL1590Contig1_819 CL1Contig109_936
CL126Contig2_235 CL1057Contig1_870
CL6584contig1ssr
49.3
CL1278Contig2_825 CL1653Contig1_402
49.7
CL836Contig1_1017
50.0
g2_B20
50.3
g2_M19_303
50.7
CL227Contig2_1171 CL1Contig931_1929
CL1Contig285_845
50.9
CL1529Contig1_615
51.5
g2_M19_293
51.8
e3_M04a
54.3
CL138Contig1_371
56.2
CL830Contig1_100
60.4
CL1488Contig1_196
62.3
CL1Contig714_201
96.0
CL1974Contig1_211
97.0
CL1Contig973_658
102.7
CL1Contig291_268
104.9
CL90Contig2_879, 99%
CL218Contig5_933, 96%CL1068Contig3_1021, 74%
CL2041Contig1_198, 85%
CL194Contig1_1316, 72%
CL1Contig182_446, 63%
CL2659Contig1_177, 99%
CL173Contig3_511, 65%
CL1189Contig1_918, 98%
CL1517Contig1_137, 74%
CL286Contig2_555, 94%
CL2270Contig1_618, 71%
CL622Contig4_183, 99%
CL190Contig1_743, 96%
CL1Contig545_368, 94%
CL1141Contig1_239, 78%
S C R I9328 L G 3
CL90Contig2_879
0.0
CL2859Contig1_446
4.0
CL1Contig889_534
5.4
CL218Contig5_933
9.4
CL234Contig1_608
15.0
CL176Contig1_230
23.5
CL1Contig182_446
24.5
CL951Contig1_190
29.0
CL2001Contig1_304
30.1
CL1057Contig1_870
33.2
CL61Contig1_2372
34.4
CL836Contig1_1017
36.6
CL227Contig2_1171 CL1Contig931_1929
CL1Contig285_845
37.6
CL1488Contig1_196
49.2
CL1Contig54_1873
58.1
CL1Contig973_658
69.5
CL1Contig291_268
71.9
CL194Contig1_1316, 50% CL130Contig1_519, 60%
CL1141Contig1_239, 86%
CL1068Contig3_1021, 82%
CL108Contig2_322, 57%
CL286Contig2_555, 97%
CL1Contig545_368, 91%
CL190Contig1_743, 99%
CL16Contig1_275, 96%
CL112Contig2_441, 54%
MP 7 LG3
CL1Contig38_1121
0.0
CL895Contig1_1185
3.1
CL163Contig3_1046
7.7
CL2395Contig1_181
13.7
CL1Contig743_710
18.2
CL1Contig694_1457
29.8
CL2120Contig1_184
30.7
CL151Contig8_1373
33.9
CL1191Contig1_435
41.1
g1_G06a
46.8
CL1Contig353_70 CL7Contig12_122
49.5
CL122Contig7_1607
49.8
g2_J08_166 gr1_F07a
CL1Contig460_66 CL1Contig264_1457
49.9
g1_B02
50.1
g1_P01
50.4
CL1098Contig1_524
50.5
g1_G06b
50.6
CL1Contig971_186
52.8
CL13Contig2_733 CL1Contig53_1007
53.1
CL1125Contig1_927
53.5
CL2660Contig1_501 CL1111Contig1_166
54.6
CL59Contig6_588
56.1
CL1Contig44_589
83.8
CL172Contig1_1655, 89%
CL274Contig2_1659, 88%
CL1125Contig1_927, 99%
CL42Contig14_244, 99%
CL1Contig29_592, 91%
CL2123Contig2_406, 91%
CL663Contig1_51, 97%
CL15Contig8_100, 97%
S C R I9328 L G 2
CL895Contig1_1185
0.0
CL1Contig38_1121
1.4
CL163Contig3_1046
12.7
CL151Contig8_1373
24.3
CL1Contig694_1457
26.2
CL1191Contig1_435
31.8
CL1Contig264_1457
42.3
CL1Contig353_70
42.4
CL7Contig12_122 CL1Contig460_66
42.8
CL122Contig7_1607
42.9
CL1125Contig1_927 CL13Contig2_733
CL1Contig53_1007 CL2660Contig1_501
43.6
CL1111Contig1_166
44.7
CL59Contig6_588 CL42Contig14_244
45.8
CL1Contig971_186
46.3
CL172Contig1_1655
51.6
CL2123Contig2_406
53.4
CL1Contig109_936, 53%
CL15Contig8_100, 99%
CL1230Contig3_1096, 77%
MP 7 LG2
e3_B02
0.0
CL2142Contig1_425
9.2
CL917Contig1_213
20.5
CL1Contig926_233 CL1Contig385_914
25.4
CL1Contig323_123 CL121Contig2_310
g2_N20
26.3
CL152Contig3_1565
26.4
CL1Contig968_64 CL1Contig525_204
CL125Contig2_1119
26.5
CL1Contig279_332 CL1243Contig1_476
26.9
CL1Contig16_442
27.3
CL158Contig3_1034
27.4
CL1121contig1ssr CL1Contig872_243
28.6
CL351Contig1_633
30.0
g1_H09
30.6
g1_L12
32.1
g1_A01
32.5
CL662Contig1_691
39.1
CL168Contig1_1539
43.2
CL199Contig1_796
45.2
CL1Contig727_458
45.4
g1_O02
46.8
CL17Contig1_545
47.3
CL1464Contig1_817
49.9
CL4457contig1ssr
52.0
CL10Contig3_792 CL754Contig1_758
58.3
CL103Contig5_491
58.7
CL2036Contig1_673
85.4
CL688Contig2_869, 79%
Cl238Contig4_446, 58%
CL171Contig1_1507, 67%CL1Contig970_214, 76%
CL108Contig2_322, 83%
CL120Contig1_247, 95%
CL630Contig3_308, 91%
CL1Contig1013_661, 96%
CL180Contig5_1477, 78%
CL1307Contig1_192, 92%
CL276Contig5_201, 95%
SC
R I9328 L G 5
CL2142Contig1_425
0.0
CL1Contig385_914
19.3
CL121Contig2_310
20.2
CL1Contig279_332
20.4
CL351Contig1_633 CL1Contig968_64
21.6
CL180Contig5_1477
32.6
CL754Contig1_758
33.7
CL17Contig1_545
38.0
Cl238Contig4_446, 53%
CL152Contig3_1565, 58%
CL1Contig323_123, 99%
CL120Contig1_247, 98%
C
L
239
5
C
ontig
1
_
181
, 7
1%
MP 7 LG5
CL2837Contig1_225
0.0
CL1Contig445_560
0.8
CL2Contig70_1576
3.3
CL908Contig1_630
3.9
CL132Contig1_564
4.4
CL257Contig1_204 CL1Contig1018_1154
4.9
g1_I02 e1_O01
CL1Contig398_1308 CL146Contig2_150
5.5
CL154Contig1_1579
5.6
CL285Contig1_1074 CL1Contig517_520
6.7
g1_D11
7.2
CL1016Contig1_489
7.4
CL664Contig1_599
12.3
CL904Contig1_477 CL198Contig1_761
14.1
CL1456Contig1_1718
18.6
g1_P21_176
30.1
g1_P21_173
30.5
CL982Contig1_240, 79%
CL1Contig364_340, 89%
CL1Contig746_267, 83%
CL719Contig1_464, 94%
CL1Contig847_1703, 59%
S C R I9328 L G 6
CL2Contig70_1576
0.0
CL285Contig1_1074
1.7
CL198Contig1_761
8.8
CL982Contig1_240, 79%
CL257Contig1_204, 52%
CL908Contig1_630, 93%
CL1016Contig1_489, 97%
CL1Contig847_1703, 66%
CL1Contig1018_1154, 96%
CL1Contig517_520, 99%
CL2837Contig1_225, 93%
CL664Contig1_599, 96%
MP 7 LG6
CL258Contig2_288
0.0
CL1Contig424_517
1.6
CL604Contig1_503
7.7
CL1218Contig1_144
10.1
CL1148Contig1_764
11.7
CL88Contig2_932
12.1
CL18Contig2_1072
16.1
CL600Contig1_730
23.5
CL179Contig1_343
25.5
CL113Contig1_641
41.0
g2_J11
51.1
g3_A17
51.2
CL127Contig1_1434 CL1513Contig1_590
CL1918Contig1_407
51.7
CL1Contig261_868 CL1Contig327_460
51.9
g1_G11
52.5
g2_G12
52.8
CL2013Contig1_407
53.4
CL825Contig3_311
56.3
CL19858contig1ssr
61.5
CL2381Contig1_523, 95%
CL2319Contig2_214, 62%CL130Contig1_519, 71%
S C R I9328 L G 7
CL23Contig10_722
0.0
CL258Contig2_288
0.6
CL604Contig1_503
8.9
CL1218Contig1_144
9.1
CL2381Contig1_523
9.6
CL88Contig2_932
11.2
CL18Contig2_1072
12.6
CL600Contig1_730
14.8
CL1148Contig1_764
15.6
CL179Contig1_343
16.0
CL113Contig1_641
23.9
CL1Contig424_517, 99%
MP 7 LG7
CL23Contig10_722
0.0
CL140Contig1_504
5.8
CL1218Contig1_144
21.0
S C R I9328 L G 7b
CL1Contig245_186
0.0
CL1Contig96_259
4.2
e4_J13
9.1
g2_N08a
9.3
g2_M13
9.4
CL126Contig1_477 CL148Contig3_1357
CL1Contig735_1426
9.8
CL184Contig3_2089
10.3
CL1Contig494_651
10.4
CL9Contig1_194
10.8
CL152Contig5_1081
12.4
CL1154Contig1_1278
14.7
CL1Contig969_1027
20.9
SCRI9328 LG8
CL1Contig245_186
0.0
CL1Contig96_259
5.4
CL9Contig1_194
10.6
CL1Contig494_651
11.1
CL148Contig3_1357
14.4
CL1Contig735_1426
14.5
CL152Contig5_1081
15.8
CL1Contig969_1027
20.3
CL184Contig3_2089, 99%
CL126Contig1_477, 99%
MP 7 LG8
Figure 1 Linkage maps of the SCRI 9328 and MP7 populations. with one-lod confidence intervals for the SNP theta scores with R
2
>50%.
Different colours show shared QTLs (green), QTLs in SCRI 9328 and markers in MP7 (blue) and QTLs in MP7 and markers in SCRI 9328 (pink).
Russell et al . BMC Plant Biology 2011, 11:147
/>Page 4 of 11
with p < 0.005, while four pairs on LG5, all involving
CL754Contig1_758, were significant with p < 0.001.
Heterogeneity of recombination frequencies is therefore
not a widespread problem between these two crosses.
QTL analysis of the SNP theta scores for the SCRI 9328
population
Inspection of the 384 SNP theta scores for the SCRI
9328 population showed that 15 SNPs had more than
100 missing values. These were excluded from further
analysis, leaving 369 SNPs with at most 15 missing
values. The range was also examined: the ideal SNP will
havearangeofone,i.e.athetascoreofonefortheBB
genotype and zero for the AA genotype. SNPs with a
range less than 0.05 were excluded from the QTL analy-
sis, leaving a total of 310 SNPs for w hich the theta
scores were mapped. These consisted of 184 SNPs that
were mapped as clear bi-allelic markers, five SNPs that
segregated as bi-allelic markers but were excluded from
the linkage map and 121 SNPs that w ere considered as
non-segregating by BeadStudio.
All 184 SNPs that could be mapped as markers
mapped to the same location when their theta scores
were used for QTL mapping. Regression of the theta
values o n the most s ignificant marker explained 71-99%
of the variance in the theta values, with a lower quartil e
of 97%. The five SNP markers that were dropped from
the linkage analysis due to their poor fits to the linkage
group all mapped to the same groups when the theta
scores were analysed as QTL, with regression on the
closest marker e xplaining 90-99% of the variance of the
theta score. Two of these markers were heterozygous in
both parents, and mapped to a region on LG2 with
some segregation distortion. The other three w ere het-
erozygous in one parent but, when mapped as QTL,
showed associations to the alleles from the other parent.
The 121 remaining SNPs, when mapped as QTL,
showed marker associations with the maximum percen-
tage variance explained ranging from 0.7% (i.e. no signif-
icantassociation)to99%.Thirty-oneoftheSNPshada
maximum percentage variance of at least 70%, compar-
able to the SNPs that were also mapped as markers. Sig-
nificance thresholds for the presence of QTL were
established by means of a permutation test [23], using
100 permutations for each of three traits with different
ranges, indicating that the maximum percentage var-
iance explained for any of these permuted traits was
6.3%. Thirty-six SNPs had a maximum percentage var-
iance below 6.3% and these will be categorised as with-
out significant QTL. However we are interested here in
SNPs where there is substantial, rather than just statisti-
cally significant, genetic variance and we have therefore
chosen to focus on SNPs where the maximum percen-
tage variance explained by marker regression is greater
than 50%. Fifty-two of the 121 SNPs fall in this range.
One-lod confidence intervals for these SNPs, together
with the five that were a poor fit in the linkage analysis,
are shown in Figure 1.
QTL analysis of the SNP theta scores for the MP7
population
In this population, 251 SNPs had theta scores with a
range greater than or equal to 0.05 and at most 10 miss-
ing values. One hundred and eighteen of these were
scored as markers, with 105 placed on the linkage map.
Of the 133 re maining SNPs, 36 mapped as QTL with
more than 50% of the variance explained and these are
shown in Figure 1. There is good agreement between
the positions of the SNP markers in the two popula-
tions, whether mapped as markers or as QTL: 15 SNPs
mapped as QTL to similar positions on the same chro-
mosome in both populations, 24 SNPs mapped as a
QTL in one population and as a marker to a similar
position on the same chromosome. Some only mapped
in one population. Only one clear di screpancy was
found, CL2395Contig1_181. This mapped as a marker
in SCRI 9328 to linkage group LG2. As a QTL, it
mapped to the same location with 82% of the trait var-
iance explained, but showed smaller, though significant
(p < 0.001) peaks on LG3 and LG5. CL2395Contig1_181
did not m ap as a marker in MP7 but mapped as a QTL
to LG5, with 71% of the trait variance explained.
Validation of SNPs via diversity analysis
The 384 SNPs were also used to examine diversity in a
range of 66 Ribes nigrum cultivars and 5 related species.
The number of polymorphic SNPs was similar to that
observed in the original mapping population (207 SNPs
cf. 190 SNPs). Diversity values for each SNP, measured
using Nei’s unbiased expected heterozygo sity, ranged
from 0.030 to the maximum value of 0.500, with an
overall mean value of 0.307 (Table 1). The observed and
expected heterozygosity values were similar, with a
mean inbreeding coefficient of -0.069 (Table 1). Only 22
loci exhibited a minimum allele frequency (MAF) less
than 0.050 and 47 with a MAF less than 0.100. Almost
half of those scored were shown to be monomorphic in
the 5 related species.
Validation of SSRs via mapping and diversity analysis
A subsample of 40 SSRs representing different motif
types and repeat numbers were tested using the SCRI
9328 mapping parents and a range of blackcurrant
germplasm and related species, gooseberry (R. grossu-
laria L.) and redcurrant (R. rubrum L). Of t he 40 SSR
primers designed, 36 amplified in all genotypes tested
and of the 10 SSRs which were subsequently fluores-
cently labeled and visualised using the ABI 3730, 6 were
Russell et al . BMC Plant Biology 2011, 11:147
/>Page 5 of 11
mapped in the segregating population (shown in Figure
1) an d 8 were polymorphic in the germplasm collection.
The number of alleles ranged from 3 to 8, with a mean
value of 2.9 and a mean unbiased expected heterozygos-
ity of 0.397 (Table 2). As with SNP analysis, SSRs
showed similar values for observed and expected hetero-
zygosity and a comparable inbreeding coefficient of
0.128 (Table 2). Comparing cultivated and wild acces-
sions, diversity was greater in the wild Ribes, although
this was associated with high levels of inbreeding (m ean
F
IS
of 0.432 for 5 w ild Ribes) for all loci, suggesting the
presence of null alleles in the wild germplasm.
Discussion
Central to all pla nt breeding programmes is the identifi-
cation of genes that control economically important
traits. Traditionally this has been achieved by developing
gene tic maps us ing a limited number of molecular mar-
kers. With the recent advances in sequencing technolo-
gies, markers can now be generated on an
unprecedented scale [10]. We report the use of 2GS 454
technology to generate over 700,000 reads from cDNA
of developing blackcurrant buds, allowing sufficient cov-
erage to identify over 7,000 SNPs and 3,000 SSRs. Below
we discuss the attributes of the assembled contigs and
singletons and the utility of the SNP and SSR markers
toprovideanimprovedgeneticmaptohelpidentify
genes responsible for important traits in blackcurrant.
In terms of read numbers and assembled contigs and
singletons, our results were similar to those generated in
other 454 transcriptome studies of non-model species
[3,4,7,8,15,24]. Of 33,518 c ontigs and 12,893 singletons,
52% and 64% scored significant BLAST hits to peptide
sequences in the public domain, which was higher than
that re ported for other tree species including Eucalyptus
grandis (38%) [4] and Pinus conto rta (32%) [8]. How-
ever, these rela tively low levels of significant homologies
and the presence of ESTs not found in our Sanger EST
collection [20] reflect the high p roportion of novel
genes discovered in this study for blackcurrant. From
the peptide homologies and GO annotation analysis
(Additional File 1: Figure S1), it was clear that tran-
scripts from a wide range of genes, with respect to puta-
tive function and localisation, have been sampled and
thereby form the basis of novel gene-specific markers.
Second generation sequencing has been used to iden-
tify SNPs in a range of plant species [10]. In this study
we identified over 7,000 SNPs from de novo assembled
blackcurrant EST data. As well as the development of
this approach for SNP discovery, we addressed the ques-
tion of validation and whether de novo SNP discovery
based upon 2GS data alone can translate into SNP
detection assays and, more importantly, useful markers.
We designed a multiplex high-throughput SNP detec-
tion assay based on the Illumina BeadXpress platform
and examined polymorphism across 384 SNPs using
Table 1 Summary diversity statistics calculated for 207 polymorphic SNPs for 71 Ribes germplasm accessions and
related wild species.
Sample Size Observed Heterozygosity Expected Heterozygosity Unbiased Expected Heterozygosity Fixation Index
Breeding lines 33 0.366 0.333 0.338 -0.090
’Ben’ cvs 15 0.374 0.313 0.324 -0.161
Other cultivars 18 0.334 0.307 0.316 -0.072
Wilds 5 0.149 0.217 0.248 0.229
Overall Mean 0.306 0.292 0.307 -0.047
’Ben’ relates to the series of cultivars released from the breeding programme at JHI.
Table 2 Summary diversity statistics calculated for 8 polymorphic SSRs for 68 Ribes germplasm accessions and related
wild species.
Sample
Size
Mean number of
Alleles
Observed
Heterozygosity
Expected
Heterozygosity
Unbiased Expected
Heterozygosity
Fixation
Index
Breeding
lines
30 3.250 0.346 0.334 0.340 -0.062
’Ben’ cvs 15 3.000 0.345 0.368 0.381 0.040
Other
cultivars
18 3.875 0.348 0.428 0.440 0.193
Wilds 5 3.500 0.350 0.627 0.701 0.432
Overall
Mean
2.950 0.303 0.364 0.397 0.128
’Ben’ relates to the series of cultivars released from the breeding programme at JHI.
Russell et al . BMC Plant Biology 2011, 11:147
/>Page 6 of 11
two segregating populations and a diverse set of germ-
plasm. Although all SNPs were chosen to be poly-
morphic from read alignments, we were unable to
confirmalmosthalfofputativeSNPsfromthecurrent
assembly by a linkage mapping approach as they did not
segregate clearly in the mapping populations. There may
be technical reasons why some SNPs do not perform as
well as others: Close et al. [25] describe some unscor-
able SNPs due to low GenTrain scores (less than 0.300) ,
even though they had been selected from Sanger
sequenced EST collections. Although several of our
SNPs fall into this class (13%), the majority of those
unconfirmed SNPs appeared in a single cluster with
high GenTrain scores and w ere subsequently scored as
monomorphic. These monomorphic SNPs could be
sequencing errors masque rading as SNPs or mis-
assembled reads, resulting in sequences of gene family
members from different regions of the genome being
assembled into single contigs. Additional sequencing
would be expected to increase the transcriptome space
coverage which would ultimately improve the specificity
of assembly. Recently, we augmen ted our blackcurrant
ESTs using paired-end Illumina 2GS of the same RNA
(data not presented) and found that several of the 454
contigs which led to monomorphic SNPs (~15%) were
not supported in the new assembly and that many of
the predicted SNPs (~70%) in these contigs also disap-
peared. This also highlights t he recent rapid technical
advances in 2GS, in terms of l evels of coverage and
sequencing fidelity achievable. Indeed, hybrid assemblies
derived from multiple 2GS platforms often achieve the
most reliable contig datasets. Alternative strategies to
RNA-seq include genomic reduction approaches, which
aim to reduce gDNA complexity of species with large
genomes, such as maize, grain amaranths, common
bean and soybean [3,9,12,26-28]. These approaches may
suffer less from mis-assembly, by including unique non-
coding sequences, however such non-genic markers can-
not often be directly related to functionality. As well as
reducing the initial complexity, improvements in de
novo assembly and SNP identification pipelines have
recently been developed [29,30].
Using t he available analysis software (Illumina Bead-
Studio v3.1), we were able to map 184 SNPs (48% of
assayed SNPs) and 105 SNPs (27% of assa yed SNPs)
from two blackcurrant mapping populations, SCRI 9328
and MP7 respectively. Although these levels appear rela-
tively low, considering both parents of 9328 were used
in the SNP discovery pipeline, othe r studies which have
used mapping parents in the same manner (discovery,
detection and subsequent mapping) found similar num-
bers of SNPs placed on the genetic maps in maize (63%)
[27] and in two mapping populations of po tato (43%
and 4 8%) [30]. There was good agreement of markers
between maps with very little heterogenei ty of recombi-
nation frequencies. Although these SNPs greatly
improved our previous maps, we investigated the mono-
morphic markers further by mapping the theta score
outputs from the BeadStudio analysis as quantitative
traits. As these scores are expected to be from a single
genetic locus, plus some measurement error, we used a
very high threshold of 5 0% of the trait variance
explained by a single position. At this threshold we were
able to place 52 of the visually monomorphic SNPs on
the SCRI 9328 map and 36 on the MP7 map. In general
there was go od agreement between positions in the t wo
populations, whether SNPs were mapped as QTL in
both populations or as a QTL in one population and a
marker in the other. Further SNPs could be mapped as
QTL by lowering the threshold. We plan to investigate
further how SNP theta scores can best be used in such
analyses.
The 384 SNP as say was also used to genotype a set of
diverse blackcurrant accessions, including breeding lines,
and rela ted cultivated and w ild Ribes species. Over half
of the SNPs were polymorphic with a mean MAF of
0.253, similar to that observed in chicken (0.280) and
pigs (0.274) using SNPs from reduced representation
libraries [31,11]. Mammadov et al. [27] used MAF as a
means of measuring polymorphism for SNP markers,
and in their maize study using 604 mapped SNPs, 80%
had a MAF > 0.100. In our study of 209 polymorphic
SNPs, over 75% had a MAF > 0.100. The SNP markers
also performed well when comparing diversity to other
studies (mean H
E
of 0.292 for Ribes compared to H
E
of
0.350 for chicken [31]) and, as expected for blackcur-
rant, there was no evidence of i nbreeding, with very
similar values of observed and expected heterozygosity.
As well as SNPs, several studies have used simi lar
approaches to mine for SSRs, for a range of applications
including mapping, systematics, population and conser-
vation genetics [8,16,17,32-35]. The numbers of identi-
fied SSRs varied across these studies from almost all
(97%) sequences with microsatellites (FIASCO enrich-
ment procedure) [17] to several hundred (single lane of
transcriptome sequencing) [33], with most studies falling
somewhere in between. In this study, we have identified
over 3,000 novel blackcurrant EST-SSRs using 454 2GS
which will provide sufficient gene-based markers for
most applications. Diversity values from our stud y (H
E
0.152 to 0.825) were comparable with others (eg. in
juniper, 0.200 to 0.900) [34], although as expect ed thes e
were slightly lower t han in our previous study using
genomic SSRs, with values ranging from 0.184 to 0.908
[36]. However, the effort and time required to develop
genomic SSRs is far gre ater and more costly. F urther-
more, we observed significant correlation between the
genetic distances matrices generated from SNP and SSR
Russell et al . BMC Plant Biology 2011, 11:147
/>Page 7 of 11
data for the same blackcurrant individuals (20 common
accessions; r
2
= 0.777, data not shown), corroborating
the robustness of these markers for a range of
applications.
Conclusions
We have found the use of 2GS technologies for marker
development far superior to any previously described
methods (supported in [8]), both in terms of the num-
bers of SNPs and SSRs identified and in the biological
informativeness of those markers. The approach is
extremely cost-effective for species with unsequenced
genomes and would be greatly improved simply by uti-
lising, or u sing combinations of, the most up-to-date
2GS technologies available. Informatics analysis of such
data is still in its infancy, but on-going improvements to
assembly and identification will allow simple selection of
the most robust and informative markers from any spe-
cies into a working assay, thereby enhancing the devel-
opment of marker-assisted breeding strategies. At the
present time, such strategies for bree ding in Ribes are
restricted to a single-gene pest resistance trait [37] but,
using the findings reported here, the opportunity to
extend early selection to include complex traits such as
fruit quality and developmental characters offers exciting
prospects for future varietal development in
blackcurrant.
Methods
Plant material
Leaf buds were sampled from four-year old blackcurrant
plants grown in the field at Invergowrie, Dundee (lati-
tude 56.45, longitude -3 .06) of both parents of the refer-
ence mapping population SCRI 9328 in February 2008,
immediately prior to dormancy break, i.e. as the buds
began to visibly swell. Buds were flash frozen in liquid
nitrogen and stored at -80°C.
The SCRI 9328 population consists of 311 F
1
full-sib
progeny from a pseudo-t estcross [38] made b y hand in
an insect-proof glasshouse between two diverse breeding
lines from the James Hutton Institute [14]. In addition,
asecondF
1
full-sib mapping populatio n with 95 pro-
geny, designated MP7, from a cross between blackcur-
rant cvs. Ben Finlay and Hedda, was used in the
downstream validation of markers.
ArangeofRibes germplasm, including 33 breeding
lines, 15 commercially available cultivars (Bens) and 5
related wild species (Table 1, 2) were used to determine
the diversity of both SNP and SSR markers identi fied in
this study.
Total RNA extraction
Total RNA was extracted from 100 mg of frozen pooled
developing bud material using the Plant RNeasy Mini
Extract ion Kit (RLC buffer, Qiagen) with the addition of
RNA isolation aid (Ambion). RNA quality w as checked
by spectrophotometry and integrity assessed using a
Bioanalyzer (Agilent Technologies).
Genomic DNA isolation
Young leaf material was harve sted from field grown
plants of two mapping populations (SCRI 9328 and
MP7) and 71 Ribes germplasm ac cessions. Total geno-
mic DNA was extracted using either the method
described by Milligan [39] or the DNeasy Mini Extrac-
tion Kit (Qiagen). DNA quality and quantity were mea-
sured using PicoGreen spectrophotometry (Invitrogen).
454 sequencing and quality control
Total RNA from developing buds of Ribes parents S 10
and S36 were submitted separately to the GenePool Ser-
vice Facility (University of Edinburgh, UK) for standard
transcriptome 454 FLX (Roche) RNA-seq sequencing.
cDNA was generated using either SMART (Clontech) or
MINT (Evrogen) kits as recommended by the manufac-
turer. Fragmentation and library pr eparation were per-
formed as reco mmended (Roche) prior to running
samples. All sequence reads have been submitted to
EMBL European N ucleotide Archive (ENA: http://www.
ebi.ac.uk/ena/). The reads for each parent were screened
for the presence of adapter sequences originating from
both the cDNA preparation and the 454 experimental
procedures. Adapter contamination was masked using
CROSS_MATCH ( />consed.html), and then trimmed from the reads u sing
custom perl scripts. The matching quality scores for the
reads were a lso removed. Any reads that had adapter
contamination in t he middle were discarded as possible
chimeric sequences. Following adapter trimming, the
sequences were screened for the presence of contami-
nating ribosomal RNA. A small BLAST database con-
taining ribosomal RNA sequences from a variety of
plants was c onstructed from entries using a keyword
search of Genbank. The reads were then searched
against this database and any that had a match to a
ribosomal RNA sequence with an e-value greater than
1e-10 were discarded.
Sequence assembly
After adapter and ribosomal sequence trimming, the
identifiers of each of the sequences w ere prefixed with
the parental name (S10 or S36), and then all 526,293
sequences were assembled using the tgicl suite (http://
compbio.dfc i.harvard.edu/tgi/software) running on a sin-
gle CentOS Linux machine with four processors. The
assembly parameters used were the same as those
‘relaxed’ parameters used in the HarvEST assemblies
(), namely the CAP3 parameters -p
Russell et al . BMC Plant Biology 2011, 11:147
/>Page 8 of 11
75 -d 200 -f 250 -h 90. These were s ufficiently relaxed
so that SNPs would not be se parated into different con-
tigs, thereby allowing SNP discovery. During assembly,
19 reads caus ed slippage error messages from CAP3 and
were therefore removed.
EST annotation
Contigs were annotated with descriptors of their closest
homologues using BLAST (with an e-value cut-off of
1e-10) to search them against the non-redundant pro-
tein sequences from NCBI and against the peptide mod-
els for Arabidopsis thaliana [19]. The BLAST hits
resulting from the search against the A. thaliana pep-
tides were processed further by extracting Gene Ontol-
ogy (GO) terms for each hit using the annotation file
provided by TAIR ( />Ontologies/Gene_Ontology/ATH_GO_GOSLIM.txt).
The number of occurrences of each GO ID was then
recorded, and the GO ID was resolved against the high-
est order GO categories that were to be visualised (ftp://
ftp.arabidopsis.org/home/tair/Ontologies/Gene_Ontol-
ogy/TAIR_GO_slim_categories.txt).
SNP determination
Single nucleotide polymorphisms (SNPs) were discov-
ered in the final assembly using the GigaBayes tool
from the laboratory of Gabor Marth at Boston College
( />GigaBayes detects SNPs and indels in asse mbly files
(ace file format) and, depending on parameter settings,
can also output parental genotypes. Both the SNP itself
and the parental genotypes are associated with a Baye-
sian probability value which indicates the degree of
confidence in the feature. The parameter settings
“–CRL 6 –CAL1 3 –CAL2 3 –PSL 0.9 –QRL 0 –QAL
0 –ploidy diploid –sample multiple” were used to find
locations at which both the minor and major alleles
are present at least three times per assembled
sequence. The minimum read base quality value
(–QRL) and minimum aggregate allel e quality value
(–QAL) flags had to be set to a zero threshold because
the assembly software used assigns low base quality
scores to the consensus sequence at positions where
there is a high degree of variability, such as at SNPs
[40]. The GigaBayes output and the contig sequences
were visualised and selected using the ‘Tablet’ software
package [41] and submitted to Illumina technical sup-
port (
) for design of Illumina
GoldenGate SNP assays. The Illumina SNP selection is
based on an absence of neighbouring polymorphisms
(60 bp flanking sequence on each side between SNPs),
repetitive elements or palindromes, since these are
known to affect the conversion rate of SNPs into
working assays [42,43].
SSR identification and analysis
SSRs were identified from the assembly using the Sput-
nik program [21] and oligonucleotide primers were
designed using Primer 3 [44]. Primer p airs were tested
for their ability to amplify SSR loci according to the pro-
tocols described in [36]. SSR loci were visualised using
ABI PRISM
®
3730 Genetic Analyzer and alleles scored
using GeneMapper
®
software (Applied Biosystems Inc.,
Warrington, UK). Diversity statist ics were calculated
according to [45] using the Excel microsatellite toolkit
[46]. The unbiased estimator of Wright’s inbreeding
coefficient, F
IS
, was calculated using the FSTAT v. 2.9.3
software [47].
Illumina genotyping
The entire genotyping pro cedure was performed as
recommended in the Goldengate Genotyping Assay for
VeraCode Manual (Illumina VC-901-1001). All reagents,
unlessstatedotherwisewereprovidedbyIllumina.The
sample VBP was scanned immediately using default set-
tings in the VeraScan software on the BeadXpress
Reader System.
Data extraction and interpretation
Genotypes were scored visually using Illumina BeadStu-
dio data analysis software (v 3.1) package. Each SNP was
scored separately and clusters determined automati cally
or manually into the three expected groups (AA, AB
and BB).
Preliminary data analysis
Brennan et al. [14] detected 43 progeny thought to be
selfs among the original 125 progeny o f the SCRI 9328
pop ulation by a cluster analysis of the AFLP bands seg-
regating in the pollen parent only. This analysis was
repeated for the extended population of 311 lines, using
the SNP markers that segregated in the pollen parent
only. A simple matching coefficient was used as a mea-
sure of similarity, and a dendrogram was constructed
using group average cluster analysis. For comparison,
cluster analysis was also carried out based on the SNP
markers that segregated in the seed parent only. The
same analy sis was carried out on the MP7 progeny. All
cluster analyses we re performed using Genstat for Win-
dows 12 [48].
Genetic mapping
Linkage maps of the segregating SNPs and SSRs were
estimated for both the reference mapping population
SCRI 9328 and also for the second MP7 population
separately, using the JoinMap 3 software [49] and the
Kosambi mapping function. Heterogeneity between
recombination frequencies in the two populations was
examined using the chi-squared test in JoinMap 3.
Russell et al . BMC Plant Biology 2011, 11:147
/>Page 9 of 11
QTL analysis of the SNP theta scores
The Illumina data consists of two intensity values (X, Y)
for each SNP, measuring the intensities of the fluores-
cent dyes associated with the two alleles of the SNP.
After normalisation, the intensities are transformed to a
combined SNP intensity R = (X+Y) and an intensity
ratio theta = (2/π)*arctan(Y/X) [50]. Individuals are clas-
sified as genotypes AA, AB or BB at each SNP depend-
ing on the SNP theta score.
All of the 384 SNPs were expected to segregate in
population SCRI 9328, but as reported, about half were
not identified as segregating by the BeadStudio software.
Another approach was to analyse the theta scores as
quantitative traits, regarding them as being comprised of
genetic information plus measurement error. Each trait
was thus analysed by QTL interval mapping using the
soft ware MapQTL 5.0 [51]. Genstat 12 was also used to
carry out regressions of the theta score s on the marker
data and to estimate the percentage of the variance
explained.
Additional material
Additional File 1: Figure S1 - Distribution of GO annotation
categories (blue bars) of blackcurrant ESTs based upon closest
derived homologies to Arabidopsis predicted peptide sequences.
These are compared to distribution of GO annotations from the whole
Arabidopsis genome (red bars).
Acknowledgements
This work was supported by the Scottish Government and by the European
Regional Development Fund (Project No. 35-2-05-09). Implementation of
genotype visualisation software from Iain Milne and Gordon Stephen is
gratefully acknowledged.
Author details
1
Cell & Molecular Sciences, James Hutton Institute, Invergowrie, Dundee DD2
5DA, UK.
2
Biomathematics and Statistics Scotland, James Hutton Institute,
Invergowrie, Dundee DD2 5DA, UK.
Authors’ contributions
JR helped conceive the study and coordinated the molecular work and
mapping analysis. PH helped conceive the study, provided advice on the
experimental design and molecular biology, and facilitated the 2GS
procedures. MB and LC provided bioinformatics support for the 2GS data.
CH analysed the mapping data. CB and JAM provided sequencing and
genotyping support. RB helped conceive the study and provided
appropriate plant material. SG collected plant samples for analysis. LJ
performed the molecular work. JR, PH and RB drafted the manuscript, which
all authors read and approved.
Received: 1 July 2011 Accepted: 28 October 2011
Published: 28 October 2011
References
1. Mackay I, Horwell A, Garner J, White J, McKee J, Philpott H: Reanalyses of
the historical series of UK variety trials to quantify the contributions of
genetic and environmental factors to trends and variability in yield over
time. Theor Appl Genet 2011, 122:225-238.
2. Wall PK, Leebens-Mack J, Chanderbali AS, Barakat A, Wolcott E, Liang H,
Landherr L, Tomsho LP, Hu Y, Carlson JE, Ma H, Schuster SC, Soltis DE,
Soltis PS, Altman N, de Pamphilis CW: Comparison of next generation
sequencing technologies for transcriptome characterization. BMC
Genomics 2009, 10:347-366.
3. Barbazuk WB, Emrich SJ, Chen HD, Li L, Schnable PS: SNP discovery via
454 transcriptome sequencing. The Plant Journal 2007, 51:910-918.
4. Novaes E, Drost DR, Farmerie WG, Pappas GJ, Grattapaglia D, Sederoff RR,
Kirst M: High-throughput gene and SNP discovery in Eucalyptus grandis,
an uncharacterised genome. BMC Genomics 2008, 9:312-326.
5. Morozova O, Marra MA: Applications of next-generation sequencing
technologies in functional genomics. Genomics 2008, 92:255-264.
6. Bellin D, Ferrarini A, Chimento A, Kaiser O, Levenkova N, Bouffard P,
Delledonne M: Combining next-generation pyrosequencing with
microarray for large scale expression analysis in non-model species. BMC
Genomics 2009, 10:555-564.
7. Alagna F, Agostino ND, Torchia L, Servili M, Rao R, Pietrella M, Giuliano G,
Chiusano ML, Baldoni L, Perrotta G: Comparative 454 pyrosequencing of
transcripts from two olive genotypes during fruit development. BMC
Genomics 2009, 10:399-414.
8. Parchman TL, Geist KS, Grahnen JA, Benkman CW, Buerkle CA:
Transcriptome sequencing in an ecologically important tree species:
assembly, annotation, and marker discovery. BMC Genomics 2010,
11:180-196.
9. Hyten DL, Cannon SB, Song Q, Weeks N, Fickus EW, Shoemaker RC,
Specht JE, Framer AD, May GD, Cregan PB: High-throughput SNP
discovery through deep resquencing of a reduced representation library
to anchor and orient scaffolds in the soybean whole genome sequence.
BMC Genomics 2010, 11:38-46.
10. Varshney RK, Nayak SN, May GD, Jackson SA: Next-generation sequencing
technologies and their implications for crop genetics and breeding.
Trends in Biotechnology 2009, 27:522-530.
11. Ramos AM, Crooijmans RPMA, Affara NA, Amaral AJ, Archibald AL,
Beever JE, Bendixen C, Churcher C, Clark R, Dehais P, Hansen MS: Design of
a high density SNP genotyping assay in the pig using SNPs identified
and characterized by Next Generation Sequencing technology. PLoS One
2009, 4:e6524.
12. Hyten DL, Song Q, Fickus EW, Quigley CV, Lim J-S, Choi I-Y, Hwang E-Y,
Pastor-Corrales M, Cregan PB: High-throughput SNP discovery and assay
development in common bean. BMC Genomics 2010, 11:475-482.
13. Woodhead M, Davies HV, Brennan RM, Taylor MA: The isolation of
genomic DNA from blackcurrant (Ribes nigrum L.). Molecular
Biotechnology 1998, 9:243-246.
14.
Brennan R, Jorgensen L, Hackett C, Woodhead M, Gordon SL, Russell J: The
development of a genetic linkage map of blackcurrant (Ribes nigrum L.)
and the identification of regions associated with key fruit quality and
agronomic traits. Euphytica 2008, 161:19-34.
15. Trick M, Long Y, Meng J, Bancroft I: Single nucleotide polymorphism (SNP)
discovery in the polyploidy Brassica napus using Solexa transcriptome
sequencing. Plant Biotechnology Journal 2009, 7:334-346.
16. Hahn DA, Ragland GJ, Shoemaker DD, Denlinger DL: Gene discovery using
massively parallel pyrosequencing to develop ESTs for the flesh fly
Sarcophaga crassipalpis. BMC Genomics 2009, 10:234-243.
17. Santana QC, Coetzee MPA, Steenkamp ET, Mlonyeni OX, Hammond GNA,
Wingfield MJ, Wingfield BD: Microsatellite discovery by deep sequencing
of enriched genomic libraries. Biotechniques 2009, 46:217-223.
18. Swarbreck D, Wilks C, Lamesch P, Berardini TZ, Garcia-Hernandez M,
Foerster H, Li D, Meyer T, Muller R, Ploetz L, Radenbaugh A: The
Arabidopsis Information Resource (TAIR): genestructure and function
annotation. Nucleic Acids Research 2008, 36(Database):D1009-D1014.
19. The Arabidopsis Information Resource (TAIR). [bidopsis.
org].
20. Hedley PE, Russell JR, Jorgensen L, Gordon S, Morris JA, Hackett CA,
Cardle L, Brennan R: Candidate genes associated with bud dormancy
release in blackcurrant (Ribes nigrum L.). BMC Plant Biology 2010, 10:202.
21. Abajian C: Sputnik. University of Washington Department of Molecular
Biotechnology; 1994 [ />22. Voorrips RE: MapChart: Software for the graphical presentation of linkage
maps and QTLs. The Journal of Heredity 2002, 93(1):77-78.
23. Churchill GA, Doerge RW: Empirical threshold values for quantitative trait
mapping. Genetics 1994, 138:963-971.
Russell et al . BMC Plant Biology 2011, 11:147
/>Page 10 of 11
24. Cheung F, Haas BJ, Goldberg SMD, May GD, Xiao Y, Town CD: Sequencing
Medicago truncatula expressed sequenced tags using 454 Life Sciences
technology. BMC Genomics 2006, 7:272-282.
25. Close TJ, Bhat PR, S. Lonardi S, Wu Y, Rostoks N: Development and
implementation of high-throughput SNP genotyping in barley. BMC
Genomics 2009, 10:582.
26. van Orsouw NJ, Hogers RCJ, Janssen A, Snoeijers S, Verstege E,
Schneiders H, van der Poel H, van Oeveren J, Verstegen H, van Eijk MJT:
Complexity Reduction of Polymorphic Sequences (CRoPS (TM)): A Novel
Approach for Large-Scale Polymorphism Discovery in Complex
Genomes. PLoS One 2007, 2:e1172.
27. Mammadov JA, Chen W, Ren R, Pai R, Marchione W, Yalcin F, Witsenboer H,
Greene TW, Thompson SA, Kumpatla SP: Development of highly
polymorphic SNP markers from the complexity reduced portion of
maize [Zea mays L.] genome for use in marker-assisted breeding. Theor
Appl Genet 2010, 121:577-588.
28. Maughan PJ, Yourstone SM, Jellen EN, Udall JA: SNP discovery via
genomic reduction, barcoding and 454-pyrosequencing in Amaranth.
The Plant Genome 2009, 2:260-270.
29. Ratan A, Zhang Y, Hayes VM, Schuster SC, Miller W: Calling SNPs without a
reference sequence. BMC Bioinformatics 2010, 11:130-142.
30. Anithakumari AM, Tang J, van Eck HJ, Visser RGF, Leunissen JAM, Vosman B,
van der Linden CG: A pipeline for high throughput detection and
mapping of SNPs from EST databases. Mol Breeding 2010, 26:65-75.
31. Kerstens HHD, Crooijmans RPMA, Veenendaal A, Dibbits BW, Chin-A-
Woeng TFC, Dunnen JT, den Groenen MAM: Large scale single nucleotide
polymorphism discovery in unsequenced genomes using second
generation high throughput sequencing technology: applied to turkey.
BMC Genomics 2009, 10:479.
32. Quilang J, Wang S, Li P, Abernathy J, Peatman E, Wang Y, Wang L, Shi Y,
Wallace R, Guo X, Liu Z: Generation and analysis of ESTs from the eastern
oyster, Crassostrea virginica Gmelin and identification of microsatellite
and SNP markers. BMC Genomics 2007, 8:157-168.
33. Robertson BC, Stanton JAL, Gemmell NJ: Fast, cost-effective development
of species-specific microsatellite markers by genomic sequencing.
Biotechniques 2009, 46:185.
34. Opgenoorth L: Identification and characterisation of microsatellite
marker in the tetraploid Juniperus tibetica Kom. using next generation
sequencing. Conservation Genet Resour 2010, 1:253-255.
35. Allentoft ME, Schuster SC, Holdaway RN, Hale ML, McLay E, Oskam C,
Gilbert TP, Spencer P, Willerslev E, Bunce M: Identification of
microsatellites from an extinct moa species using high-throughput (454)
sequence data. Biotechniques 2009, 46:195-200.
36. Brennan R, Jorgensen L, Woodhead M, Russell J:
Development and
characterisation of SSR markers in Ribes species. Molecular ecology Notes
2002, 2:327-330.
37. Brennan R, Jorgensen L, Gordon SL, Loades K, Hackett C, Russell J: The
development of a PCR-based marker linked to resistance to the
blackcurrant gall mite (Cecidophyopsis ribis Acari: Eriophyidae). Theoretical
and Applied Genetics 2009, 118:205-212.
38. Grattapaglia D, Sederoff R: Genetic linkage maps of Eucalyptus grandis
and Eucalyptus urophylla using a pseudotestcross mapping strategy and
RAPD markers. Genetics 1994, 137:1121-1137.
39. Milligan BG: Plant DNA isolation. In Molecular genetics of populations: a
practical approach. Edited by: Hoelzed AR. Oxford, UK: IRL Press; 1992:59-88.
40. Huang XQ, Madan A: CAP3: A DNA sequence assembly program. Genome
Research 1999, 9:868-877.
41. Milne I, Bayer M, Cardle L, Shaw P, Stephen G, Wright F, Marshall DF: Tablet
- next generation sequence assembly visualization. Bioinformatics 2010,
26:401-402.
42. Fan JB, Oliphant A, Shen R, Kermani BG, Garcia F, Gunderson KL, Hansen M,
Steemers F, Butler SL, Deloukas P: Highly parallel SNP genotyping. Cold
Spring Harb Symp Quant Biol 2003, 68:69-78.
43. Akhunov E, Nicolet C, Dvorak J: Single nucleotide polymorphism
genotyping in polyploid wheat with the Illumina GoldenGate assay.
Theor Appl Genet 2009, 119:507-17.
44. Rozen S, Skaletsky SJ: Primer3 on the WWW for general users and for
biologist programmers. In Bioinformatics Methods and Protocols: Methods in
Molecular Biology. Edited by: Krawetz S, Misener S. Totowa, NJ: Humana
Press; 2000:365-386.
45. Nei M: Estimation of average heterozygosity and genetic distance from a
small number of individuals. Genetics 1978, 89:583-590.
46. Park SDE: Trypanotolerance in West African Cattle and the Population
Genetic Effects of Selection. University of Dublin; 2001, Ph.D. thesis.
47. Goudet J: FSTAT, a program to estimate and test gene diversities and
fixation indices (version 2.9.3). 2001 [ />softwares/fstat.htm].
48. Genstat: Genstat for Windows Release 12.1. VSN International Ltd, Hemel
Hempstead, Hertfordshire; 2009.
49. Van Ooijen JW, Voorrips RE: JoinMap® 3.0, software for the calculation of
genetic linkage maps. Plant Research International, Wageningen, the
Netherlands; 2001.
50. Staaf J, Vallon-Christersson J, Lindgren D, Juliusson G, Rosenquist R,
Höglund M, Borg A, Ringnér M: (2008) Normalization of Illumina Infinium
whole-genome SNP data improves copy number estimates and allelic
intensity ratios. BMC Bioinformatics
2008, 9:409.
51. Van Ooijen JW: MapQTL® 5, Software for the mapping of quantitative
trait loci in experimental populations. Kyazma B.V., Wageningen,
Netherlands; 2004.
doi:10.1186/1471-2229-11-147
Cite this article as: Russell et al.: Identification, utilisation and mapping
of novel transcriptome-based markers from blackcurrant (Ribes nigrum).
BMC Plant Biology 2011 11:147.
Submit your next manuscript to BioMed Central
and take full advantage of:
• Convenient online submission
• Thorough peer review
• No space constraints or color figure charges
• Immediate publication on acceptance
• Inclusion in PubMed, CAS, Scopus and Google Scholar
• Research which is freely available for redistribution
Submit your manuscript at
www.biomedcentral.com/submit
Russell et al . BMC Plant Biology 2011, 11:147
/>Page 11 of 11