báo cáo khoa học: " Transcript and metabolite analysis in Trincadeira cultivar reveals novel information regarding the dynamics of grape ripening" ppsx
Bạn đang xem bản rút gọn của tài liệu. Xem và tải ngay bản đầy đủ của tài liệu tại đây (2.85 MB, 35 trang )
Transcript and metabolite analysis in Trincadeira
cultivar reveals novel information regarding the
dynamics of grape ripening
Fortes et al.
Fortes et al. BMC Plant Biology 2011, 11:149
(2 November 2011)
RESEARCH ARTICLE Open Access
Transcript and metabolite analysis in Trincadeira
cultivar reveals novel information regarding the
dynamics of grape ripening
Ana M Fortes
1*
, Patricia Agudelo-Romero
1
, Marta S Silva
2
, Kashif Ali
3
, Lisete Sousa
4
, Federica Maltese
3
,
Young H Choi
3
, Jerome Grimplet
5
, José M Martinez- Zapater
5
, Robert Verpoorte
3
and Maria S Pais
1
Abstract
Background: Grapes (Vitis vinifera L.) are economically the most important fruit crop worldwide. However, the
complexity of molecular and biochemical events that lead to the onset of ripening of nonclimacteric fruits is not
fully understood which is further complicated in grapes due to seasonal and cultivar specific variation. The
Portuguese wine variety Trincadeira gives rise to high quality wines but presents extremely irregular berry ripening
among seasons probably due to high susceptibility to abiotic and biotic stresses.
Results: Ripening of Trincadeira grapes was studied taking into account the transcriptional and metabolic
profilings complemented with biochemical data. The mRNA expression profiles of four time points spanning
developmental stages from pea size green berries, through véraison and mature berries (EL 32, EL 34, EL 35 and EL
36) and in two seasons (2007 and 2008) were compared using the Affymetrix GrapeGen
®
genome array containing
23096 probesets corresponding to 18726 unique sequences. Over 50% of these probesets wer e significantly
differentially expressed (1.5 fold) between at least two developmental stages. A common set of modu lated
transcripts corresponding to 5877 unigenes indicates the activation of common pathways between years despite
the irregular development of Trincadeira grapes. These unigenes were assigned to the functional categories of
“metabolism”, “development”, “cellular process”, “diverse/miscellanenous functions”, “regulation overview”, “response
to stimulus, stress”, “signaling”, “transport overview”, “xenopro tein, transposable element” and “unknown”.
Quantitative RT-PCR validated microarrays results being carried out for eight selected genes and five
developmental stages (EL 32, EL 34, EL 35, EL 36 and EL 38). Metabolic profiling using
1
H NMR spectroscopy
associated to two-dimension al techniques showed the importance of metabolites related to oxidative stress
response, amino acid and sugar metabolism as well as secondary metabolism. These results were integrated with
transcriptional profiling obtained using genome array to provide new information regarding the network of events
leading to grape ripening.
Conclusions: Altogether the data obtained provides the most extensive survey obtained so far for gene expression
and metabolites accumulated during grape ripening. Moreover, it highlighted information obtained in a poorly
known variety exhibiting particular characteristics that may be cultivar specific or dependent upon climatic
conditions. Several genes were identified that had not been previously reported in the context of grape ripening
namely genes involved in carbohydrate and amino acid metabolisms as well as in growth regulators; metabolism,
epigenetic factors and signaling pathways. Some of these genes were annotated as receptors, transcription factors,
and kinases and constitute good candidates for functional analysis in order to establish a model for ripening
control of a non-climacteric fruit.
* Correspondence:
1
Plant Systems Biology Lab, Departmento de Biologia Vegetal/ICAT, Center
for Biodiversity, Functional and Integrative Genomics (BioFIG), FCUL, 1749-
016 Lisboa, Portugal
Full list of author information is available at the end of the article
Fortes et al. BMC Plant Biology 2011, 11:149
/>© 2011 Fortes et al; licensee Bi oMed Central Ltd. This is an Open Access article distribute d under the terms of th e Crea tive Common s
Attribution License ( ), which permits unrestricted use, distribution, and reproduction in
any medium, provided the original work is properl y cited.
Background
Grapes (Vitis species) are economically the most impor-
tant fruit crop worldwide with a global production of
around 67 million tons in 2008 (FAOSTAT, 2011).
Moreover, the consumption of table grapes and wine
has numerous nutritional and health benefits for
humans due to antioxidant polyphenols such as resvera-
trol [1]. Grape seeds have significant content of phenolic
compounds such as gallic acid, catechin and epicatechin,
and a wide variety of proanthocyanidins which show sig-
nificant cancer prevention potential [2]. Red wines con-
tain more than 200 polyphenolic compounds that are
thought to act as antioxidants. In particular, resveratrol
exhibits cardioprotective eff ects and anticancer proper-
ties [2].
In traditional wine areas, the production should pre-
sent typicity that is dependent on grapevine variety
among other factors. Therefore, wine improvement is
greatly limited to the natural variability of the cultivars.
In this respect, less known Portuguese and Spanish cul-
tivars offer plenty of choice to develop wines with differ-
ent characteristics that may constitute a competitive
advantage in a demanding global market. Among these
varietiesisthePortugueseTrincadeira which presents
irregular ripening in different seasons and is extremely
sensitive to Botryt is sp, and Plasmopara viticola but
often gives rise to unique wines (Jorge Böhm, Plansel,
personal communication).
In contrast to the well studied climacteric fruits such as
tomato, the process of development and ripening of non-
climacteric fruits such as grapes is less investiga ted.
Grape berry development consists of two successive sig-
moidal growth periods separated by a l ag phase; from
anthesis to ripening it can be divided into three major
phases [3] with more detailed descriptive designations,
known a s the modified E-L s ystem, being used to define
more precise growth stages over the entire grapevine life-
cycle [4]. The first growth period correspond s to the for-
mation of the seed embryos and the pericarp. The first
stage is characterized by exponential growth of the berry,
biosynthesis of tannins and hydroxycinnamic acids, and
accumulation of two organic acids, tartrate and malate.
Tannins are present in skin and seed tissues and nearly
absent in the flesh, and are responsible for the bitter and
astringent properties of red wine. The onset of ripening,
véraison, const itutes a transit ion phase du ring which
growth declines and there is initiation of colour develo p-
ment (anthocyanin accumulation in red grapes) and
berry softening. Ripening (the last phase) is characterized
by an increase in pH, additional berry growth mainly due
to cell expansion and accumulation of soluble sugars,
cations such as potassium and calcium, anthocyanins and
flavour-enhancing compounds.
The many chemical compounds contributing to flavour
(taste and aroma) in wines a re determined in the vine-
yard by factors such as the natural envi ronment, vineyard
management practices, and vine genotypes, among
others. A better understanding of accumulation of sugars
and flavour compounds in the berry is of critical impor-
tance to adjust grape growing practices to market needs.
Increased knowledge of grape ripening will help on estab-
lishing o ptimal grape maturity for harvest which is diffi-
cult to determine due to the tremendous variability in
ripening between berries within a grape cluster. More-
ove r, it will contribute to maintain a sustainabl e produ c-
tion of high quality grapes in a changing environment,
one major challenge for viticulture in this century.
Molecular evidence is lacking for a single master
switch controlling ripening initiation, such as the estab-
lished role for ethylene in climacteric fruit ripeni ng. It is
known that following véraison stage, auxin and cytoki-
nin contents decrease while abscisic acid concentration
increases [5,6]. Abscisic acid, brassinoste roids, and, to a
lesser extent, ethylene, have been implicated in control
of fruit ripening initiation in grapevine but their modes
of action at the molecular level require further clarifica -
tion [7-10]. Moreover, certain growth regulators such as
polyamines have been little studied in the context of
grape ripening.
The availability o f high-throughput analysis methods
andahighqualitydraftofthegrapevinegenome
sequence [11,12], together with studies on transcrip-
tomics [13-16], proteomics [17-19] and metabolic profil-
ing [20] contributed to greatly increase the knowledge on
grape ripening . Moreov er, genetic maps have been devel-
oped enabling the identification of QTLs for important
traits and a consensus map has been built [21].
This work describes the first comprehensive transcrip-
tional and meta bolic analysis of grape ripenin g per-
formed over two seasons (2007 and 2008).
Transcriptional profiling was carried out using the sec-
ond generation of Affymetrix Vitis microarrays (GRAPE-
GEN GenChip) that covers approximately 50% of the
gen ome, and taking into account both genomic annota-
tion based on 12X coverage grapevine genome sequence
assembly and EST homology- based annotation. Infor-
mation regarding the current model of grapes’ ripening
is confirmed and new information is provided that may
be cultivar specific since little is known about this pro-
cess in other Vitis grapevine cultivars.
Results and Discussion
Phenotypic and metabolic characterization of berries
Grape berries were sampled at five developmental stages
according to E-L system [4] during 2007 and 2008
growing seasons, a nd taking into account berry weight,
Fortes et al. BMC Plant Biology 2011, 11:149
/>Page 2 of 34
organic acids, sugars and anthocyanin content (Figures
1, 2). These developmental stages were identified as EL
32 characterized by sm all hard green berries accumulat-
ing organic acids; EL 34 just before véraison character-
ized by green berries, which are starting to soften (this
stage was considered for all analyses only in 2007); EL
35 corresponding to véraison ; EL 36 involving sugar and
anthocyanins accumulation, and active growth due to
cell enlargement; and EL 38 corresponding to harvest
time. The date of véraison was set at approximately 9
weeks post-anthesis in both years. However, berry devel-
opment was very irregular (e.g. berry size) when the two
years are compared probably due to different precipita-
tion patterns (Additional File 1) and genotypic charac-
teristics of Trincadeira. Irregular grape ripening has
been observed for this cultivar in previous years (unpub-
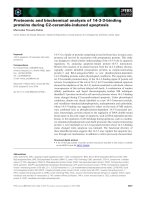
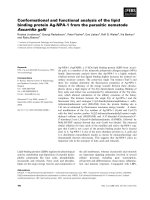
lished). Berry weight was not increased from EL 32 until
EL 36 in 2008. Furthermore, the considerable difference
in anthocyanin content between the two consecutive
years at EL 36 may be mostly due to the fact that ber-
ries growing during the 2008 season did not expand as
in 2007. In fact, berry weight almost doubled in the
later season (Figure 1). Thus, the percentage of skin per
berry was higher in 2008, which might account for an
increase in anthocyanin conte nt. In addition, environ-
mental factors such as water stress may also be involved
[22].
Additional metabolic profiling of Trincadeira grapes
was c arried out using
1
H NMR. Signals at δ 5.39 (d, J =
3.9 Hz), δ 5, 17 (d, J = 3.5 Hz), δ 2.67 (dd, J = 16.0, 7.0
Hz) and δ 2.62 (s) were assigned to be anomeric proton
of glucose moiety of sucrose, anomeric proton of a- and
b-glucose, malic acid and succinic acid, respectively
(Table 1). These chemical shifts were selected for rela-
tive quantification (based on signal integration normal-
ized to internal standard) of these metabolites during
ripening as shown in Figure 2.
Malate and succinate contents decreased sharp ly from
véraison; the same profile was observed for tartaric acid
at δ 4.50 (s), ascorb ic acid at δ 4.59 (d, J = 2.0 Hz), and
citric acid at δ 2.93 (d, J = 16.0 Hz) with malic and tar-
taric acids being the mo st present in grapes (Figure 2,
Additional file 2). To confirm if these and other meta-
bolites were present in significantly different amounts
during ripening we performed Kruskal-Wallis and Wil-
coxon Rank sum tests using spectral intensities at differ-
ent chemical shifts (δ = 0.4-10.0) (see Material and
Methods, Additional File 3).
Berry weight Total Anthocyanin Content
Figure 1 Fresh berry weight (g) and total anthocyanin content expressed as absorbance at 520 nm per g of freeze dried material. Bars
represent standard variation.
Fortes et al. BMC Plant Biology 2011, 11:149
/>Page 3 of 34
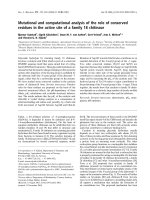
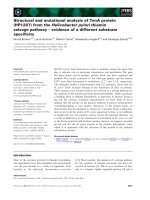
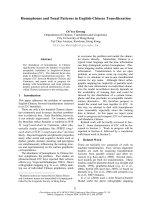
Figure 2 Metabolism of sucrose, glucose, malic acid and succinic acid: gene expressio n and metabolite content. Relative quantification
of sucrose, a-glucose, malic acid and succinic acid is based on characteristic chemical shift (δ 5.39, δ 5, 17, δ 2.67 and δ 2, 62, respectively), and
corresponding peak intensity. Malate and succinate contents are higher at pre-véraison stages peaking at EL 32 whereas contents in sucrose and
a-glucose increase at post-véraison stages reaching maximal levels at EL 38. Expression levels of genes coding for sucrose synthase
(VVTU16744_s_at), sucrose-phosphate synthase 1 (VVTU4280_at), sucrose phosphatase (VVTU21174_s_at), phosphoenolpyruvate carboxylases
(VVTU12208_at, VVTU19092_at), glyoxysomal precursor of malate dehydrogenase (VVTU4095_at), succinate-semialdehyde dehydrogenase
(VVTU35625_s_at) are based on microarray.
Fortes et al. BMC Plant Biology 2011, 11:149
/>Page 4 of 34
Table 1 List of metabolites identified by
1
H NMR and two dimensional NMR experiments.
Metabolite Chemical shift Multiplicity/Coupling constant
cis- Caffeoyl derivative δ 5.91 (d, J = 13.0 Hz)
δ 6.89 (d, J = 8.5 Hz)
δ 6.95 (d, J = 13.0 Hz)
δ 7.56 (d, J = 8.5 Hz)
cis-Coumaroyl derivative δ 5.93 (d, J = 13.0 Hz)
δ 6.83 (d, J = 9.5 Hz)
δ 7.02 (d, J = 13.0 Hz)
δ 7.58 (d, J = 9.5 Hz)
trans-caftaric acid (caffeic acid conjugated with tartaric acid) δ 7.64/δ 7.15 (d, J = 16.0 Hz)/(d, J = 2.0 Hz)
δ 7.07 (dd, J = 8.5 Hz, 2.0 Hz)
δ 6.88 (d, J = 8.5 Hz)
δ 6.38 (d, J = 16.0 Hz)
δ 5.51 (s)
Sucrose δ 5.39 (d, J = 3.9 Hz)
a-Glucose δ 5.17 (d, J = 3.5 Hz)
b-Glucose δ 4.56 (d, J = 7.5 Hz)
Tartaric acid δ 4.50 (s)
Malic acid δ 2.67 (dd, J = 16.0, 7.0)
δ 2.82 (dd, J = 16.0, 4.5)
δ 4.43 (dd, J = 7.0, 4.5)
Choline δ 3.22 (s)
Citric acid δ 2.93 (d, J = 16.0 Hz)
δ 2.76 (d, J = 16.0 Hz)
Succinic acid δ 2.62 (s)
Proline δ 2.35 (m)
δ 3.37 (m)
Glutamate δ 2.44 (td, J = 16.2, 7.5)
δ 2.13 (m)
Acetic acid δ 1.91 (s)
Arginine δ 1.92 (m)
δ 1.72 (m)
Alanine δ 1.48 (d, J = 7.4 Hz)
Threonine δ 1.32 (d, J = 6.5 Hz)
ethyl-b -glucoside δ 1.21 (t, J = 7)
Valine δ 1.06 (d, J = 7.0 Hz)
δ 1.01 (d, J = 7.0 Hz)
Leucine δ 0.96
(d, J = 7.5)
δ 0.98 (d, J = 7.5)
Trace amounts
g-Aminobutyric acid (GABA) δ 1.90 (m)
δ 2.31 (t, J = 7.5)
δ 3.01 (t, J = 7.5)
a-Linolenic acid δ 0.95 (t, J = 7.5)
Trace amounts
Gallic acid δ 7.03 (s)
Trace amounts
Ascorbic acid δ 4.59 (d. J = 2.0 Hz)
Fortes et al. BMC Plant Biology 2011, 11:149
/>Page 5 of 34
These spectral intensities were also used for Multivari-
ate Data Analysis using the unsupervised method of
Principal component analysis (PCA). A good discrimina-
tion was obtained for pre- and post-véraison stages
when the sugar region (δ 3.08-5.48) was removed from
the analysis (Figure 3). Not surprisingly véraison stage
(EL 35) appeared clustered apart from all the other
stages and showed differences between the two seasons
which may be partly due to asynchrony in the onset of
ripening known to occur at this stage. Stages EL 35, EL
36 and EL 38 were separated from EL 32 and EL 34 by
the first principal component accounting for 89.0% of
variance strongly contributed by malate contents.
Véraison stage (EL 35) was separated from colored ber-
ries (EL 36, EL 38) by the second principal component
accounting for 4.63% of variance. The stages of EL 36
and EL 38 were clustered together in this analysis.
In order to overcome the congestion of
1
H NMR spec-
tra mainly due to organic acids and sugars and improve
their resolution two-dimensional techniques were carried
out.
1
H NMR together with 2D J-resolved and COSY
(correlated spectroscopy) techniques are a reliable meth-
odology for recognition of a broad metabolome, detecting
compounds such as amino acids, carbohydrates, organic
acids an d phenolic compounds. Figure 4 shows
1
HNMR
spectra at EL 32 and EL 35 corresponding partly to the
Table 1 List of metabolites identified by
1
H NMR and two dimensional NMR experiments. (Continued)
Syringic acid δ 3.89 (s)
δ 7.31 (s)
Trace amounts
Vanillic acid δ 6.77/δ 7.22 (d, J = 8.2)/(m)
Methionine δ 2.15 (s)
δ 2.65 (t, J = 8.0)
A wide range of metabolites is present which includes amino and organic acids (resonances observed in the region of δ 0.80 to 4.00) together with sugars (δ
4.00 to 5.50) and phenolic compounds (δ 5.50 to 8.50).
PC1
(
89.0 %
)
P
C
2 (4.63%)
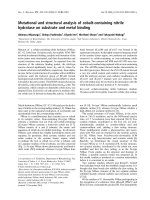
Figure 3 Score plot of PCA showing metabolic discriminat ion of devel opmental stage s (EL 32, 34, 35, 36 and 38) corresponding to
seasons of 2007 and 2008. Spectral intensities were scaled to total intensity and reduced to integrated regions of equal width (0.04 ppm). The
ellipse represents the Hotelling T2 with 95% confidence in score plots. Sugar region (δ 3.08-5.48) was removed from the analysis due to bias
created by high concentration of sugar compounds.
Fortes et al. BMC Plant Biology 2011, 11:149
/>Page 6 of 34
aromatic region (δ 5.7-9.0), and showing the decre ase in
cis-coumaroyl derivatives and trans-caftaric acid (caffeic
acid conjugated with tartaric acid) when approaching vér-
aison. Identification of these and other compounds was
based also on correlation among specific signals given by
1
H-
1
H correlated spectroscopy (COSY) spectra (Addi-
tional File 4) and hetero nuclear multiple bonds coher-
ence (HMBC) spec tra. While these phenylpropanoids
compounds decreased during ripening together with sev-
eral organic acids and glutamate, contents in vanillic
acid, ethyl-beta-glucoside, acetic acid, val ine, proline, and
g-amino butyric acid (GABA) were increased in post-vér-
aison stages (Additional File 3, for correspondent chemi-
cal shifts see Table 1).
To further characterize the metabolome of grapes dur-
ing ripening quantification of total glutathione content
was performed (Figure 5). This antioxidant compound is
a good indicator of oxidative stress present in cells. The
results clearly show a s ignificant increase in glutathione
at véraison and ripe stages comparing to g reen stages
followed by a decrease at harvest stage. Previously, the
content in glutathione was shown to increase during
grape ripening with 90% being reduced [23] which may
indicate an active ascorbate-glutathione cycle.
In order to gather more insights into carbohydrate
metabolism, starch con tent was evaluated in grape sec-
tions stained with Lugol solution. In green berries well
developed amyloplasts can be observed (Figures 6A, B,
C). The number of amyloplasts is reduced at véraiso n
(Figure 6D) and decreased content in this polysaccharide
was observed during ripening (Figures 6E, F). Interest-
ingly, druses crystals were observed at ripe stages. These
structures usually made of calcium oxalate have been
previously found in leaves o f Vitis vinifera and may
result from degradation of ascorbic acid in mature
grapes [24].
Microarray and cluster analysis and functional
categorization of Unigenes
The mRNA expression profiles of four time points (EL
32, EL 34, EL 35 and EL 36) and two seasons (2007 and
2008) were compared using the Affymetrix GrapeGen
®
GeneChip genome array containing 23096 probesets
correspondin g to 18726 uni que sequences. Testing was
performed using biological triplicates for each time
point and datasets from each season were analyzed
separately. The quality of the replicates which was
checked using Pearson’s correlation was very good and
ranged between 0.981% and 0.997%. After performing a
Bayes t-statistics from the linear models for microarray
data (limma) for differential expression analysis [25], P-
values were correcte d for multiple-testing using the
Benjamini-Hochberg’s method [26]. The total number of
probesets that were differentially expressed (fold change
≥ 1.5 and FDR < 0.05 or fold change ≤ 1.5 and FDR <
0.05.) was 11759 corresponding to 50.91% of the total
Figure 4 1H NMR spectra at EL 32 and EL 35 showing decrease in contents of trans-caftaric acid (*) and cis-Coumaroyl derivatives (#)
at the onset of ripening.
Fortes et al. BMC Plant Biology 2011, 11:149
/>Page 7 of 34
Figure 6 Starch content evaluated by Lugol staining in pulp cells. A, B and C correspond to green berries (EL 32, EL 34); D corresponds to
véraison; E, F correspond to ripe berries (EL 36). In green berries well developed amyloplasts were noticed. In ripe berries (E) druses were
observed along with decreased content in starch (E, F).
ȝg glutathione/ g freeze dried material
Figure 5 Total glutathione content expressed in μg per g of freeze dried material. A spectrofotometric assay was used to measure both
oxidized and reduced forms of glutathione [125].
Fortes et al. BMC Plant Biology 2011, 11:149
/>Page 8 of 34
probesets represented in the chip. Out of these 7130
probesets were differentially expressed at EL 35 and/or
EL 36 in both seasons (Table 2, Additional file 5). This
common set of modulated transcripts corresponding to
5877 unigenes indicates the activat ion of common path-
ways between years despite the irregular development of
Trincadei ra grapes. Neverth eless, 2284 and 2345 probe-
sets were differentially expressed only in 2007 and 2008,
respectively (Additional file 6). Though the total number
of differentially expressed probesets and genes was simi-
lar in both seasons in 2008 the amount of genes up-
regulated at EL 35 and EL 36 was higher than the
amount of genes down-regulated; the opposite was
observed in 2007 (Additional file 6). This difference
between the two sets likely reflects inter-seasonal biolo-
gical differences.
Functional annotations have been assigned to the
majority of probesets though 32.79% of the core set of
7130 genes had matches to genes with unknown func-
tions (Figure 7). The assignment to functional categories
was performed assigning each gene to a category
according to its putative molecular function. Nine cate-
gories beside the genes with unknown function were
represented during berry development in the regulated
gene core set. These were “metabolism”, “developm ent”,
“ cellular process” , “ diverse/miscellaneou s functions” ,
“ regulation overview” , “ response to stimulus, stress” ,
“ signaling” , “ trans port overview” ,and“ xenoprotein,
transposable element”. The number of modulated pro-
besets related to met abo lism was similar to the number
of those having unknown function (2343 and 2338,
respectively). Two functi onal categories were not repre-
sented in the gene core set but in the chip namely “Cel-
lular response overview” ,and“ Xenoprotein, viral
protein”. This later one was represented in the set of
genes modulated in only one season (Additional file 6).
Cluster analysis of the gene core set was based on the
k-means method using Pearson’s correlation distance
calculated on the gene expression profiles obtained for
EL 32, EL 35 and EL 36 in b oth years. Probesets were
clustered into eight groups representing the minimum
number of profiles that can be obtained with 3 time
points (Figure 8).
We did not observe a good agreement between clus-
tering in the gene core set from the 7130 probesets that
were differentially expressed at EL 35 and/or EL 36 in
2007 and 2008 since only 3451 of the transcripts
(48,40%) fell in the same cluster in both seaso ns (Addi-
tional file 5). Among the 3451 probesets that showed a
conserved profile in the two seasons, we identified clus-
ters 1 and 8 as the most populated ones. These cl usters
correspond to transcripts that were positively modulated
after véraison (885) and at véraison and ripe stage (786),
respectively. Cluster 7 (250) and cluster 3 (147) indicate
genes showing a peak of expression at véraison with the
latter representing genes also down-regulated at EL 36.
Cluster 5 (400) and cluster 6 (467) represent genes
repressed at EL 35 and EL 36, though the latter repre-
sent genes showing also a gradual decrease in expres-
sion from EL 35 to EL 36. Cluster 4 (445) accounts for
genes being repressed at EL 36 and cluster 2 (71) repre-
sent genes showing the lowest level of expression at
véraison.
Clusters 1 and 8 shows enrichment in genes annotated
as involved in regulation of gene expression indicating
the complexity of transcriptional regulation during berry
ripening. On the other hand, clusters 4 and 6 indicate
that following véraison there is an increase in genes
down-regulated in volved in transport mechanisms.
When we compare clusters 2 and 7 we can conclude
that in the latter there are less genes involved in primary
metabolism and transport overview, and more genes
involved in secondary metabolism and hormone signal-
ing (Additional file 5). The results indicate that véraison
is a s tage of active metabolism of aminoacid, carbohy-
drate and lipids together with their transport as well as
water transport mediated by aquaporins.
Clusters 5 and 6 have increased number of genes
annotated as involved in cellular component organiza-
tion and biogenesis due to high cellular pre- véraiso n
activity and suggesting cellular reprogramming at the
onset of véraison.
Analysis of gene expression during grape berry ripening
Carbohydrate metabolism
Berries start to accumulate after véraison the carbohy-
drates produced during photosynthesis and imported
from the leaves.
In Trincadeira berries sucrose concentrations
increased throughout berry development though glucose
content was higher (Figure 2). This is in contrast with
the results obtained for Cabernet Sauvignon during
which sucrose content remained relatively constant [15].
Transcript abundance o f genes encoding enzymes
involved in sucrose biosynthesis was higher at EL 36
(Figure 2, Table 2), namely sucrose-phosphate synthase
1 (VVTU4280_at, cluster 8) and sucrose phosphatase
(VVTU21174_s_at, cluster 8). This last enzyme catalyzes
the final step in the pathwa y of sucrose synthesis. Other
authors [16] also mentioned up-regulation of genes cod-
ing for sucrose-phosphate synthase and sucrose- 6-phos-
phate phosphatase in ripe Pinot Noir berries but did not
quantify sucrose.
An interesting feature is that both studies on Cabernet
Sauvignon and Pinot Noir showed up-regulation of
genes encoding sucrose synthase whereas in Trincadeira
this gene is down-regulated (VVTU16744_s_at) consis-
tent with an increase in sucrose levels.
Fortes et al. BMC Plant Biology 2011, 11:149
/>Page 9 of 34
Table 2 Selection of genes differentially expressed during ripening.
Probe ID 2007
34vs32
2007
35vs32
2007
36vs32
2008
35vs32
2008
36vs32
Unique gene 12×
ID
Annotation
CARBOHYDRATE AND AMINO ACID METABOLISMS
VVTU1012_at . . 1.77 . 1.61 GSVIVT01033747001 Pyruvate kinase, cytosolic isozyme
VVTU1135_at 3.64 3.82 5.69 2.07 2.77 GSVIVT01012723001 Soluble starch synthase 3, chloroplast precursor
VVTU12019_s_at . 4.57 5.37 2.3 4.07 GSVIVT01022356001 Aldehyde dehydrogenase
VVTU12208_at . -4 -9.68 -2.33 -8.28 GSVIVT01011979001 Phosphoenolpyruvate carboxylase
VVTU12879_at . 2.73 2.19 2.78 2.37 GSVIVT01024263001 RCP1 (ROOT CAP 1)
VVTU16699_s_at . -7.79 -20.35 -2.1 -12.01 GSVIVT01024174001 Fructose-bisphosphate aldolase, chloroplast
precursor
VVTU16744_s_at -1.62 -1.72 -1.82 . -2.66 GSVIVT01015018001 Sucrose synthase
VVTU17960_s_at . . 1.59 . 1.72 GSVIVT01033791001 Fructose-bisphosphate aldolase cytoplasmic
isozyme
VVTU1903_at . . -2.26 . -1.67 GSVIVT01016173001 Malate dehydrogenase [NADP], chloroplast
precursor (NADP-MDH)
VVTU1967_s_at . 1.54 1.94 1.84 2.09 GSVIVT01014206001 Phosphoenolpyruvate carboxylase
VVTU2658_at . . 1.5 1.54 1.58 GSVIVT01011700001 Phosphoglucomutase, cytoplasmic
VVTU4210_at 4.86 12.95 23.65 7.73 14.17 GSVIVT01033062001 Alcohol dehydrogenase
VVTU4280_at 3.26 10 13.91 7.05 12.89 GSVIVT01037186001 Sucrose-phosphate synthase 1
VVTU5246_at . . 2.14 . 1.86 GSVIVT01006474001 Malate dehydrogenase glyoxysomal
VVTU5612_at . -1.85 -4.85 . -3.3 GSVIVT01013403001 Glyceraldehyde-3-phosphate dehydrogenase B,
chloroplast precursor
VVTU7116_at . 1.82 2.38 1.81 2.19 GSVIVT01008714001 Alpha-amylase/1,4-alpha-D-glucan
glucanohydrolase
VVTU8170_at . -2.21 -4.09 -1.76 -2.67 GSVIVT01032446001 Glycogen synthase kinase 3 beta
VVTU9506_at 1.54 2.57 1.65 2.66 . GSVIVT01004839001 Snf1-related protein kinase srk2f
VVTU11854_s_at . 1.79 1.82 1.51 2.08 GSVIVT01000391001 Glutamate decarboxylase 1 (GAD 1)
VVTU13950_s_at -1.61 -4.55 -28.07 -2.79 -25.73 GSVIVT01033402001 Glutamate dehydrogenase 1
VVTU14998_at . . 4.38 . 2.72 GSVIVT01034731001 Gamma-aminobutyric acid transporter
VVTU22880_s_at . 1.64 2.02 1.85 3.24 GSVIVT01016467001 Pyrroline-5-carboxylate synthetase
VVTU35297_s_at . . 1.55 . 1.7 GSVIVT01036689001 Isocitrate dehydrogenase, chloroplast precursor
VVTU35625_s_at . -2.57 -5.34 . -2.93 GSVIVT01036719001 Succinate-semialdehyde dehydrogenase (SSADH1)
VVTU37879_s_at . -2.09 . . . GSVIVT01038714001 GLT1 (NADH-dependent glutamate synthase 1
gene)
VVTU5646_at . 3.17 3.09 2.18 3.15 GSVIVT01016390001 Proline transporter 1 (ProT1)
VVTU7588_at . -2.81 . -1.73 -1.85 GSVIVT01036483001 Proline oxidase
VVTU977_at . . 1.68 . 1.68 GSVIVT01033607001 Cystathionine beta-lyase
STRESS RESPONSE
VVTU12535_s_at . . 5.35 . 4.41 GSVIVT01027990001 Glutathione-conjugate transporter (MRP10)
VVTU14104_s_at . . 1.73 . 2.13 GSVIVT01033815001 Monodehydroascorbate reductase
VVTU15985_at . . 1.59 . . GSVIVT01025104001 L-ascorbate peroxidase 1, cytosolic (APX1)
VVTU16784_s_at . 2.43 3.15 2.94 4.68 GSVIVT01019766001 Phospholipid hydroperoxide glutathione
peroxidase
VVTU1974_s_at . 52.07 88.22 11.76 189.67 GSVIVT01035256001 Glutathione S-transferase 26 GSTF12
VVTU23718_at . 2.05 . 1.74 2.42 GSVIVT01037479001 L-ascorbate oxidase
VVTU27380_s_at . -1.71 -2.42 . -2.27 GSVIVT01021793001 GDP-mannose 3,5-epimerase 1
VVTU35602_s_at -1.74 . -4 . -1.69 GSVIVT01025551001 L-ascorbate peroxidase 1, cytosolic (APX1)
VVTU38305_s_at . 3.59 1.63 2.34 2.53 GSVIVT01003998001 Latex cyanogenic beta glucosidase
VVTU40144_at . . . 1.62 . . Dehydroascorbate reductase
VVTU40443_s_at 1.94 1.63 1.97 1.83 2.12 GSVIVT01026951001 Beta-cyanoalanine synthase
Fortes et al. BMC Plant Biology 2011, 11:149
/>Page 10 of 34
Table 2 Selection of genes differentially expressed during ripening. (Continued)
VVTU4641_at . -2.92 -15.77 -1.58 -8.94 GSVIVT01009079001 L-ascorbate peroxidase, chloroplast
VVTU4643_at . . . -2.03 -2.51 GSVIVT01010646001 L-idonate dehydrogenase
VVTU4990_at . 2.11 1.97 3.08 2.44 GSVIVT01019757001 Gamma-glutamylcysteine synthetase
VVTU5671_s_at -2.05 -2.59 -2.86 . . GSVIVT01005966001 Dehydroascorbate reductase
VVTU6270_at . 1.55 2.08 . 1.85 GSVIVT01011626001 Myrosinase precursor
VVTU687_at . 145.08 240.58 71.81 373.26 GSVIVT01022752001 Anthraniloyal-CoA: methanol anthraniloyal
transferase
VVTU7379_at . 2 1.6 3.1 2.47 GSVIVT01029079001 Glutathione reductase
VVTU8069_at . . -3.45 . -2.58 GSVIVT01033574001 L-Galactono-1,4-lactone dehydrogenase
SECONDARY METABOLISM
VVTU13083_at . -15.92 -10.95 -7.51 -7.09 GSVIVT01006396001 Anthocyanidin reductase
VVTU13266_s_at -3.1 -5.11 -3.57 -4.5 -2.72 GSVIVT01009731001 Isoflavone reductase protein 4
VVTU13618_x_at 3.48 2.48 . 2.75 . GSVIVT01028812001 UDP-glucose: anthocyanidin 5,3-O-
glucosyltransferase
VVTU13951_at . . 3.24 . 1.79 GSVIVT01022411001 Isoflavone reductase
VVTU17578_s_at . 12.13 14.82 5.19 29.13 GSVIVT01024419001 UDP-glucose:flavonoid 3-O-glucosyltransferase
VVTU20756_at -3.14 -3.56 -4.09 -2.73 -3.17 GSVIVT01023841001 Dihydroflavonol-4-reductase
VVTU22627_at 2.1GSVIVT01000191001 CYP81E1 Isoflavone 2’-hydroxylase
VVTU39787_s_at . -2.43 . -2.3 4.3 GSVIVT01018781001 Flavonone- 3-hydroxylase
VVTU9453_at . . 7.92 1.87 4.75 GSVIVT01019691001 Quercetin 3-O-methyltransferase 1
VVTU9714_at 3.43 4.02 5.02 2.81 3.82 GSVIVT01021355001 Flavonol synthase
VVTU11849_s_at . 2.15 3.41 1.5 2.64 GSVIVT01026510001 Alcohol dehydrogenase 6
VVTU13316_s_at . . . -2.21 . GSVIVT01036331001 (-)-Germacrene D synthase
VVTU21725_at . 5.59 7.3 7.18 9.32 GSVIVT01026829001 (+)-Neomenthol dehydrogenase
VVTU2626_at 2.55 35.87 19.1 18.1 15.87 GSVIVT01008069001 Isopiperitenol dehydrogenase
VVTU27826_x_at . 2.5 2.18 1.55 2.01 GSVIVT01003150001 Cinnamyl alcohol dehydrogenase
VVTU33502_at 2.75 . -2.96 . -3.52 GSVIVT01032178001 Cinnamyl alcohol dehydrogenase
VVTU37595_s_at . 2.08 . 1.86 . GSVIVT01030474001 Hydroperoxide lyase (HPL1)
VVTU4754_at -1.64 -4.03 -6.42 -4.25 -7.87 GSVIVT01008854001 Caffeic acid methyltransferase
VVTU8254_at . 4.4 7.29 2.5 2.95 GSVIVT01036862001 9-cis-epoxycarotenoid dioxygenase
METABOLISM AND SIGNALING OF GROWTH REGULATORS
VVTU1335_at 1.65 -6.21 -7.81 -3.38 -6.13 GSVIVT01000176001 Indole-3-acetic acid-amido synthetase GH3.2
VVTU16083_at . . -2.96 . -2.18 GSVIVT01030905001 Auxin efflux carrier family
VVTU16124_at . . -2.05 -1.82 -2.87 GSVIVT01031663001 PIN1
VVTU1813_at -3.17 -12.35 -48.38 -4.69 -33.36 GSVIVT01017046001 IAA9
VVTU18738_s_at . 14.93 37.41 22.78 87.35 GSVIVT01038622001 Auxin-responsive SAUR29
VVTU2445_s_at -2.2 -13.15 -17.4 -6.43 -9.33 GSVIVT01015350001 Auxin-responsive protein IAA27
VVTU2614_s_at . 2.08 1.68 1.5 1.79 GSVIVT01033011001 Transport inhibitor response 1 protein
VVTU3361_at 3.34 9.44 9.88 6.46 9.06 GSVIVT01017158001 IAA19
VVTU35572_s_at 2.81 2.25 4.41 3.04 8.58 GSVIVT01020159001 IAA-amino acid hydrolase 1 (ILR1)
VVTU3560_at -1.83 . 2.93 . 3.86 GSVIVT01037892001 Indole-3-acetic acid-amido synthetase GH3.8
VVTU35909_s_at . -2.42 . -2.25 -1.69 GSVIVT01026429001 Auxin Efflux Carrier
VVTU38338_x_at -1.59 -11.61 -14.02 -9.85 -22.64 GSVIVT01024135001 Auxin-responsive SAUR31
VVTU7869_at -5.63 -6.03 -10.54 -6.2 -4.14 GSVIVT01010995001 Transport inhibitor response 1
VVTU12042_at 1.76 . . . . GSVIVT01005455001 1-Aminocyclopropane-1-carboxylate synthase
VVTU12870_s_at . . 1.83 . 2.14 GSVIVT01025105001 MAPK (MPK3)
VVTU13344_at . -1.68 -2.66 . -4.88 GSVIVT01006065001 1-Aminocyclopropane-1-carboxylate oxidase 1
VVTU1588_at . . 1.62 . 1.99 GSVIVT01038085001 Ethylene receptor 1 (ETR1)
Fortes et al. BMC Plant Biology 2011, 11:149
/>Page 11 of 34
Table 2 Selection of genes differentially expressed during ripening. (Continued)
VVTU18607_s_at 3.66 29.17 28.93 14.04 40.01 GSVIVT01035911001 Ethylene-responsive transcription factor ERF003
VVTU19389_s_at . . 1.73 . 2.05 GSVIVT01036213001 Ethylene receptor (EIN4)
VVTU2683_s_at . -1.8 . -2.23 . GSVIVT01035856001 EIN3-binding F-box protein 2
VVTU35437_at . -1.58 -5.17 2.26 2.62 . Ethylene-responsive transcription factor ERF105
VVTU5165_at . -2.11 -1.79 . -1.57 GSVIVT01008900001 1-Aminocyclopropane-1-carboxylate synthase
VVTU5909_at . 1.9 1.59 1.87 1.62 GSVIVT01011670001 1-Aminocyclopropane-1-carboxylate oxidase
VVTU8172_at . . 2.31 2.76 12.06 GSVIVT01004798001 Ethylene responsive element binding factor 1
VVTU8555_at . -3.58 -4.58 -2.09 -5.28 GSVIVT01037473001 Ethylene-insensitive 3 (EIN3)
VVTU11913_at -2.04 -5.96 -11.68 -3.88 -16.02 GSVIVT01018733001 Jasmonate O-methyltransferase
VVTU16057_at . 9.26 10.63 5.74 7.16 GSVIVT01009616001 Allene oxide synthase
VVTU1657_s_at -2.04 . -2.45 -2.41 -2.7 GSVIVT01005061001 Methyl jasmonate esterase
VVTU16654_at 1.58 2.35 1.62 1.89 1.77 GSVIVT01031706001 IMP dehydrogenase
VVTU17030_s_at . -11.17 -8.28 . -4.33 GSVIVT01025923001 12-Oxophytodienoate reductase 2
VVTU23697_at . 1.6 2.16 1.99 2.72 GSVIVT01016368001 Coronatine-insensitive protein 1
VVTU3032_at 1.67 GSVIVT01027057001 JAR1-like protein
VVTU34392_at 2.43 . . . . GSVIVT01013156001 MYC jasmonic acid 3
VVTU35149_at . -1.72 . -1.55 . GSVIVT01024198001 Enhanced disease susceptibility 5 EDS5
VVTU39811_s_at . 2.76 50.75 . 38.44 GSVIVT01021514001 Jasmonate ZIM domain-containing protein 8
VVTU4273_s_at -1.53 . -1.58 . -1.98 GSVIVT01008453001 Jasmonate ZIM domain-containing protein 3
VVTU7003_at -2.47 -12.82 -13.47 -6.21 -13.03 GSVIVT01036445001 Allene oxide cyclase
VVTU7560_at . . 2.04 1.65 2.99 GSVIVT01015181001 Regulatory protein NPR1 (Nonexpresser of PR
genes 1)
VVTU1269_s_at . 1.52 . 1.56 . GSVIVT01020222001 Spermidine synthase
VVTU12839_at . 1.64 2.39 3.44 4.27 GSVIVT01024167001 Arginine decarboxylase (Fragment)
VVTU12964_s_at 1.88 . 1.81 1.8 2.66 . S-Adenosylmethionine decarboxylase proenzyme
VVTU37047_at . . 1.87 . 3.11 GSVIVT01007669001 Copper amine oxidase
VVTU5224_at . . 2.17 . 1.51 GSVIVT01028700001 Spermine synthase
VVTU5226_at . 2.19 1.76 1.69 2.42 GSVIVT01020812001 Amine oxidase
VVTU6472_at -2.27 2.07 . 1.86 2.07 GSVIVT01004079001 Copper amine oxidase
VVTU8738_s_at . 2.3 2.17 . . GSVIVT01033651001 S-Adenosylmethionine synthetase
VVTU12347_s_at . . . 2.03 . GSVIVT01009074001 SnRK2-8
VVTU19049_s_at . . 2.01 . 1.95 GSVIVT01037491001 UBP1 interacting protein 2a (UBA2a)
VVTU22232_at . -1.91 -2.11 . . GSVIVT01003554001 Snf1 protein kinase 2-3 akip ost1
VVTU28731_s_at 2.01 4.9 4.9 4.67 3.13 GSVIVT01015308001 ABI1 (ABA insensitive 1)
VVTU14956_at 2.22 1.89 1.75 1.8 1.55 GSVIVT01008164001 BIM1 (BES1-interacting Myc-like protein 1)
VVTU24849_at . -1.92 -1.91 -3.07 -4.02 GSVIVT01017237001 CYP734A7 castasterone 26-hydroxylase
VVTU4905_s_at . . -2.3 -2.41 -2.1 . Brassinosteroid-responsive ring-H2 (BRH1)
VVTU647_at . -12.51 -17.26 -3.26 -21.67 GSVIVT01036558001 Brassinosteroid-6-oxidase
VVTU20270_s_at -1.93 . 3.68 . 7.79 GSVIVT01033610001 ARR3 typeA
VVTU28950_s_at . -4.38 -11.11 -1.85 -3.95 GSVIVT01004944001 Cytokinin-repressed protein CR9
VVTU31519_s_at 3.4 . . 1.6 . GSVIVT01027443001 Pseudo-response regulator 9 (APRR9)
VVTU9094_s_at . -5.82 -7.62 -5.17 -14.3 GSVIVT01035468001 Cytokinin dehydrogenase 7
VVTU9297_at -2.85 -8.33 -6.37 -3.83 -3.2 GSVIVT01007835001 ARR6 typeA
VVTU9337_at 2.81 2.61 4.69 1.92 6.66 GSVIVT01035051001 ARR1 typeB
VVTU13918_at . 10.7 40.6 27.15 38.26 GSVIVT01031830001 Gibberellin 20 oxidase 2
VVTU15195_at . -1.59 4.64 . 2.89 GSVIVT01022014001 Gibberellin receptor GID1L1
VVTU1752_at 3.79 12.25 12.84 4.95 4.98 GSVIVT01011037001 Gibberellin receptor GID1L2
VVTU7332_at -2.92 -6.26 -6.69 -4.5 -7.87 GSVIVT01009099001 Gibberellin 20 oxidase 2
Fortes et al. BMC Plant Biology 2011, 11:149
/>Page 12 of 34
Table 2 Selection of genes differentially expressed during ripening. (Continued)
VVTU8591_at . -4.73 -4.46 -4.09 -5.78 GSVIVT01034945001 Gibberellin 2-oxidase
SIGNAL TRANSDUCTION
VVTU11835_at . 1.55 . 1.76 1.62 GSVIVT01018839001 MADS box transcription factor TM6 (TM6)
APETALA3
VVTU17564_s_at . 8.95 11.56 4.78 18.34 GSVIVT01022664001 Myb VvMYBA3 [Vitis vinifera]
VVTU18199_s_at . . 1.62 1.76 1.85 GSVIVT01033067001 SEPALLATA3
VVTU2522_at . 1.56 2.63 . 3.24 GSVIVT01016175001 NAC domain-containing protein 78
VVTU27392_s_at . 3.53 4.76 2.16 3.94 . Scarecrow-like transcription factor 8 (SCL8)
VVTU3046_s_at . -6.64 -5.33 -2.63 -3.25 GSVIVT01027182001 MYBPA1 protein [Vitis vinifera]
VVTU3183_at . 2.05 . 1.54 . GSVIVT01024921001 Zinc finger (C3HC4-type RING finger)
VVTU3258_at -1.75 -126.42 -210.41 -28.95 -221.25 GSVIVT01037819001 LIM domain protein WLIM1
VVTU37071_at 2.06 GSVIVT01034155001 Scarecrow-like transcription factor 9 (SCL9)
VVTU40803_s_at 2.35 4.93 9.8 1.54 6.18 GSVIVT01034968001 WRKY DNA-binding protein 48
VVTU9543_at . 2.12 8.24 1.77 8.89 GSVIVT01022269001 Myb TKI1 (TSL-KINASE INTERACTING PROTEIN 1)
VVTU11578_at 1.6 12.25 4.66 2.82 1.77 GSVIVT01008070001 Receptor protein kinase
VVTU11917_at 2.55 1.53 . 2.18 . GSVIVT01019481001 BZip transcription factor G-BOX BINDING FACTOR
3
VVTU13369_at . 1.85 . 1.97 . GSVIVT01017690001 CBL-interacting protein kinase 1 (CIPK1)
VVTU2538_at . 1.68 . 1.83 1.5 GSVIVT01033306001 CALCIUM-DEPENDENT PROTEIN KINASE 32 CPK32
VVTU26057_at . 5.13 12.44 8.86 17.28 GSVIVT01016073001 STE20/SPS1 proline-alanine-rich protein kinase
VVTU27362_at 1.53 1.74 2.13 2.55 5.29 GSVIVT01034540001 bZIP transcription factor
VVTU3691_at . 3.73 . 1.6 . GSVIVT01010053001 Dof zinc finger protein DOF3.5
VVTU38545_at . 1.76 3.18 . 3.59 GSVIVT01008327001 Wall-associated kinase 4
VVTU5563_at . 2.6 3.52 2.09 2.53 GSVIVT01034897001 VirE2-interacting protein (VIP1)
VVTU8084_at . . 2.1 . 2.62 GSVIVT01036465001 Receptor protein kinase PERK1
VVTU9535_at . 2.78 4.54 3.85 4.3 GSVIVT01002864001 Receptor protein kinase PERK1
VVTU9861_at . 1.92 2.09 1.85 2.19 . Wall-associated kinase
LIGHT SIGNALING, CIRCADIAN CLOCK, EPIGENETIC FACTORS AND TRANSPOSONS
VVTU22197_at . . 1.95 1.52 1.79 GSVIVT01007965001 Timing of CAB expression 1 protein
VVTU2284_at . 1.76 4.05 . 3.36 GSVIVT01035337001 Early flowering 3
VVTU2454_s_at 2.4 . 1.77 3.04 2.15 GSVIVT01001405001 Gigantea protein
VVTU3515_s_at -1.65 -1.58 -1.74 -1.89 -2.32 GSVIVT01027456001 Myb CCA1 (Circadian Clock Associated 1)
VVTU40867_x_at . 2.19 . 2.47 2.44 GSVIVT01018044001 ELIP1 (Early Light-Inducible Protein)
VVTU5883_at . -1.59 . 2.17 2.7 GSVIVT01030081001 Phytochrome defective C (PHYC)
VVTU10989_at -2.75 1.77 . -2.1 1.55 GSVIVT01033746001 Retrotransposon protein, Ty1-copia subclass
VVTU11309_at . -1.72 -2.05 . . GSVIVT01032746001 Chromatin remodeling 42
VVTU12696_at . 2.96 2.08 2.38 1.99 GSVIVT01033971001 Transposon protein, CACTA, En/Spm sub-class
VVTU15783_at . . 2.05 . 2.48 . Retrotransposon protein, unclassified
VVTU2258_at 2.29 7.14 2.59 1.77 2.61 GSVIVT01010060001 DNA-3-methyladenine glycosidase I
VVTU32711_at . . . 2.38 . GSVIVT01017791001 Chromatin-remodeling protein 11
VVTU3690_at 1.53 2.15 3.56 2.05 3.61 GSVIVT01007671001 Histone deacetylase HDA6
VVTU38460_at . . . 2.68 2.01 GSVIVT01026952001 ATBRM/CHR2 (Arabidopsis thaliana brahma)
VVTU5491_at . . 2.27 . 2.08 . Transposase
VVTU5815_at . . 1.64 . 1.68 GSVIVT01020136001 Histone deacetylase complex, SIN3 component
VVTU6149_s_at . 2.09 -1.85 1.54 . GSVIVT01033869001 Transposon protein, Mutator sub-class
VVTU8524_at -1.64 -1.75 -2.04 . -1.57 . Cytosine methyltransferase (DRM2)
VVTU8618_at . . 2.12 . 2.34 GSVIVT01007544001 Histone acetyltransferase ELP3
VVTU87_at . . -2.41 . -1.74 GSVIVT01007870001 Histone deacetylase HDA05
The selection consider ed a fold change ≥ 1.5 and FDR < 0.05 or fold change ≤ 1.5 and FDR < 0.05).
Fortes et al. BMC Plant Biology 2011, 11:149
/>Page 13 of 34
Plastids of ripening berries have an active and com-
plex starch metabolism. Lugol staining showed
decreased levels of starch in mesocarp cells at EL 35
and EL 36 as previously described [15] and consistent
with increased transcript abundance of Unigenes
involved in starch degradation and coding for alpha-
glucan phosphorylase, H isozyme (VVTU6785_s_at,
cluster 7), beta-amylase (VVTU15830_s_at), isoamy-
lase isoform 3 (VVTU5803_s_at, cluster 8), and
alpha-amylase (VVTU7116_at, cluster 8). Moreover,
transcripts encoding fructokinases (VVTU2588_s_at,
VVTU4521_at), which catalyzes the formation of
fructose-6-phosphate and may regulate starch forma-
tion, were down-regulated. Alpha-amylase is an
enzyme which aids in the breakdown of starch to
maltose, a compound that can act as an osmoprotec-
tant [27]. It should be noted the up-regulation at EL
35 and EL 36 of a RCP1 (ROOT CAP 1) gene
(VVTU12879_at, cluster 7) putatively coding for a
Maltose transporter based on homology with ESTs
(Additional files 5, 6).
Though starch content decreases in berries at EL 35
and EL 36 (Figure 6), genes putatively involved in synth-
esis of starch such as coding for Starch synthase 1 and
3, chloroplast precursors (VVTU23087_s_at, cluster 8,
VVTU1135_at, cluster 8) and ADP-glucose pyropho-
sphorylase large subunit 2 (VVTU17473_at, cluster 8)
were up-regulated during ripening while other genes
putatively coding for isoenzymes were down-regulated
(VVTU11416_at, cluster 6; VVTU12614_at, cluster 3,
Additional file 5). The up-regulation of a gene coding
for starch synthase was also observed for ripening of
Cabernet Sauvigon grapes [15]. In fact, the control of
activity of starch synthesis and degradation enzymes is
complex in sto rage organs such as fr uits. Different
starch degradation pathways may be specific to early
development and not active in late development [28].
Sucrose Non Fermenting 1 (SNF1)-related kinase and
hexokinase are involved in sugar signaling pathways
modulating post-translational redox activation of ADP-
Glc pyrophosphorylase [29]. We report here the putative
involvement of this sugar-inducible protein kinase in the
Figure 7 Functional categories distribution in the core set of the 7130 modulated genes and in the entire GrapeGen Chip
®
.
Fortes et al. BMC Plant Biology 2011, 11:149
/>Page 14 of 34
onset of grape ripening. In fact, a gene coding for a
SNF1-RELATED P ROTEIN KINASE S RK2F
(VVTU9506_at, cluster 7) pu tatively involved in hyper-
osmotic response [30] was up-regulated only at EL 35
(véraison). In plants , SNF1 [ sucrose non-fermenting 1]-
related kinase 1 seems to have important roles in con-
trolling metabolic homeostasis and stress signalling [31].
Recently, a Glycogen Synthase Kinase3 protein kinase,
VvSK1 (Sugar-Inducible Protein Kinase), was shown to
regulate sugar accumulation in grapevine cell suspension
Figure 8 Clustering of the expression profiles of the core set of the 7130 modulated genes across three developmental stages of
grape ripening (EL 32, EL 35 and EL 36). Clustering was performed using k-means statistics and the number of genes in each cluster (eight)
is shown.
Fortes et al. BMC Plant Biology 2011, 11:149
/>Page 15 of 34
[32]. In the case of Trincadeira grape ripening, a gene
coding for a glycogen synthase kinase 3 beta
(VVTU8170_at, cluster 6) was down-regulated at EL 35
and EL 36 which may be due to cultivar specificities.
Plastid glycolysis seems to be inhibited at the onset
and following véraison as several genes coding for plasti-
dial phosphoglycerate kinase (VVTU1271_at, cluster 6),
glyceraldehyde-3-phosphate dehydrogenase A and B
(VVTU17859_s_at, VVTU5612_at, cluster 4), and fruc-
tose bisphosphate aldolase (VVTU16699_s_at,
VVTU1150_s_at) are down-regulated at these stages. On
the other hand, cytoplasmic glycolysis seems to be acti-
vated. In fact, genes coding for cytosolic Phosphoglyce-
rate kinase (VVTU18434_s_at, cluster 1), fructose-
bisphosphate aldolase cytoplasmic isozyme
(VVTU17960_s_at, cluster 1), cytoplasmic phosphoglu-
comutase (VVTU2658_at, cluster 8) and pyruvate
kinase, cytosolic isozyme (VVTU1012_at, cluster 1) are
up-regulated.
In the past, it was reported f or whole berry analysis
that glycolysis is down-regulated after véraison [17].
Other transcriptom ic and proteo mic analysis conducted
on the whole berry or only skin showed that several gly-
colytic enzymes increased during ripening [13,18].
Although different berry tissues may have different
trends of glycolysis [18], we highlight here that cellular
compartmentation should be taken in to account, an
issue that up to our knowledge has not been previously
adressed.
This increase in the rate of cy toplasmic glycol ysis due
to an e xcess of sugars leads to an increase in pyruvate
that may trigger aerobic fermentative metabolism [33].
In fact, the production of ethanol by pyruvate decarbox-
ylase and alcohol dehydrogenase may occur in ripening
fruit (reviewed by [34]). Pilati et al. [16] observed up-
regulation of genes coding for alcohol dehydrogenase
and aldehyde dehyd rogenase which may be indicative of
a shift to an aerobic fermentative metab olism during
ripening [35].
We observed that genes coding for an Alcohol dehy-
drogenase 6 (VVTU6090_s_at) and Alcohol dehydrogen-
ase (VVTU4210_at, cluster 8) were up-regulated at EL
35 and 36. Metabolic profiling indicates for these sam-
ples the presence of 1-O-ethyl-beta-glucoside which
may derive from the transfer of the glucosyl moiety
from a group of phenolic beta-glucosides to ethanol;
this latter compound is known to control cytosolic acid-
ity in ripe grapes [36]. This data may indicate that aero-
bic fermentation is occurring during ripening of
Trincadeira grapes. Moreover, a gene coding for alde-
hyde dehydrogenase (VVTU12019_s_at, cluster 8) was
up-regulated at EL 35 and even more at EL36. Giribaldi
and co-workers [17] also observed in proteomic studies
an increase in presence of aldehyde dehydrogenase
isoforms during grape ripening, and related it with recy-
cling of ethanol after véraison [13].
Organic acids such as malic and tartaric acids are well
known for their contribution to wine taste. In the cyto-
plasm, malate can be produced from PEP produced in
glycolysis through the activities of phosphoenolpyruvate
carboxylase (PEPC) and malate dehydrogenase. Though
one Unigene coding for a PEPC was up-regulated at
ripe stage (VVTU1967_s_at, cluster 8), two genes were
down-regulated (VVTU12208_at, VVTU19092_at) at
véraison and rip e stages in agreement with a decrease in
malate (Figure 2). Since malate dehydrogenase catalyzes
a reversible reaction between oxaloacetate and malate,
malate dehydrogenase may be involved in malate synth-
esis, which occurs mainly pre-véraison and malate
degradation at post-véraison. Several isoform s of malat e
dehydrogenase operating in different cellular compart-
ments may control the net content in malate. Two
malate dehydrogenase isoenzymes, one glyoxysomal,
were up-regulated (VVTU2535_at, cluster 8;
VVTU5246_at, cluster 1) where as two isoenzymes one
plastidial and one glyoxysomal were down-regulated
during ripening (VVTU4095_at, VVTU1903_at).
Malic enzyme catalyzes t he reversib le conversion
between malate and pyruvate. Two genes coding for
NADP-dependentmalicenzymewereeitherup-regu-
lated at EL 35, and EL36 in 2008 (VVTU18630_at), or
in 2007 (VVTU35950_at) (Additional files 5, 6). Envir-
onmental factors such as temperature may activate par-
ticular pathways of malate degradation but it is also
possible that different tissues behave differently. Any-
how, the regulat ion of malate concentrations in berries
is very complex [15]. Recently, it has been showed that
Trincadeira presents higher concentrations of malate
than other Portuguese cultivars [20] but more research
is needed to gather insights into the carbohydrate meta-
bolism of this particular variety.
Amino acid metabolism
Amino acids such as proline play a role in wine taste by
interfering with the sensation of acidity due to their buf-
fering capacity [37]. During ripening we observed an
increase in most amino acids but not for glutamate
(Additional file 3). In fact, this amino acid decreases
during ripening and a gene coding for Glutamate dehy-
drogenase 1 (VVTU13950_ s_at, cluster 4) is down-regu-
lated especially at EL 36.
Interestingly one gene coding for GLT1 (NADH-
dependent glutamate synthase 1) (VVTU37879_s_at)
was down-regulated at véraison in 2007 but not in 2008,
accounting for differences in nitrogen metabolism
between seasons. This is further supported by the f act
that a gene coding for nitrate reductase is down-regu-
lated during ripening but only in 2008 (VVTU9432_at,
Additional file 6).
Fortes et al. BMC Plant Biology 2011, 11:149
/>Page 16 of 34
Glutamate may be catabol ized through glutamate dec-
arboxylase, into g-aminobutyric acid (GABA), a metabo-
lite that increases during ripening. A gene coding for a
glutamate decarboxylase (VVTU11854_s_at, cluster 8)
was up-regulated at EL 35 and EL 36.
Interestingly, an increase in the transcript abundance
of a gene coding for a gamma-aminobutyric acid trans-
porter (VVTU14998_a, cluster 1) was noticed at ripe
stage (EL36) when there is increased oxidative stress
and sugar accumulation.
During ripening a transcript encoding a Succinic semi-
aldehyde dehydrogenase (SSADH1; VVTU35625_s_at)
putatively involved in GABA degradation is down-regu-
lated in both seasons as obtained by both microarray
and qPCR analysis (Figures 2, 9, Table 2). This enzyme
part icipates in the GABA shunt from which results suc-
cinate which content also decreases at ripe stages. In
citrus fruit, also a non-climacteric fruit, the GABA
shunt was suggested to play an important role in reduc-
tion of citrate and cytoplasmatic activity during ripening
[38]. However, our results don’ t suggest this probably
because malate is the organic acid accounting for most
of titrable acidity instead of citrate which is the c ase of
citrus. In this fruit, alternative citrate breakdown cata-
lyzed by ATP citrate lyase was ruled out since the corre-
sponding gene was clearly down-regulated [38]. On the
contrary, in Trincadeira grapes this gene was either not
differentially expressed or up-regulated with a lo w fold
change (not shown).
The observed decreas ed levels in citrate following vér-
aison should be also due to the action of NADP isoci-
trate dehydrogena se involved in conversion of isocitrate
into 2-oxogutarate. A gene coding f or an isocitrate
dehydrogenase, chloroplast precursor (VVTU35297_s_at,
cluster 8) and a gene coding for a Isocitrate dehydrogen-
ase (NAD+) precursor (VVTU4698_at) were both up-
regulated at EL 36.
Nevertheless glutamate may be partly c onsumed by
the GABA shunt since during ripening there are
increased levels of GABA. Alternatively, may be con-
sumed f or proline synthesis since the levels of this
amino acid strongly increased during ripening and a
gene encoding pyrroline-5-carboxylate synthetase
(VVTU22880_s_at, cluster 8) involved in proline synth-
esis was up-regulated. The same increase in proli ne and
proline biosynthetic g ene was reported for ripening of
Cabernet Sauvignon grapes [15]. This amino acid may
be playing a role as osmoprotectant during ripe ning
stages [39,40].
In accordance, a gene coding for a proline oxidase was
down-regulated during ripening (VVTU7588_at, cluster
5). Interestingly, a gene coding for proline transporter 1
(ProT1, VVTU5646_at, cluster 8) was up-regulated at
EL 35 and EL 36.
A good correlation was obtai ned with a transcript pro-
file for a gene coding for Cystathionine beta-lyase
(VVTU977_at) putatively involved in methionine bio-
synthesis and its increased content at EL 36 (Table 1,
Addition al file 3). It is likely that i t plays a role in provid-
ing a pool of S-Adenosyl methionine for polyamines’ bio-
synthesis as it will be discuss ed in another section of t his
paper. The pool of these growth regulators should also
control arginine metabolism. Though for most amino
acids a good cor relation was obtained for their content
and the genes involved in their biosy nthesis, this was not
the case for this amino acid. In fact, arginine levels
increase at ripe and mainly at harvest stages. However, a
gen e coding for arginine decarbox ylase (VVT U12839_at,
cluster 8 - Arginine decarboxylase (Fragment) involved in
arginine catabolism increases at EL35 and EL36 (Table 2,
Figure 9). Moreover, a gene coding for Glutamate N-
acetyltransferase (VVTU22296_s_at) involved in synth-
esis of ornithine and argin ine was down-regulated at
EL36.
Stress response
Glutathione transferases are known to be up-regulated
in many plants in response to a range of stress condi-
tions [41]. We observed a transcript encoding a Vitis
vinifera glutathione S-transferase 26 (GSTF12)
(VVTU1974_s_at, cluster 8) that displayed an 88 and
190-fold increase in abundance at EL 36 in 2007 and
2008 respectively, and may be involved in anthocyanin
sequestration in vacuoles [41]. Interestingly, a gene cod-
ing for a glutathione-conjugate transporter (MRP10;
VVTU12535_s_at, cluster 1) was up-regulated at EL36
in both seasons. To our knowledge this transporter has
not been previously described in the context of grape
ripening.
Pilati and co-workers [16] have reported the occur-
rence of an oxidative stress burst during grape ripening
as it has been reported for other climacteric and non-
climacteric fruits namely tomato [42], strawberry [43],
pineapple [44] and pepper [45]. The occurrence of oxi-
dative stress during grape berry development has been
rather controversial since at the transcriptional level
many typical oxidative stress m arkers seemed absent or
negatively regulated [13]. It should be also taken into
account that grapes accumulate many phenylpropanoids
that can play an antioxidant role. For instance, procyani-
din, catechin, epicatechin and gallic acid scavenged a
stable free radical much more efectively than the antiox-
idant ascorbic acid [46].
Our results support the results of Pilati and co-work-
ers [16] since like berry H
2
O
2
, glutathione increased sig-
nificantly at EL 35 reaching a maximum two weeks after
and decreasing at harvest. A gene coding for Gamma-
glutamylcysteine synthetase (VVTU4990_at, cluster 7)
involved in glut athione biosynthesis was also up-
Fortes et al. BMC Plant Biology 2011, 11:149
/>Page 17 of 34
Figure 9 Real time RT-PCR validation of the expression profiles of eight genes in the two seasons under analysis. Data are reported as
means ± SE of three technical and two biological replicates. Transcript levels were calculated using the standard curve method and normalized
against grapevine actin gene (VVTU17999_s_at) used as reference control. VVTU8069_at: L-galactono-1,4-lactone dehydrogenase (LGDH),
VVTU12839_at: Arginine decarboxylase (ADC), VVTU16654_at: IMP dehydrogenase (IMDDH), VVTU39787_s_at: Flavonone- 3-hydroxylase (F3H),
VVTU35625_s_at: Succinic semialdehyde dehydrogenase (SSADH1), VVTU1588_at: Ethylene receptor 1 (ETR1), VVTU9453: Quercetin 3-O-
methyltransferase 1 (OMT1), VVTU4990_at: Gamma-glutamylcysteine synthetase (GCS).
Fortes et al. BMC Plant Biology 2011, 11:149
/>Page 18 of 34
regulated during ripening in both 2007 and 2008 (Table
2, Figure 9). Further studies are required to figure out
theroleplayedbyoxidativestressinripening.An
increase in the levels of glutathione was previously
observed during ripening of Koshu and Cabernet Sau-
vignon grapes [23]. The activities of catalase, nonspecific
peroxidase, and ascorbate peroxidase were undetectable
in these grapes during ripening, in contrast with the
activities of glutathione reductase, dehydroascorbate
reductase, and glutathione pero xidase. In our study, sev-
eral genes coding f or isoforms of catalase, peroxidase,
superoxide dismutase, glutathione peroxidas e, phospho-
lipid hydroperoxide glutathione peroxidase, and ascor-
bate peroxidase were up and down-regulated during
ripening though in certain cases only in one a season
eventually due to tissue specificities and/or weather con-
ditions (Table 2, Additional file 6).
Much evidence has been gathered pointing to a pivo-
tal role for the ascorbate-glutathione cycle in scavenging
reactive oxygen species. Its activity relies on the sequen-
tial oxidation and re-reduction of ascorbate and glu-
tathione. We found genes coding for enzymes of the
cycle that were up-regulated during ripening
(VVTU7379_at, cluster 7 - Glutathione reductase,
VVTU14104_s_at, cluster 1 - monodehydroascorbate
reductase, and VVTU13460_at- L-ascorbate peroxidase
1, cytosolic APX1) except for dehydroascorbate reduc-
tase (VVTU5671_s_at - dehydroascorbate reductase)
which was down-regulated but only in 2007 (Table 2,
Additional file 6), and reduces dehydroascorbate to
ascorbate using reduced glutathione as the reducing
agent. One gene though coding for a dehydroascorbate
reductase (VVTU40144_at) increased its transcript
abundance by 1.62 fold at EL 35 but only in 2008.
This data together with the fact that ascorbate levels
decrease and glutathione levels increase make it difficult
to ascertain an important role for this cycle during
ripening as it has been described for tomato [42]. More-
over, this cycle operates in compartments such as chlor-
oplasts, mitochondria, and peroxisomes and tissue
specific activity may be expected. For instance, it has
been reported that the concentrations of ascorbate and
glutathione in apple epidermis were higher than in the
underlying mesocarp [47]. In Trincadeira grapes we
found a general tendency for these genes to display
higher transcript abundance in 2008 (Additional file 6).
We found a good correlation between the decrease in
ascorbate levels (Additional file 3) and the expression of
a gene coding for its biosynthesis/degradation. Two
genes coding for an L- ascorbate oxidase
(VVTU23718_at, VVTU29284_at) were up-regulated at
EL 35 and/or EL 36 at least in one season. Moreover, a
gene coding for a L-galactono-1,4-lactone dehydrogen-
ase (VVTU8069_at, cluster 4) which catalyzes the final
step in ascorbic acid biosynthesis and a gene coding a
GDP-mannose 3,5-epimerase 1 (VVTU27380_s_at)
which constitutes an alterna tive pathway of ascorbat e
biosynthesis were both down-regulated at EL 36 and at
EL 38 as eval uated by qPCR ( Table 2, Figure 9). L-
ascorbate is also a biosynthetic precursor in the forma-
tion o f L -tartaric acid which also decreases during
ripening. The tr anscript abundance of a gene involved
in its biosynthesis and coding for Vitis vinifera L-ido-
nate dehydrogenase (VVTU4643_at) was down-regu-
lated, however, only in 2008 season (Table 2, Additional
file 2). Recently, strong developmenta l regulation of
ascorbate biosynthetic, recycling and catabolic genes was
demonstrated in grape berries, with the ascorbate pre-
cursor being accumulate at low levels and its flux
diverted towards the synthesis of tartaric acid [48].
A gene coding for a Latex cyanogenic beta glucosidase
(VVTU38305_s_at) was up-regulated at EL 35 and EL
36. Grimplet and co-workers [49] found that a gene
encoding cyanogenic beta glucosidase was over-
expressed in the skin. Cyanogenic glycosides are glyco-
sides of a-hydroxinitriles and their involvement in fruit
ripening has been previously mentioned for strawberry
[50]. The possibility that cyanogenic compounds are
present in berries remains to be excluded [51]. Further-
more, a gene coding for Beta-cyanoalanin e synthase
(VVTU40443_s_at, cluster 8) putatively involved in cya-
nide detoxification was up-regulated at EL 34, EL 35 and
EL 36. Interestingly, a gene coding for a myrosinase pre-
cursor (VVTU6270_at) was up-regulated at EL36. Myro-
sinases or beta-thioglucoside glucohydrolases hydrolyze
glucosinolates liberating defense compounds such as iso-
thiocyanates and n itriles. Glucosinolate derivatives con-
tribute greatly to the distinctive flavor and aroma of
cruciferous vegetables [52].
We observed more genes up-regulated and implicated
in biotic stress response during ripening in 2008 season
(Additional file 6). Though environmental aspects may
be involved, it can also be considered that this observa-
tion is related to the fact that the amount of skin per
berry was higher in 2008, and this tissue is expected to
express more genes related to defense. Such is the case
of a g ene coding for Anthraniloyal-CoA: methanol
anthraniloyal transferase (VVTU687_at, cluster 8) that
displayed remar kable increase in transcript abundance
(240.6 and 373.3 fold change at EL 36 in 2007 and 2008
season, respectively). Up to our knowledge this gene has
not been previously related to grape ripening and may
be involved in phytoalexin synthesis in response to
stress [53].
Flavonoid metabolism
Genes coding for enzymes acting on flavonols, stilbenes,
and anthocyanins synthe sis were noticed to be induced
during grape ripening as previously described [16].
Fortes et al. BMC Plant Biology 2011, 11:149
/>Page 19 of 34
A gene coding for a flavonol synthase (VVTU9714_at,
cluster 8) was up-regulated at EL 34, EL 35 and EL 36
displaying higher transcript abundance at this later
stage. This enzyme is responsible for the conversion of
dihydroflavonols to flavonols which are important co-
pigments that stabilize anthocyanins in wine. On the
other hand, a gene coding for a dihydroflavonol-4-
reductase (VVTU20756_at, cluster 5) was down-regu-
lated at véraison and ripe stages. This enzyme is respon-
sible for the conversion of dihydroflavonols to
leucoanthocyanidins which are precursors of anthocya-
nidins and tannins. This constitutes a difference com-
paring to the recently published results in Cabernet
Sauvignon and Norton varieties [54]. Transcripts of
dihydroflavonol-4-reductase increased to the highest
levels at véraison in both varieties, and then declined
sharply in Cabernet Sauvignon, but remained at the
same levels throughout the ripening stages in Norton.
As described by Pilati et al. [9] a gene coding for an
anthocyanidin reductase (VVTU13083_at, cluster 5)
which catalyzes the formation of epicatechin-derived
compounds was also down-regulated at EL35 and EL36
since proanthocyanidin s/tannins synthesis decreases
after véraison.
Interestingly, a gene coding for Flavanone 3-hydroxy-
lase (VVTU39787_s_at, cluster 2) was down-regulated at
EL 35 but up-regulated at EL 36, and qPCR analysis
further revealed up-regulation at EL 38 in both seasons
(Figure 9). This suggests isoenzyme specific activation
due to a switch from proanthocyanidins to anthocyanin
synthesis.
It was noticed up-regulation at EL 34 a nd EL35 of a
gene co ding for UDP-glucose: anthocyanidin 5,3 -O-glu-
cosyltransferase with homology to a Flavonol 3-O-Glu-
cosyltransferase-like protein (VVTU13618_x_at, cluster
7). Though both annotations can be correct the pattern
of expressio n suggests that the gene is likely to code for
the latter enzyme which is responsible for glucosylation
of flavonol aglycones such as kaempferol, quercetin and
myrecitin. In fact, in grape berry these compounds are
present as the corresponding glucosides, galactosides,
and glucuronides [55]. Recently, Ali et al. [20] found in
Trincadeira grapes a decrease in content of quercetin
glucoside following véraison probably due to the utiliza-
tion of its precursors (dihydrokaempferol and/or dihy-
droquercetin) in the production of anthocyanins.
We also noticed up-regulation of a quercetin 3-O-
methyltransferase 1 (VVTU9453_at, cluster 1) with
homology to a Vitis vinifera putative O-methyltransfer-
ase that was up-regulated at EL36 reaching its peak of
expression at EL38 in both seasons (Figure 9). This
enzyme may be responsible for the conversion of
anthocyanidins and may contribute for the varietal spe-
cific anthocyanin profile. For instance, cyanidin is
converted to peonidin by the action of 3’ -O-methyl-
transferase [56].
Anthocyanins provide the vibrant purple tones of red
wines. The accumulation o f anthocyanins in the skin of
red grapes coincides with expression of the gene encod-
ing the final step in anthocyanin biosynt hesis, UDP- glu-
cose: flavonoid 3-O-glucosyl transferase (UFGT). A gene
coding UDP-glucose:flavonoid 3-O-glucosyltransferase
(VVTU17578_s_at, cluster 8) displayed increased tran-
script abundance at EL 35 and EL 36.
Isoflavonoids comprise a class of defense compounds
found mostly in legumes. Little information is available
related to the involvement of isoflavonoids in grape
ripening. Isoflavone reductase catalyzes the reduction of
isoflavones to isoflavonones. Recently, this protein was
shown to be present in embryogenic callus of V itis vini-
fera and involve d in st ress response [57]. Proteomic stu-
dies revealed that a isoflavone reductase-like protein
showed highest abundance before véraison [17]. Here
we noticed the down- and up-regulation during ripening
of genes coding for isoflavone reductase (VVTU13266_-
s_at, cluster 5, VVTU13951_at, cluster 1,
VVTU12956_at, cluster 1). The latter may be involved
in the synthesis of stress response-related compounds.
In addition, a gene coding for a CYP81E1 Isofla vone 2’-
hydroxylase (VVTU22627_at) was up-regulated at EL 36
in 2008 (Additional file 6).
Aroma development
Several free and bound volatiles have been reported in
grapes and play a role in wine aroma. Cinnamyl alcohol
dehydrogenas e is involved in the synthesis of lignin pre-
cursors but cinnamyl alcohol derivatives are also respon-
sible for fruit flavor and aroma [43]. Mos t genes coding
for cinnamyl alcohol dehydrogenase (CAD) were down-
regulated during ripening (Additional file 5), which may
be related to the observed decrease in cis-coumaroyl
derivatives and trans-caftaric acid when approaching
véraison (Additional file 2). Nevertheless, one gene cod-
ing for a Cinnamyl-alcohol dehydrogenase
(VVTU27826_x_at) was up-regulated at EL 35 and EL
36. A CAD gene was reported to be up-regulated during
fruit ripening in strawberry and suggested to be involved
in flavor development and lignification of vascular ele-
ments [43]. Another CAD gene (VVTU33502_at) dis-
played an interesting pattern since it was up-regulated
at EL 34, just before véraison anddown-regulatedat
EL36.
Multiple lipoxygenase isoenzymes have been described
in plants [58]. We observed up- and down- regulation
of several genes coding for lipoxygenases (Additional file
5). It is tempting to speculate that lipoxygenase isoforms
activated pre-véraison are likely to be involved in jasmo-
nic acid biosynthesis a nd cell growth, whereas lipoxy-
genase isoforms activated post-véraison may be involved
Fortes et al. BMC Plant Biology 2011, 11:149
/>Page 20 of 34
in mobilization of lipids for gluconeogenesis, cell expan-
sion and in the synthesis of C6 volatile compounds.
Lipoxygenase-derived hydroperoxy fatty acids are meta-
bolized through major pathways involving enzymes such
as the hydroperoxide lyase [59]. A gene coding for fatty
acid hydroperoxide lyase (HPL1; VVTU37595_s_at, clus-
ter 7) was up- regulated at EL35. Costantini a nd co-
workers [60] noticed in Malvasia grape berries, an
increase in lipoxygenase activity, and the concomitant
production of C6 compounds such as hexenol and hexa-
nal. Recently, contents in (E)-2-Hexenal and Hexanal
were shown to peak at E L36 in Trincadeira grapes
(unpublished results). Hexenal can be converted to hex-
anol by alcohol dehydrogenases. Two genes coding for
alcohol dehydrogenases were up-regulated either at EL
34 and/or EL 35 and EL 36 (VVTU4210_at, cluster 8,
VVTU6090_s_at). Production of volatiles as a result of
alcohol dehydrogenase activity was suggested to contri-
bute to the development of taste and aroma in fruits
[61]. Interestingly, the leaves of Adh2 transgenic grape-
vine overexpressors showed increased levels of monoter-
penes, carotenoids, proanthocyanindin polymerisation
and benzyl alcohol [62].
Terpenes, w hich are precursors for important aroma
compounds accumulate at vérais on [63]. Int erestingly, a
gene coding for a (-)-isopiperitenol dehydrogenase
(VVTU2626_at) was up-regulated at EL 34, EL 35 and
EL 36 peaking at véraison. This enzyme is involved in
the synthesis of monoterpenoids (e.g. menthol) which
are the main volatile components in essential oils. On
the other hand, a gene coding for (+) -neoment hol dehy-
drogenase (VVTU21725_at, cluster 8) putat ively
involved in menthol biosynthesis, a volatile monoterpe-
noid, was up-regulated at EL35 and even more at EL36
in both seasons.
Some volatile terpenes are not derived directly from iso-
prenoid pyrophosphates but instead from the cleavage of
carotenoids by carotenoid cleavage dioxygenases [64].
Three genes coding for a 9-cis-epoxycarotenoid dioxygen-
ase 2 (isoenzyme carotenoid cleavage dioxygenase 1;
VVTU17555_s_at, VVTU8254_at, cluster 8, VVTU650_at,
cluster 7) were up-regulated at EL 35 and may contribute
to the formation of the flavour volatiles [65].
Several genes putatively involved in aroma develop-
ment displayed different patterns of expression between
years which may be due to seasonal variation. This can
lead to differences in wine aroma, though obviously a
complex interplay of many other factors is involved.
One gene coding for a (-)-germacrene D synthase
(VVTU13316_s_at) was down-regulated at EL 35 but
only in 2008 (Additional file 6). A gene coding for a ger-
macrene D synthase was, however, shown to be up-
regulated at ripening initiation of Cabernet Sauvignon
grapes [66], which highlights cultivar differences if the
annotation corresponds to this specific enzymatic
activity.
Growth regulators
Although grapes are a non-climacteric fruit, ethylene
has been suggested to promote ripening by increasing
modestly around véraison but its role is still unclear [6].
Abscisic acid, however, has a clear promoting role in
grape ripening. During the earlier phases of ber ry devel-
opment auxin and cytokinins may act to delay ripening
[6]. Amongst the genes related to hormone metabolism
in the core set of 7130 genes, those related to auxin and
ethylene were the most represented.
Auxins Though exogenou s auxins can suppress or delay
graperipening[67]theroleofendogenousauxinisnot
fully understood. In grape, it has been generally
accepted that indole-3-acetic acid (IAA) levels peak after
anthesis and then decline to very low levels in the ripe
fruit, though other studies report relatively constant
levels during grape ripeni ng [6]. Regarding auxin bio-
synthesis, we found a gene coding for an indole-3-acetic
acid-amido synthetase GH3.8 (VVTU3560_at , cluster 1)
that was up-regulated at EL36 whereas a gene coding
for a indole-3-acetic acid-amido synthetase GH3.2
(VVTU1335_at) showed a decline in expression at EL35
and EL 36. The enzyme GH3 is responsible for the for-
mation of IAA conjugates with amino acids that may
reversibly remove IAA from the active pool. In Arabi-
dopsis, endogenous auxin content is coordinately regu-
lated through negative feedback by a group of auxin-
inducible GH3 genes that are involved in biotic and
abiotic stress responses [68]. Recently, the GH3 cata-
lyzed formation of IAA conjugates during ripening was
suggested to represent a common IAA inactivation
mechanism in climacteric and non-climacteric fruit
which enables ripening to occur [67].
A transcript encoding IAA-amino acid hydrolase 1
(ILR1) (VVTU35572_s_at), which is putatively involved
in IAA homeostasis, was up-regulated at EL 34, EL35
and EL36.
Aux/IAAs have been identified as rapidly induced
auxin response genes [69]. Many genes cod ing for Aux-
IAA proteins were down-regulated during ripening
(VVTU17953_s_at, cluster 5, VVTU1813_at, cluster 6,
VVTU7286_at, cluster 2, VVTU23500_at, cluster 5,
VVTU2445_s_at, cluster 5) which may suggest that
auxin levels are indeed lowered after véraison. Neverthe-
less, two genes coding for IAA19 (VVTU3361_at, cluster
8) and IAA16 (VVTU33878_s_at, cluster 8) were up-
regulated at EL34, EL35 and EL 36.
Auxin-response factors bind auxin-response elements
of auxin responsive genes and thus, seem to act as regu-
lators of gene transcription [69]. Several auxi n response
factors (ARFs 1, 2, 3, 4, 6, 10, 18) were down-regulated
at EL35 and EL36 or already at EL34 (Additional file 6).
Fortes et al. BMC Plant Biology 2011, 11:149
/>Page 21 of 34
Genes coding for transport inhibitor response 1 pro-
tein were up-regulated (VVTU2614_s_at) and down-
regulated (VVTU7869_at) during ripening. The TIR1
(transport inhibitor response 1) gene encodes an F-box
protein integrating the SCF complex that mediates Aux/
IAA degradation [70].
A gene coding for a au xin responsive Small Auxin Up
RNA protein (SAUR) 29 protein (VVTU18738_s_at,
cluster 8) w as up-regulated during ripening in opposi-
tiontoagenecodingforAuxin-responsiveSAUR31
(VVTU38338_x_ at). The same was described for Caber-
net Sauvignon [15 ]. Interestingly, a gene coding for an
Auxin-responsive SAUR9 (VVTU19090_s_at) was up-
regulated at EL 35 during 2007 but down-regulated dur-
ing 2008. Genes coding for other auxin- responsive pro-
teins also displayed different patterns of expression
between seasons (Additional file 6).
The majority of transcripts related to auxin tra nsp ort
and perception displayed decreased abundance at the
onset of véraison. Genes coding for auxin efflux carriers
including PIN1 and influx carriers (VVTU16083_at,
VVTU35909_s_at, cluster 5, VVTU33865_s_at, cluster 2,
VVTU16124_at, cluster 6) were down-regulated at EL
34, 35 and/or EL36. The putative inhibition of pol ar
auxin transport in ripe grapes is not so surprising since
flavonoids which accumulate at high levels during ripen-
ing have been described to inhibit polar auxin transport
involving PIN1 [71].
Ethylene Theroleofethyleneingraperipeningisstill
not fully understood though it is generally conside red to
have a role in promoting ripening [6]. In fact, the appli-
cation of 1-methylcyclopropene, a irreversible inhibitor
of ethylene receptors, prior to véraison reduced berry
size and anthocyanin accumulation [8]. Moreover , ethy-
lene application at véraison led to an increase in berry
diameter and modulated the expression pattern of ripen-
ing-related genes [72]. A small and transient increase of
endogenous ethylene production was shown to occur
just before véraison together with an increase in 1-ami-
nocyclopropane-1-carboxylic acid (ACC) oxidase activ-
ity, the enzyme responsible for the last step in ethylene
biosynthesis [8]. The protein concentration of ACC
synthase was shown to peak at véraison in Nebbiolo
Lampia berries [17].
We observed decreased transcr ipt abundance in genes
coding for ACC sy nthase (VVTU6382_at, cluster 6;
VVTU5165_at) at EL 35 and EL 36 though one gene
wasup-regulatedatEL34atleastin2007
(VVTU12042_at, Additional file 6, Table 2). Several
genes coding for ACC oxidase were also down-regulated
during ripening (Additional file 6) , and one was up-
regulated (VVTU5909_at, cluster 7).
In Pinot Noir [16] the putative peak in ACC oxidase
transcript accumulation occurred immediately before
véraison and in Cabernet Sauvignon grapes at E-L stage
32 [15]. These authors however, d id not identify so
many genes coding for ACC oxidase as we have in this
work. Our results suggest that the peak occurs before
véraison but some isoforms of ACC oxidase may be
active following véraison. In watermelon, a non-climac-
teric fruit, a homolog of ACC oxidase was also induced
in ripening stages [73].
The ability to perceive, transduce and act upon hor-
mone signals is likely to vary through development [6].
The transcript levels of some grape ethylene receptors
changed during berry development [15]. Ethylene is per-
ceived by a family of membrane associated re ceptors,
including ETR 1/ETR2 and EIN4 in Arabidopsis
(reviewed by [74]). Genes coding for these receptors
were up-regulated during ripening (VVTU1588_at,
VVTU19389_s_at, cluster 1). A gene coding for EIN4
was recently shown to increase its expression during
ripening of Muscat Hamburg grapes [9]. Using qPCR
analysis we found that the gene coding for ETR1 dis-
played increased transcript abundance from EL35 until
EL38 in both seasons (Figure 9). Ethylene levels may
indeed lower during ripening since ethylene binding has
been proposed to inhibit receptor function [74].
We found down-regulation at EL 35 of genes coding
for EIN3-binding F-box protein 2 (VVTU2683_s_at),
and at EL 35 and EL 36 for ethylene-insensitive 3
(EIN 3) protein (VVT U8555_at) that show s homology to
an EIL1 related protein. In Arabidopsis, there are six
members of the EIN3 family, in which EIN3 and EIL1
are the most closely related proteins [74]. EIN3 is a
positive regulator of ethylene responses. The nuclear
protein EIN3 is a transcription fact or that regulates the
expression of its immediate target genes such as ERF1
[74]. This gene (VVTU8172_at, cluster 1) displayed high
transcript abundance at EL 36 especially in 2008 season.
Interestingly, a gene coding for a MAP3K protein
kinase (VVTU128 70_s_at, cluster 1) was up-regul ated at
EL 36 in both seasons. The Arabidopsis MAPKs MPK3
and MPK6 seem to play a central role in the regulation
of the ethylene response pathway by promoting the sta-
bilization of EIN3 but recent investigations suggest their
involvement in modulating ethylene biosynthesis rather
than the signaling pathway [75].
ERF1 belongs to a large family of APETALA2-domain-
containing transcription factorsthatbindtopromoters
of many ethylene inducible genes. Furthermore, ERF1 is
also involved in JA mediated gene regulation [76]. A
transcriptional cascade that is mediated by EIN3/EIN3-
like (EIL) and ERF p roteins leads to the regulation of
ethylene controlled gene expression [74]. Interestingly,
glucose enhances EIN3 degradation, highlighting the
previously mentioned crosstalk between sugar and hor-
monal metabolism. Besides ERF1 other genes coding for
Fortes et al. BMC Plant Biology 2011, 11:149
/>Page 22 of 34
transcription factors were up-regulated at EL35 and
EL36 such as coding for ERF3 (VVTU18607_s_at, clus-
ter 8) and for DREB sub A-5 of AP2/ERF transcription
factor (VVTU17388_at). T his AP2/ERF family of tran-
scriptions factors was recently shown to be involved in
grape ripening [77].
Many other gen es coding for transcripti on factors
were also down-regul ated (Additional file 6) such as
AP2/EREBP trans cription factor (VV TU4551_at, cluster
5). Noticeably, a gene coding for an Ethylene-responsive
transcription factor ERF105 (VVTU35437_at) was
down-regulated during ripening in 2007 but up-regu-
lated in 2008. Pilati and co-workers [16] also observed
induction and repression of several genes coding
EREBPs.
Altogether our results suggest that ethylene signaling
pathways may play an important role prior to véraison
as it has been described for other non-climacteric fruits.
In watermelon, ethylene production was highest in the
green fruit stage [73], and decreases in later develop-
mental stages, similar to citrus [78] and strawberry [79].
Recently, it was suggested that a downstream porti on of
the ethylene-mediated signaling pathway may be acti-
vated during pepper ripening without climacteric ethy-
lene production but via the alt eration of ethylene
sensi tivity [80]. This may be the case in grape. It should
be taken into account that a specific signaling pathway,
possibly involving ERF1, is activated during grape
ripening.
Jasmonic acid The role of jasmonic acid in grape ripen-
ing is also poorly understood. A gene which based on
genomic annotation codes for an IMP dehydrogenase
(VVTU16654_a, cluster 3) was up-regulated at EL 35
and EL 36 peaking at véraison. Interestin gly, this gene
showed high homology to LEJ2 (LOSS OF THE TIM-
ING OF ET AND JA BIOSYNTHESIS 2). The peak of
expression at véraison in both seasons was confirmed
and clearly observed by qPCR (Figure 9). Up to our
knowledge this gene has not been previously reported in
the context of fruit ripening. The study of this gene
deserves further attention since as ethylene; jasmonic
acid seems to be synthesized in lower amounts following
véraison. In fact, several genes induced by jasmonates
were down-regulated at véraison or at ripe stage such as
EDS5 (ENHANCE D DISEASE SUSCEPTIBILITY 5)
(VVTU35149_at, cluster 2), phytoalexin-deficien t 4 pro-
tein (PAD4) (VVTU14779_at) and cellulose synthase
CESA3 (VVTU26669_at). In addition, mRNAs involved
in the biosynthesis of jasmonic acid, namely those cod-
ing for allene oxide cyclase (homolog related to man-
grin, VVTU7003_at), 12-oxophytodienoate reductase 3
(VVTU4246_at, cluster 6) and 12-oxophytodienoate
reductase 2 (VVTU17030_s_at) were less abundant at
EL 35 and EL 36. The decrease in expression of this
latter gene during ripening was also reported for Caber-
net Sauvignon [15]. Nevertheless, a gene coding for an
allene oxide synthase (VVTU16057_at, cluster 8) puta-
tively involved in jasmonic acid biosynthesis was
strongly up-regulated at EL 35 and EL 36. One gene
coding for a MYC transcription factor involved in jas-
monic acid- dependent transcriptional activation was
up-regulated at EL 34 just before véraison
(VVTU34392_at, Additional file 5) whereas a gene cod-
ing for a Coronatine-insensitive 1 (COI1) related protein
(VVTU23697_at, cluster 8) was up-regulated at EL 35
and EL36. COI1 is an F-box component of SCF (SKIP-
CULLIN-F-box) complexes that in response to the hor-
mone, targets JAZ (jasmonate ZIM-domain) repressor
proteins for degradation [81]. Genes coding for JAZ1
and JAZ8 were up-regulated during ripening
(VVTU38616_s_at, cluster 8; VVTU39811_s_at, cluster
1) whereas for JAZ3 (VVTU4273_s_at, cluster 6) was
down-regulated. Interestingly, a gene coding for a J AR1-
like protein (VVTU3032_at) was up-regulated at EL 36
but only in 2008 season. JAR1 encodes a jasmonic acid
amino acid synthetase involved in conjugating jasmonic
acid to Ile [82] which is nec essary for its activation.
Further stu dies are required to evaluate how this differ-
ence may affect grape composition in differentes sea-
sons. Jasmonic acid and methyljasmonate are known to
promote the synthesis and accumulation of resveratrol
in grapevine cell cultures [83]. However, there are no
reports linking endogenous jasmonates and activation of
phenylpropanoid synthesis in grapes. In fact, in Trinca-
deira berries genes coding for jasmonate O-methyltrans-
ferase (VVTU35706_at; VVTU11913_at, cluster 6)
putatively involved in the volatile methyljasmonate
synthesis were down-regulated at EL 35 and EL36, sug-
gesting that also this compound is present in lower
amounts in ripe berries. On the other hand, a gene cod-
ing for a methyl jasmonate esterase (VVTU1657_s_at)
putatively involved in inactivation of methyl jasmonate
signaling was down-regulated.
Altogether the results suggest that though jasmonates’
concentration may decrease in grapes following véraison
they are likely to play a role in ripening possibly through
interaction with other growth regulators. For instance,
NPR1 is involved in the antagonistic interaction between
salicylic acid and jasmonic acid [84] and the correspon-
den t gene is up-regulated at EL36 (VVTU7560_at, clus-
ter 1).
Polyamines Polyamines are known to be involved in
plant growth and differentiation and in stress/defense
responses [85]. During fruit development, rates of polya-
mine and ethylene biosynthesis are normally opposed
possibly due to the inhibitory effects of polyamines on
ethy lene biosynthesis and vice versa [86]. Since ethylene
levels are likely to decrease following véraison,
Fortes et al. BMC Plant Biology 2011, 11:149
/>Page 23 of 34
polyamines’ levels may increase. This is suggested by the
increase in transcript abunda nce at EL 35 and/o r EL 36
of genes coding for an Arginine decarboxylase (Frag-
ment) (VVTU12839_at, cluster 8), S-adenosylmethionine
decarboxylase (VVTU12964_s_at, cluster 8), spermidine
synthase (VVTU1269_s_at) and spermine synthase
(VVTU5224_at, cluster 1, VVTU10365_at). These
enzymes are involved in polyamine biosynthesis.
Furthermore, we found that the gene coding for arginine
decarboxylase kept increasing its transcript abundance
up to EL 38 in both seasons (Figure 9).
Polyamines have been reported to be inducers of flow-
ering, promoters of fruitlet abscission and involved in
fruit set in grapevine [87]. However, up to our knowl-
edge polyamines have not been suggested to play a role
in grape ripening. In fact, previous studies in Cabernet
Sauvignon and Pinot Noir grapes did not show up-regu-
lation of genes coding for enzymes involved in polya-
mine biosynthesis [15,16]. Another enzyme involved in
polyamine biosynthesis is ornithine decarboxylase but
no differential expression of the corresponden t gene was
observed during ripening (data not shown). The intra-
cellular free polyamine pool is affected by its synthesis
and degradation among other mechanisms. Amin e oxi-
dases catabolize putrescine (diamine) and polyamines
and can yield g-aminobutyric acid (GABA) [88], a com-
pound that increased in Trincadeira mature grapes
(Table 1, Additional file 3). In this grape variety, we
found up-regulation at EL 35 and/or EL 36 of four
genes coding for amine oxidases (VVTU37047_at, clus-
ter 1, VVTU6472_at, VVTU851_at, cluster 8,
VVTU5226_at) which may indicate that an active cata-
bolism of polyamines is occurr ing during ripening. Stu-
dies are undergoing to understand the role of
polyamines in grape ripening.
ABA metabolism Several studies report an in crease in
free ABA levels around véraison concomitant with sugar
accumulation and color development [6]. Furthermore,
ABA application has also been shown to induce expres-
sion of a MYB transcription factor known to coordi-
nately activate the anthocyanin biosynthetic pathway
[89]. T he possibility that ABA can induce sugar uptake
and accumulation as well as increase the synthesis of
phenylpropanoids has led to the proposed role of ABA
in promoting grape ripening [6].
Recently, the interplaying between ABA and sugar sig-
naling pathways w as shown [10] as well as between
ABA and ethylene which may be required for the onset
of grape ripening [9].
Two genes coding for a 9-cis-epoxycarotenoid dioxy-
genases (VVTU17555_s_at, VVTU8254_a t, cluster 8)
were up-regulated during ripening in both seasons
though the first peaked at EL 35. This enzyme catalyzes
a crucial step in ABA biosynthesis suggesting that ABA
levels increase following véraison [90].
Besides being involved in triggering ripening, the pro-
duction of ABA in grapes is likely to be related to seed
development [49].
A gene coding for an ABA-responsive element-binding
protein 2 (AREB2) with homology to gene grip55 was
up-regulated at EL 35 (VVTU783_at, cluster 7). This
protein is a transcription factor involved in control of
ABA-responsive genes and it was suggested to play a
role in controlling ABA-/water-stress-inducible gene
expression during ripening in grape berries [91].
Interestingly, the transcript abundance of a gene UBP1
interacting protein 2a (UBA2a) with h omology for a
RNA-binding protein AKIP1-like protein
(VVTU19049_s_at) was increased at EL 36. This protein
is nuclear and involved i n mRNA splicing. In Vicia
faba, an ABA-activated protein kinase (AAPK)-interact-
ing protein 1 (AKIP1) is phosphorylated by AAPK in
response to ABA treatment. Such activated AKIP1 pro-
tein was suggested to bind other ABA-responsive tran-
scripts such as dehydrins [92].
Many genes putatively involved in ABA signaling are
up-regulated during ripening of Trincadeira grapes and
have not been previously described in this context. A
gene coding for OST1 (OPEN STOMATA 1) AAPK
was up-regulated at EL 36 but only in 2008
(VVTU23465_at, Additional file 6).
The ABA-activated kinases were identified as SNF1-
related protein kinase (SnRK) 2.2,
SnRK2.3, and SnRK2.6 (also known as OST1, the Ara-
bidopsis ortholog of AAPK). OST1/ SnRK2.6 is one of
the Arabidopsis SnRK2 activated by osmotic stress
besides ABA and a major, positive regulator of ABA sig-
naling [93]. Recently, protein kinases SnRK2.2, SnRK2.3,
and SnRK2.6 were suggested to have partially redundant
functions but together, are essential for ABA responses
whereas SnRK2-7 and SnRK2-8 play a minor role in
ABA signaling [94]. A gene coding for a SnRK2-8
(VVTU12347_s_at) was up-regulated at EL 35 also only
in 2008.
The seasonal differences in ABA signaling were
further supported by the down-regulation of a gene cod-
ing for SNF1 PROTEIN KINASE 2-3 AKIP OST1
(VVTU22232_at) but only in 2007 (Additional file 6).
A gene coding for an ABI1 (ABA INSENSITIVE 1;
VVTU28731_s_at), a PP2C-type protein phosphatase
that interacts with OST1 and negatively regulates many
aspects of ABA signaling [93] was up-regulated at EL
34, 35 and EL 36.
Brassinosteroids Brassinosteroids (BR) have been impli-
cated in pla ying an important role in berry development
[7].
Fortes et al. BMC Plant Biology 2011, 11:149
/>Page 24 of 34