báo cáo khoa học: " Expression profiling and integrative analysis of the CESA/CSL superfamily in rice" doc
Bạn đang xem bản rút gọn của tài liệu. Xem và tải ngay bản đầy đủ của tài liệu tại đây (1.3 MB, 16 trang )
RESEARC H ARTIC L E Open Access
Expression profiling and integrative analysis of
the CESA/CSL superfamily in rice
Lingqiang Wang
1,2†
, Kai Guo
1,3†
,YuLi
1,2
, Yuanyuan Tu
1,2
, Huizhen Hu
1,2
, Bingrui Wang
2
, Xiaocan Cui
3
,
Liangcai Peng
1,2,3*
Abstract
Background: The cellulose synthase and cellulose synthase-like gene superfamily (CESA/CSL) is proposed to
encode enzymes for cellulose and non-cellulosic matrix polysaccharide synthesis in plants. Although the rice (Oryza
sativa L.) genome has been sequenced for a few years, the global expression profiling patterns and functions of
the OsCESA/CSL superfamily remain largely unknown.
Results: A total of 45 identified members of OsCESA/CSL were classified into two clusters based on phylogeny and
motif constitution. Duplication events contributed largely to the expansion of this superfamily, with Cluster I and II
mainly attributed to tandem and segmental duplication, respectively. With microarray data of 33 tissue samples
covering the entire life cycle of rice, fairly high OsCESA gene expression and rather variable OsCSL expression were
observed. While some members from each CSL family (A1, C9, D2, E1, F6 and H1) were expressed in all tissues
examined, many of OsCSL genes were expressed in specific tissues (stamen and radicles). The expression pattern of
OsCESA/CSL and OsBC1L which extensively co-expressed with OsCESA/CSL can be divided into three major groups
with ten subgroups, each showing a distinct co-expression in tissues representing typically distinct cell wall
constitutions. In particular, OsCESA1, -3 & -8 and OsCESA4, -7 & -9 were strongly co-expressed in tissues typical of
primary and secondary cell walls, suggesting that they form as a cellulose synthase complex; these results are
similar to the findings in Arabidopsis. OsCESA5/OsCESA6 is likely partially redundant with OsCESA3 for OsCESA
complex organization in the specific tissues (plumule and radicle). Moreover, the phylogenetic comparison in rice,
Arabidopsis and other species can provide clues for the prediction of orthologous gene expression patterns.
Conclusions: The study characterized the CESA/CSL of rice using an integrated approach comprised of phylogeny,
transcriptional profiling and co-expression analyses. These investigations revealed very useful clues on the major
roles of CESA/CSL, their potentially functional complement and their associations for appropriate cell wall synthesis
in higher plants.
Background
Plant cell walls make up the most abundant renewable
biomass on the earth. Of the main wall polysaccharides,
cellulose is synthesized at the plasma membrane
whereas non-cellulosic polysaccharides (pectins and
hemicelluloses) are made in the Golgi body. In higher
plants, CESA was first isolated from developing cotton
fibers, and it was further characterized in Arabidopsis as
catalytic subunits of cellulose synthase complexes
(CSCs) that locate within the plasma membrane [1,2].
The CSCs are believed to be a rosette structure holding
as many as 36 individual CESA prote ins. In Arabidopsis,
at least three CESA isoforms are required for the synth-
esis of primary (AtCESA1, -3 & -6) and secondary
(AtCESA4, -7 & -8) cell walls. Mutant and co-immuno -
precipitation analysis demonstrates that AtCESA2 & -5
are partially redundant with AtCESA6 [3-5]. Conse-
quently, the CESA family has been identified in other
plants, such as maize [6], barley [7], poplar [8,9], pine
[10], moss [11] and rice [12]. Those higher plants
appear to have many more CESA family members, but
* Correspondence:
† Contributed equally
1
National Key Laboratory of Crop Genetic Improvement, Biomass and
Bioenergy Research Centre, Huazhong Agricultural Univ ersity, Wuhan, Hubei,
430070, PR China
Full list of author information is available at the end of the article
Wang et al. BMC Plant Biology 2010, 10:282
/>© 2010 Wang et al; licensee BioMed Central Ltd. This is an Open Access article distributed under the terms of the Creative Commons
Attribution License ( which permits unrestricted use, distribu tion, and reproduction in
any medium, provided the original work is properly cited.
very little is known about their functions in comparison
to those from Arabidopsis.
A large number of cellulose synthase-like (CSL)genes
showing sequence similarity to CESA have been identi-
fied. In Arabidopsis, a total of 30 CSL genes are classified
into the six following families: CSLA, B, C, D, E and G
[13]. Based on the common motif DXD, D, Q/RXXRW,
all CSL proteins are predicted to encode processive gly-
cosyl transferases (GTs) [14-17]. There are increasing
lines of evidence supporting CSL as catalytic enzymes for
non-cellulosic polysaccharide synthesis. In Arabidopsis
and guar, genes of the CSLA family are demonstrated to
encode (1,4)-b-D-mannan synthases [16-19]; in rice,
genes of the CSLF family have been implicated in the bio-
synthesis of (1,3;1,4)-b-D-glucans [20]. More rec ently, it
has also been established that barley CSLH genes, like
CSLF, are able to direct mixed-linkage b-glucan biosynth-
esis [21]. In addition, the CSLC family contains a glucan
synthase involved in the synthesis of the backbone of
xyloglucan [22,23], and several CSLD mutants have been
characterized for their potential roles in wall polysacchar-
ide (xylan and homogalacturonan) synthesis [24-27].
However, even though there are a numb er of CSLD
mutants in Arabi dopsis and rice displaying interesting
phenotypes, very little is known about the biochemical
function(s) of CSLD proteins. The detailed functions of
these CSL genes, especially those of families CSLB, E and
G, remain to be clarified.
Rice, one of the major food crops across the world, is a
model species for the functional genomic characterization
of monocotyledonous plants. With the completion of the
rice genome sequence, t he CESA/CSL superfamily has b een
identified in rice />updates.htm. This ri ce superfamily has shown a striking dif-
ference in the CSL families between rice and Arabidopsis,
reflecting the distinct cell wall compositions of dicots and
monocots [28]. In contrast, several orthologs of the AtCSL
genes exhibited a similar function in rice [29]. But, the
OsCESA/CSL functions still remain largely unknown.
In this work, we utilized an innovative approach for
the characterization of genes of the CESA/CSL super-
family in higher plants. We first performed a phyloge-
netic and structural analysis to determine their potential
functions. Then, we focused on an integrative analysis of
co-expression profiling and regulations using 33 tissue
samples from the entire life cycle of two rice varieties.
We further carried out a comparati ve analysis of CESA/
CSL in rice and Arabidopsis.
Methods
Database searches for OsCESA/CSL genes in rice
The Hidden Markov Model (HMM) profile of the cellu-
lose synthase domain (PF03552) was downloaded from
PFam We employed a name
search and the protein family ID PF03552 for the identi-
fication of OsCESA/CSL genes from the rice genome.
Information about the chromosomal localization, coding
sequence (CDS), amino acid (AA) and full length cDNA
accessions was obtained from TIGR
and KOME The
correspondi ng protein sequences were confirmed by the
Pfam database />search.shtml.
Sequence and structure analysis
We performed our exon-intron structure analysis using
GSDS u.cn/[30]. The protein trans-
membrane helices were predicted by the TMHMM Ser-
ver V2.0 />[31,32]. Protein subcellular locations were analyzed using
WoLF PSORT [33], an extension
of the PSORT II program .
Phylogenetic analyses and motif identification
The multiple alignment analysis was performed using
the Clustal X program (version 1.83) [34] and MAFFT
[35]. The unrooted phylogenetic trees were constructed
with the MEGA3.1 program and the neighbor joining
method [36] with 1,000 bootstrap replicates. Protein
sequences were analyzed using the MEME program
for t he
confirmation of the motifs. The MEME program (ver-
sion 4.0) was employed with the following parameters:
number of repetitions, any; maximum number of motifs,
25; optimum motif width set to >6 and <200. The
motifs were annotated using the InterProScan http://
www.ebi.ac.uk/Tools/InterProScan/ search program.
Chromosomal localization and gene duplication
The OsCESA/CSL genes were mapped on chromosomes
by identifying their chromosomal positions gi ven in the
TIGR rice database. The duplicated genes were eluci-
dated from the segmental genome duplication of rice
/>The DAGchainer program [37] was used to determine
the segmental duplications with following parameters: V
= 5 B = 5 E = 1e-10-filter seg and distance = 100 kb.
Genes separated by five or fewer genes were considered
to be tandem duplicates. The distance between these
gene s on the chromosomes was calculated, and the per-
centage of protein sequence similarity was determined
by the MegAlign software 4.0.
Genome-wide expression analysis of OsCESA/CSL and
OsBC1L in rice and AtCESA/CSL and AtCOBL in
Arabidopsis
The expression profile data of OsCESA/CSL in 33 tissue
examples (Additional file 1) of Zhenshan 97 (ZS97) and
Wang et al. BMC Plant Biology 2010, 10:282
/>Page 2 of 16
Minghui 63 (MH63) were obtained from the CREP data-
base and from a rice transcriptome
project using the Affymetrix Rice GeneChip microarray
(Additional file 2). Massively parallel signature sequen-
cing (MPSS) data was used to
determine the expression profiles of the genes with con-
flicting probe set signals. The expression values were log-
transformed, and cluster analyses were performed using a
software cluster with Euclidean distances and the hier-
archical cluster method of “complete linkage clustering”.
The clustering tree was constructed and viewed in Java
Treeview. The same method was used in the “artificial
mutant” analysis. However, in the hierarchical cluster of
the “artificial mutant” analysis, the expression data for
regarding gene(s) or tissues were dele ted. All Arabidopsis
microarray data were downloaded from the Gene Expres-
sion Omnibus database />geo/ using the GSE series accession numbers GSE5629,
GSE5630, GSE5631, GSE5632, GSE5633 and GSE5634
(Additional file 3 and 4). Subseque nt analysis of the gene
expression data was performed in the statistical comput-
ing language R using packages
available from the Bioconductor project http://www.b io-
conductor.org. The raw data were processed with the
Affymetrix Microarray Analysis Suite (MAS Version 5,
Affymetrix) [38].
RT-PCR analysis of representative genes of the OsCESA/
CSLD family
The primers designed for the RT-PCR analysis are listed in
Additional file 5. Samples were collected from Zhenshan
97 (ZS97), one of the varieties used in microarray. The
samples were ground in liqu id nitro gen using a mortar
and pestle. Total RNA (4 μg) was isolated using a RNA
extraction kit (TransZol reagent, TransGen) and treated
with RNase-free DNase I (Invitrogen) for 15 min to elimi-
nate possible contaminating DNA. Then, first strand
cDNA was reverse transcribed from total RNA with an
oligo(dT)
18
primer in a 50 μl reaction (diluted to 200 μl
before use) using an M-MLV Reverse Transcriptase (Pro-
mega) according to the manufacturer’s instruction s. For
the PCR amplification of the reverse transcription product,
the PCR reaction was performed in a volume of 25 μlcon-
taining 2 μl of template. The reactions were conducted
with rTaq polymerase (Takara Biotechnology, Japan) on a
Bio-rad MyCycler thermal cycler using the following pro-
gram: 3 min at 95°C for pre-denaturation, followed by 29
cycles of 20 s at 95°C, 20 s at 60°C and 30 s at 72°C, and a
final 5 min extension at 72°C.
Plant cell wall fractionation and polysaccharide
colorimetric assays
The plant tissues were firstly heated at 110-120°C for
about 10 min to inactivate the enzymes, before they
were fully ground in a mortar and pestle with liquid
nitrogen and dried to constant weight at 65°C for about
2 days. The extraction and fractionation of the cell wall
polysaccharides were perform ed with 0.5 M phosphate
buffer, chloroform-methanol (1:1, V/V), DMSO-water
(9:1, V/V), 0.5% ammonium oxalate, 4 M KOH, acetic
acid-nitric acid-water (8:1:2, V/V/V) and 72% (w/w)
H
2
SO
4
, and the extraction was measured using colori-
metric assays according the method reported in a pre-
vious study [39].
Results
OsCESA/CSL superfamily in rice
Searching the TIGR database revealed 45 sequences
that significantly matched to CESA/CSL superfamily,
out of which eleven are predicted as OsCESA an d 34
as OsCSL />htm (Table 1). The sequences of OsCESA10 were short
and appeared to be truncated. Of the 11 OsCESA
sequences, CESA 1-9 contained a cellulose synthas e
domain (CS) and zinc finger structure, whereas CESA
10 & -11 only harbored a CS domain. When referring
to the CSL classification in Arabidopsis,the34OsCSL
proteins with a CS domain could be divided into six
groups (Table 1). In addition, 31 genes had KOME
cDNA support, and probes for 41 genes could be
found in the CREP database (Table 1). T he “DXD, D,
QXXRW” motif is typically in the OsCESA/CSL family,
but OsCSLA10 and OsCSLE2 showed alternative
motifs ("DXD, D, RXXRW” and “DXD, D, LXXRW”);
OsCESA10, 11 and CSLH3 contained only “DXD” and
lacked “ D, LXXRW” (Additional file 6). Besides the
“ DXD, D, LXXRW” motif, some novel conserved
amino acid residues (G, E, G, P and G) w ith unknown
biochemical functions were also detected in this
region.
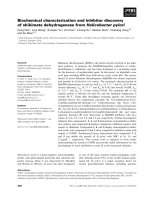
Structural and phylogenetic analyses of OsCESA/CSL
An unrooted phylogenetic tree was generated from the
alignments of 45 OsCESA/CSL protein sequences with
two distinct clusters (Figure 1). Cluster I was resolved
into five branches, namely Cluster IA (OsCESA), Cluster
IB (OsCSLD), Cluster IC (OsCSLF), Cluster ID
(OsCSLE) and Cluster IE (OsCSLH), whereas Cluster II
had two branches, Cluster IIA (OsCSLA) and Cluster
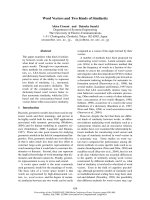
IIB (OsCSLC). In Cluster I, OsCESA had t he most
introns, and the OsCSLD had the fewest number of
introns. In Cluster II, OsCSLA had more introns than
OsCSLC. The analysis of motif composition was in
agreement with the above OsCESA/CSL family classifi-
cation (Additional files 7 and 8). Of the total 25 motifs
predicted, Cluster I contained 18 motifs and Clust er II
had 10 conserved motifs, of which three were in
common.
Wang et al. BMC Plant Biology 2010, 10:282
/>Page 3 of 16
Table 1 List of the 45 OsCESA/CSL genes identified in rice
No. Genes Accession Number Probsets
a
Protein characteristics
TIGR Loci KOME cDNA Pred Hel
b
Domains
c
1 OsCESA1 LOC_Os05g08370 AK100188 Os.10183.1.S2_at 8 Zinc finger, CS (PF03552)
2 OsCESA2 LOC_Os03g59340 AK069196 Os.14979.1.S1_at 6 Zinc finger, CS (PF03552)
3 OsCESA3 LOC_Os07g24190 AK073561 Os.10178.2.S1_a_at 8 Zinc finger, CS (PF03552)
4 OsCESA4 LOC_Os01g54620 AK100475 Os.18724.2.S1_x_at 8 Zinc finger, CS (PF03552)
5 OsCESA5 LOC_Os03g62090 AK100877 Os.4857.1.S1_at 8 Zinc finger, CS (PF03552)
6 OsCESA6 LOC_Os07g14850 AK100914 Os.10926.1.S1_at 8 Zinc finger, CS (PF03552)
7 OsCESA7 LOC_Os10g32980 AK072259 Os.3206.1.S1_at 6 Zinc finger, CS (PF03552)
8 OsCESA8 LOC_Os07g10770 AK072356 Os.10176.1.S1_at 6 Zinc finger, CS (PF03552)
9 OsCESA9 LOC_Os09g25490 AK121170 Os.10206.1.S1_at 6 Zinc finger, CS (PF03552)
10 OsCESA10 LOC_Os12g29300 NF / 0 CS(PF03552)
11 OsCESA11 LOC_Os06g39970 NF OsAffx.15853.1.S1_at 6 CS(PF03552)
12 OsCSLA1 LOC_Os02g09930 AK102694 Os.24972.1.S1_at 5 GT family 2 (PF00535)
13 OsCSLA2 LOC_Os10g26630 NF Os.15231.1.S1_at 5 GT family 2 (PF00535)
14 OsCSLA3 LOC_Os06g12460 NF OsAffx.15389.1.S1_at 5 GT family 2 (PF00535)
15 OsCSLA4 LOC_Os03g07350 NF OsAffx.12764.2.S1_x_at 5 GT family 2 (PF00535)
16 OsCSLA5 LOC_Os03g26044 AK111424 Os.56873.1.S1_at 6 GT family 2 (PF00535)
17 OsCSLA6 LOC_Os02g51060 AK058756 Os.6170.1.S1_at 5 GT family 2 (PF00535)
18 OsCSLA7 LOC_Os07g43710 AK122106 Os.8080.1.S1_at; Os.8080.2.S1_x_at 6 GT family 2 (PF00535)
19 OsCSLA9 LOC_Os06g42020 AK242831 Os.48268.1.S1_at 5 GT family 2 (PF00535)
20 OsCSLA11 LOC_Os08g33740 NF OsAffx.6015.1.S1_at 5 GT family 2 (PF00535)
21 OsCSLC1 LOC_Os01g56130 AK110759 Os.29016.1.S1_at 5 GT family 2 (PF00535)
22 OsCSLC2 LOC_Os09g25900 NF Os.18770.1.S1_at 4 GT family 2 (PF00535)
23 OsCSLC3 LOC_Os08g15420 AK108045 Os.55417.1.S1_at 4 GT family 2 (PF00535)
24 OsCSLC7 LOC_Os05g43530 AK243206 Os.15705.1.S1_x_at 2 GT family 2 (PF00535)
25 OsCSLC9 LOC_Os03g56060 AK121805 Os.10855.1.S1_at 3 GT family 2 (PF00535)
26 OsCSLC10 LOC_Os07g03260 NF OsAffx.28245.1.S1_at 2 GT family 2 (PF00535)
27 OsCSLD1 LOC_Os10g42750 AK110534 Os.46811.1.S1_at 8 CS (PF03552)
28 OsCSLD2 LOC_Os06g02180 AK105393 Os.25614.1.S1_at 6 CS (PF03552)
29 OsCSLD3 LOC_Os08g25710 NF OsAffx.17155.1.S1_x_at 6 CS (PF03552)
30 OsCSLD4 LOC_Os12g36890 AK242601 Os.57510.1.S1_x_at; Os.57510.1.A1_at 6 CS (PF03552)
31 OsCSLD5 LOC_Os06g22980 AK072260 Os.53359.1.S1_at 8 CS (PF03552)
32 OsCSLE1 LOC_Os09g30120 AK102766 Os.6165.1.S1_a_at 5 CS (PF03552)
33 OsCSLE2 LOC_Os02g49332 AK101487 Os.20406.3.S1_x_at; Os.20406.1.S1_a_at 7 CS (PF03552)
34 OsCSLE6
LOC_Os09g30130 AK068464 / 8 CS (PF03552)
35 OsCSLF1 LOC_Os07g36700 NF / 8 CS (PF03552)
36 OsCSLF2 LOC_Os07g36690 AK100523 Os.15704.1.S1_at 8 CS (PF03552)
37 OsCSLF3 LOC_Os07g36750 NF OsAffx.5550.1.S1_at 8 CS (PF03552)
38 OsCSLF4 LOC_Os07g36740 NF / 7 CS (PF03552)
39 OsCSLF6 LOC_Os08g06380 AK065259 Os.9709.1.A1_at; Os.9709.2.S1_at 9 CS (PF03552)
40 OsCSLF7 LOC_Os10g20260 AK110467 Os.46814.1.S1_at 7 CS (PF03552)
41 OsCSLF8 LOC_Os07g36630 AK067424 Os.52482.1.S1_at 8 CS (PF03552)
42 OsCSLF9 LOC_Os07g36610 AK242890 OsAffx.16586.1.S1_x_at 8 CS (PF03552)
43 OsCSLH1 LOC_Os10g20090 AK069071 Os.11623.1.S1_a_at 6 CS (PF03552)
44 OsCSLH2 LOC_Os04g35020 NF Os.45970.1.S1_at 8 CS (PF03552)
45 OsCSLH3 LOC_Os04g35030 NF Os.26822.1.S1_at 2 CS (PF03552)
a Probeset ID of OsCESA/CSL genes
b The number of transmembrane helices predicted by the TMHMM server V2.0
c CS, cellulose synthase; GT, glycosyl transferase
Wang et al. BMC Plant Biology 2010, 10:282
/>Page 4 of 16
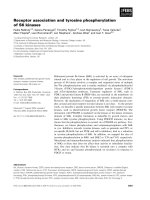
Tandem and segmental genome duplications of OsCESA/
CSL
The OsCESA/CSL members are distributed on 12 chro-
mosomes of rice (Figure 2). As reported by Burton et al.
(2006) [20], members of the OsCLSF (9, 8, 2, 1, 4,&3)
are physically linked within a region of approximately
118 kb of rice chromosome 7. We discovered two addi-
tional tandem duplication sets (OsCSLH2/CSLH3 and
OsCSLE1/CSLE6) and seven segmental duplication sets
(OsCESA2/CESA8, OsCSLA1/CSLA9, OsCSLA2/CSLA4,
OsCSLA5/CSLA7, OsCSLA6/CSLA3, OsCSLC9/CSLC10
and OsCSLE2/CSLE6)thatwereassignedtotheTIGR
segmental duplication blocksatamaximallengthdis-
tance permitted between collinear gene pairs of 100 kb.
In most sets, both members (genes) in a segmental
duplication set were from same family. The extreme
Figure 1 Unrooted tree of OsCESA/CSL protein family (A) and organization of exons and introns of the corresponding genes (B).
Wang et al. BMC Plant Biology 2010, 10:282
/>Page 5 of 16
example i s from CSLA family; eight of nine members i n t his
family are in duplicated regions. Moreover, most of the
duplicated genes have a relatively close phylogenetic rela-
tionship; in particula r, in the four sets OsCESA2/CESA8,
OsCSLA2/CSLA4, OsCSLA5 /CSLA7,andOsCSLC9/CSLC1 0,
two member genes are phylogenetically closest to each
other (Figure 1A). Interestingly, the two pairs of segmental
sets (OsCESA2/CESA8 and OsCSLC9/CSLC10) join closely
in two chromosomes (Figure 2). Of the 45 OsCESA/CSL
genes, 23 are involved in duplication events. Therefore, seg-
mental and large-scale tandem duplication events contribu-
ted largely to the expansion of this superfamily. Cluster I
families were mainly attributed to tandem duplication,
whereas Cluster II likely resulted from segmental genome
duplication.
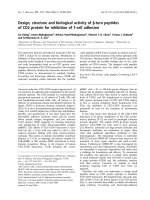
OsCESA/CSL expressions
A microarray analysis was conducted for the expression of
OsCESA/CSL genes in two rice varieties (Additional file 2),
and the expression patterns of OsCESA and OsCSLD
families were further verified by RT-PCR analysis (Fi gure
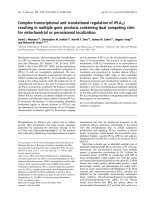
3, Additional file 9). We also demonstrated the expression
of OsCESA/CSL genes in both individual and collective
levels (Figure 4). Generally, OsCESA genes, with the
exception of the OsCESA11, exhibited an extensively high
expression in most of the tissues examined; in particular,
OsCESA1 and OsCESA3 demonstrated extremely high
expression in many tissues over different developmental
stages of the life cycle (Figures 3 and 4). In addition, the
accumulative OsCESA expression levels were highest in
the stem and root, but were relatively low in the flag leaf
and stamen (Figure 4). Of the OsCSL families, six OsCSL
members (CSLA1, CSLC9, CSLD2, CSLE1,CSLF6 and
CSLH1) were expressed in all of the tissues examined. In
contrast, other OsCSL genes showed tissue-specific expres-
sion. For instance, CSLD3 &-5, CSLH2 and CSLC 9
showed high stamen-specific expression, whereas CSLA5,
CSLD1 and CSLD4 were specific in the endosperm, radicle
and plumule, respectively. The accumulative expression of
all the CSL genes in a family is also depicted in Fi gure 4.
The overall expression of the family of CSLD genes is
highest in the stamen and lowest in the shoot of seedlings
with two tillers. The total expression of the CSLA genes
was highest in plumules (mostly contributed by CSLA1
and 6) and was followed by high expression in radicles
(roots) and calli, with the lowest expression detected in
flag leaves. The total expression of CSLC was higher in the
stamen and plumule/radicles, but was lower in leaves. Col-
lectively the expression of the genes of the whole family
often accumulated to high levels in one or more of the tis-
sues for which the CSL members showed preferences.
This may indicate functional homoplasy among the mem-
bers in a family although most of them exhibit different
expression patterns.
Expression divergence of OsCESA/CSL genes in
duplication
We further observed the expression profiling of the dupli-
cated OsCESA and OsCSL gen es. The expre ssion of the
two duplication sets OsCSLE1/OsCSLE6 and OsCSLE2/
OsCSLE6 were not included in the analysis because we
lacked the corresponding probe set of OsCSLE6.The
expression profile of the eight remaining sets of OsCESA/
CSL genes (two tandem duplication sets and six segmental
duplication sets) with the corresponding probes was ana-
lyzed. We found a divergent expression pattern within a
0
5
10
15
20
25
30
35
40
Chr1 2 3 4 5 6 7 8 9 10 12
CSLF8
CSLF3
CESA6
CESA3
CSLF2
CSLF4
CSLC10
CESA8
CSLF9
CSLF1
CSLA7
CESA4
CSLC1
CSLA1
CSLE2
CSLA6
CSLA4
CSLA5
CSLC9
CESA2
CESA5
CSLH2
CSLH3
CESA1
CSLC7
CSLD2
CSLA3
CSLD5
CESA11
CSLA9
CSLF6
CSLC3
CSLD3
CSLA11
CSLE1
CESA9
CSLC2
CSLE6
CESA1
0
CSLD4
CSLH1
CESA7
CSLD1
CSLF7
CSLA2
Figure 2 Chromosomal distribution, and tandem and segmental genome duplications of the OsCESA/CSL gene family. The scale on the
left is in megabases (Mb). The ovals on the chromosomes (vertical bars) indicate the positions of centromeres; the chromosome numbers are
shown on the top of each bar. The segmental duplication genes are connected by a straight broken line, and the tandem duplicated genes are
colored.
Wang et al. BMC Plant Biology 2010, 10:282
/>Page 6 of 16
duplicated set (Figure 5). The pairwise expression correla-
tion coefficients (r values) of the duplicated OsCESA/CSL
genes were below the level of significance at P = 0.05 (data
not shown). Of the nine gene sets, only CSLA2 and CSLA4
in a segmental duplication set (CSLA2/CSLA4)exhibiteda
relatively similar expression pattern. The fate of four pairs
(CSLH2/CSLH3, CESA2/CESA8,andCSLC9/CSLC10)
could be described as nonfunctionalization, where one
member of the set lost expression in all tissues, while the
other sho wed strong expression. In the other duplicat ion
sets, the expres sion patterns of both member genes were
partial complementary and/or overlapped. Comparison of
expression pattern shifts of the duplicated g enes of the
OsCESA/CSL superf amily could ref lect the divergenc e
hypotheses that a duplicate gene pair might be involved in:
nonfunctionalization, subfunctionalization and neofunctio-
nalization [40].
OsCESA/CSL co-expression profiling
Because many genes of COBRA-like proteins, including the
brittle culm1 like family (OsBC1L), have been investigated
for cell wall biosynthesis in Arabidopsis and rice [41-44],
the OsBC1L genes were referred as markers of OsCESA/
CSL co-expression patterns i n this study. Based on the hier-
archical cluster analysis, the OsCESA/CSL family can be
classified into three major groups with ten distinct groups
that exhibit a complementary expression pattern spanning
33 tissues from entire life cycle of two rice varieties (Figure
6). Each group consists of multiple OsCESA/CSL members,
which show predominant co-expression in tissues with dis-
tinct cell wall constitutions (Table 2).
Generally, Group I A s howed high co-expression in the
young vegetative tissues (M7/Z7-M11/Z11) typical of the
primary cell wall, and Group IB exhibited additional co-
expression in other vegetative tissues (e.g., seedlings,
young shoots and stems). Five OsCESAs (5, -6 and 1, -3,
-8) were strongly co- expressed in those two groups, sug-
gestingthatOsCESA1,-3&-8mayformacellulose
synthase complex for primary cell wall biosynthesis. How-
ever, while OsCESA1 and OsCESA8 are tightly co-
expressed, there are some differences in expression
between OsCESA3 and OsCESA1 &-8 (Figure 6). We
observed that OsCESA3 had exceptionally low expression
in the plumule and radicle (M8/Z 8-M11/Z11), where the
expression of OsCESA5/OsCESA6 is relatively high (Figure
6). This observation might indicate t he partial comple-
mentation of OsCESA3 by OsCESA5 &-6 in the expres-
sion pattern. In comparison to Group I, Group II showed
co-expression in three tissues rich in secondary cell walls
(old panicle, hull and spikelet) (Figure 6). However, three
OsCESAs (CESA4, -7 & -9) in the group also showed a co-
expression pattern that overlapped with Group IB in
young and old stem tissues, which represent the transition
stage from primary to secondary cell wall synthesis. Thus,
OsCESA4, -7 & -9 may be organized as a cellulose
synthase complex involved in secondary cell wall synthesis.
In contrast, Group III appeared to show co-expression in
diverse tissues harboring spec ific cell wall stru ctures. For
instance, five OsCSL genes of Group IIIB demonstrated
high co-expression in the stamen (M31/Z31), a tissue that
contains extremely high levels of pectins (Table 2), and
Group IIIC showed co-e xpressions in four early stages of
panicle development. Co-expression was detected between
the OsCESA and OsCSL families in all ten groups; we also
observed strong co-expression between the OsCESA/CSL
and OsBC 1L families in seven grou ps, each containing at
least one OsBC1L family gene. For instance, OsBC1 and
OsBC1L5 both have correlation coefficients (r values)
above 0.9 4 with respect to thei r releva nt OsCESA/CSL
genes. Interestingly, this extensive co-expression was only
found between BC1L and OsCESA/CSL.Thereareno
such extensive relationships found between OsCESA/CSL
OsCESA1
O
sCESA2
O
sCESA5
O
sCESA3
OsCESA4
O
sCESA8
O
sCESA6
OsCESA7
OsUBC2
C
a
ll
i
Se
e
d
(
w
i
t
h
e
m
b
r
y
o
b
u
d
)
R
a
d
i
c
l
e
H
u
l
l
An
t
h
e
r
Pl
u
m
u
l
e
Yo
u
n
g
p
a
n
i
c
l
e
I
n
t
e
r
n
o
d
e
N
o
d
e
O
l
d
r
o
o
t
s
L
e
a
ve
s
Sh
e
a
t
h
s
Germination
stage
Tillering
stage
Heading
stage
OsCSLD2
OsCSLD3
OsCSLD1
OsCSLD4
OsCSLD5
Figure 3 OsCESA and OsCSLD gene expression patterns b y
RT-PCR analysis.
Wang et al. BMC Plant Biology 2010, 10:282
/>Page 7 of 16
with other gene families, such as cellulase (including Kor-
rigan), lignins and expansins (data not shown).
Comparative co-expression analyses with Arabidopsis
Using the Arabidopsis public database, we presented a
co-expression profiling of 63 tissue samples, and com-
pared it with rice (Figure 7, Table 3). Based on hierarch-
ical clustering, the expression pattern of the AtCESA/
AtCSL genes could also be divided into three major
groups (Figure 7). In contrast, the expression patterns of
the CESA/CSL genes in both species are summarized in
Table 3. Clearly, the expression patterns of the genes of
the AtCESA/AtCSL superfamily fell into g roups similar
to those of the OsCESA/CSL genes. As an example of
genes showing a similar expression pattern, AtCESA1, -3
&-6showed high co-expression in the tissues of the
primary cell wall, whereas AtCESA4, -7 & -8 were co-
expressed in the secondary cell wall tissues. As an exam-
ple of genes showing a different expression pattern,
there was no AtCESA gene, like OsCESA3,showingan
exceptionally low expression level. In addition, distinct
CSL co-expressions were compared between rice and
&6/'
&6/'
&6/'
&6/'
&6/'
&6/(
&6/(
&6/)
&6/)
&6/)
&6/)
&6/)
&6/)
&6/+
&6/+
&6/+
&6/$
&6/$
&6/$
&6/$
&6/$
&6/$
&6/$
&6/$
&6/$
&6/&
&6/&
&6/&
&6/&
&6/&
&6/&
&(6$
&(6$
&(6$
&(6$
&(6$
&(6$
&(6$
&(6$
&(6$
&(6$
Figure 4 Accumulative expressions of OsCESA/CSL genes in representative tissues of rice. The y-axis indicates the relative expression level
of the genes (signal values from the microarray data) and it is arbitrary. The x-axis indicates the tissues across development stages with 1-3: Calli;
4: Seed imbibition; 5: Young panicle stages 3-5; 6: Young panicle; 7: Plumule; 8: Stem; 9: Young leaf and root; 10: Shoot; 11: Radicle and root; 12:
Stamen; 13: Flag leaf; 14: Endosperm 1, 2, 3; 15: Sheath; 16: Old Leaf; 17: Hull; 18: Old panicle; 19: Spikelet.
Wang et al. BMC Plant Biology 2010, 10:282
/>Page 8 of 16
Arabidopsis (Table 3). For example, a group of IC genes
(AtCSLG1, -2,&-3 and AtCSLB2) was specifically
expressed in flower organs (carpels or sepals) in Arabi-
dopsis, while the OsCSLF genes (OsCSLF2 &-7)were
preferentially expressed in the hull o f rice. Thus, the
gene expression pattern may reflect both the similari ties
and differences in the cell wall composition of rice and
Arabidopsis.
Discussion
The previous characterization of the rice OsCESA/CSL
family was focused on phylogenetic a nd gene structure ana-
lyses [1 2,28]. Hazen et al. (2002) identified 37 OsCSL genes
[28]; h owever, some of the CSL genes are pseudogenes, and
these h ave now been updated />CSL_updates.htm. F or examples, CSLC4, -5, -6 &-8 were
verified as pseudogenes and were not included in this study.
&6/+
&6/+
&6/)
&6/)
&6/)
$
&6/$
&6/$
&6/$
&6/$
&6/$
&6/$
&6/&
&6/&
&(6$
&(6$
&6/$
&6/$
%
Figure 5 Expression patterns of the CESA/CSL genes as tandem duplicates (A) and segmental duplicates (B) in rice. The x-axis represents
the developmental stages as given in Additional file 1. The y-axis represents the raw expression values obtained from the microarray analysis.
Wang et al. BMC Plant Biology 2010, 10:282
/>Page 9 of 16
The OsCSLA8 (LOC_Os09g3992 0.1) gene w as recently
annotated as a retrotransposon in TIGR version 6.1, while
OsCSLA10 (DAA01745.1) identified in the NCBI database
was actually the same as OsCSLA4 and now has been
excluded. These updated OsCESA/CSL genes were
indentified and characterized in this study. We performed
expression, co-expression and comparative co-exp ression
analyses of this superfamily. The results, coupled with the
bioinformatic analysis of phylogeny, gene structure, motif
constitution, genome organization and gene duplication,
Figure 6 OsCESA/CSL co-expression profiling in rice . The color scale representing the relative signal values is shown above (green refers to
low expression; black refers to medium expression and red refers to high expression). Genes of the brittle culm 1 like family (OsBC1L) were
marked with asterisks.
Table 2 Cell wall composition (%) of seven representative tissues in rice
Tissues Cellulose Hemicelluloses Pectins
Hexose Pentose Total Hexose Pentose UroA Total
Calli 23.8
(4.2)*
35.1 64.9 65.4
(11.5)
23.0 23.9 53.0 10.8
(1.9)
Seedling leaves 48.8
(15.7)
31.1 68.9 44.8
(14.4)
33.1 26.5 40.4 6.4
(2.1)
Seedling roots 54.0
(20.5)
35.1 64.9 42.5
(16.1)
45.3 30.9 23.8 3.5
(1.3)
Young stem 33.8
(11.1)
64.0 36.0 63.5
(20.9)
34.5 27.5 38.0 2.7
(0.9)
Old stem 38.3
(20.6)
67.3 32.7 60.1
(32.3)
30.3 21.1 48.5 1.7
(0.9)
Hull 56.4
(26.6)
22.7 77.3 41.1
(19.4)
36.1 30.1 33.8 2.5
(1.2)
Stamen 29.7
(2.3)
24.9 75.1 29.0
(2.3)
34.3 30.0 35.7 41.3
(3.3)
* % of wall polysaccharide based on the tissue dry weight; the absolute values are bracketed.
Wang et al. BMC Plant Biology 2010, 10:282
/>Page 10 of 16
could provide an innovative approach and important clues
toward understanding the roles of the CESA/CSL super-
family in cell wall biosynthesis in higher plants.
CESA/CSL evolution and classification
In principle, gene families are extended by three major
mechanisms: segmental duplication, tandem duplication
and retroposition [45,46]. Here we confirmed that both
tandem and segmental duplication events were largely
responsible for the expansion of the OsCESA/CSL
family. Interestingly, we characterized two clusters of
OsCESA/CSL and concluded that they not only differ in
phylogeny and motif constitution, but that they also
expanded in the following distinct ways: Cluster I
(OsCESA/CSLD, E, F and H) arose mainly from the tan-
dem duplication, and Cluster II (CSLA/CSLC)resulted
from the segmental duplication. These results support a
previous report claiming that CSLA/CSLC has a differ-
ent evolutionary origin compared to other CSL families
[12]. In terms of the duplicated gene expression, we
observed that two genes in a duplication set show a
strongly contrasting expression pattern. The fate of
duplicated genes in OsCESA/CSL could be described as
nonfunctionalization, subfunctionalization and neofunc-
tionalization. None of the genes in a segmental duplica-
tion set have similar expression patterns. The latter
findings are consistent with a previous report whereby
growth-related genes were sensitive to high dosage of
gene expressions, and stress responsive genes were tol-
erant to high dosage [47].
The comparison of the CESA expression patterns
among seven plant species (rice, barley, maize, poplar,
cotton, eucalyptus an d Arabidopsis)isdepictedinthe
unrooted neighbor-joining tree (Additional file 10).
Most clusters contain genes from both monocot and
dicot plants, and most orthologs show a higher similar-
itythanparalogsintheCESA family, indicating that
some gene expansion may have arisen earlier than when
the divergence(s) of the species occurred. The latter
result is supported by reports whereby the orthologous
genes in a cluster show a similar expression pattern in
primary and secondary cell walls [48,49]. Furthermore,
Figure 7 AtCESA/CSL gene co-expression profiling in Arabidopsis. The color s cale representing the relative signal values is shown above
(green refers to low expression; black refers to medium expression and red refers to high expression). Genes of the COBRA like family were
marked with asterisks.
Wang et al. BMC Plant Biology 2010, 10:282
/>Page 11 of 16
we compared the expression patterns of some CSL
homologs in Arabidopsis, rice, barley and other species,
and a striking similarity was observed in the close ortho-
logous genes across species (Additional file 11). We also
observed similarities of CSL orthologs in other aspects
such as gene duplication and intron-exon structure
(data not shown). Thus, such observations could be
helpful in the prediction of gene expression pa tterns of
orthologs in cereal species and other higher plants.
Analysis of OsCESA functions
Patterns of co-expression can reveal networks of func-
tionally related genes and provide a deeper understand-
ing of the pro cesses required to produce mult iple gene
products [50]. The genome-wide expression analysis of
the CESA family could provide insights into the poten-
tial functions of its members in cell wall biosynthesis.
Almost all OsCESA ge nes are highly expressed in the
tissues we examined, confirming their major roles in the
biosynthesis of cellulose, the main component of plant
cell walls. The co-expression profiling of the CESA
genes can somehow indicate their protein interaction/
association as an essential synthase complex for cellu-
lose biosynthesis. Despite the use of the mutant analysis
and co-immunoprecipitation in Arabido psis [3,5,51], the
application of these approaches in the identification of
the CESA complex in other higher plants, such as rice,
maize and barley has not been reported.
In this work, therefore, we utilized an alternative
approach via the integrative analysis of gene co-expres-
sion profiling and developmental regulations. First, we
confirmed the formation of two distinct cellulose
synthase complexes, AtCESA1, -3, & -6 and AtCESA4,
-7, & -8, in Arabidopsis from our AtCESA co-expression
profiling data (Figure 7). Similarly, we can assume t hat
OsCESA1, -3 & -8 and OsCESA4, -7 & -9 may be two
synthase complexes involved in primary and secondary
cell wall synthesis in rice, respectively (Figure 6, Table
2), which provides clues on the physical interactions of
proteins in the synthase complexe s. The co-expression
profiling in Arabidopsis in this study, however, could
not further verify the previous finding of AtCESA6 as
partial redundant gene with AtCESA2 & -5 [4,5], prob-
ably because of the lack of essential expression data o f
Arabidopsis tissues from the public microarray data
(Figure 7). Similarly, we could assume OsCESA3 to be a
partiallyredundantcandidategenewithOsCESA5/
OsCESA6 given its low transcript level in specific tissues
(plumule and radicle), where the expression of
OsCESA5/OsCESA6 is relatively high (Figure 6). In other
words, OsCESA5 or -6 may be partially redundant w ith
OsCESA3 in those specific tissues. Eventually, we
Table 3 Comparison of CESA/CSL co-expression in rice and Arabidopsis
Rice Arabidopsis
Groups Tissues Genes Groups Tissues Genes
Preferential expression in young vegetative tissues
IA Youngest seedling (w/o
root)
CESA5,6; CSLC1,7; CSLD4 IIIC Youngest seedling (w/o root) CESA5; CSLC4; CSLA3,7
IB Young seedling (w/root) CESA1,3,8; CSLF6,8; CSLC2;
BC1L14
IIID Young seedling (w/root) CESA1,3,6,2; COB
Preferential expression in reproductive stages
/ / / IA Seed, silique CESA9,10; COBL2,6
IIA(a) Hull CSLF2, 7 Silique CSLC5
IIA(b) Stem, hull CESA4,7,9; BC1 IB Stem, silique CESA4,7,8;COBL4
/ / / IC Flowers(sepals) CSLG2,3; CSLB2
/ / / Flowers(Carpels) CSLG1
IIB Flag leaf and sheath CSLE1; CSLH3; CESA11 // /
IIC Flag leaf and endosperm CSLA3,6,11; BC1L9 // /
Preferential expression in tissues undergoing rapid extension
/ / / IIA Shoot apex, Cauline leaf,
Carpel
CSLD5; CSLC8; CSLA15; COBL1,7
/ / / IIB Flowers (Carpels) CSLD6; CSLA1,2,10,11
IIIB Stamen and endosperm CSLC9,CSLD3,5; CSLH2; BC1L5 IIC Stamen (Pollen) CSLA9; CSLC6,12; CSLD1,4; COBL10,11
IIID Radicle and root CSLD1,2; CSLC3; CSLF3; BC1L1 IIIA, IIIB Roots CSLD2,3; CSLA14; CSLB3,4;COBL5,8,9;
CSLE1
IIIA Callus and young panicle CSLA2,4,7; CSLE2; CSLH1 // /
IIIC Young panicle CESA2,9; CSLC10; BC1L2 // /
IIIE Seed imbibition CESA1; CSLF9 -
“/” indicates no corresponding tissues or the unavailability of data
Wang et al. BMC Plant Biology 2010, 10:282
/>Page 12 of 16
demonstrated the partial redundancy of OsCESA5 or -6
with OsCESA3 b y a novel approach, the “ artificial-
mutant” analysis of gene co-expression profiling (Figures
8 and 9, Additional file 12 and 13). While OsCESA3 was
artificially deleted, the hierarchical cluster analysis
showed that OsCESA1 &-8 clustered together with the
OsCESA5 and OsCESA6. This result might indicate that
OsCESA1 & -8 form a synthase complex with OsCESA5
or OsCESA6 (Figure 8). However, deleting either
OsCESA1 or OsCESA8 did not disrupt the above organi-
zation (Figure 8). Even after the double deletion of
OsCESA3/OsCESA1 or OsCESA3/ OsCESA8 ,OsCESA5
and OsCESA6 could somehow still organ ize a complex
with either OsCESA1 or OsCESA8 (Figure 8). Clearly,
the data are in support of our assumption. When the
gene expression data in the plumule and radicle tissues
were not included in the hierarchical cluster analysis,
OsCESA1 &-8 could not form a group with OsCESA5 or
OsCESA6 when OsCESA3 was artificially deleted (Figure
9). Thus, we believe that partial redundancy occurs in
the specific development stages/tissues (such as plumule
and radicle) of rice.
Characterization of the OsCSL family
Several OsCSL genes were demonstr ated to exhibit rela-
tively tissue-specifi c expression, indicatin g their specific/
unique roles for wall polysaccharides synthesis or their
potentially functional complements for appropriate cell
wall synthesis. For instance, in the pectin-rich and cellu-
lose-less stamen tissue (Table 2), all OsCESAs have a
relatively low transcript level, but three OsCSLs
(OsCSLC9, OsCSLD5 and OsCslH2) exhibit specifically
high expression. In addition, all six OsCSL families
appear to have at least one highly expressed gene
(CSLA1, CSLC9, CSLD2, CSLE1,CSLF6 and CSLH1)in
all the tissues we examined, therefore suggesting that
the entire OsCSL family is essential for cell wall
biosynthesis.
The analysis o f co-expression profiling and develop-
mental regulations, together with a comparison with
Arabidopsis, can be used for the characterization of
OsCSLs. As described above, we concluded that ten co-
expressed groups are expressed in cells/tissues with dif-
ferent cell wall constitution. Based on this information,
we could find clues about the predominant roles of
OsCSL genes in cell wall biosynthesis. For example,
OsCSLF2 and OsCSLF7 in Group IIA may have quite a
different role from other OsCSLF genesinGroupsIB,
IIID an IIIE (Figure 6). OsCSLF2 and OsCSLF7 show a
uniquely high co-expression pattern with OsCESA4, -7
&-9in the hull/spikelet tissue typical of secondary cell
walls (Figure 6); however, they both have a much lower
transcript level than OsCSLF6 and OsCSLF8 (Figure 4).
Because there are pentose-rich hemicelluloses in the
hull tissue (Table 2), we assume that OsCSLF2 and
OsCSLF7 may also encode other synthase enzymes
besides the b-(1,3-1,4)-glucan synthase that was pre-
viously characterized. In addition, comparison of co-
expression profiling in the stamen tissue between rice
(Group IIIB) and Arabidopsis (Group IIC) suggests that
Figure 8 Gene co-expression profiling of OsCESA by “Arti ficial-
mutant” analysis in all the tissues examined.
Wang et al. BMC Plant Biology 2010, 10:282
/>Page 13 of 16
OsCSLH2 and AtCSLA 9 may play a similar or replace-
able role in cell wall synthesis (Table 3). We can also
infer the functional meanings from the developmental
regulations of t he gene expression. For an example, the
hig her expression of OsCSLD2 and OsCSLE1 was found
in older leaves versus young leaves. This result was
consistent with the report that AtCSLD2 and AtCSLE1
apparently exhibit strong increases in expression in old
leaves versus young leaves in Arabidopsis [25]. The
authors proposed that the changes in expression of
these two genes may reflect a ro le in homogalacturonan
synthesis, which accumulated to a high level in old
leaves. The availability of more detailed information
about cell wall composition (e.g., monosaccharide) will
help in establishing links between CESA/CSL proteins
and the carbohydrates they might synthesize.
Conclusions
Previous analysis of the functions of CESA/CS L mem-
bers on plant cell wall biosynthesis has been focused on
biochemical and genetic approaches in the model plant
Arabidopsis. Here, we performed a validated approach
that is applicable in higher plants and successful at find-
ing out useful clues on OsCESA/CSL protein interaction
or association. Our approach not only relies on a com-
prehensive phylogenetic analysis, but it also integrates
the characterization of co-expression profiling and regu-
lations, which can reveal very useful clues on the
dynamic organization of OsCESA proteins as distinct
cellulose synthase complexes in primary and secondary
cell wall biosynthesis. We also conclude that the co-
expression profiling of OsCESA/OsCSL and OsBC1L can
be associated with ten distinct groups in specific cell
wall polysaccharide synthesis. In a word, our results pro-
vide insights into functional analyses of CESA/CSL
family and of other GT families or cell wall-related
genes in rice and other higher plant species.
Additional material
Additional file 1: Tissues and developmental stages throughout the
life cycle of two rice varieties.
Additional file 2: Signal intensities of the probe sets for the
OsCESA/CSL and OsBC1L families.
Additional file 3: Tissues sampled from different developmental
stages throughout the life cycle of Arabidopsis.
Additional file 4: Signal intensities of the probe sets for the AtCESA/
CSL and AtCOBL families.
Additional file 5: Primers of the OsCESA/CSLD genes used for RT-
PCR analysis.
Additional file 6: Conserved amino acids in the “D, D, D, QXXRW”
motif (depicted in red) of OsCESA/CSL in rice.
Additional file 7: Motif composition of the OsCESA and CSL protein
families.
Additional file 8: Details of the 25 putative motifs.
Additional file 9: Expression patterns of the individual genes from
OsCESA (up) and OsCslD (below) families in representative tissues of
rice. The y-axis indicates the relative expression level of the genes (signal
values from the microarray data) and it is arbitrary. The x-axis indicates
the tissues across development stages with 1-3: Calli; 4: Seed imbibition;
5: Young panicle stages 3-5; 6: Young panicle; 7: Plumule; 8: Stem; 9:
Young leaf and root; 10: Shoot; 11: Radicle and root; 12: Stamen; 13: Flag
Figure 9 Gene co-expression profiling of OsCESA by “Arti ficial-
mutant” analysis; data from the plumule and radicle tissues
were excluded.
Wang et al. BMC Plant Biology 2010, 10:282
/>Page 14 of 16
leaf; 14: Endosperm 1, 2, 3; 15: Sheath; 16: Old Leaf; 17: Hull; 18: Old
panicle; 19: Spikelet.
Additional file 10: Unrooted phylogenetic tree subjected to the
alignment of the deduced amino acid sequences of the OsCESA
family genes with full-length CESA protein sequences from other
species.At=Arabidopsis thaliana;Eg=Eucalyptus grandis;Gh=
Gossypium hirsutum;Hv=Hordeum vulgare;Os=Oryza sativa; Ptr =
Populus tremuloides; and Zm = Zea mays. “PCW” and “SCW” indicate
primary cell wall and secondary cell wall, respectively. Information about
CESA refers to At [4,25,48,52], Zm [6], Hv [7], Ptr [8,9], Eg [49].
Additional file 11: Comparative analysis of the expression patterns
of the CSL homologs (CSLD, CSLF, CSLC and CSLA)inArabidopsis,
rice, barley and other species. Os: rice, At: Arabidopsis, Hv: barley, Pt(r):
poplar, Na: tobacco; The plus signs indicate the preferential expression,
while the minus sign indicates lower expression; The asterisks indicate
the genes expressed throughout the tissues examined; The numbers in
parentheses indicate the duplicated genes of OsCESA/CSL; The expression
data refer to AtCESA/CSL [25,53], HvCSLF [54], HvCSLC [22], PtCSLA [18],
PtrCSLD and NaCSLD1 [55].
Additional file 12: Gene co-expression profiling of OsCESA by
“Artificial-mutant” analysis in all the tissues examined.
Additional file 13: Gene co-expression profiling of OsCESA by
“Artificial-mutant” analysis; data from the plumule and radicle
tissues were excluded.
Acknowledgements
We thank Dr. Qifa Zhang and his colleagues for their helpful data analysis
and discussion. This work was supported in part by the China Postdoctoral
Science Foundation (20070420917), the National Natural Science Foundation
of China (30900890), the Programme of Introducing Talents of Discipline to
Universities (B08032), the National Transgenic Project (2009ZX08009-119B)
and the National “973” Specific Pre-project (2010CB134401).
Author details
1
National Key Laboratory of Crop Genetic Improvement, Biomass and
Bioenergy Research Centre, Huazhong Agricultural Univ ersity, Wuhan, Hubei,
430070, PR China.
2
College of Plant Sciences and Technology, Huazhong
Agricultural University, Wuhan, Hubei, 430070, PR China.
3
College of Life
Sciences and Technology, Huazhong Agricultural University, Wuhan, Hubei,
430070, PR China.
Authors’ contributions
LW performed all data analyses and drafted the manuscript. KG conducted
all data collection and analyses. YT and HH completed chemical tests. YL,
BW and XC participated in the growing of the rice and in data
interpretation. LP supervised the project and finalized the paper. All authors
have read and approved the final manuscript.
Received: 29 May 2010 Accepted: 20 December 2010
Published: 20 December 2010
References
1. Pear JR, Kawagoe Y, Schreckengost WE, Delmer DP, Stalker DM: Higher
plants contain homologs of the bacterial celA genes encoding the
catalytic subunit of cellulose synthase. Proc Natl Acad Sci USA 1996,
93:12637-12642.
2. Arioli T, Peng L, Betzner AS, Burn J, Wittke W, Herth W, Camilleri C, Höfte H,
Plazinski J, Birch R, Cork A, Glover J, Redmond J, Williamson RE: Molecular
analysis of cellulose biosynthesis in Arabidopsis. Science 1998,
279:717-720.
3. Taylor NG, Howells RM, Huttly AK, Vickers K, Turner SR: Interactions among
three distinct CesA proteins essential for cellulose synthesis. Proc Natl
Acad Sci USA 2003, 100:1450-1455.
4. Desprez T, Juraniec M, Crowell EF, Jouy H, Pochylova Z, Parcy F, Höfte H,
Gonneau M, Vernhettes S: Organization of cellulose synthase complexes
involved in primary cell wall synthesis in Arabidopsis thaliana. Proc Natl
Acad Sci USA 2007, 104:15572-15577.
5. Persson S, Paredez A, Carroll A, Palsdottir H, Doblin M, Poindexter P,
Khitrov N, Auer M, Somerville CR: Genetic evidence for three unique
components in primary cell-wall cellulose synthase complexes in
Arabidopsis. Proc Natl Acad Sci USA 2007, 104:15566-15571.
6. Appenzeller L, Doblin M, Barreiro R, Wang HY, Niu XM, Kollipara K,
Carrigan L, Tomes D, Chapman M, Dhugga KS: Cellulose synthesis in
maize: isolation and expression analysis of the cellulose synthase (CesA)
gene family. Cellulose 2004, 11:287-299.
7. Burton RA, Shirley NJ, King BJ, Harvey AJ, Fincher GB: The CesA gene family
of barley (Hordeum vulgare): quantitative analysis of transcripts reveals
two groups of co-expressed genes. Plant Physiol 2004, 134:224-236.
8. Joshi CP, Bhandari S, Ranjan P, Kalluri UC, Liang X, Fujino T: Genomics of
cellulose biosynthesis in poplars. New Phytol 2004, 164:53-61.
9. Djerbi S, Lindskog M, Arvestad L, Sterky F, Teeril TT: The genome sequence
of black cottonwood (Populus tricocarpa) reveals 18 conserved cellulose
synthase (CesA) genes. Planta 2005, 221:739-746.
10. Nairn CJ, Haselkorn T: Three loblolly pine CesA genes expressed in
developing xylem are orthologous to secondary cell wall CesA genes of
angiosperms. New Phytol 2005, 166:907-915.
11. Robert AW, Bushoven JT: The cellulose (CESA
) gene superfamily of the
moss physcomitrella patens. Plant Mol Biol 2007, 63:207-219.
12. Yin YB, Huang JL, Xu Y: The cellulose synthase superfamily in fully
sequenced plants and algae. BMC Plant Biol 2009, 9:99-113.
13. Richmond TA, Somerville CR: The cellulose synthase superfamily. Plant
Physiol 2000, 124:495-498.
14. Saxena IM, Brown RM: Identification of cellulose synthase(s) in higher
plants: Sequence analysis of processive β-glycosyltransferases with the
common motif ‘D,D,D35Q(R,Q)XRW’. Cellulose 1997, 4:33-49.
15. Doblin M S, De Melis L, Newbigin E, Bacic A, Read SM: Pollen tubes of
Nicotiana alata express two genes from different beta-glucan synthase
families. Plant Physiol 2001, 125:2040-2052.
16. Dhugga KS, Barreiro R, Whitten B, Stecca K, Hazebroek J, Randhawa GS,
Dolan M, Kinney AJ, Tomes D, Nichols S, Anderson P: Guar seed ß-mannan
synthase is a member of the cellulose synthase super gene family.
Science 2004, 303:363-366.
17. Liepman AH, Wilkerson CG, Keegstra K: Expression of cellulose synthase-
like (Csl) genes in insect cells reveals that CslA family members encode
mannan synthases. Proc Natl Acad Sci USA 2005, 102:2221-2226.
18. Suzuki S, Li LG, Sun YH, Chiang VL: The Cellulose Synthase Gene
Superfamily and Biochemical Functions of Xylem-Specific Cellulose
Synthase-Like Genes in Populus trichocarpa. Plant Physiol 2006,
142:1233-1245.
19. Goubet F, Barton CJ, Mortimer JC, Yu XL, Zhang ZN, Miles GP, Richens J,
Liepman AH, Seffen K, Dupree P: Cell wall glucomannan in Arabidopsis is
synthesised by CSLA glycosyltransferases, and influences the
progression of embryogenesis. Plant J 2009, 60:527-538.
20. Burton RA, Wilson SM, Hrmova M, Harvey AJ, Shirley NJ, Medhurst A,
Stone BA, Newbigin EJ, Bacic A, Fincher GB: Cellulose synthaselike CslF
genes mediate the synthesis of cell wall (1,3;1,4)- β-D-glucans. Science
2006, 311:940-1942.
21. Doblin MS, Pettolino FA, Wilson SM, Campbell R, Burton RA, Fincher GB,
Newbigin E, Bacic A: A barley cellulose synthase-like CSLH gene mediates
(1,3;1,4)- beta-D-glucan synthesis in transgenic Arabidopsis. Proc Natl
Acad Sci USA 2009, 106:5996-6001.
22. Dwivany FM, Yulia D, Burton RA, Shirley NJ, Wilson SM, Fincher GB, Bacic A,
Newbigin E, Doblin MS: The CELLULOSE-SYNTHASE LIKE C (CSLC) family
of barley includes members that are integral membrane proteins
targeted to the plasma membrane. Mol Plant 2009, 5:1025-1039.
23. Cocuron JC, Lerouxel O, Drakakaki G, Alonso AP, Liepman AH, Keegstra K,
Raikhel N, Wilkerson CG: A gene from the cellulose synthaselike C family
encodes a beta-1,4 glucan synthase. Proc Natl Acad Sci USA 2007,
104:8550-8555.
24. Bernal AJ, Yoo CM, Mutwil M, Jensen JK, Hou G, Blaukopf C, Sorensen I,
Blancaflor EB, Scheller HV, Willats WG: Functional analysis of the cellulose
synthase-like genes CSLD1, CSLD2, and CSLD4 in tip-growing Arabidopsis
cells. Plant Physiol 2008, 148:1238-1253.
25. Hamann T, Osborne E, Youngs H, Misson J, Nussaume L, Somerville C:
Global expression analysis of CESA and CSL genes in Arabidopsis.
Cellulose 2004, 11:279-286.
26. Bernal AJ, Jensen JK, Harholt J, Sørensen S, Moller I, Blaukopf C, Johansen B,
Lotto RD, Pauly M, Scheller HV, Willats WG: Disruption of ATCSLD5 results
Wang et al. BMC Plant Biology 2010, 10:282
/>Page 15 of 16
in reduced growth, reduced xylan and homogalacturonan synthase
activity and altered xylan occurrence in Arabidopsis. Plant J 2007,
52:791-802.
27. Li M, Xiong GY, Cui JJ, Tang D, Zhang BC, Pauly M, Cheng ZK, Zhou YH:
Rice cellulose synthase-like D4 is essential for normal cell-wall
biosynthesis and plant growth. Plant J 2009, 60:1055-1069.
28. Hazen SP, Scott-Craig JS, Walton JD: Cellulose synthase-like genes of rice.
Plant Physiol 2002, 128:336-340.
29. Kim CM, Park SH, Je BI, Park SH, Park SJ, Piao HL, Eun MY, Dolan L, Han CD:
OsCSLD1, a cellulose synthase-like D1 gene, is required for root hair
morphogenesis in rice. Plant Physiol 2007, 143l:1220-1230.
30. Guo AY, Zhu QH, Chen X, Luo JC: GSDS: a gene structure display server.
Yi Chuan 2007, 29:1023-1026.
31. Sonnhammer EL, von Heijne G, Krogh A: A hidden Markov model for
predicting transmembrane helices in protein sequences. Proc Int Conf
Intell Syst Mol Biol 1998, 6:175-182.
32. Krogh A, Larsson B, von Heijne, Sonnhammer EL: Predicting
transmembrane protein topology with a hidden Markov model:
application to complete genomes. J Mol Biol 2001, 305:567-580.
33. Horton P, Park KJ, Obayashi T, Fujita N, Harada H, Adams-Collier CJ, Nakai K:
WoLF PSORT: protein localization predictor. Nucleic Acids Res 2007,
35:585-587.
34. Thompson JD, Gibson TJ, Plewniak F, Jeanmougin F, Higgins DG: The
CLUSTAL_X windows interface: flexible strategies for multiple sequence
alignment aided by quality analysis tools. Nucleic Acids Res 1997,
25:4876-4882.
35. Katoh K, Kuma KI, Toh H, Miyata K: MAFFT version 5: improvement in
accuracy of multiple sequence alignment. Nucleic Acids Res 2005,
33:511-518.
36. Kumar S, Tamura K, Nei M: MEGA3: Integrated software for molecular
evolutionary genetics analysis and sequence alignment. Brief Bioinform
2004, 5:150-163.
37. Haas BJ, Delcher AL, Wortman JR, Salzberg SL: DAGchainer: a tool for
mining segmental genome duplications and synteny. Bioinformatics 2004,
20:3643-3646.
38. R Development Core Team: R: A Language and Environment for
Statistical Computing. Vienna, Austria; 2009.
39. Peng L, Hocart CH, Redmond JW, Williamson RE: Fractionation of
carbohydrates in Arabidopsis seedling cell walls shows that three radial
swelling loci are specifically involved in cellulose production. Planta
2000, 211:406-414.
40. Duarte JM, Cui L, Wall PK, Zhang Q, Zhang X, Leebens-Mack J, Ma H,
Altman N, dePamphilis CW: Expression pattern shifts following
duplication indicative of subfunctionalization and neofunctionalization
in regulatory genes of Arabidopsis
. Mol Biol Evol 2006, 23:469-478.
41. Hauser MT, Morikami A, Benfey PN: Conditional root expansion mutants
of Arabidopsis. Development 1995, 121:1237-1252.
42. Schindelman G, Morikami A, Jung J, Baskin TI, Carpita NC, Derbyshire P,
McCann MC, Benfey PN: COBRA encodes a putative GPI-anchored
protein, which is polarly localized and necessary for oriented cell
expansion in Arabidopsis. Gene Dev 2001, 15:1115-1127.
43. Li Y, Qian Q, Zhou Y, Yan M, Sun L, Zhang M, Fu Z, Wang Y, Han B, Pang X,
Chen M, Li J: BRITTLE CULM1, which encodes a COBRA-like protein,
affects the mechanical properties of rice plants. Plant Cell 2003,
15:2020-2031.
44. Roudier F, Fernandez AG, Fujita M, Himmelspach R, Borner GH,
Schindelman G, Song S, Baskin TI, Dupree P, Wasteneys GO, Benfey PN:
COBRA, an Arabidopsis extracellular lycosyl-phosphatidyl inositol
anchored protein, specifically controls highly anisotropic expansion
through its involvement in cellulose microfibril orientation. Plant Cell
2005, 17:1749-1763.
45. Kong H, Landherr LL, Frohlich MW, Leebens-Mack J, Ma H, dePamphilis CW:
Patterns of gene duplication in the plant SKP1 gene family in
angiosperms: evidence for multiple mechanisms of rapid gene birth.
Plant J 2007, 50:873-885.
46. Cannon SB, Mitra A, Baumgarten A, Young ND, May G: The roles of
segmental and tandem gene duplication in the evolution of large gene
families in Arabidopsis thaliana. BMC Plant Biol 2004, 4:10-31.
47. Wapinski I, Pfeffer A, Friedman N, Regev A: Natural history and
evolutionary principles of gene duplication in fungi. Nature 2007,
449:54-61.
48. Holland N, Holland D, Helentjaris T, Dhugga KS, Xoconostle-Cazares B,
Delmer DP: A Comparative analysis of the plant cellulose synthase (CesA)
gene family. Plant Physiol 2000, 123:1313-1323.
49. Ranik M, Myburg AA: Six new cellulose synthase genes from Eucalyptus
are associated with primary and secondary cell wall biosynthesis. Tree
Physiol 2006, 26:545-556.
50. Wei HR, Persson S, Mehta T, Srinivasasainagendra V, Chen L, Page GP,
Somerville C, Loraine A: Transcriptional Coordination of the Metabolic
Network in Arabidopsis. Plant Physiol 2006, 142:762-774.
51. Atanassov II, Pittman JK, Turner SR: Elucidating the Mechanisms of
Assembly and Subunit Interaction of the Cellulose Synthase Complex of
Arabidopsis Secondary Cell Walls. J Bio Chem 2009, 284:3833-3841.
52. Persson S, Wei H, Milne J, Page GP, Bauer S, Somerville C: Identification of
genes required for cellulose synthesis by regression analysis of public
microarray data sets. Proc Natl Acad Sci USA 2005, 102:8633-8683.
53. Liepman AH, Nairn CJ, Willats WGT, Sørensen I, Roberts AW, Keegstra K:
Functional genomic analysis supports conservation of function among
cellulose synthase-like A gene family members and suggests diverse
roles of mannans in plants. Plant Physiol 2007, 143:1881-1893.
54. Burton RA, Jobling SA, Harvey AJ, Shirley NJ, Mather DE, Bacic A,
Fincher GB: The genetics and transcriptional profiles of the cellulose
synthase-like HvCSLF gene family in barley. Plant Physiol 2008,
146:1821-1833.
55. Samuga A, Joshi CP: Cloning and characterization of cellulose synthase-
like gene, PtrCSLD2 from developing xylem of aspen trees. Physiol Plant
2004, 120:631-641.
doi:10.1186/1471-2229-10-282
Cite this article as: Wang et al.: Expression profiling and integrative
analysis of the CESA/CSL superfamily in rice. BMC Plant Biology 2010
10:282.
Submit your next manuscript to BioMed Central
and take full advantage of:
• Convenient online submission
• Thorough peer review
• No space constraints or color figure charges
• Immediate publication on acceptance
• Inclusion in PubMed, CAS, Scopus and Google Scholar
• Research which is freely available for redistribution
Submit your manuscript at
www.biomedcentral.com/submit
Wang et al. BMC Plant Biology 2010, 10:282
/>Page 16 of 16