báo cáo khoa học: " Haplotyping, linkage mapping and expression analysis of barley genes regulated by terminal drought stress influencing seed quality" pot
Bạn đang xem bản rút gọn của tài liệu. Xem và tải ngay bản đầy đủ của tài liệu tại đây (640.54 KB, 14 trang )
RESEARCH ARTICLE Open Access
Haplotyping, linkage mapping and expression
analysis of barley genes regulated by terminal
drought stress influencing seed quality
Sebastian Worch
1
, Kalladan Rajesh
1
, Vokkaliga T Harshavardhan
1
, Christof Pietsch
2
, Viktor Korzun
2
, Lissy Kuntze
3
,
Andreas Börner
1
, Ulrich Wobus
1
, Marion S Röder
1
, Nese Sreenivasulu
1*
Abstract
Background: The increasingly narrow genetic background characteristic of modern crop germplasm presents a
challenge for the breeding of cultivars that require adaptation to the anticipated change in climate. Thus, high
priority research aims at the identification of relevant allelic variation present both in the crop itself as well as in its
progenitors. This study is based on the characterization of genetic variation in barley, with a view to enhancing its
response to terminal drought stress.
Results: The expression patterns of drought regulated genes were monitored during plant ontogeny, mapped and
the location of these genes was incorporated into a comprehensive barley SNP linkage map. Haplotypes within a
set of 17 starch biosynthesis/degradation genes were defined, and a particularly high level of haplotype variation
was uncovered in the genes encoding sucrose synthase (types I and II) and starch synthase. The ability of a panel
of 50 barley accessions to maintain grain starch content under terminal drought conditions was explored.
Conclusion: The linkage/expression map is an informative resource in the context of characterizing the response
of barley to drought stress. The high level of haplotype variation among starch biosynthesis/degradation genes in
the progenitors of cultivated ba rley shows that domestication and breeding have greatly eroded their allelic
diversity in current elite cultivars. Prospective association analysis based on core drought-regulated genes may
simplify the process of identifying favourable alleles, and help to understand the genetic basis of the response to
terminal drought.
Background
Drought is one of the most serious abiotic stress factors
which occur throughout the development of the plant
and, if sufficiently severe and/or prolonged, results in
the modification of the plant’ s physiology a nd severely
limit crop p roductivity. Plants have evol ved a ra nge of
defence and escape mechanisms [1], and these are typi-
cally mediated by multiple ra ther than by single genes.
In barley, QTL underlying drought tolerance has been
mapped to almost every chromosome [2-6]. However,
little information has been gathered to date regarding
the genomic location of drought-regulated genes, either
expressed throughout plant development or at late
reproductive stages influencing seed yield and quality.
Of all the genetic m arker types available , single
nucleotide polymorphisms (SNPs) are the most abun-
dant, and thus offer the greatest level of genetic resolu-
tion. They are of potential functional relevance and they
are also well suited to high throughput analytical meth-
ods [7]. The representation of SNPs on the barley link-
age map has grown over recent years [8-10], and in
particular, a SNP-based map featuring gene sequences
expressed differentially in response to various abiotic
stresses has recently been developed [7]. Here we pre-
sent a SNP-based genetic map of barley, specifically
foc ussing on nucleotide variation in ESTs demonstrated
to be involved in the response of barley to drought
stress occurring at early vegetative stages, during
anthesis and the grain filling process.
* Correspondence:
1
Leibniz-Institute of Plant Genetics and Crop Plant Research (IPK),
Corrensstr.3, 06466 Gatersleben, Germany
Full list of author information is available at the end of the article
Worch et al. BMC Plant Biology 2011, 11:1
/>© 2011 Worch et al; licensee BioMed Central Ltd. This is an Open Access article distributed und er the terms of the Creative Commons
Attribution License (http://creativecomm ons.org/licenses/by/2.0), which permits unrestricted use, distribution, and reproductio n in
any medium, provided the original work is prop erly cited.
While the productivity of the cereals has risen greatly
since their domestication, in response to farmer selec-
tion and methodical breeding, there are indications that
the increasing fixation of elite alleles in modern breed-
ing germplasm is already inhibi ting further genetic gain.
In the face of potential climate change, these elite allele
combinations may become sub-optimal and will necessi-
tate a search for better adapted alleles among crop land-
races or wild materials [11]. Population of wild barley
(Hordeum vulgare ssp. Spontaneum, hereaft er referred
to as H. spontaneum) have been shown to possess
favourable genetic variation for a number of agronomic
traits [12,13] including biotic [14,15] and abiotic stress
tolerance [2,16-19].
We report haplotyping data for 17 starch biosynthesis/
degradation genes demonstrating the broad diversity
among H. spontaneum accessions and H. vulgare land-
races but rather limited genetic variance in the current
elite breeding germplasm by fixing certain haplotypes.
Similar observations were made for seed starch accumu-
lation during terminal drought for a diverse set of 50
barley accessions.
Results and Disc ussion
SNP discovery in sequences responding to drought stress
The initial set of 613 drought-responsive ESTs (covering
20 functional categories; Additional file 1) was deter-
mined from 5 or 21 day old seedlings, flag leaves-post
anthesis or developing grains. Suitable sequence infor-
mation from the f our parents of mapping population
and the four advanced backcross (AB) population par-
ents were obtained for 327 genes (53.3%). The sequence
reads were assembled individually for each locus. A total
of 1,346 inform ative SNPs were dispersed through
263 of the sequences, giving a mean SNP density of
5.1 per kb (Additional file 2). The Oregon Wolfe parents
were the best differentiated (627 SNPs across 181 E STs,
density 3.4 per kb), which is consistent with compari-
sons made elsewhere between these two lines [7,20].
Some 30% of the loci were polymorphic between cvs.
Steptoe and Morex, as noted in the previous studies for
these cultivars [10,20]. The proportion of informative
loci in cv. Brenda versus HS584 was 33%, and between
cv. Scarlett and ISR42_8 39%. Note that a polymorphism
survey based on 400 microsatellite loci showed that 46%
were informative between cv. Brenda and HS584 [21],
while 97 out of 220 (44%) were polymorphic between
cv. Scarlett and ISR42_8 [22].
Marker development and linkage mapping
The SNPs present in the 263 ESTs were converted into
31 pyrosequencing-based markers for Steptoe/Morex, 76
for Oregon Wolfe and 34 markers common to both
populations, for a total of 141 SNP markers (Table 1).
Of the 20 functional gene categories represented among
the 613 initially selected ES Ts, 17 classes were retained
among the genes tagged by the 141 mar kers (Additional
file 1). Genes inv olved in carbohydrate, amino acid
metabolism, hormone signalling, storage protein synth-
esis and the response to desiccation, as well as a number
of transcription factors were particularly common
(Additional file 1). G enotypic data associated with both
the 141 de novo SNP markers (GBS3120-GBS3260), and
with an established set of 140 GBS (GBS0001-GBS0921;
[10]) and 71 BIN markers were then used to construct a
352 marker-based map (Figure 1), in which the BIN
markers were situated as expected [10,23]. The only
change in GBS marker order occurre d on chromosome
arm 3HL, where GBS0538 mapped distal, rather than
proximal to ABC161 [10]. The genetic length of eac h
chromosome ranged from 127.2 cM (4H) to 198.8 cM
(5H), and the overall map length was 1,072 cM (Table 1).
Given the unequal genomic distribution of the marker
loci, marker development was focussed on chromosomes
1 H (32 loci) and 2 H (28 loci), because these chromo-
somes are known to harbour drought-related QTL
(unpublished data and [3,4,6]). For example, Teulat
et al. [4] identified a Q TL for drought related traits at
the SSR marker Ebmac684 on 2 H analysing grain mate-
rial from field grown barley from an environment with
limited water availability especially during the grain fill-
ing period. The marker Ebmac684 maps close to
ABC468 [24], in a chromosomal region where several
de novo markers representing putative candidate genes
were mapped. These genes encode transcription regula-
tors (GBS3215, GBS3217, GBS3224), a cytochro me pro-
tein (GBS3138), a protein kinase (GBS3167) and the
starch branching enzyme (GBS3257). Chromosomes 4 H
(nine loci) and 6 H (ten loci) contained the least
de novo marker, while 21, 22 and 19 loci wer e mapped
to chromosomes 3 H, 5 H and 7 H, respectively. Each
member of the pairs of sequences GBS3141/GBS3216,
Table 1 Marker frequency and map length of the
individual mapping populations for deriving the
integrated map
SM OWB integrated
Chromosome Marker cM Marker cM Marker cM
1H 13 148.7 24 148.8 32 149.7
2H 15 135.8 22 155 28 155.3
3H 12 135.2 14 178.7 21 159.2
4H 3 107.4 8 123.2 9 127.2
5H 10 154.6 18 202.1 22 198.8
6H 5 96.9 8 104.6 10 141.4
7H 7 135.4 16 154.1 19 140.1
total 65 914 110 1066.5 141 1071.7
Worch et al. BMC Plant Biology 2011, 11:1
/>Page 2 of 14
GBS3193/GBS3250, GBS3129/GBS3260, and GBS3150/
GBS3223 was derived from the same EST, and thus
mapped to the same position (Additional files 3 and 4).
The pairs GBS3230/GBS3231, GBS3172/GBS3173 and
GBS3154/GBS3155/GBS3228 each are based upon dif-
ferent EST clusters but represen t the same gene as they
do not overlap due to shorter contigs, and mapped to a
single chromosome bin (Additional files 3 and 4).
Overlap with other barley SNP maps
Only seven of the previously mapped abiotic stress related
barley genes belong to the present map of drought-
responsive 141 de novo SNP markers [7] (Additional file
4). GBS3193 and GBS3250 belong to the same mapped
abiotic stress marker scsnp04853, mapped to chromosome
1 H in [7]. On chromosome 2 H, GBS3244 i s covered by
scsnp00592, GBS3138 by scsnp01644 and GBS3158
by scsnp03343. GBS3198 (chromosome 4H) corresponds
to scsnp06435, and GBS3247 (chromosome 5H) to
scsnp14350. Six of the seven overlapping markers mapped
to their expected chromosomal BIN, but GBS3244
appeared to lie proximal, rather than distal to ABC252.
Taken the consensus transcript map in [10] five of th e
de novo SNP loci are represented there, namely GBS3178/
GBS0237 (chromosome 1H), GBS3158/GBS0400 (chro-
mosome 2H), GBS3246/GBS0073 and GBS3170/GBS0043
(chromosome 3H), and GBS3128/GBS0018 (chromosome
7H). A further 14 GBR or GBM markers identified the
same loci as the de novo SNPs, but two (GBS313 9 on
chromosome 1 H, G BR1494 on chromosome 2H; and
GBS3207 on chromosome 1 H, GBR1571 on chromosome
2H) had a discrepant chromosome location. The pairs
GBS3253 /GBR0625 and GBS3185/ GBM1405 all mapped
to chromosome 3 H but to different bins (Additional file
4). Another high-density transcript linkage map based on
a total of 2890 SNP, CAPS and INDEL markers was pub-
lished by Sato et al. [9]. According to unigene IDs, 31 GBS
markers show o verlap with 28 loci of the present map.
Finally, 67 of the 2,943 SNP loci present on the Close
et al. [8] map correspond to GBS marker(s), with no dis-
crepancies in terms of chromosomal location. Marker
1_0686 (matching GBS3207 and GBR1571 [10]) was
located to chromosome 1 H, thereby confirming the posi-
tion of GBS3207. In summary, 52 of the 141 de novo SNP
0
5
10
15
20
25
30
35
40
45
50
55
60
65
70
75
80
85
90
95
100
105
110
115
120
125
130
135
140
145
150
155
160
165
170
175
180
185
190
195
0
5
10
15
20
25
30
35
40
45
50
55
60
65
70
75
80
85
90
95
100
105
110
115
120
125
130
135
140
145
150
155
160
165
170
175
180
185
190
195
GBS3238
GBS3239
GBS3200
GBS0626 GBS0546
GBS0507
GBS3201
GBS3205
GBS3202
GBS3245
GBS3204
MWG938
MWG837
ABA004
BCD098
GBS3219
GBS3171
Ica1
GBS0455
GBS3203
GBS3176
GBS0306
Pcr2
GBS0079
GBS0371 GBS0342
GBS3139
GBS3126
GBS0125
Glb1
GBS3248
GBS3188
GBS3207
GBS3252
GBS3251
GBS0267
GBS3250
GBS3180
GBS3193
GBS3174
GBS3249
GBS0528
GBS3255
cMWG706a
GBS3194
GBS3187
BCD1930
GBS3162
GBS0237
GBS0361
GBS3178
ABC261
GBS3135
GBS0469 GBS0383
GBS0554
GBS3259
GBS0450
GBS3209
1H
GBS3238
GBS3239
GBS3200
GBS0626 GBS0546
GBS0507
GBS3201
GBS3205
GBS3202
GBS3245
GBS3204
MWG938
MWG837
ABA004
BCD098
GBS3219
GBS3171
Ica1
GBS0455
GBS3203
GBS3176
GBS0306
Pcr2
GBS0079
GBS0371 GBS0342
GBS3139
GBS3126
GBS0125
Glb1
GBS3248
GBS3188
GBS3207
GBS3252
GBS3251
GBS0267
GBS3250
GBS3180
GBS3193
GBS3174
GBS3249
GBS0528
GBS3255
cMWG706a
GBS3194
GBS3187
BCD1930
GBS3162
GBS0237
GBS0361
GBS3178
ABC261
GBS3135
GBS0469 GBS0383
GBS0554
GBS3259
GBS0450
GBS3209
1H
GBS3128
ABG704
GBS0567
GBS3159
GBS3191
GBS0515
GBS0018
GBS3136
GBS0572
GBS0446
ABG320
GBS0021
GBS3258
GBS3137
GBS0553
GBS0154
ABG380
GBS0759
ksuA1a
GBS3206
GBS0356
GBS3151
GBS3235
GBS3208
GBS3129
ABC255
GBS3260
GBS0700
GBS0591
GBS3152
GBS3120
GBS0664
ABG701
GBS3163
GBS3132
GBS0643
GBS0835
GBS0378
GBS3124
GBS0773
GBS0132
Amy2
GBS0405
GBS0040
GBS0895
GBS3166
GBS0647
ABC305
ABG461a
GBS0729
GBS3218
GBS0441
7H
GBS3128
ABG704
GBS0567
GBS3159
GBS3191
GBS0515
GBS0018
GBS3136
GBS0572
GBS0446
ABG320
GBS0021
GBS3258
GBS3137
GBS0553
GBS0154
ABG380
GBS0759
ksuA1a
GBS3206
GBS0356
GBS3151
GBS3235
GBS3208
GBS3129
ABC255
GBS3260
GBS0700
GBS0591
GBS3152
GBS3120
GBS0664
ABG701
GBS3163
GBS3132
GBS0643
GBS0835
GBS0378
GBS3124
GBS0773
GBS0132
Amy2
GBS0405
GBS0040
GBS0895
GBS3166
GBS0647
ABC305
ABG461a
GBS0729
GBS3218
GBS0441
7H
ABG062
GBS3121
GBS3140
GBS0346
GBS0520
cMWG652A
GBS0179
GBS3142
ABG387b
GBS0655 GBS0822
GBS0088 GBS0590
GBS3144
GBS3122
GBS0489
ABG474
GBS3199
GBS0325
GBS0537
ABC170b
GBS3133
Nar7
GBS3212
GBS3125
MWG934
Tef1
GBS0708
GBS0921
GBS0396
GBS0388
GBS3146
6H
ABG062
GBS3121
GBS3140
GBS0346
GBS0520
cMWG652A
GBS0179
GBS3142
ABG387b
GBS0655 GBS0822
GBS0088 GBS0590
GBS3144
GBS3122
GBS0489
ABG474
GBS3199
GBS0325
GBS0537
ABC170b
GBS3133
Nar7
GBS3212
GBS3125
MWG934
Tef1
GBS0708
GBS0921
GBS0396
GBS0388
GBS3146
ABG062
GBS3121
GBS3140
GBS0346
GBS0520
cMWG652A
GBS0179
GBS3142
ABG387b
GBS0655 GBS0822
GBS0088 GBS0590
GBS3144
GBS3122
GBS0489
ABG474
GBS3199
GBS0325
GBS0537
ABC170b
GBS3133
Nar7
GBS3212
GBS3125
MWG934
Tef1
GBS0708
GBS0921
GBS0396
GBS0388
GBS3146
6H
GBS0577
MWG920.1a
GBS0086
GBS0412
GBS0087
GBS0629
ABG395
GBS3157
GBS3150 GBS0457
GBS3223
GBS0882
Ltp1
GBS3237
GBS0654
GBS0594
GBS0653
GBS3225
GBS3164
GBS0462
GBS3189
WG530
GBS0410
GBS3256
GBS0318 GBS0042
GBS0892
GBS3179
GBS0613
ABC302
GBS3165
GBS0304
GBS0539
GBS3196
GBS3197
ABG473
GBS3134
GBS3247
GBS0102
GBS0531
GBS0855
GBS0712
GBS0295
MWG514b
GBS0138
WG908
GBS3169
GBS3211
GBS0900
GBS0397
GBS0669
ABG496
GBS3147
GBS0800
GBS0152
ABG390
GBS3226
GBS0390
ABG463
GBS3254
GBS0408
GBS3195 GBS3233
G
B
S3
2
3
4
5H
GBS0577
MWG920.1a
GBS0086
GBS0412
GBS0087
GBS0629
ABG395
GBS3157
GBS3150 GBS0457
GBS3223
GBS0882
Ltp1
GBS3237
GBS0654
GBS0594
GBS0653
GBS3225
GBS3164
GBS0462
GBS3189
WG530
GBS0410
GBS3256
GBS0318 GBS0042
GBS0892
GBS3179
GBS0613
ABC302
GBS3165
GBS0304
GBS0539
GBS3196
GBS3197
ABG473
GBS3134
GBS3247
GBS0102
GBS0531
GBS0855
GBS0712
GBS0295
MWG514b
GBS0138
WG908
GBS3169
GBS3211
GBS0900
GBS0397
GBS0669
ABG496
GBS3147
GBS0800
GBS0152
ABG390
GBS3226
GBS0390
ABG463
GBS3254
GBS0408
GBS3195 GBS3233
G
B
S3
2
3
4
5H
MWG634
GBS3190
JS103.3
GBS0372
GBS0349
GBS0551
GBS0456
BCD402b
BCD808b
GBS0901
GBS3148
GBS3232
GBS3161 ABG484
GBS0887
GBS3175
GBS3229
GBS0506
GBS3198
GBS3181
GBS0751
GBS0547
GBS0001
bBE54a
GBS0023 GBS0010
BCD453b
GBS0461
ABG319a
GBS0666
GBS3213
GBS0288
ABG397
GBS0692
ABG319c
GBS0089
Bmy1
4H
MWG634
GBS3190
JS103.3
GBS0372
GBS0349
GBS0551
GBS0456
BCD402b
BCD808b
GBS0901
GBS3148
GBS3232
GBS3161 ABG484
GBS0887
GBS3175
GBS3229
GBS0506
GBS3198
GBS3181
GBS0751
GBS0547
GBS0001
bBE54a
GBS0023 GBS0010
BCD453b
GBS0461
ABG319a
GBS0666
GBS3213
GBS0288
ABG397
GBS0692
ABG319c
GBS0089
Bmy1
MWG634
GBS3190
JS103.3
GBS0372
GBS0349
GBS0551
GBS0456
BCD402b
BCD808b
GBS0901
GBS3148
GBS3232
GBS3161 ABG484
GBS0887
GBS3175
GBS3229
GBS0506
GBS3198
GBS3181
GBS0751
GBS0547
GBS0001
bBE54a
GBS0023 GBS0010
BCD453b
GBS0461
ABG319a
GBS0666
GBS3213
GBS0288
ABG397
GBS0692
ABG319c
GBS0089
Bmy1
4H
ABG070
GBS3192
MWG798b
GBS0497
GBS0667
GBS0598
GBS3145
GBS0587
GBS3246
ABG396
GBS3186
GBS3131
GBS3123
GBS0073 GBS0508
GBS3185
GBS3172
GBS3173
MWG571b
GBS0222
GBS0658
ABG377
GBS3220
ABG453
GBS3184
GBS0014
GBS0090
GBS0043
GBS3170
CDO113b
GBS0510
GBS3253
GBS3127
His4b
GBS3177
ABG004
GBS3231
GBS3230
GBS3210
ABC161
GBS0538
ABC174
GBS0005
GBS0271
ABC166
GBS3216 GBS3141
GBS0419
GBS0879
GBS3240
3H
ABG070
GBS3192
MWG798b
GBS0497
GBS0667
GBS0598
GBS3145
GBS0587
GBS3246
ABG396
GBS3186
GBS3131
GBS3123
GBS0073 GBS0508
GBS3185
GBS3172
GBS3173
MWG571b
GBS0222
GBS0658
ABG377
GBS3220
ABG453
GBS3184
GBS0014
GBS0090
GBS0043
GBS3170
CDO113b
GBS0510
GBS3253
GBS3127
His4b
GBS3177
ABG004
GBS3231
GBS3230
GBS3210
ABC161
GBS0538
ABC174
GBS0005
GBS0271
ABC166
GBS3216 GBS3141
GBS0419
GBS0879
GBS3240
3H
ABG703b
GBS3182
GBS3236
GBS3153
GBS0495
GBS0679
ABG318
ABG358
GBS0182
GBS0155
GBS0513
GBS3156
Pox
GBS3222
GBS0524 GBS0885
GBS0003
GBS3155
GBS3154
GBS3228
GBS3217
GBS3224
GBS3167 GBS3138
GBS0312
GBS0651
ABC468
GBS3215
GBS3257
GBS0519
GBS0008
GBS3130
GBS3241
GBS3143
GBS3242
ABC451
GBS3243
GBS0400
GBS3149
GBS0033
GBS3158
GBS0705
GBS0512
MWG503
GBS0272 GBS0335
GBS3160
ksuD22
GBS3244
GBS3221
GBS3227
ABC252
GBS3183
GBS0379
ABC165
GBS3168
GBS3214
GBS0105
2H
ABG703b
GBS3182
GBS3236
GBS3153
GBS0495
GBS0679
ABG318
ABG358
GBS0182
GBS0155
GBS0513
GBS3156
Pox
GBS3222
GBS0524 GBS0885
GBS0003
GBS3155
GBS3154
GBS3228
GBS3217
GBS3224
GBS3167 GBS3138
GBS0312
GBS0651
ABC468
GBS3215
GBS3257
GBS0519
GBS0008
GBS3130
GBS3241
GBS3143
GBS3242
ABC451
GBS3243
GBS0400
GBS3149
GBS0033
GBS3158
GBS0705
GBS0512
MWG503
GBS0272 GBS0335
GBS3160
ksuD22
GBS3244
GBS3221
GBS3227
ABC252
GBS3183
GBS0379
ABC165
GBS3168
GBS3214
GBS0105
2H
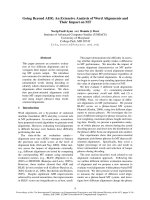
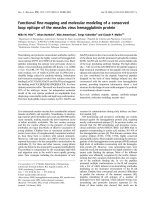
Figure 1 A combined barley genetic ma p of EST-based SNPs segreg ating in the Steptoe/Morex and/or the Oregon Wolfe mapping
population. De novo markers (blue) were integrated with previously mapped SNP loci (black) and common BIN markers (black and underlined).
Worch et al. BMC Plant Biology 2011, 11:1
/>Page 3 of 14
loci of drought-responsive genes represent novel means
for characterizing the genetic basis of drought tolerance in
barley and they may also provide useful information for
the construction of the barley physical map as the next
step towards genome sequencing.
The drought stress response of mapped transcripts over
development
To reveal the drought stress response of mapped tran-
scripts during vario us stages of development, we nor-
malized the expression data by utilizing the publicly
available expression data sets deposited in Gene Expres-
sion Omnibus (GEO) from five (GEO accession series
number: GGSE3170) and 21 (GSE6990) day old seed-
lings, flag leaves post anthesis (GSE15970), green spike
tissues (awn, lemma and palea, GSE17669) and own
data from developing grain during 20 days after fertiliza-
tion (DAF). A range of barley cultivars has been used to
generate these data, including the drought tolerant cv.
Martin and the susceptible cv. Moroc9-75, parents of
mapping and AB populations (OWB-D, OWB-R, Morex,
Brenda and Hs584). The clustering process identified
three major groups: groups 1 and 2 contained gen es
which are up-regulated as a result of drought stress,
while the ones in group 3 were down-regulated (Figure 2).
While group 2 genes showed up-regulation mostly in early
vegetative tissues, group 1 members were up-regulated
across all developmental stages, and were expressed in a
range of organs (seedlings, flag leaf , lemma, palea, and
awn and to a lesser extent in the developing grain). Thus,
group 1 genes could be considered to represent a core set
of drought responsive genes. The functional groups parti-
cularly overrepr esented in groups 1 and 2 included tran-
scription regulators, genes induced by abiotic stress, genes
responsible for the synthesis of storage proteins and genes
related to amino acid and carbohydrate metabolism, and
ABA-induced hormone related genes, calculated by Fish-
er’s exact test with a P-value cut off 0.01 (Figure 2 and
Additional file 3).
Regulators
An ABA signalling gene (protein phosphatase 2C, mar-
ker GBS3123), a bZIP ABA-responsive element binding
protein (GBS3212) were consistently up-regulated by
drought throughout development in barley (Figure 3). In
A. thaliana, protein phosphatase 2C regulates a Snf1-
related kinase [25], and mediates signal transduction to
an ABF2 transcription factor [26]. Thus in barley, it
seems likely that an ABA signalling pathway orches-
trates the adaptive response to drought, not just at the
seedling stage but also in the fla g leaf, awn, lemma
and palea (Figure 3). In addition several Ras family G-
proteins (GBS3161, GBS3162, GBS3163, GBS3245)
thought to be involved in ABA signalling are found to
be induced in 21 day seedlings and flag leaf (Figure 3).
Several ABA-induced late embryogenesis abundant pro-
teins (GBS3120, GBS3121, GBS3248) were induced to
drought in seedlings (Figure 3), and these have been
shown previously to be involved in desiccation tolerance
[27]. A number of ABA signalling related genes were
included in the geneti c map (Additional file 3). Other
transcription factors were induced by drought in a non-
organ specific manner; these included AP2/ERF II
(GBS3206), VII (GBS3208), VIII (GBS3207), bHLH
(GBS3210), bZIP (GBS3212, GBS3211), MYB (GB S3142,
GBS3145, GBS3219), NAC (GBS3146, GBS3147) and
several other unclassified factors (Figure 3). The specific
function(s) of most of these regulators remains unclear,
but their up-regulation by drought stress indicates that
they probably do play a role in the plant’sresponseto
water deficit.
Abiotic stress induced genes
Genes encoding dehydrin 9 , universal stress proteins,
hydrophobic proteins and various classes of heat shock
proteins (HSPs) were induced by drought across all the
developmental stages (Figure 2 group 1). Among the
HSPs were HSP70 (GBS3180); HSP81-1 (GBS3182) and
HSP26 (GBS3181), which mapped, respectively, to chro-
mosomes 1 H, 2 H and 4 H (Additional file 3). Other
HSPs were not so generally up-regulated by drought.
The up-regulation of HSP is consistent with their pre-
sumed protection of proteins from oxidative damage
induced by drought stress [28].
Drought response of mapped transcripts contributing to
seed quality
Barley grain storage proteins comprise a mixture of four
distinct prolamin polypeptides: the B- and g- (sulphur-
rich) hordeins, the C- (sulphur-poor) hordeins and the
high molecular weig ht D-hordeins. Th e hordein genes
are known to be organised in clusters encoding the
B-hordeins (Hor2 and Hor4), C-hordeins (Hor1), g-hor-
dein (Hor5) and D-hordein (Hor3) which are all located
on chromosome 1 H [29]. The present genetic map
showed that GBS3200, a marker for B1-hordein, lay
near the telomere of chromosome 1 H, while GBS3205
(marking another B1-hordein) was linked closer to
GBS3202 (B3-hordein), around 11 cM distant from
GBS3201 (g1-hordein). A third B-hordein marker
(GBS3204) was placed further apart, closer to g3-hor-
dein. Thus the B-hordein gene family is represented by
at least three different loci on the short arm of chromo-
some 1 H, while the g-ho rdein genes also map to two
distinct loci on the same chromosome arm (Figure 4).
The regulation of hordein family gene transcription
includes DNA methylation [30,31] a nd the concerted
action of distinct transcription factor families [32,33].
The expression of all the sulphur-rich hordein genes
was p romoted by drought in the awn, lemma and palea
Worch et al. BMC Plant Biology 2011, 11:1
/>Page 4 of 14
Seedling_drought (OWB-D)
Seedling_drought_OWB-R)
21day seedling_38%SWC (M)
21day seedling_19%SWC (M)
Flag leaf_1d drought (Ma)
Flag leaf_3d drought (Ma)
Flag leaf_5d drought (Ma)
Flag leaf_1d drought (Mo)
Seed 20DAF_drought (B)
21day seedling_7%SWC (M)
Flag leaf_3d drought (Mo)
Flag leaf_5d drought (Mo)
Lemma_ 4d drought (M)
Palea_ 4d drought (M)
Awn_ 4d drought (M)
Seed_ 4d drought (M)
Seed 20DAF_drought (Hs)
+3.0
1:1 -3.0
amino acid metabolism
carbohydrate metabolism
storage proteins
protein degradation
horomone: ABA
transcription factors
RNA binding
signalling: phosphoinositide
s
transporter
abiotic stress
amino acid metabolism
carbohydrate metabolism
storage proteins
protein degradation
horomone: ABA-induced
transcription factors
RNA binding
transporter
biotic/abiotic stress
signalling: G-proteins
photosynthesis
amino acid metabolism
carbohydrate metabolism
storage proteins
protein degradation
horomone: Jasmonate
transcription factors
RNA binding
transporter
biotic stress
unknown
signalling: calcium
Cluster group I
Cluster group II
Cluster group III
*
*
*
*
*
*
*
*
*
*
*
*
*
*
*
*
**
*
*
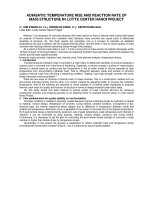
Figure 2 Expression profiles of barley genes responsive to drought. Expression ratios (drought vs control) are colour-coded: dark yellow >6
fold up-regulated, black no change, violet >6 fold down-regulated. The proportion of genes within a given functional transcript group is shown
in the corresponding pie chart on the right with significantly overrepresented gene categories marked by star symbol. Each gene is represented
as horizontal row (for order, see Additional file 3) and developmental stages are detailed in the vertical columns (d: days of exposure to drought
and %SWC: soil water content). Gene expression data refer to cvs. Brenda (B), Morex (M), Morocco (Mo), Martin (Ma), Oregon Wolf Barley-
Dominant (OWB-D), Oregon Wolf Barley-Recessive (OWB-R), Hs (H. spontaneum HS584). Expression data from individual replications are given in
Additional file 3.
Worch et al. BMC Plant Biology 2011, 11:1
/>Page 5 of 14
(Figure 4). Hordein transcripts first appear in the endo-
sperm at 12 days post anthesis, peaking in expression by
16 days, and then maintaining this level until grain
maturity [34,35]. The B1-hordein genes were induced in
developing seeds by drought stress in cv. Brenda, but
less pro minently so in HS584 (Figure 4), indicating dis-
tinct differences in B-hordein gene expression between
cultivated barley and its wild relative. Correspondingly,
the seed nitrogen/protein content also increased under
droughtinBrendabutnotinHS584.However,the
Seedling_drought (OWB-D)
Seedling_drought_OWB-R)
21day seedling_38%SWC (M)
21day seedling_19%SWC (M)
Flag leaf_1d drought (Ma)
Flag leaf_3d drought (Ma)
Flag leaf_5d drought (Ma)
Flag leaf_1d drought (Mo)
21day seedling_7%SWC (M)
Flag leaf_3d drought (Mo)
Flag leaf_5d drought (Mo)
Lemma_ 4d drought (M)
Awn_ 4d drought (M)
Seed_ 4d drought (M)
Seed 20DAF_drought (B)
Palea_ 4d drought (M)
Seed 20DAF_drought (Hs)
+3.0
1:1 -3.0
GBS3247: Contig14350_at: signalling.receptor kinases.Catharanthus roseus-like RLK
1
GBS3245: Contig3167_s_at: signalling.G-proteins
GBS3163: Contig10901_at: signalling.G-proteins
GBS3161: Contig5611_at: signalling.G-proteins
GBS3162: Contig3165_at: signalling.G-proteins
GBS3120: Contig8149_at: hormone metabolism.abscisic acid.induced-regulated
GBS3248: Contig1830_at: hormone metabolism.abscisic acid.induced-regulated
GBS3121: Contig6276_s_at: hormone metabolism.abscisic acid.induced-regulated
GBS3123: Contig9585_at: hormone metabolism.abscisic acid.signal transduction
GBS3166: Contig13498_at: signalling.receptor kinases.DUF 26
GBS3164: Contig3562_at: signalling.phosphinositides
GBS3165: Contig4218_at: signalling.phosphinositides
GBS3160: Contig7501_s_at: signalling.calcium
Seedling_drought (OWB-D)
Seedling_drought_OWB-R)
21day seedling_38%SWC (M)
21day seedling_19%SWC (M)
Flag leaf_1d drought (Ma)
Flag leaf_3d drought (Ma)
Flag leaf_5d drought (Ma)
Flag leaf_1d drought (Mo)
21day seedling_7%SWC (M)
Flag leaf_3d drought (Mo)
Flag leaf_5d drought (Mo)
Lemma_ 4d drought (M)
Awn_ 4d drought (M)
Seed_ 4d drought (M)
Seed 20DAF_drought (B)
Palea_ 4d drought (M)
Seed 20DAF_drought (Hs)
1:1 -3.0
GBS3153: Contig8947_at: transcription factor unclassified
GBS3149: Contig6099_at: putative DNA-binding protein
GBS3222: Contig3819_at: putative DNA-binding protein
GBS3219: Contig8132_at: MYB domain transcription factor family
GBS3143: Contig17371_at: Histone acetyltransferases
GBS3217: Contig5444_s_at: GRAS transcription factor family
GBS3140: Contig9333_s_at: C2H2 zinc finger family
GBS3139: Contig13200_at: C2C2(Zn) GATA transcription factor family
GBS3214: Contig20418_at: C2C2(Zn) DOF zinc finger family
GBS3213: Contig13989_at: C2C2(Zn) DOF zinc finger family
GBS3211: Contig9253_at: bZIP transcription factor family
GBS3209: HVSMEh0086A12r2_s_at: Argonaute
GBS3207: Contig6636_at: AP2/EREBP family
GBS3157: Contig10344_at: transcription factor unclassified
GBS3151: HVSMEf0011I05r2_s_at: transcription factor unclassified
GBS3148: Contig7464_at: putative DNA-binding protein
GBS3146: Contig5241_at: NAC domain transcription factor family
GBS3147: Contig3361_at: NAC domain transcription factor family
GBS3142: Contig9706_at: MYB-related transcription factor family
GBS3145: Contig8571_at: MYB domain transcription factor family
GBS3141: Contig8202_at: C3H zinc finger family
GBS3212: Contig21149_s_at: bZIP transcription factor family
GBS3210: Contig13678_s_at: bHLH,Basic Helix-Loop-Helix family
GBS3208: Contig3914_s_at: AP2/EREBP family
GBS3206: HA11J15u_s_at: AP2/EREBP family
+3.0
Figure 3 Expression profile s of mapped barley genes up-regulated by drought stress. Upper panel: hormone and signalling genes, lower
panel: transcription factor families. For abbreviations, see Figure 2 legend. Expression data from individual replications are given in Additional file 3.
Worch et al. BMC Plant Biology 2011, 11:1
/>Page 6 of 14
absolute levels remained high in the control plants
(Figure 4).
In contrast, the down-regulation of the gene family
members of key starch biosynthesis genes, sucrose
synthase, ADP-glucose pyrophosphorylase are down-
regulated by terminal drought stress in the post anthesis
period during 20 DAF (Figure 5A). Several genes asso-
ciated with the activity of the starc h branching enzyme
became activated by terminal drought stress, which h as
implications for the synthesis of amylopectin. Certain
genes involved in starch degradation (e.g., t hose encod-
ing sd1-ß-amylase and chloroplast-targeted ß-amylase)
were also induced by drough t stress, which points to a
concerted fine tuning of starch biosynthesis and degra-
dation in impairing seed starch accumulation and s eed
quality. However, many genes associated with carbohy-
drate metabolism i ncluding the genes encoding sucrose
synthase type I (GBS3129), ADP-glucose pyrophosphor-
ylase large subunit (GBS3259) and starch bran ching
enzyme class II (GBS3257) were up-regulated by
drought stress in seedlings, the flag leaf, the awn, lemma
and palea (Figure 5A). The production of starch in vege-
tative tissues of Arabidopsis thaliana has been found to
be negatively correlated with plant biomass [36]. Like-
wise, we might expect that star ch accumulation in vege-
tative tissues negatively affects plant growth under
drought stress.
Seedling_drought (OWB-D)
Seedling_drought_OWB-R)
21day seedling_38%SWC (M)
21day seedling_19%SWC (M)
Flag leaf_1d drought (Ma)
Flag leaf_3d drought (Ma)
Flag leaf_5d drought (Ma)
Flag leaf_1d drought (Mo)
Seed 20DAF_drought (Brenda)
21day seedling_7%SWC (M)
Flag leaf_3d drought (Mo)
Flag leaf_5d drought (Mo)
Lemma_ 4d drought (M)
Palea_ 4d drought (M)
Awn_ 4d drought (M)
Seed_ 4d drought (M)
Seed 20DAF_drought (Hs584)
+3.0
1:1 -3.0
GBS3200: X01778_x_at: hordein B1
GBS3205: Contig524_x_at: hordein B1
GBS3202: Contig209_s_at: gamma 3 hordein
GBS3201: Contig518_s_at: gamma 1 hordein
GBS3204: Contig585_x_at: hordein B
MWG837
ABA004
BCD098
Ica1
GBS3203: EBed07_SQ003_D02_x_at:
gamma 1 hordein
Pcr2
Glb1
ABG464
cMWG706a
BCD1930
ABC261
0.0
5.0
10.0
15.0
20.0
25.0
30.0
HvBrenda Hs584
control
stress
Crude Protein %
Figure 4 The cluster of sulphur-rich hordein genes on the
short-arm barley chromosome 1 H (left panel) and their
corresponding expression profiles during development. For
abbreviations, see Figure 2 legend. Expression data from individual
replications are given in Additional file 3. In the lower panel,
percent crude protein estimated based on seed nitrogen (N%) for
the two parents of introgression line population (H.vulgare Brenda
and H. spontaneum 584) from control and drought stress treatments
is presented.
Seedling_drought (OWB-D)
Seedling_drought_OWB-R)
21day seedling_38%SWC (M)
21day seedling_19%SWC (M)
Flag leaf_1d drought (Ma)
Flag leaf_3d drought (Ma)
Flag leaf_5d drought (Ma)
Flag leaf_1d drought (Mo)
21day seedling_7%SWC (M)
Flag leaf_3d drought (Mo)
Flag leaf_5d drought (Mo)
Lemma_ 4d drought (M)
Awn_ 4d drought (M)
Seed_ 4d drought (M)
Seed 20DAF_drought (B)
Palea_ 4d drought (M)
Seed 20DAF_drought (Hs)
+3.0
1:1 -3.0
A
GBS3125: Contig3952_at: alpha-amylase
GBS3126: Contig11522_at: chloroplast-targeted beta-amylase
STn21: Contig1406_at: Sd1 beta-amylase 1
STn20: Contig1411_s_at: beta-amylase
GBS3246: Contig3114_at: triose phosphate translocator
GBS3235: Contig11648_at: limit dextrinase
GBS3257: Contig3761_at: starch branching enzyme 2
STn08: Contig3541_s_at: starch branching enzyme I
STn17: Contig12208_at: granule bound starch synthase Ib
STn22: Contig1808_at: starch synthase I
GBS3256: Contig10765_at: ADP-glucose pyrophosphorylase small subunit B
STn19: Contig2267_s_at: ADP-glucose pyrophosphorylase small subunit A
GBS3259: Contig3390_at: ADP-glucose pyrophosphorylase large subunit
STn02: Contig823_at: sucrose synthase 3
STn10: Contig481_s_at: sucrose synthase 2
GBS3258: Contig481_at: sucrose synthase 2
STn16: Contig460_s_at: sucrose synthase 1
GBS3129: Contig361_s_at: sucrose synthase 1
STn13: Contig4153_at: hexokinase
GBS3127: Contig101_at: fructokinase I
GBS3128: Contig4521_s_at: sucrose-1-fructosyltransferase
H1 T A C C T InDel A G G C C C A A C C C G T 1
H2 T A C C T InDel A G G C C C A G C C C G T 1
H3 T AGCT GCCCCAT ATTAGC 9
H4 C A C T C InDel G C C T C C A A C C C A C 3
H5 T TGCT GCCCAAT ATTGAC 17
Σ 31
H1 T TT CAA AACCAGGG 11
H2 T TCC AA AA T CAGGG 1
H3 T T T C T G A A T C T G A A 1
H4 T TT CAA AA TC TGAA 3
H5 T TT CAA GCCCAGAA 3
H6 C GTAAA GCCC TAAA 9
H7 T TT CAA AA T T TGAA 1
Σ 29
B
Sucrose synthase I
Sucrose synthase II
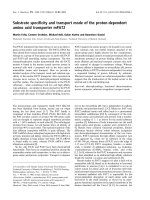
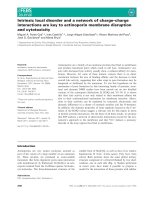
Figure 5 The expression profiles of a selection of starch biosynthesis/degradation genes responsive to drought during de velopment
(panel A). For abbreviations, see Figure 2 legend and expression data from individual replications are given in Additional file 3. The location of
SNPs and the resulting haplotypes (H) present in both sucrose synthase types I (GBS3129) and II (GBS3258) genes are given in panel B. Black
arrows indicate exonic regions and grey bars untranslated regions. Introns are represented by dashed lines. Shown below are the haplotype
groups with the respective polymorphisms and the number of lines per group. Triangles indicate accession-specific SNPs. Haplotypes of all the
genes detailed in Additional file 5. Correlation of seed starch content under drought to specific haplotypes of sucrose synthase type II is given in
Additional file 6.
Worch et al. BMC Plant Biology 2011, 11:1
/>Page 7 of 14
Haplotype analysis of carbohydrate metabolism genes
A detailed analysis of sequence variants within 17 starch
biosynthesis/degradation genes was conducted for a core
set of 32 accessions, which included landraces, elite
breeding lines, the mapping population parents and H.
spontaneum. This delivered 180 polymorphic sites
(SNPs and indels) across both intronic and exonic
sequence, and led to the recognition of 78 haplotypes
(Table 2). Overall the elite breeding lines, including cv.
Brenda, showed little haplotypic variation, but the
remaining materials fell into a number of haplotype
groups indicating broader genetic diversity. Figure 5B
summarizes the variation present within the genes
encoding sucrose synthase types I (CR-EST:HY09D18,
marker: GBS3129) and II (CR-EST:HA31O14, CR-EST:
HF08A21; GBS3258) whereas the haplotyping data for
the remaining genes are listed in Additional file 5.
Within the 360 bp re-sequenced region of the sucrose
synthase type I amplicon, 18 SNPs and a 3 bp indels
were found. Among the SNPs, 11 were situated within
an intron and seven (six synonymous) within an e xon;
the single non-synonymous SNP was a transition variant
present in cv. Morex, which converted a glycine residue
to a serine. The accessions could be classified into five
haplotypic groups (H1-H5), the largest of which (H5)
included all the elite b reeding lines and half of the
remaining H. vulgare accession s. H2 cont ained only one
ent ry (cv. Morex), as did H1 (HS584). H3 captured sev-
eral H. vulgare and the other H. spontaneum accessions,
as well as the Oregon Wolfe dominant parent. The Ore-
gon Wolfe recessive p arent fell i nto H4 along with two
other H. vulgare lines (Additional file 5).
GBS3258 represented about 550 bp of the sucrose
synthase type II sequence, and the re-sequencing of 29
accessions generated 14 SNPs. These allowed the recog-
nition of seven haplotypes (H1-H7), of which H2, H3
and H7 each contained only one accession. The elite
breeding lines were split among the two major groups
H1 and H6, along with most of the H. vulgare acces-
sions, although H6 also included ISR42-8, an H. sponta-
neum accession. Groups H4 and H5 each contained
three accessions, the former containing the remaining
H. spontaneum accessions, and the latter the remaining
H. vulgare ones.
The relatively high level of haplotype diversity in these
two sucrose synthase genes among non-elite lines sug-
gests that these genes have experienced selection pro-
cesses during the course of domestication and farmer’s
selection. However, for improving sink strength spe cific
haplotypes (H5 from sucrose synthase I, H1 and H6
from sucrose s ynthase II) were fixed in the elite lines
during the breeding. In maize, key s tarch biosynthesis
enzymes and soluble carbohydrates were measured from
field grown samples from hundred recombinant inbred
lines and revealed major QTLs close to the locus
sucrose synthase (Sh1) gene known to be linked to
improved starch accumulation [37]. To confirm the
importance of Sh1 locus, sucrose synthase gene
Table 2 Haplotype details for the core set of starch biosynthesis/degradation genes
EST BLAST search result Number of
haplotypes
SNPs InDels Approx. sequence length
(bp)
HY09D18 Sucrose synthase 1 5 18 1 360
HF08A21 Sucrose synthase 2 7 14 550
HA31O14 Sucrose synthase 2 5 4 750
HF21A17 Hexokinase 5 4 350
HY04O18 ADP-glucose pyrophosphorylase large subunit 5 4 350
HB16O10 ADP-glucose pyrophosphorylase small subunit (alternatively
spliced)
4 5 1050
HA31F12 ADP-glucose pyrophosphorylase small subunit 3 2 1000
HB05N09 Starch synthase I 2 1 1 900
HF05C15 Starch synthase IV 4 9 650
HY09J12 Granule-bound starch synthase 1b 4 5 350
HB30O07 Starch branching enzyme I 10 45 8 550
HB21K16 Starch branching enzyme IIa 2 1 550
HZ53C02 Beta-amylase 3 2 450
HF17A10 Beta amylase 4 3 1 280
HF11O03 Sd 1 beta-amylase 5 5 280
HZ60P11 Alpha glucosidase 4 35 3 1800
HB20O07 Gamma 2 hordein 6 9 300
Σ 78 166 14
Worch et al. BMC Plant Biology 2011, 11:1
/>Page 8 of 14
polymorphisms was analyzed in 45 genetically unrelated
maize lines. T herein, the Sh1 locus was also found to
significantly associate with higher starch and amylase
content as well as grain matter from multi-location
field trials [37]. In the present study also a high level
of allelic diversity was detected in the genes encod-
ing sucrose synthase I, sucrose synthase II, starch
branching enzyme I and a-glucosidase, while the genes
encoding both the small and large subunits of ADP-
glucose pyrophosphorylase were rather non-polymorphic
(Additional file 5).
Haplotype variation was also used to estimate the
extent of the genetic separation between cv. Brenda and
HS584. Among the 13 informative sequences, three har-
boured non-synonymous exonic SNPs . Two neighbou r-
ing SNPs within the granule bound starch synthase Ib
gene [CR-EST:HY09J12] were present in both HS584
and a number of the barley accessions, while the SNPs
present in b oth the ß-amylase [CR-EST:HF11O03] and
the g-2 hordein [CR-EST:HB20O07] genes were unique
to HS584. Another four genes (sucrose synthase type I
[CR-EST:HY09D18] and type II [CR-EST:HA31O14,
CR-EST:HF08A21], ADP-glucose pyrophosphorylase
small subunit sequence [CR-EST:HB16O10], and starch
branching enzyme I [CR-EST: HB30O07]) were found
to contain s ynonymous exonic substitutions. Intronic
SNPs were also detected in most of the genes, including
the ADP-glucose pyrophosphorylase small subunit
sequence [CR-EST:HB16O10], a gene known to
undergo alternative splicing[38].Thesedataconfirm
that wild barley alleles own the capability to alter pro-
tein sequences (non-synonymous SNPs), codon usage
(synonymous SNPs) and the splicing process (intronic
SNPs) and emphasize the potential of the Brenda/
HS584 introgression line population to serve as a
model for the investigation of favourable wild barley
alleles.
Intraspecific variation of grain starch content under
terminal drought
Identifying the molecular basis of phenotypic variation
can provide improved insights into the mechanisms
responsible for key agronomic traits such as grain yield
stability. Thus patterns of starch accumulation during
terminal drought were monitored for a diverse set of
50 barley accessions. A high genetic variation for grain
starch content was observed (Figure 6). The starch con-
tent of the non-stressed barley landraces varied from
450-680 mg/g dry weight, while among the elite breeding
lines, the range was 514-648 mg/g (Additional f ile 5 and
Figur e 6). Within gene bank accessions of H. vulgare and
H. spontaneum, two major classes were found; one class
suffered a reduction of up to 45% in the amount of starch
accumulated under terminal drought conditions, whereas
the other performed well in both well-watered and term-
inal drought conditions (Figure 6). Unlike the wild bar-
leys and the landraces, the sample of elite breeding lines
showed littl e variation for starch accumulation, although
0.0
100.0
200.0
300.0
400.0
500.0
600.0
700.0
800.0
mg/g DW
Mapping
population
Genebank accessions
Breeding lines
seed starch content
HvDOM
HV Morex
Hv Brenda
C
ontrol
Drought stress
HvREC
HvSteptoe
HvGolden Prom.
Hv1
Hv6
Hv10
HV15
HV18
HV21
Hv23
Hv25
HV27
Hv29
Hv31
Hv33
Hv2
Hv5
Hv7
Hv12
Hv17
Hv19
Hv22
Hv24
Hv26
Hv28
Hv30
Hv32
Hs584
Hs1
Hs3
Hs5
Hs2
Hs9
Hs4
Hs6
LP102
LP104
LP106
LP108
LP110
LP101
LP103
LP105
LP107
LP109
Hv13
Hv14
Hv4
Figure 6 Variatio n for seed starch content in 50 barley accessions. Seed star ch content measured from mature grain of control and
drought stress, which is expressed in mg/g dry weight (DW). Hv: H. vulgare, Hs: H. spontaneum. The breeding lines encoded “LP” represents yet
unreleased varieties bred by Lochow-KWS. Further accession details are provided in Additional file 8.
Worch et al. BMC Plant Biology 2011, 11:1
/>Page 9 of 14
many performed well under terminal drought stress.
Three accessions (LP101, LP107 and LP109) suffered a
slight reduction in grain starch content and, conse-
quently, thousand grain weight (TGW) when challenged
with terminal drought stress under both field and green
house conditions (Additional file 5). Int erestingly, those
lines which showed dramatic reduction of starch content
under terminal drought in comparison to their respective
controls possess haplotypes H3 (Hv32), H4 (Hs3, Hs5,
Hv10) and H5 (OWB-DOM, Hv29, Hv30) from sucrose
synthase II gene (starch content of control versus stress
with low correlation of R
2
= 0.4) and lines possessing
haplotype H6 (ISR42_8, Hv13, Hv20, Hv22, LP103,
LP104, LP106, LP107, LP110) from sucrose synthase II
gene correlate positively to optimum starch accumulation
under both control and drought treatments (with R
2
=
0.9 at a significance level of a =0.01usingSteiger’ s
Z-test for Pearson correlation) [ Additional file 6]. Simi-
larly, we also noticed a higher genetic variatio n for TGW
of barley landraces not only under control conditions but
also under drought stress (Additional file 7). Moreover,
global correlation analysis between seed starch content
andanaverageofTGWobtainedfrommulti-location
field trials from two consecutive years (2007 and 2008)
using both methods (water withhold and potassium treat-
ments) and green house screening for all genotypes
under drought stress conditions signifies correlation with
R
2
= 0.72 at a significance level of a = 0.01 using Steiger’s
Z-test for Pearson correlation (Figure 7). The origin and
IG-number is provided for all 50 barley accessions in
Additional file 8.
Conclusions
The genetic mapping of 141 drought regulated ESTs has
extended the abiotic stress SNP map of barley [7] by a
further 134 novel markers. An extensive expression ana-
lysis of these ESTs at various developmental stages for
drought response and across a range of barley acces-
sions resulted in creating an expression map for geneti-
cally mapped markers. The mapped candidate genes
have been reported to co-segrega te with drought related
traits, which fall into diverse functional categories like
stress response (e.g. dehydrin [39,40]), transcription fac-
tors (e.g. CBF [5]), carbo hydrate metabolism (e.g.
sucrose synthase [3]) and many more [3,6,41,42]. The
map also disclosed an interesting correlation between
several clusters of sulphur-rich hordeins on the short
arm of chromosome 1 H and their co-expression, poten-
tially linked to methylation based regulation [30,31].
The haplotype structure of 17 starch biosynthesis/
degradation genes was explored, revealing that the genes
encoding sucrose synthase (both types I and II) and
starch synthase were surprisingly variable in wild barley
and landraces. S uperior alleles related to haplotype H5
from sucrose synthase I and H6 from sucrose synthase
II were found to be present in the studied breeding lines
too, selected for improved performance. This observa-
tion provides additional evidence that these alleles may
be causally associated with improved starch accumula-
tion under control as well as terminal drought stress
conditions. The gained knowledge represent s a valuable
source for the development of functional markers to
assess larger collections of barley accessions for the cor-
relation of relevant haplotypes of starch biosynthesis/
degra dation genes to seed starch content under drought
and, therefore, for further improvement of barley culti-
vars in terms of improved grain weight.
Methods
Plant material, starch and DNA extraction
The eight barley accessions from which ESTs were re-
sequenced were the parents of mapping populations cvs.
Steptoe and Morex [43], the parents of the Oregon
Wolfe population [44] and the parents of AB popula-
tions cv. Scarlett and ISR42_8 [22], and cv. Brenda and
the H. spontaneum accession 584 [21]. The Steptoe/
Morex and Oregon Wolfe m apping populations com-
prised 80 and 94 individuals, respectively. Total genomic
DNA was extracted from 4-6 g young leaf material,
using the protocol described in [45].
A set of 50 barley accessions was assembled from the
IPK Gatersleben and the ICARDA genebanks, and these,
along with cv. Brenda and H. spontaneum accession
584 (HS584), were grown till flowering under a 16 h
light/20°C, 8 h dark/15°C regime. Te rminal drought
stress was imposed for a period of three weeks beginning
one week after fertilization (8 DAF) during the post-
anthesis period. The automatic watering procedure was
monitored by a DL2e data logger (Delta T) with S M200
sensors connecte d to individual pots. This enabled to
maintain the control plants at 60% soil mo isture and
drought stres sed plants at 10% soil mois ture. Mature
seeds were harvested from the mature plants of control
and drought stressed plants and estimated TGW using
R
2
= 0.7235
0
20
40
60
80
300 400 500 600 70
0
Seed starch content
(
m
g
/
g)
1000 grain weight
(
g
)
Figure 7 Scat ter plot and correlation ana lysis of seed starch
content and thousand grain weight (TGW) under terminal
drought stress. For further details refer ‘Methods’ section.
Worch et al. BMC Plant Biology 2011, 11:1
/>Page 10 of 14
MARVIN seed counter. For each line, three independ ent
replicates were maintained for both control and drought
stress treatments and for each replicate seeds were
pooled from five plants.
Starch was extracted from ground mature grains in
80% v/v ethanol at 60°C, each followed by a centrifuga-
tion (15 min, 14,000 g). The final supernatant was
discarded and the remaining pellet used for the quantifi-
cation of starch content [46]. Starch content is mea-
sured from three replicates.
Crude protein content (%) was obtained by multiply-
ing seed N% with the factor 5.83 [47]. Total seed N%
was measured using elemental analyzer (Vario EL; E le-
mentar analyse system).
All 50 accessions were also subjected to drought stress
in the field at breeding station, Nordsaat Böhnshausen
over the two consecutive years (2007 and 2008) by fol-
lowing two different strategies. Strategy I: All genotypes
were planted as two-row plots per entry with two replica-
tions in randomized blocks, directly on soil in a closed
green house/rain shelter which completely protects rain
fall. Control p lants were irrigated four times during the
period from seed set until seed filling. For imposing
terminal drought stress, ten days post anthesis staged
plants were subjected to water withhold by stopping irri-
gation until the end of grain development. Strategy II: All
genoty pes were planted as three-row plots per entry with
two replications in randomized blocks. Control plants
remained untreated. For mimicking drought stress treat-
ments 10% w/v potassium iodide is sprayed to whole
plant at ten days post anthesis. After reaching maturity,
all the genotypes of the two replicates from two strategies
were harvested by hand and TGW and seed quality was
determined in Nordsaat seed quality laboratory.
Correlation analysis was carried out between TGW data
and starch content under drought stress. To consider sea-
sonal variability, lines in each year were z-score nor mal-
ized, and then variance was calculated across the years.
The Z-score normalized TGW data for all accessions are
shown as h eat maps (Additional file 7). Those lines with
too high varia nce levels were excluded from the correla-
tion analysis. For the remaining lines, average values of
TGW data were calculated across the years (2007 and
2008) from field and rain shelter as well as green house
experiments. These averaged TGW data were correlated
with the corresponding average values of green house
replicates of seed starch content from drought treatments
using the Pearson correlation measure. Statistical signifi-
cance of the cal culated r
2
values was assessed using Stei-
ger’s z-test at a significance level of a = 0.01 [48].
SNP discovery and detection
For the sequences identified in the CR-EST database (clus-
tering project g03) />GeneRunner software was
applied to design PCR primer pairs each amplifying a 300-
600 bp fragment from an individual EST. Each 50 μl PCR
contained 50-100 ng genomic DNA template, 1.5 mM
MgCl
2
, 0.2 mM dNTP, 10 μM of each primer and 1U Taq
DNA polymerase. After an initial denatura tion of 96°C/ 2
min, the reactio ns were cycled 14 times through 94°C/30
s, 72°C (-1°C/cycle)/20 s and 72°C/90 s, and then a further
27 times through 94°C/30 s, 58°C/20 s and 72°C/90 s,
before a final extension step of 72°C/3 min. After checking
for correct amplification, each reaction was then purified
using a MinElute™96 UF PCR Purification kit (Qiagen, Hil-
den, Germany) according to the manufacturer’sinstruc-
tions, and subjected to cycle sequencing from both ends
using the relevant PCR primers. Cycle sequencing was
performed with the BigDye Terminator v3.1 ready reaction
cycle sequencing kit on an ABI 3730 × 1 sequencer
(Applied Biosystems). The re-sequenced ESTs were
aligned using the SeqMan tool within the Lasergene soft-
ware package to identify SNPs.
According to the annotation of polymorphisms, haplotype
groups were determined for a core set of starch biosynth-
esis/degradation genes (Table 2).
SNP detection was carried out by pyrosequencing.
Corresponding assays were designed with the Pyrose-
quencing™Assay Design Software Version 1.0.6 (Biotage
AB, Uppsala, Sweden). Genomic DNA was amplified as
above, except that one primer was biotinylated, and the
extension step was shortened from 90 s to 30 s. Strepta-
vidin Sepharose™ High Performance (GE Healthcare
Bioscience s, Uppsala, Sweden) was used to obtain single
stranded amplicons. SNP genotyping was performed
using the PSQ HS 96A System (Biotage AB, Uppsala,
Sweden). Further information on template preparation
and the pyrosequencing protocol can be found in [49].
Linkage mapping
JoinMap
®
v4 [50] was used to construct a genetic map
based on a combination of the de novo Steptoe/Morex
and Oregon Wolfe population SNP and already pub-
lished genotypic data [10]. Re combination fractions were
converted to cM using the Kosambi mapping function,
with the following JoinMap settings: minimum LOD
score = 1.0, recombination threshold = 0.4, ripple value
= 0 1 and jump threshold = 0 5. For chromosomes 3 H
and 6 H, the marker order of the reference map [10]
was chosen as the starting order.
Affymetrix BarleyI GeneChip analysis
To identify drought regulated gene sets at various stages of
development, Affymetrix chip CEL files derived from both
control and drought-treated seedlings (Series GSE3170),
21 day old plants (Series GSE6990), flag leaves (Series
GSE15970) [17], awn, lemma, palea, and the early stages
Worch et al. BMC Plant Biology 2011, 11:1
/>Page 11 of 14
of the developing grain (Series GSE17669) [51] were
downloaded and merged with in house expression data
obtained from developing grain 20 DAF from cv. Brenda
andHS584.RNAwasobtainedfromtwoindependent
replicates. For each replicate seeds were pooled from
five plants. The developing grain harvested from the
central part of the spike from both control and drought
treated plants of cv. Brenda and HS584 according to
[52]. The RNA was isolated using the TRIzol reagent
(Invitrogen GmbH, Karlsruhe, Germany) and RNAeasy
columns (Qiagen, Hilden, Germany). Probe synthesis,
labelling and hybridization were performed according to
the manufacturer’s protocols (Affymetrix). The expres-
sion of 22,000 genes extracted from all e xperiments was
subjected to RMA normalization, applying a linear
model via the limma package using R/Bioconductor
functions in Robin software [53]. After normalization,
log2 expression values were derived to generate fold dif-
ferences between non-stressed and drought stressed
organs from independent experiments. A nested multi-
ple testing strategy was applied, using the Benjamini-
Hochberg P-value correction (P-value cut-off 0.05) to
recognize significant differences in expression levels. A
selection of 141 mapped genes was made from the 613
genes identified, and analysed for expression differences
between watered and water withhold plants at various
developmental stages. These log fold-change expression
data is first subjected to hierarchical clustering and
obtained clusters groups was refined by applying a
K-means clustering method according to [35]. Heat
maps were generated using Genesis software [54]. The
differentially expressed genes were functionally assigned
according to [35]. Functionally overrepresented gene
categories have been calculated by Fisher’ s exact test
with a P-value cut off 0.01 [35].
Additional material
Additional file 1: Classification of ESTs according to MapMan
functional categories [35].
Additional file 2: SNP frequency and the number of mapped
markers per population (shown in parenthesis). SM: Steptoe-Morex
population, OWB: Oregon Wolfe mapping population, Sc_ISR42_8: H.
vulgare cultivar Scarlett-H. spontaneum ISR48 introgression line
population, BHS584: H. vulgare cultivar Brenda- H. spontaneum584
introgression line population.
Additional file 3: Genes whose expression was induced/repressed
by drought stress imposed at various stages of development. Their
map location, putative function and normalized expressio n ratios (control
vs drought stressed) are indicated. Statistical significance is indicated as
0: non-significant, -1 significantly up-regulated, +1 significantly down-
regulated under drought.
Additional file 4: De novo SNP markers. int. ID: internal identification
number, off. ID: official identification number, Chr.: chromosome location,
unigene A35: unigene number, according to HarvEST:Barley assembly 35
, EST: identifier taken either from the CR-EST
database, or from the Affymetrix Barley Contigs, alt. EST: identifier of
alternative (orthologous) ESTs used for primer design, Locusprimer: the
sequence of the PCR primers used for re-sequencing,
Pyrosequencingprimer: the sequence of the PCR primers used for
pyrosequencing. “Redundancy to other SNP maps” indicates that the
same gene target is present in one or more of four independent genetic
maps; “Genotype” refers to the population tested; “Dispensation orde r”
indicates the dispensation order applied in pyrosequencing.
Additional file 5: Haplotype groups based on observed variation in
a set of 17 starch biosynthesis/degradation genes are provided.
Additionally shown are the seed starch content values for each line
under drought as well as control conditions. A detailed list of accessions,
their origin and IG-number is also supplied.
Additional file 6: Correlations between seed starch content of
control and drought stress from the accessions pertaining specific
haplotypes in sucrose synthase.
Additional file 7: Heatmap of Z-score normalized thousand grain
weight (TGW) data from drought stress experiments of field-grown
(F), rain shelter (RS) from the two consecutive years (2007 and
2008). Red colour indicates higher TGW, yellow -medium and blue
-lower TGW.
Additional file 8: Detailed list of accessions, their origin and IG-
number is provided.
List of abbreviations
AB: advanced backcross; DAF: days after fertilization; DW: dry weight; EST:
expressed sequence tag; GBS: Gatersleben barley SNP; OWB: Oregon Wolfe
Barleys; PCA: principal component analysis; RMA: robust multichip average;
SNP: single nucleotide polymorphism; SM: Steptoe × Morex mapping
population; TF: transcription factor; TGW: thousand grain weight
Acknowledgements
We thank A nette Heber, Jana Lorenz, Gabriele Einert and Katrin Blaschek
for their excellent technical assistance and Prof. K. Pillen for providing
samples of ISR42-8 and cv. Scarlett. We gre atly appreciat e the help of Dr.
Marc Strickert for language improvement and for the help in bioinformatic
analysis of field phenotypic data and correlation analysis. This resea rch was
financially supported by a grant from the German Ministry of Education
and Research (BMBF) (Project GABI-GRAIN: FKZ; 0315041A).
Author details
1
Leibniz-Institute of Plant Genetics and Crop Plant Research (IPK),
Corrensstr.3, 06466 Gatersleben, Germany.
2
KWS LOCHOW GmbH, Ferdinand-
von-Lochow-Str.5, 29303 Bergen, Germany.
3
Nordsaat Saatzucht GmbH,
Böhnshauser Straße 1, 38895 Langenstein, Germany.
Authors’ contributions
SW carried out the molecular genetic analysis, sequence alignment and
linkage mapping, and participated in the design of experiments and the
drafting of the marker part of the manuscript. CP designed the PCR primers,
while RK and VTH performed the glasshouse drought tolerance assessments,
measured starch content and isolated RNA. AB, VK and LK provided genetic
material and conducted the field-based drought screening. MSR monitored
the marker study and co-edited the part of manuscript, along with UW who
conceived the study. NS coordinated the work of the GABI-GRAIN
consortium, contributed to the development of concepts, conducted gene
expression analysis and critically revised the manuscript. All the authors have
read and approved the final manuscript.
Received: 9 June 2010 Accepted: 4 January 2011
Published: 4 January 2011
References
1. Pennisi E: Plant genetics. The blue revolution, drop by drop, gene by
gene. Science 2008, 320:171-173.
2. Chen G, Krugman T, Fahima T, Chen K, Hu Y, Röder M, Nevo E, Korol A:
Chromosomal regions controlling seedling drought resistance in Israeli wild
barley, Hordeum spontaneum C. Koch. Genet Resour Crop Evol 2010, 57:85-99.
Worch et al. BMC Plant Biology 2011, 11:1
/>Page 12 of 14
3. Diab AA, Teulat-Merah B, This D, Ozturk NZ, Benscher D, Sorrells ME:
Identification of drought-inducible genes and differentially expressed
sequence tags in barley. Theor Appl Genet 2004, 109:1417-1425.
4. Teulat B, Merah O, Sirault X, Borries C, Waugh R, This D: QTLs for grain
carbon isotope discrimination in field-grown barley. Theor Appl Genet
2002, 106:118-126.
5. Tondelli A, Francia E, Barabaschi D, Aprile A, Skinner JS, Stockinger EJ,
Stanca AM, Pecchioni N: Mapping regulatory genes as candidates for
cold and drought stress tolerance in barley. Theor Appl Genet 2006,
112:445-454.
6. von Korff M, Grando S, Del Greco A, This D, Baum M, Ceccarelli S:
Quantitative trait loci associated with adaptation to Mediterranean
dryland conditions in barley. Theor Appl Genet 2008, 117:653-669.
7. Rostoks N, Mudie S, Cardle L, Russell J, Ramsay L, Booth A, Svensson JT,
Wanamaker SI, Walia H, Rodriguez EM, et al: Genome-wide SNP discovery
and linkage analysis in barley based on genes responsive to abiotic
stress. Mol Genet Genomics 2005, 274:515-527.
8. Close TJ, Bhat PR, Lonardi S, Wu Y, Rostoks N, Ramsay L, Druka A, Stein N,
Svensson JT, Wanamaker S, et al: Development and implementation of
high-throughput SNP genotyping in barley. BMC Genomics 2009, 10:582.
9. Sato K, Nankaku N, Takeda K: A high-density transcript linkage map of
barley derived from a single population. Heredity 2009, 103:110-117.
10. Stein N, Prasad M, Scholz U, Thiel T, Zhang H, Wolf M, Kota R, Varshney RK,
Perovic D, Grosse I, Graner A: A 1,000-loci transcript map of the barley
genome: new anchoring points for integrative grass genomics. Theor
Appl Genet 2007, 114:823-839.
11. Feuillet C, Langridge P, Waugh R: Cereal breeding takes a walk on the
wild side. Trends Genet 2008, 24:24-32.
12. Schmalenbach I, Pillen K: Detection and verification of malting quality QTLs
using wild barley introgression lines. Theor Appl Genet 2009, 118:1411-1427.
13. von Korff M, Wang H, Leon J, Pillen K: AB-QTL analysis in spring barley: II.
Detection of favourable exotic alleles for agronomic traits introgressed
from wild barley (H. vulgare ssp. spontaneum). Theor Appl Genet 2006,
112:1221-1231.
14. Backes G, Madsen LH, Jaiser H, Stougaard J, Herz M, Mohler V, Jahoor A:
Localisation of genes for resistance against Blumeria graminis f.sp.
hordei and Puccinia graminis in a cross between a barley cultivar and a
wild barley (Hordeum vulgare ssp. spontaneum) line. Theor Appl Genet
2003, 106:353-362.
15. von Korff M, Wang H, Leon J, Pillen K: AB-QTL analysis in spring barley. I.
Detection of resistance genes against powdery mildew, leaf rust and
scald introgressed from wild barley. Theor Appl Genet 2005, 111:583-590.
16. Shavrukov Y, Gupta NK, Miyazaki J, Baho MN, Chalmers KJ, Tester M,
Langridge P, Collins NC:
HvNax3-a locus controlling shoot sodium
exclusion
derived from wild barley (Hordeum vulgare ssp. spontaneum).
Funct Integr Genomics 2010, 10:277-291.
17. Guo P, Baum M, Grando S, Ceccarelli S, Bai G, Li R, von Korff M,
Varshney RK, Graner A, Valkoun J: Differentially expressed genes between
drought-tolerant and drought-sensitive barley genotypes in response to
drought stress during the reproductive stage. J Exp Bot 2009,
60:3531-3544.
18. Hubner S, Hoffken M, Oren E, Haseneyer G, Stein N, Graner A, Schmid K,
Fridman E: Strong correlation of wild barley (Hordeum spontaneum)
population structure with temperature and precipitation variation. Mol
Ecol 2009, 18:1523-1536.
19. James VA, Neibaur I, Altpeter F: Stress inducible expression of the DREB1A
transcription factor from xeric, Hordeum spontaneum L. in turf and
forage grass (Paspalum notatum Flugge) enhances abiotic stress
tolerance. Transgenic Res 2008, 17:93-104.
20. Pietsch C, Sreenivasulu N, Wobus U, Röder MS: Linkage mapping of
putative regulator genes of barley grain development characterized by
expression profiling. BMC Plant Biol 2009, 9:4.
21. Li JZ, Huang XQ, Heinrichs F, Ganal MW, Röder MS: Analysis of QTLs for
yield components, agronomic traits, and disease resistance in an
advanced backcross population of spring barley. Genome 2006,
49:454-466.
22. von Korff M, Wang H, Leon J, Pillen K: Development of candidate
introgression lines using an exotic barley accession (Hordeum vulgare
ssp. spontaneum) as donor. Theor Appl Genet 2004, 109:1736-1745.
23. Marcel TC, Varshney RK, Barbieri M, Jafary H, de Kock MJ, Graner A, Niks RE:
A high-density consensus map of barley to compare the distribution of
QTLs for partial resistance to Puccinia hordei and of defence gene
homologues. Theor Appl Genet 2007, 114:487-500.
24. Varshney RK, Marcel TC, Ramsay L, Russell J, Röder MS, Stein N, Waugh R,
Langridge P, Niks RE, Graner A: A high density barley microsatellite
consensus map with 775 SSR loci. Theor Appl Genet 2007, 114:1091-1103.
25. Vlad F, Rubio S, Rodrigues A, Sirichandra C, Belin C, Robert N, Leung J,
Rodriguez PL, Lauriere C, Merlot S: Protein phosphatases 2C regulate the
activation of the Snf1-related kinase OST1 by abscisic acid in
Arabidopsis. Plant Cell 2009, 21:3170-3184.
26. Fujii H, Chinnusamy V, Rodrigues A, Rubio S, Antoni R, Park SY, Cutler SR,
Sheen J, Rodriguez PL, Zhu JK: In vitro reconstitution of an abscisic acid
signalling pathway. Nature 2009, 462:660-664.
27. Sreenivasulu N, Sopory SK, Kavi Kishor PB: Deciphering the regulatory
mechanisms of abiotic stress tolerance in plants by genomic
approaches. Gene 2007, 388:1-13.
28. Miller G, Mittler R: Could heat shock transcription factors function as
hydrogen peroxide sensors in plants? Ann Bot 2006, 98:279-288.
29. Pelger S, Säll T, Bengtsson BO: Evolution of hordein gene organization in
three Hordeurn species.
Hereditas 1993, 119:219-231.
30.
Radchuk VV, Sreenivasulu N, Radchuk RI, Wobus U, Weschke W: The
methylation cycle and its possible functions in barley endosperm
development. Plant Mol Biol 2005, 59:289-307.
31. Sorensen MB: Methylation of B-hordein genes in barley endosperm is
inversely correlated with gene activity and affected by the regulatory
gene Lys3. Proc Natl Acad Sci USA 1992, 89:4119-4123.
32. Haseneyer G, Stracke S, Piepho HP, Sauer S, Geiger HH, Graner A: DNA
polymorphisms and haplotype patterns of transcription factors involved
in barley endosperm development are associated with key agronomic
traits. BMC Plant Biol 2010, 10:5.
33. Sreenivasulu N, Borisjuk L, Junker B, Mock HP, R olletschek H, Sei ffert U,
Weschke W, Wobus U: Barley grain development: towards an
integrative view. International Review of Cell and Molecular Biology 2010,
281:49-89.
34. Sreenivasulu N, Radchuk V, Strickert M, Miersch O, Weschke W, Wobus U:
Gene expression patterns reveal tissue-specific signaling networks
controlling programmed cell death and ABA- regulated maturation in
developing barley seeds. Plant J 2006, 47:310-327.
35. Sreenivasulu N, Usadel B, Winter A, Radchuk V, Scholz U, Stein N,
Weschke W, Strickert M, Close TJ, Stitt M, et al: Barley grain maturation
and germination: metabolic pathway and regulatory network
commonalities and differences highlighted by new MapMan/PageMan
profiling tools. Plant Physiol 2008, 146:1738-1758.
36. Sulpice R, Pyl ET, Ishihara H, Trenkamp S, Steinfath M, Witucka-Wall H,
Gibon Y, Usadel B, Poree F, Piques MC, et al: Starch as a major integrator
in the regulation of plant growth. Proc Natl Acad Sci USA 2009,
106:10348-10353.
37. Thévenot C, Simond-Cote E, Reyss A, Manicacci D, Trouverie J, Le
Guilloux M, Ginhoux V, Sidicina F, Prioul JL: QTLs for enzyme activities and
soluble carbohydrates involved in starch accumulation during grain
filling in maize. J Exp Bot 2005, 56:945-958.
38. Radchuk VV, Borisjuk L, Sreenivasulu N, Merx K, Mock HP, Rolletschek H,
Wobus U, Weschke W: Spatiotemporal profiling of starch biosynthesis and
degradation in the developing barley grain. Plant Physiol 2009, 150:190-204.
39. Pan A, Hayes PM, Chen F, Chen THH, Blake T, Wright S, Karsai I, Bedö Z:
Genetic analysis of the components of winterhardiness in barley
(Hordeum vulgare L.). Theor Appl Genet 1994, 89:900-910.
40. Teulat B, Zoumarou-Wallis N, Rotter B, Ben Salem M, Bahri H, This D: QTL
for relative water content in field-grown barley and their stability across
Mediterranean environments. Theor Appl Genet 2003, 108:181-188.
41. Chen G, Komatsuda T, Pourkheirandish M, Sameri M, Sato K, Krugman T,
Fahima T, Korol AB, Nevo E: Mapping of the eibi1 gene responsible for
the drought hypersensitive cuticle in wild barley (Hordeum
spontaneum). Breeding Science 2009, 59:21-26.
42. Chen G, Pourkheirandish M, Sameri M, Wang N, Nair S, Shi Y, Li C, Nevo E,
Komatsuda T: Genetic targeting of candidate genes for drought sensitive
gene eibi1 of wild barley (Hordeum spontaneum).
Breeding Science 2009,
59:637-644.
43.
Kleinhofs A, Kilian A, Saghai Maroof MA, Biyashev RM, Hayes P, Chen FQ,
Lapitan N, Fenwick A, Blake TK, Kanazin V, et al: A molecular, isozyme and
morphological map of the barley (Hordeum vulgare) genome. Theor Appl
Genet 1993, 86:705-712.
Worch et al. BMC Plant Biology 2011, 11:1
/>Page 13 of 14
44. Costa JM, Corey A, Hayes PM, Jobet C, Kleinhofs A, Kopisch-Obusch A,
Kramer SF, Kudrna D, Li M, Riera-Lizarazu O, et al: Molecular mapping of
the Oregon Wolfe Barleys: a phenotypically polymorphic doubled-
haploid population. Theor Appl Genet 2001, 103:415-424.
45. Plaschke J, Ganal MW, Röder MS: Detection of genetic diversity in closely
related bread wheat using microsatellite markers. Theor Appl Genet 1995,
91:1001-1007.
46. Rolletschek H, Koch K, Wobus U, Borisjuk L: Positional cues for the starch/
lipid balance in maize kernels and resource partitioning to the embryo.
Plant J 2005, 42:69-83.
47. Merrill A, Watt BK: Energy value of foods, basis and derivation. United
States Department of Agriculture Handbook 74 USDA, Washington, DC; 1973.
48. Steiger JH: Tests for comparing elements of a correlation matrix.
Psychological Bulletin 1980, 87:245-251.
49. Huang XQ, Röder MS: Development of SNP assays for genotyping the
puroindoline b gene for grain hardness in wheat using pyrosequencing.
J Agric Food Chem 2005, 53:2070-2075.
50. Van Ooijen JW: JoinMap 4, Software for the calculation of genetic linkage
maps in experimental populations Wageningen, Netherlands: Kyazma B. V;
2006.
51. Abebe T, Melmaiee K, Berg V, Wise RP: Drought response in the spikes of
barley: gene expression in the lemma, palea, awn, and seed. Funct Integr
Genomics 2010, 10:191-205.
52. Sreenivasulu N, Altschmied L, Radchuk V, Gubatz S, Wobus U, Weschke W:
Transcript profiles and deduced changes of metabolic pathways in
maternal and filial tissues of developing barley grains. Plant J 2004,
37:539-553.
53. Lohse M, Nunes-Nesi A, Krüger P, Nagel A, Hannemann J, Giorgi FM,
Childs L, Osorio S, Walther D, Selbig J, et al: Robin: An intuitive wizard
application for R-based expression microarray quality assessment and
analysis. Plant Physiol 2010, 153:642-651.
54. Sturn A, Quackenbush J, Trajanoski Z: Genesis: cluster analysis of
microarray data. Bioinformatics 2002, 18:207-208.
doi:10.1186/1471-2229-11-1
Cite this article as: Worch et al.: Haplotyping, linkage mapping and
expression analysis of barley genes regulated by terminal drought
stress influencing seed quality. BMC Plant Biology 2011 11:1.
Submit your next manuscript to BioMed Central
and take full advantage of:
• Convenient online submission
• Thorough peer review
• No space constraints or color figure charges
• Immediate publication on acceptance
• Inclusion in PubMed, CAS, Scopus and Google Scholar
• Research which is freely available for redistribution
Submit your manuscript at
www.biomedcentral.com/submit
Worch et al. BMC Plant Biology 2011, 11:1
/>Page 14 of 14