báo cáo khoa học: " High levels of nucleotide diversity and fast decline of linkage disequilibrium in rye (Secale cereale L.) genes involved in frost response" doc
Bạn đang xem bản rút gọn của tài liệu. Xem và tải ngay bản đầy đủ của tài liệu tại đây (1.16 MB, 14 trang )
RESEARCH ARTICLE Open Access
High levels of nucleotide diversity and fast
decline of linkage disequilibrium in rye (Secale
cereale L.) genes involved in frost response
Yongle Li
1
, Grit Haseneyer
1
, Chris-Carolin Schön
1
, Donna Ankerst
2
, Viktor Korzun
3
, Peer Wilde
3
, Eva Bauer
1*
Abstract
Background: Rye (Secale cereale L.) is the most frost tolerant cereal species. As an outcrossing species, rye exhibits
high levels of intraspecific diversity, which makes it well-suited for allele mining in genes involved in the frost
responsive network. For investigating genetic diversity and the extent of linkage disequilibrium (LD) we analyzed
eleven candidate genes and 37 microsatellite markers in 201 lines from five Eastern and Middle European rye
populations.
Results: A total of 147 single nucleotide polymorphisms (SNPs) and nine insertion-deletion polymorphisms were
found within 7,639 bp of DNA sequence from eleven candidate genes, resulting in an average SNP frequency of
1 SNP/52 bp. Nucleotide and haplotype diversity of candidate genes were high with average values π = 5.6 × 10
-3
and Hd = 0.59, respectively. According to an analysis of molecular variance (AMOVA), most of the genetic variation
was found between indi viduals within popul ations. Haplotype frequencies varied markedly between the candidate
genes. ScCbf14, ScVrn1, and ScDhn1 were dominated by a single haplotype, while the other 8 genes (ScCbf2,
ScCbf6, ScCbf9b, ScCbf11, ScCbf12, ScCbf15, ScIce2, and ScDhn3) had a more balanced haplotype frequency
distribution. Intra-genic LD decayed rapidly, within approximately 520 bp on average. Genome-wide LD based on
microsatellites was low.
Conclusions: The Middle European population did not differ substantially from the four Eastern Europ ean
populations in terms of haplotype frequencies or in the level of nucleotide diversity. The low LD in rye compared
to self-pollinating species promises a high resolution in genome-wide association mapping. SNPs discovered in the
promoters or coding regions, which attribute to non-synonymous substitutions, are suitable candidates for
association mapping.
Background
Rye (Secale cereale L.) is a cross-pollinated cereal with a
diploid genome. It is grown on approximat ely 6 million
hectares in Europe for bread-making, animal feed, forage
feeding, and vodka production (FAO, 2010). As the
most frost tolerant small grain cereal [1] it is well-suited
for investigations of frost tolerance. Findings in rye are
of interest for less frost tolerant cereals such as wheat
and barley.
Cold and frost stress, namely chilling injury at tem-
peratures lower than 10°C and freezing injury at tem-
peratures lower than 0°C, adversely affect plant growth
and productivity via cellular damage, dehydration and
metabolic reaction slow-down. A major focus of this
study was to investigate candidate genes with a put ative
role in frost tolerance. Frost tolerance has a polygenic
inheritance. Many genes involved in the cold/frost
responsive network have been identified in Arabidopsis
via quantitative trait loci (QTL) mapping, microarray
analysis and transgenic expression [2,3]. These genes are
mainly involved in stress signalling, transcriptional regu-
lation, and direct response to cold/frost, including cellu-
lar membrane stabilization. The gene
Inducer of Cbf
Expression 2 (Ice2) is a basic helix-loop-helix transcrip-
tion factor that binds to promoters of the
C-repeat
Binding Factor (Cbf) gene family and activates their
transcription under frost stress in hexaploid wheat [4].
* Correspondence:
1
Technische Universität München, Plant Breeding, Freising, Germany
Full list of author information is available at the end of the article
Li et al. BMC Plant Biology 2011, 11:6
/>© 2011 Li et al; licensee BioMed Central Ltd. This is an Open Access article di stributed under the terms of the Creative Commons
Attribution License (http://creativec ommons.org/licenses/by/2.0), which permits unrestricted use, distribution, and reproduction in
any medium, pro vided the original work is properly cited.
Over-expression of Arabidopsis Ice2 [5] results in
increased tolerance to deep freezing stress at a tempera-
ture of -20C° after cold acclimation. The Cbf gene
family belongs to the family of APETALA2 transcription
factors. In barley, diploid and hexaploid wheat several
cereal Cbf homologs have been cloned and mapped to
the Fr2 locus on homoeologous group 5, which coin-
cides w ith a major QTL fo r frost tolerance [6-8]. Using
wheat-rye addition lines, Campoli et al. [9] assigned
twelve members of the Cbf gene family to the long arm
of chromosome 5R in rye. Several studies in Arabidopsis
provide evidence that allelic variation in the Cbf gene
family forms the molecular basis for the freezing toler-
ance QTL [10,11]. Cbf transcription factors activate
Cold Responsive (COR) genes through binding to cis-ele-
ments in the promoters of COR genes under cold stress
in Arabidopsis [12]. More than 70 proteins encoded by
COR genes are involved in direct respons e to cold/frost.
Dehydrins, also known as Late Embryogenesis Abundant
II (LEA II), are among the proteins that protect other
proteins and membranes from cellular damage caused
by dehydration [13]. In barley, 13 dehydrin genes (Dhn
1-13) have been identified [14]. Transcripts of Dhn1,
Dhn2, Dhn3, Dhn4, Dhn7,andDhn9 were detected in
plants subjected to cold acclimation at 4°C followed by
mild frost at -2°C or -4°C [15]. Dhn1 and Dhn3 were
mapped in barley to chromosome 5H near a QTL for
winter hardiness and on chromosome 6H, respectively
[13]. Recent studies showed that cold/frost regulation
and vernalization are interconnecte d [16,17]. Winter
cereals require long exposure to cold in winter, the so-
called vernalization, to accelerate flowering in the next
spring. This process prevents the early transition of win-
ter cereals into the less cold-tolerant reproductive phase.
Vrn1 has been mapped to the second locus conferring
frost tolerance, Fr1, on the long arm of homoeologous
group 5 near the Fr2 locus [18]. Transcript levels of all
cold-induced Cbf genes at the frost tolerance locus
Fr-H2 in barley are significantly higher in lines harbour-
ing the vrn1 winter allele than in lines harbo uring the
Vrn1 spring allele [19]. It remains unknown how the Cbf
family members interact with Vrn1 under frost stress.
To unveil genetic diversity among candidate genes
involved in the frost response network in rye, one Middle
European and four Eastern European populations were
studied. Cultivated rye shows a wide range of diversity,
reflecting adaptation to various environments and selec-
tion pressures [20]. Middle European populations are
well-adapted to the more moderate Middle European cli-
mate which is in the transition zone between temperate
and continental climate, whereas Eastern European
populations show good adaptation to a continental cli-
mate with severe winters. Thus, differences between Mid-
dle and Eastern European populations in allele number
and/or frequencies of frost-related candidate genes are
expected. Several studies have investigated genome-wide
genetic diversity in rye based on molecular markers,
including isoenzymes [21] and simple sequence repeats
(SSRs) [22]. N one, however, have investigated locus-spe-
cific genetic diversity at the gene level.
Linkage disequilibrium (LD), the non-random combi-
nation of alleles at different loci, determines the mar-
ker density required for marker-based studies, such as
association mapping or genomic selection [ 23]. Studies
on the extent of L D in various crops, such as Triticum
durum [24], Zea mays [25,26], and Sorghum bicolor
[27], indicate large variation in the extent of LD. The
effect of germplasm on LD is clearly observed in barley,
where LD decays within 0.4 kb in wild material and
extends up to 212 kb in elite lines [28]. LD decay can
also vary considerably from locus to locus due to dif-
ferent recombination rates and selection pressures at
different regions of the genome. In addition, higher
levels of LD are observed in self-pollinating species
compared t o outcrossing species, indicating that mat-
ing systems play a role [23]. Since rye is an outcrossing
species, a low level of LD with a rapid decay is
expected. To the best of our knowledge there is no
prior study on the pattern of LD within and between
rye genes.
The objectives of this study were to investigate
nucleotide and haplotype diversity, the extent and pat-
tern of LD, and population differences among eleven
candidate genes (ScCbf2, ScCbf6, ScCbf9b, ScCbf11,
ScCbf12, ScCbf14, ScCbf15
, Sc
Vrn1, ScIce2, ScDhn1,and
ScDhn3)involvedinthefrosttolerancenetworkinfive
winter rye populations from Belarus, Germany and
Poland.
Methods
Plant material and DNA extraction
Plant material was derived from five open-pollinated
winter rye breeding populations, four from Eastern Eur-
ope, PR 2733 (Belarus), EKOAGRO (Poland), SMH2502
(Poland), ROM103 (Poland), and one from Middle Eur-
ope, Petkus (Germany). For convenience, they will be
referredtoasPR,EKO,SMH,ROM,andPetkus,
respectively. The Petkus population has undergone sev-
eral cycles of recurrent selection, while the breeding his-
tory of the four Eastern European p opulations is
unknown. Since rye is an outcrossing species, it is highly
heterozygous, which le ads to d ifficulties in determining
haplotype phase. To address this problem, gamete cap-
ture was performed. Between 15 and 68 heterozygous
plants from each of the five populations were crossed
with the self-fertile inbred line L o152 resulting in 201
heterozygous S
0
plants, each w ith one gamete known.
The plants were grown in a growth chamber and DNA
Li et al. BMC Plant Biology 2011, 11:6
/>Page 2 of 14
was extracted from leaves according to Rogowsky
et al. [29].
Candidate gene selection and primer design
Eleven candidate genes, ScCbf2 , ScCbf6, ScCbf9b,
ScCbf11, ScCbf12, ScCbf14, ScCbf15, ScVrn1, ScIce2,
ScDhn1 , and ScDhn3, were selected based on their asso-
ciation with frost tolerance in closely related species.
Individual Cbf genes were selected based on an expres-
sion study in rye [30] and linkage mapping in barley
and diploid wheat [6,8], Vrn1 based on linkage mapping
and a real-time PCR expression study in wheat [18,31],
Ice2 based on an expression study in wheat [4], and
Dhn1 and Dhn3 based on an expression study in barley
[14]. We followed the Cbf nomenclature proposed by
Skinner et al. [32], whereby names with the same num-
ber followed by different letters describe highly identical
but distinct genes, for example, the highly identical
Cbf9a and Cbf9b genes first identified by Jaglo e t al.
[33]. Prime rs for all genes were designed using Primer-
BLAST from the NCBI database (.
nih.gov/tools/primer-blast/) based on sequences avail-
able in GenBank; information can be found in Addi-
tional file 1. Due to limit ed information on rye DNA
sequences in GenBank, primers for ScVrn1, ScIce2 ,
ScDhn1 and ScDhn3 were designed based on homolo-
gous genes in H. vulgare, T. aestivum and T. monococ-
cum. D espite lack of homology in non-coding regions,
putative functional regions of the candidate genes could
be amplified. A 250 bp fragment of the promoter a nd
first exon of ScVrn1 was amplified since there is evi-
dence that this region is one of the determinants of win-
ter/spring growth habit in barley and wheat [34,35].
Amplification of candidate genes and DNA sequencing
Fourteen fragments of eleven candidate genes were
amplified by PCR in 10 μl reaction volumes containing
10 ng DNA, 150 nM of each primer, 1x Taq DNA poly-
merase reaction buffer, 1.5 or 2.0 mM MgCl
2
,0.2mM
of each dNTP, and 0.5 U Taq DNA polymerase. After
an initial denaturation at 96°C for 10 min, 35 cycles
were conducted at 96°C for 1 min, primer-specific
annealing temperatures at 5 2-66°C for 1 min, 72°C for
1 min, and a final extension step at 72°C for 15 min.
Details on candidate gene amplification were described
in Additional file 1. The PCR products were purified in
96-well MultiScreen PCR plates (Millipore Corporation,
Bill erica, MA, USA) and directly sequenced through the
QIAGEN sequencing service (QIAGEN, Hilden, Ger-
many). Amplicons of each S
0
plant were sequenced with
both forward and reverse PCR primers. Sequence data
were assembled into contigs and SNPs were detected
using the software Variant Reporter™ V1.0 (Applied
Biosystems, Foster City, CA, USA). The DNA sequence
of Lo152, a homozygous inbred line, was used as the
reference sequence, and alleles of this common parent
were subtracted from all sequences to determine the
haplotype phase. Heterozygous insertion and deletion
events were detected manually by checking sequences
from both strands. The web-based program Indelligent
v1.2 ( was used to
resolve heterozygous insertion-deletion events (Indels).
In case of large Indels, for example, 200 bp in ScCbf2,
which Indelligent could not resolve, amplico ns from the
respective lines were sub-cloned using the TOPO TA
Cloning Kit (Invitrogen, Carlsbad, CA, USA). At least
five clones were sequenced to resolve heterozygous
Indels. Sequences of the Lo152 reference alleles from
the eleven candidate genes were submitted to GenBank
under accession numbers HQ730763-HQ730773.
The actual numbers of successful PCR amplification of
the 201 lines differed from gene to gene ranging from
128 lines (64%) in ScCbf11 to 198 (98% ) in ScVrn1.
Missing amplification products in individual lines were
most likely the result of SNPs/Indels in the primer bind-
ing sites. However, absence of some Cbf genes in parti-
cular lines, as has recently been reported in barley and
wheat[36,37]cannotbeexcludedasanalternative
explanation.
Sequence analysis
Sequence polymorphisms were deduced from sequence
comparisons in gene-wise sequence alignments. For con-
venience, polymorphic sites along the sequence were num-
bered starting with “SNP1”. Lo152 alleles were excluded
from all analyses. Haplotypes and haplotype frequencies
were determined within each candidate gene using DnaSP
v5.10 [39] and Arlequin v3.1 [40], respectively.
Nucleotide diversity (π) w as calculated as the average
number of nucleotide differences per site between two
sequences for both, the complete sequences and
restricted to exons, and haplotype diversity (Hd)asthe
probability that two randomly chosen haplotypes from a
given population were different [37]. Analyses of nucleo-
tide and haplotype diversity were performed separately
for each population as well as for all populations grouped
together using the software DnaSP v5.10. DnaSP v5.10
does not take into acco unt alignment gaps that may lead
to underestimated diversity values. Hence, to avoid
potential bias, Indels were treated as single polymorphic
sites. Average nucleotide diversity (π)overallgeneswas
calculated using concatenated sequences in software
TASSEL v2.1 ( />To test for selection Tajima’s D was calculated as the
difference between the mean pairwise nucleotide differ-
ences (π) and the number of segre gating sites ( S) rela-
tive to their st andard error using the software DnaSP
v5.10. The statistical significance of Tajima’ s D was
Li et al. BMC Plant Biology 2011, 11:6
/>Page 3 of 14
obtained assuming that D follows t he beta distribution
[38]. The rate ratio of non-synonymous to synonymous
substitutions (d
N
/d
S
) was calculated according to the
method introduced by Yang and Nielsen [41] implemen-
ted in the program YN00 of software package PAML
v4.4c [38]. Signi ficant departure from the standa rd neu-
tral model, i.e. d
N
/d
S
= 1, was assessed by the likelihood
ratio test implemented in the CODEML program of
PAML v4.4c.
SSR genotyping and genetic diversity analyses
Thirty seven SSR markers were chosen based on their
experimental quality and map location as providing
comprehensive coverage of the rye genome. Primers and
PCR conditions for rye microsatellite (RMS) and Secale
cereale microsatellite (SCM) markers were described in
detail by Khlestkina et al. [39] and Hackauf and Wehling
[40], respectively. Fragments were separated using a
3130xl Genetic Analyzer (Applied Biosystems Inc., Fos-
ter City, CA, USA), and allele sizes were assigned using
the program GENEMAPPER (Applied Biosystems Inc.,
Foster City, CA, USA). Genotyping data obtained from
the SSR analyses of the 201 lines were used for the fol-
lowing calculations. Polymorphic information content
(PIC) was estimated using PowerMarker v3.0 [41], and
95% confidence intervals were calculated based on
10,000 bootstrap replications. To eliminate bias where by
the observed number of alleles highly depends on the
number of analysed genotypes, allelic richness (Rs)was
estimated from a rarefaction method [42] imple mented
in Fstat v2.9.3 [43]. B riefly, the method estimates the
expected number of alleles in a sub-sample of n geno-
types, given that N genotypes have been sampled at a
locus, where N ≥ n. Specifically, in this study, it was cal-
culated as
R
N
n
s
i
s
NN
i
n
=−
⎛
⎝
⎜
⎜
⎞
⎠
⎟
⎟
⎛
⎝
⎜
⎞
⎠
⎟
⎡
⎣
⎢
⎢
⎢
⎢
⎢
⎤
⎦
⎥
⎥
⎥
⎥
⎥
−
=
∑
1
1
where N was the number of observed genotypes (201
or less), N
i
the number of genotypes with type i alleles
among the N genot ypes, n the number of genotypes in
each population, and S was the total number of alleles
among the N genotypes. To visualize the degree of var-
iation within and between populations, principal co-
ordinate analysis (PCoA) was performed using NTSYSpc
v2.2 (Applied Biostatistics Inc., Setauket, NY, USA)
based on DICE similarity coefficients for SSRs and hap-
lotypes of candidate genes [44]. Analysis of molecular
variance (AMOVA) [45] was performed based on SSRs
using Arlequin v3.1 [46] with 15,000 permutations of
the data to estimate sta tistical significance at P <0.001
for each variance component in Fisher’s exact test. The
Lo152 alleles were excluded from all analyses.
Linkage disequilibrium
Linkage disequilibrium was measured by the parameter
r
2
[47] for candidate genes and SSR markers using
DnaSP v5.10 and TASSEL v2.1, respect ively, with Indels
treated as single polymorphic sites and SNPs with
minor allele freque ncies (MAF) < 0.05 excluded due to
instability. Statistical significance of LD was calculated
using Fisher’ s exact test [48] and decay examined
expl oratorily by graphs of pairwise distances (bp) versus
r
2
. Under the mutation-drift-equilibrium model, the
expected value of r
2
is
E 1/ 1 4
2
() ,rNc=+
()
where N is the effective population size, and c is the
recombination f raction between sites. With assumption
of a low mutation rate and an adjustment for sample
size, the expectation becomes [49]:
Er
n
()
()( )
()( )
()( )
2
2
10
211
1
31212
211
=
+
++
⎡
⎣
⎢
⎤
⎦
⎥
+
+++
++
⎡
Γ
ΓΓ
ΓΓΓ
ΓΓ
⎣⎣
⎢
⎢
⎤
⎦
⎥
⎥
,
where Γ =4Nc and n is the number of lines com-
pared. The LD dec ay curve was estimated using a non-
linear least-squares estimate of Γ fit by the nls function
in the R software package, http://www.r-proje ct.org,
separately for each population and for all populations
pooled together. The approach of Breseghello and Sor-
rells [50] was used to determine threshold values of r
2
that indicated significant LD. Briefly, r
2
values were esti-
mated from 37 unlinked S SR markers a nd square root
transformed so that they would be better approximated
by a Normal distribution. The 95th percentile from the
empirical distribution of all pairwise r (n = 666) derived
from the 37 unlinked SSR markers was selected as the
threshold value, with the ra tionale that any values above
the threshold could in high likelihood be attributable to
genetic linkage. Threshold values were calculated sepa-
rately for each population and for all populations pooled
together. The extent of LD was estimated as the point
where the LD decay curve passed below the threshold.
Results
DNA sequence polymorphisms
In total, 7,639 bp from eleven candidate genes in 201
rye lines were amplified resulting in 147 SNPs, nine
Indels, and an average SNP frequency of 1 SNP/52 bp
(Table 1). Thirty nine SNPs were non-synonymous poly-
morphisms resulting in amino acid replacements, 15 of
which changed polar ity. In the Cbf gene family, ScCbf9b
Li et al. BMC Plant Biology 2011, 11:6
/>Page 4 of 14
Table 1 Summary information of candidate gene (CG) sequences: Analyzed fragment length, gene coverage, number of lines, number of SNPs, rate ratio of
non-synonymous to synonymous substitutions (d
N
/d
S
), number of Indels and haplotypes, haplotype (Hd) and nucleotide diversity (π), Tajima’s D, and linkage
disequilibrium (LD)
CG Fragment length
(bp)
Gene
coverage
a
No. of
lines
b
No. of SNPs
c
(non-synonymous)
d
N
/d
S
No. of
Indels
No. of
haplotypes
Hd ±SD π ±SD×10
-3
(only exon)
Tajima’s D Intra-genic LD
(r
2
)
ScCbf2 619 5’UTR/E 169 2 (0) 0.001 1 7 0.67 ±
0.02
1.5 ± 0.1 (1.4 ±
0.1)
1.17 0.13
ScCbf6 495 E 197 3 (0) 0.023 0 9 0.44 ±
0.04
3.6 ± 0.3 -0.35 0.77
ScCbf9b 1,371 5’UTR/E/3’UTR 183 30 (10) 0.174*** 1 95 0.98 ±
0.03
7.1 ± 0.3 (11.5 ±
0.2)
1.71 0.14
ScCbf11 623 E 128 27 (12) 0.165 0 12 0.65 ±
0.02
14.5 ± 0. 9 1.74 0.51
ScCbf12 754 5’UTR/E/3’UTR 141 25 (8) 0.286*** 1 48 0.89 ±
0.02
8.8 ± 1.0 (7.7 ±
0.1)
0.40 0.38
ScCbf14 560 E 185 5 (3) 0.606** 0 4 0.17 ±
0.04
1.5 ± 0.3 -0.27 0.92
ScCbf15 502 E 172 3 (3) 1.490*** 1 9 0.68 ±
0.04
3.0 ± 0.2 2.14* 0.30
ScDhn1 435 5’UTR/E 138 4 (1) 0.128** 2 12 0.33 ±
0.05
2.7 ± 0.5 (4.4 ±
0.1)
-1.86* 0.48
ScDhn3 514 I/E/3’UTR 130 12 (2) 0.229*** 2 21 0.73 ±
0.03
8.1 ± 0.6 (8.9 ±
0.1)
0.008 0.25
ScIce2 1,224 I/E 189 36
d
n.a. 0 32 0.80 ±
0.02
11.2 ± 0.6 (0) 2.34* 0.36
ScVrn1 542 5’UTR/E 198 0 n.a. 1 2 0.11 ±
0.03
0.4 ± 0.1 (0) -0.33 n.a.
Total 7,639 147 (39) 9 251
a
E: exon; UTR: untranslated region; I: intron.
b
Failure of amplification in some of the lines may be due to the presence of SNPs/Indels in the binding sites of the sequences and/or the absence of some of the Cbf genes in some particular lines.
c
Minor allele frequency (MAF) > 0.05.
d
SNPs are silent since they were all located in the first intron of the gene.
Significance levels: * P < 0.05, ** P < 0.01, *** P < 0.001.
n.a.: not available.
Li et al. BMC Plant Biology 2011, 11:6
/>Page 5 of 14
had the highest number of SNPs (N = 30), of which ten
were non-synonymous and three l ed to an exchange of
amino acids of di fferent polarity. The f irst intron and
second exon comprising 20% of the coding sequence o f
ScIce2 were amplified, resulting in the identification of
36 SNPs, all located in the first intron. A 250 bp frag-
ment of th e promoter and firs t exon of ScVrn1 wa s
ampli fied but no polymorphic site was identifi ed, except
for a 2 bp Indel. Out of nine Indels identified, seven
were located in the non-coding regions of ScCbf2,
ScCbf9b, ScVrn1, ScDhn1,andScDhn3 and two in the
coding regions of ScCbf12 and ScCbf15 without causing
a frame shift (Table 1). It is noteworthy that the 200 bp
Indel in the promoter of ScCbf2 contained two MYB
and one MYC cis-elements, putative binding sites for
the transcription factor ScIce2.
Locus-wise and genome-wide genetic diversity
Nucleotide diversity (π)rangedfrom0.4×10
-3
in
ScVrn1 to 14.5 × 10
-3
in ScCbf11, and when restricted
to exons, from 0 in ScIce2 and ScVrn1 to 14.5 × 10
-3
in
ScCbf11 (Table 1). The biggest differen ce between ana-
lyses of π for the whole gene compared to restriction to
exons occurred in ScIce2 where π decreased from 11.2
to 0 due to absence of SNPs in the exon. Haplotype
diversity (Hd)rangedfrom0.11inScVrn1 to 0.98 in
ScCbf9b. A significant posit ive Tajima’ s D value was
observed over all populations for ScCbf15 and ScIce2,
whereas a significant negative value was observed in
ScDhn1. Rate ratios of non-synonymous to synonymous
substitutions (d
N
/d
S
)were<1forScCbf2, ScCbf6,
ScCbf9b, ScCbf11, ScCbf12, ScCbf14, ScDhn1,and
ScDhn3. ScCbf15 was the only gene with a d
N
/d
S
ratio > 1. d
N
/d
S
was significant for ScCbf9b, ScCbf12,
ScCbf14, ScCbf15, ScDhn1,andScDhn3.Duetolackof
polymorphisms in their coding sequences d
N
/d
S
was not
calculated for ScIce2 and ScVrn1.
In the SMH population, ScCbf6, ScIce2,andScDhn 1
had reduced nucleotide and haplotype diversities. Simi-
larly in the PR and EKO populations, respectively,
ScCbf11 and ScCbf15 had reduced nucleotide and haplo-
type diversities compared to the other genes (Additional
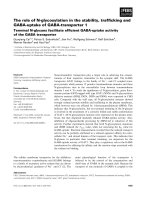
file 2). Haplotype frequencies varied markedly between
candidate genes, with some candidate gene s dominated
by a single haplotype and others with a more balanced
haplotype frequency distribution (Figure 1). For exam-
ple, in ScCbf14, ScVrn1,andScDhn1, the most frequent
haplotype occurred in more than 70% of genotypes,
whereas in ScCbf9b all haplotypes occurred with fre-
quencies less than 10%. The finding i n ScCbf9b can be
attributed to a large number of haplotypes (N = 95)
with high haplotype diversity primarily generated by
polymorphic sites located in the coding region. Simi-
larly, only five of 48 haplotypes in ScCbf12 occurred at a
frequency greater than 10%. For ScCbf14, all populations
had a similar distribution of haplotype frequencies.
However, for ScCbf15 haplotypes 1, 2, 3, and 4 were
evenly distributed in PR, whereas in the other four
populations only two haplotypes (EKO and SMH: 1
and 2; ROM and Petkus: 1 and 4) were prevalent (80% -
95%). For ScCbf11, haplotype 1 was predominant in the
PR and Petkus populations, occurring in 82% and 57%
of lines, r especti vely, whereas haplotype 2 predominated
in EKO (67%) and SMH (75%).
Genetic diversity within the five populations was sum-
marised based on 37 genome-wide SSR markers
(Table 2). A total of 230 alleles and an average of 6.2
alleles per locus were observed. PIC varied from 0.37 ±
0.02 to 0.51 ± 001 with an average of 0.47. Allelic rich-
ness, which is not affected by sample size, ranged from
2.51 to 3.43, with a mean of 3. 16. PIC was highly corre-
lated w ith allelic richness (r = 0.965). Compared to the
four Eastern European populations, the Petkus popula-
tion had a slightly lower mean number of alleles per
locus, PIC, allelic richness and number of private al leles,
despite the fact that it had the largest population size.
Genetic diversities of individual SSR markers across the
five populations are provided in Additional file 3.
Genetic variation within and between populations
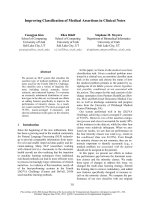
PCoA of candidat e gene haplotypes rev ealed large
genetic variation within each population and no cluster-
ing according to population membership (Figure 2). The
first and second principal co-ordinates explained 10.3%
and 9.7% of the total genetic variation, respectively.
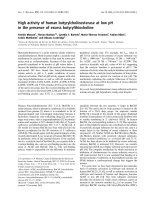
PCoA of the 37 genome-wide SSRs similarly identified
most genetic variation as residing within populations
(Figure 3). However, it could differentiate the Petkus
population from all Eastern European populations, and
the PR population from the other three Eastern
European ones. The first and second principal co-ordi-
nates explained 7.3% and 4.1% of the total genetic varia-
tion, respectively. AMOVA revealed low variation
(13.3%) between populations, but high variation (86.7%)
within populations (Additional file 4).
Linkage disequilibrium
The mean r
2
for pairs of SNPs within candidate genes
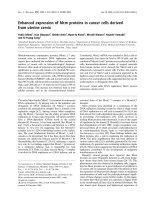
ranged from 0.13 to 0.92 (Table 1). Two strong LD
blocks were observed, one in the coding sequence of
ScCbf14 and one in the promoter region of ScCbf9b,
with mean r
2
values 0.92 and 0.85 within the two LD
blocks, respectively (Figure 4). In ScCbf11,twostrong
LD blocks were observed, one in the interval from SNP1
to SNP12 spanning 99 bp (mean r
2
within LD b lock =
0.93), and one from SNP17 to SNP27, spanning 243 bp
(mean r
2
within LD bl ock = 0.98). On the contrary, low
LD was observed in ScCbf2 (mean r
2
= 0.13), ScDhn3
Li et al. BMC Plant Biology 2011, 11:6
/>Page 6 of 14
(mean r
2
= 0.25) and in the coding sequence of ScCbf9b
(mean r
2
=0.14).EstimationofLDinScIce2 was per-
formed based on 36 SNPs (mean r
2
= 0.36), all located
in the first intron of the gene. There were three strong
LDblocks,fromSNP1toSNP18(block1),SNP19to
SNP31 (block 2), and SNP32 to SNP36 (block 3), span-
ning 458 bp, 187 bp, and 61 bp, with a mean r
2
within
LD blocks of 0.85, 0.75, and 0.73, respecti vely. Interest-
ingly, the mean r
2
between blocks 2 and 3 decreased to
0.35, between blocks 1 and 2, further to 0.10, and
between blocks 1 and 3, to 0.13. The inter-gen ic LD
among the ScCbf genes was very low (mean r
2
= 0.05),
and only ScCbf14 showed a slightly higher LD (mean r
2
= 0.15) than ScCbf9b (data not shown). Threshold values
of r
2
as determined from 37 unlinked SSR markers var-
ied from 0.16 over all populations to 0.46 in the SMH
population. The average extent of significant LD pooling
all candidate genes and populations together was
PR(27)
EKO(30)
SMH(14)
ROM(34)
Petkus(61)
PR(32)
EKO(42)
SMH(15)
ROM(36)
Petkus(69)
PR(29)
EKO(38)
SMH(14)
ROM(39)
Petkus(59)
PR(12)
EKO(30)
SMH(4)
ROM(25)
Petkus(28)
PR(20)
EKO(32)
SMH(12)
ROM(33)
Petkus(43)
PR(23)
EKO(39)
SMH(14)
ROM(40)
Petkus(66)
PR(28)
EKO(41)
SMH(13)
ROM(37)
Petkus(49)
PR(29)
EKO(44)
SMH(14)
ROM(40)
Petkus(68)
PR(28)
EKO(42)
SMH(15)
ROM(38)
Petkus(63)
PR(18)
EKO(35)
SMH(11)
ROM(28)
Petkus(44)
PR(23)
EKO(23)
SMH(13)
ROM(21)
Petkus(49)
0 10 20 30 40 50 60 70 80 90 100
Percentage
ScCbf2
Sc
Cbf6
Sc
Cbf9b
Sc
Cbf11
Sc
Cbf12
Sc
Cbf14
ScCbf15
ScVrn
1
ScIce
2
ScDhn
1
ScDhn
3
0 10 20 30 40 50 60 70 80 90 100
Percentage
1 2 3 4 5 6 7 8 9 10 11 12 13 14 15 16
17 18 19
20 21 22 23 24 25 26 27 28 29 30 31 32 MAF<0.05
Figure 1 Haplotype frequencies of eleven candidate genes in five rye populations (PR, EKO, SMH, ROM, Petkus). The different
haplotypes occurring within each gene are represented by different coloured bars (see legend). Haplotypes occurring at a frequency < 0.05 are
pooled and shown as black bars. The number of investigated lines in each population is shown in brackets.
Li et al. BMC Plant Biology 2011, 11:6
/>Page 7 of 14
approxim ately 520 bp (Figure 5). There wer e 2,194 pair-
wise comp arisons of polymorphic sites , of which almost
one third were significant as determined by Fisher’ s
exact test. The average extent of significant LD in indi-
vidual populations was much smaller because of more
stringentthresholdvaluesandrangedfrom0to
approximately 380 bp in the S MH and Petkus popula-
tions, respectively. Extent of LD ranged from approxi-
mately 80 bp in ScCbf15 to 800 bp in ScIce2 (Additional
file 5). In ScCbf11, ScCbf14,andScDhn1, mean r
2
remained larger than 0.16 within the 400 bp amplified
region. As expected LD based on genome-wide SSR
markers was low with a mean r
2
=0.01(datanot
shown).
Discussion
High level of nucleotide and haplotype diversity in rye
We investigated the genetic diversity of five winter rye
populations from Middle and Eastern Europe. SNP fre-
quency and nucleotide diversity are affected by several
factors, including selection, m utation, mating system,
effective population size, and demography [51]. SNP fr e-
quency observed in the 5 rye populations under study
was on average 1 SNP every 52 bp and the average
nucleotide diversity (π) ranged from 0.4 × 10
-3
to 14. 5 ×
10
-3
with an average value of π =5.6×10
-3
.These
values are as high as those reported in maize landraces,
where one study reported a rate of one SNP per 62 bp,
a range of π from 0.1 × 10
-3
to 13.3 × 10
-3
and an aver-
age value of π equal to 4.0 × 10
-3
[52]. Some studies
have suggested that comparisons among different spe-
cies should be restricted to homologous genes [53].
Nucleotide diversities of three Cbf homologs (AtCbf1,
AtCbf2 and AtCbf3)in34Arabidopsis ecotypes ranged
from π =2.6×10
-3
to 6.9 × 10
-3
[54], a smaller range
compared to this study (π =1.5×10
-3
to 14.5 × 10
-3
),
which is likely due to the different mating system. In
addition, the Cbf gene family in rye encompasses more
members than in Arabidopsis, which could result
in less selection pressure on individual genes with
Table 2 Genetic diversity within populations based on 37 SSR markers
Population No. of lines No. of private alleles
a
(%) Average no. of alleles (range) PIC
b
± SD Allelic richness
c
PR 33 20 (12.1%) 4.46 (2-12) 0.50 ± 0.02 3.43
EKO 44 14 (8.8%) 4.30 (2-18) 0.49 ± 0.03 3.28
SMH 15 3 (2.4%) 3.38 (1-9) 0.46 ± 0.03 3.18
ROM 41 13 (7.7%) 4.50 (2-13) 0.51 ± 0.01 3.38
Petkus 68 4 (3.6%) 3.00 (1-10) 0.37 ± 0.02 2.51
Mean 10.80 3.93 0.47 3.16
a
Private alleles denotes the number of alleles which occurred only in one population.
b
PIC
:
Polymorphic information content, a higher value means higher genetic diversity.
c
Allelic richness is a measure of the number of alleles independent of sample size, a higher value means higher genetic diversity.
PCo2
(
9.7%
)
PCo1
(
10.3%
)
-
0.64
-
0.35
-
0.06
0.23
0.51
2
-0.69
-0.38
-0.06
0.25
0.57
PR
EKO
SMH
ROM
Petku
s
Figure 2 Principal co-ordinate anal ysis of 201 rye lines from
five populations (PR, EKO, SMH, ROM, Petkus) based on
candidate gene haplotypes. Analysis was based on a similarity
matrix of candidate gene haplotypes. PCo1 and PCo2 are the first
and second principal co-ordinates and percentages indicate percent
variation explained.
PCo2 (4.1%)
PCo1
(
7.3%
)
Di 1
-0.52 -0.28 -0.04 0.20 0.44
-0.36
-0.17
0.02
0.21
0.40
PR
EKO
SMH
ROM
Petku
s
Figure 3 Principal co-ordinate anal ysis of 201 rye lines from
five populations (PR, EKO, SMH, ROM, Petkus) based on
genome-wide SSR markers. Analysis was based on a similarity
matrix from 37 SSR loci. PCo1 and PCo2 are the first and second
principal co-ordinates and percentages indicate percent variation
explained.
Li et al. BMC Plant Biology 2011, 11:6
/>Page 8 of 14
ScCbf15
ScCbf6
ScCbf11
ScCbf12
ScCbf14
ScIce2
ScDhn1
ScDhn3
ScCbf2
ScCbf9b
ScCbf11
Figure 4 LD heat plots of ten candidate genes. Analysed sequences, including the promoter and complete coding sequences of ScCbf6 and
ScCbf9b, and partial coding sequences of ScCbf12, ScCbf14, and ScCbf15; ScVrn1 was not included due to a lack of pairwise comparisons, since
only one Indel was observed. Exons, and 5’-or3’-flanking regions are represented by grey cylinders and black lines, respectively. White cylinders
with dashed lines indicate non-amplified exons. Black triangles represent polymorphic sites starting from “SNP1” on the top of each graph. Each
grid represents the strength of LD estimated by r
2
for each pairwise comparison between polymorphic sites with a minor allele frequency (MAF)
> 0.05. The colour legend for r
2
values is given on the right side.
Li et al. BMC Plant Biology 2011, 11:6
/>Page 9 of 14
complementary function in the frost tolerance network
and consequently i n a higher nucleotide diversity. The
buffering effect induced by a large number of dupli-
cated genes leads to a higher variation in individual
duplicated gene s, a phenomenon also observed in poly-
ploid plants [ 55]. It is worth re-iterating that inference
concerning the nucleotide diversity of ScVrn1 was
restrained since only a partial fragment of the gene,
30% of the c oding region, could be amplified due to
limited available rye sequences for primer design.
Observed haplotype diversities of HvCbf9b in Hordeum
spontaneum, old cultivars and modern cultivars of
H. vulgare were 0.48, 0.18, and 0.06, respectively,
which is much lower than that of ScCbf9b in this study
(0.98 ± 0.03) [36].
Directional selection
A reduced genetic diversity was observed in five of the
eleven genes. One possible e xplanation is that direc-
tional selection on the loci responsible for fitness related
traits such as frost tolerance might reduce diversity
within l ocally adapted populations due to an increase in
the frequency of alleles contributing to adaptation [56].
ScCbf15 and ScIce2 showed significant positive values of
Tajima’s D (2.14 and 2.34, respectively; P < 0.05) over
all populations, indicating balancing selection, whereby
genotypes carrying alleles with intermediate frequency
are favored. Positive Tajima’ s D values can also be
observed if a population was formed from a recent
admixture of two different populations, which cannot be
excluded in this study. Dhn1 showed a signi ficant nega-
tive v alue of Tajima’s D (P < 0.05), indicating p urifying
selection, whereby an excess of polymorphisms with low
frequencies w as observed. However, population growth
can also result in significant negative values of Tajima’s
D. Interestingly, Dhn1 in Scots pine has also been
described a s subject to positive selection [ 57], implying
that Dhn1 is possibly a target o f selection in different
species. ScCbf9b, ScCbf12, ScCbf14, ScDhn1, and ScDhn3
had a d
N
/d
S
ratio significantly smaller than 1 (P <0.01
or P < 0.001), whereas ScCbf15 had a d
N
/d
S
ratio signifi-
cantly greater than 1 (P < 0.001). These findings can be
interpreted as indication for purifying and positive selec-
tion, respectively [58]. However, it was pointed out that
inferring selection pressure based on the d
N
/d
S
ratio is
difficult from within-species data where segregating
0 200 400 600 800 1000 1200 1400
0.0 0.2 0.4 0.6 0.8 1.0
D istance(bp)
r^2
0 200 400 600 800 1000 1200 1400
0.0 0.2 0.4 0.6 0.8 1.0
Distance(bp)
r^2
0 200 400 600 800 1000 1200
1400
0.0 0.2 0.4 0.6 0.8 1.0
D istance(bp)
r^2
0 200 400 600 800 1000 1200 1400
0.0 0.2 0.4 0.6 0.8 1.0
D istance(bp)
r^2
0 200 400 600 800 1000 1200 1400
0.0 0.2 0.4 0.6 0.8 1.0
Distance(bp)
r^2
0 200 400 600 800 1000 1200
1400
0.0 0.2 0.4 0.6 0.8 1.0
D istance(bp)
r^2
r
2
r
2
r
2
r
2
r
2
r
2
Distance (bp)Distance (bp)Distance (bp)
Distance (bp)Distance (bp)Distance (bp)
Over all populations PR EKO
0.16
0.33
0.28
0.46
0.28
0.25
SMH ROM Petkus
Figure 5 Scatterplots of pairwise distances and LD. LD based on r
2
between all SNPs (MAF > 5%) in eleven candidate genes within five rye
populations (PR, EKO, SMH, ROM, Petkus) and across populations (over all), with non-linear fitting curve from the mutation-recombination-drift
model (see methods). Thresholds for LD (see methods) are indicated by a horizontal solid line.
Li et al. BMC Plant Biology 2011, 11:6
/>Page 10 of 14
polymorphisms rather than fixed substitutions are
observed [53,58,59].
Based on haploty pe frequencies in the eleven candi-
date genes, the single M iddle European population did
not distinctly differ from the Eastern European ones
(Figure 1). Since we have no information on the tem-
poral b reeding history of the Eastern European popula-
tions, it is beyond the scope of this study to make
inferences on the selection pressure due t o contrasting
winter temperatures in these Middle and Eastern
European populations. One possible explanation for a
lack of differen tiation might be seed exchanges between
them. However, little is known about these processes,
since pedigrees of the four Eastern European popula-
tions were not accessible.
Genetic variation within and among populations
Assessment of genetic diversity based on genome-wide
SSRs and locus-specific candidate genes are complemen-
tary inv estigations, th e former providing a global view of
the rye genome and the latter restricted to genes
involved in the frost tolerance network. Genome-wide
assessment of diversity using SSR markers revealed a
higher genetic diversity for the Eastern European popu-
lations PR, EKO, SMH, and ROM compared to the Mid-
dle European Petkus population. One reason for this
finding might be a bottleneck effect due to a higher
selection pressure i n the Pet kus population, whereby it
couldbeassumedthatmany“ unfavourable” minor
alleles were eliminated to pave the way for plants with
desirable traits. The Petkus population, one of the major
heterotic groups in rye, has systematically been
improved by more than 5 cy cles of full sib recurrent
selection and a reduction in allele diversity of SSR mar-
kers due to hitchhiki ng with linked loci which were tar-
gets of selection is probable. The reduction of genetic
diversity due to human-induced selection has been well
documented in barley and m aize [36,60,61]. By contrast,
the Eastern European populations experienced a lower
selection pressure by mass or half sib selection in the
breeding programs, where introgression of foreign mate-
rial was common in order to keep genetic variability on
a high l evel. Interestingly, no reduction of genetic diver-
sity was observed in the Petkus population based on
candidate genes. One possible explanation is that at the
time where selection took place, winters in Germany,
the provenance of the Petkus population, were harsh
enough to form a similar selection pressure on the Pet-
kus po pulation compared to Eastern European popula-
tions under Eastern European winters. It must be stated
however, that Petkus is the only representative for the
Middle European rye populations in our study and thus
our conclusio ns on population differenc es must be lim-
ited to the Petkus population. Another reason could be
that frost tolerance is a complex quantitativ e trait invol-
ving large gene networks comprising individual genes
contributing only small effects, thereby making it diffi-
cult to detect selection signatures, such as reduction of
genetic diversity in candidate genes. PCoA based on
both candidate genes and SSRs showed high genetic var-
iation between individuals within populations and lim-
ited clustering o f lines from t he same population,
findings in accordance with previously reported investi-
gations o f 26 rye populations based on isoenzyme mar-
kers [21] and 12 rye populations based on RFLP
markers [21]. Similar results have also been reported in
other outcrossing species, including white clover [62]
and perennial ryegrass [63], probably a consequence of
the o bligate cross-pollinated reproductive behaviour o f
outcrossing species. On the contrary, investigations in
the self-pollinated species rice have revealed larger varia-
tion between populations [64].
Rapid decay of linkage disequilibrium in rye
The extent of LD in rye across all eleven candidate
genes and over all populations was approximately 520
bp using r
2
= 0.16 as a critical threshold estimated from
a separate analysis of 37 unlinked SSR markers. This
rapid decay of LD could be expected, because compared
to self-pollinated species, cross-pollinated rye has a
higher effective recombination rate, which leads to a
rapid decay of LD [23]. LD decays rapidly in other
cross-pollinated species, including douglas fir, maize and
ryegrass [25,53,65]. However, in s elf-pollinated species
LD can extend up to 10-30 kb as in Arabidopsis [66,67]
and 212 kb in cultivated barley [28]. Pairwise LD mea-
sured by r
2
based on SSRs was very low (mean r
2
=
0.01), which was expected since the 37 SSRs have an
average marker interval of 21 cM according to the inte-
grated consensus map of Gustafson et al. [68].
LD results from the interplay of many factors. Selec-
tion, which causes locus-specific bottlenecks, is one of
the fac tors that increases LD between selec ted alleles at
linked loci. Homologs of ScCbf (except ScCbf11 in this
case) were closely linked and located in the Fr-H2/Fr -
A
m
2 frost locus spanning approximately 0.8 cM in the
genetic maps of barley and diploid wheat on homoeolo-
gous group 5 [6,8,17]. The order of Cbf genes in the
genetic map is consistent in both species [17]. The Cbf
gene family is a large regulatory gene family with more
than 20 members in barley, diploid and hexaploid wheat
[6,8,69], sharing a high sequence similar ity and induced
under frost stress. It has been suggested that the mem-
bers of the Cbf gene family have slightly different func-
tions in the frost r esponsive network [8,9]. In this study,
a large variation of mean r
2
in seven Cbf genes (0.13 to
0.92) was observed, indicat ing that the family has prob-
ably undergone diverse selection history. L D can be
Li et al. BMC Plant Biology 2011, 11:6
/>Page 11 of 14
increased by selection, for instance, by selective sweeps
in which the alleles at flanking loci of a locus under
selection are rapidly swept to high frequenc y or fixation
[70]. Arabidopsis’ AtCbf2 was implicated as subject to
selection, resulting in functional divergence from AtCbf1
and AtCbf3 after Cbf gene duplication [54]. In this study
an observed strong LD block and low nucleotide diver-
sity in ScCbf14 indicated a selective sweep. Among Cbf
family members, TaCbf14 has been mappe d to the high-
est peak of the f rost tolerance QTL in hexaploid wheat
[7]. Two of the SNPs in HvCbf14 were statistically asso-
ciated with frost tolerance in a European germplasm
collecti on of spring and winter barley [36]. It remains to
be demons trated that the LD block of ScCbf14 found in
this study has an influence on frost tolerance in rye.
Conclusions
Genetic diversity is vital to crop improvement. This
study of eleven candidate genes with a putative role in
frost response and 37 genome-wide SSRs demonstrated
high genetic diversity among five winter r ye populations
from Middle and Eastern Europe. Most of the diversity
was observed within populations. The Middle European
Petkus population differed neither in terms of haplotype
frequencies nor in nucleotide diversities in eleven candi-
date genes from the four Eastern European popu lations.
LD within candidate genes decayed rapidly, falling below
r
2
= 0.16 w ithin approximately 520 bp . In contrast to
selfing species, such as Arabidopsis or barley, low LD in
rye promises a higher resolution in genome-wide asso-
ciation mapping. A challenge, however, is that many
more markers are required for covering the whole gen-
ome. Given the huge genome size of rye, (~8,100 Mb)
and until high-density genotyping arrays for rye become
available, candidate gene based associa tion mapping
remains the most appropriate strategy for gene identifi-
cation. The SNPs discovered in the pro moter or coding
regions of the genes investigated in this study, which
cause non-syno nymous substituti ons, are suitable candi-
dates for association mapping and will be studied in
more detail with respect to their role in the expression
of frost tolerance in rye.
Additional material
Additional file 1: Primer information and details on PCR
amplification of eleven candidate genes.
Additional file 2: Genetic diversities of eleven candidate genes
within five rye populations.
Additional file 3: Chromosomal locations and diversities of the 37
SSRs.
Additional file 4: Analysis of molecular variance (AMOVA) based on
37 SSR markers.
Additional file 5: Scatterplots of pairwise distances and LD.
Acknowledgements
We would like to thank Susanne Schrack and Tobias Dreser for technical
assistance and Carmen Berlanas for sequencing ScCbf6 in her master thesis.
We acknowledge Andreas Böck and Valentin Wimmer for their help in
determining the LD extent. We thank the two anonymous reviewers for
their constructive comments. The first author gratefully acknowledges the
support of the Graduate School at the Technische Universität München,
München, Germany. The project GABI RYE-FROST is funded by the German
Federal Ministry of Education and Research (Grant numbers 0315062A and
0315062B).
Author details
1
Technische Universität München, Plant Breeding, Freising, Germany.
2
Technische Universität München, Mathematical Statistics, Garching,
Germany.
3
KWS LOCHOW GMBH, Bergen, Germany.
Authors’ contributions
YL carried out the candidate gene and statistical analyses and drafted the
manuscript. GH participated in the molecular and statistical analyses. DA
provided advice for the statistical analysis. VK provided SSR marker data. PW
developed the plant material. EB, CCS, PW, and VK conceived the study. All
authors read, edited and approved the final manuscript.
Received: 12 August 2010 Accepted: 10 January 2011
Published: 10 January 2011
References
1. Fowler DB, Limin AE: Exploitable genetic variability for cold tolerance in
commercially grown cereals. Can J Plant Sci 1987, 67(1):278-278.
2. Thomashow MF: Plant cold acclimation: Freezing tolerance genes and
regulatory mechanisms. Annu Rev Plant Physiol Plant Mol Biol 1999,
50:571-599.
3. Yamaguchi-Shinozaki K, Shinozaki K: Transcriptional regulatory networks in
cellular responses and tolerance to dehydration and cold stresses. Annu
Rev Plant Biol 2006, 57:781-803.
4. Badawi M, Reddy YV, Agharbaoui Z, Tominaga Y, Danyluk J, Sarhan F,
Houde M: Structure and functional analysis of wheat ICE (inducer of CBF
expression) genes. Plant Cell Physiol 2008, 49(8):1237-1249.
5. Fursova OV, Pogorelko GV, Tarasov VA: Identification of ICE2, a gene
involved in cold acclimation which determines freezing tolerance in
Arabidopsis thaliana. Gene 2009, 429(1-2):98-103.
6. Francia E, Barabaschi D, Tondelli A, Laido G, Rizza F, Stanca AM, Busconi M,
Fogher C, Stockinger EJ, Pecchioni N: Fine mapping of a HvCBF gene
cluster at the frost resistance locus Fr-H2 in barley. Theor Appl Genet
2007, 115(8):1083-1091.
7. Baga M, Chodaparambil SV, Limin AE, Pecar M, Fowler DB, Chibbar RN:
Identification of quantitative trait loci and associated candidate genes
for low-temperature tolerance in cold-hardy winter wheat. Funct Integr
Genomics 2007, 7(1):53-68.
8. Knox AK, Li CX, Vagujfalvi A, Galilba G, Stockinger EJ, Dubcovsky J:
Identification of candidate CBF genes for the frost tolerance locus Fr-A
(m)2 in Triticum monococcum. Plant Mol Biol 2008, 67(3):257-270.
9. Campoli C, Matus-Cadiz MA, Pozniak CJ, Cattivelli L, Fowler DB: Comparative
expression of Cbf genes in the Triticeae under different acclimation
induction temperatures. Mol Genet Genomics 2009, 282(2):141-152.
10. Alonso-Blanco C, Gomez-Mena C, Llorente F, Koornneef M, Salinas J,
Martinez-Zapater JM: Genetic and molecular analyses of natural variation
indicate CBF2 as a candidate gene for underlying a freezing tolerance
quantitative trait locus in Arabidopsis. Plant Physiol 2005,
139(3):1304-1312.
11. McKhann HI, Gery C, Berard A, Leveque S, Zuther E, Hincha DK, De Mita S,
Brunel D, Teoule E: Natural
variation in CBF gene sequence, gene
expression and freezing tolerance in the Versailles core collection of
Arabidopsis thaliana. BMC Plant Biol 2008, 8:105.
12. Chinnusamy V, Zhu J, Zhu JK: Cold stress regulation of gene expression
in plants. Trends Plant Sci 2007, 12(10):444-451.
13. Kosova K, Vitamvas P, Prasil IT: The role of dehydrins in plant response to
cold. Biol Plant 2007, 51(4):601-617.
14. Choi DW, Zhu B, Close TJ: The barley (Hordeum vulgare L.) dehydrin
multigene family: sequences, allele types, chromosome assignments,
Li et al. BMC Plant Biology 2011, 11:6
/>Page 12 of 14
and expression characteristics of 11 Dhn genes of cv Dicktoo. Theor Appl
Genet 1999, 98(8):1234-1247.
15. Zhu B, Choi DW, Fenton R, Close TJ: Expression of the barley dehydrin
multigene family and the development of freezing tolerance. Mol Gen
Genet 2000, 264(1-2):145-153.
16. Kosova K, Prasil IT, Vitamvas P: The relationship between vernalization-and
photoperiodically-regulated genes and the development of frost
tolerance in wheat and barley. Biol Plant 2008, 52(4):601-615.
17. Galiba G, Vagujfalvi A, Li CX, Soltesz A, Dubcovsky J: Regulatory genes
involved in the determination of frost tolerance in temperate cereals.
Plant Sci 2009, 176(1):12-19.
18. Galiba G, Quarrie SA, Sutka J, Morgounov A, Snape JW: RFLP mapping of
the vernalization (Vrn1) and frost resistance (Fr1) genes on chromosome
5A of wheat. Theor Appl Genet 1995, 90(7-8):1174-1179.
19. Stockinger EJ, Skinner JS, Gardner KG, Francia E, Pecchioni N: Expression
levels of barley Cbf genes at the Frost resistance-H2 locus are
dependent upon alleles at Fr-H1 and Fr-H2. Plant J 2007, 51(2):308-321.
20. Persson K, von Bothmer R, Gullord M, Gunnarsson E: Phenotypic variation and
relationships in landraces and improved varieties of rye (Secale cereale L.)
from northern Europe. Genet Resour Crop Evol 2006, 53(4):857-866.
21. Persson K, Von Bothmer R: Genetic diversity amongst landraces of rye
(Secale cereale L.) from northern Europe. Hereditas 2002, 136(1):29-38.
22. Shang HY, Wei YM, Wang XR, Zheng YL: Genetic diversity and
phylogenetic relationships in the rye genus Secale L. (rye) based on
Secale cereale microsatellite markers. Genet Mol Biol 2006, 29(4):685-691.
23. Flint-Garcia SA, Thornsberry JM, Buckler ES: Structure of linkage
disequilibrium in plants. Annu Rev Plant Biol 2003, 54:357-374.
24. Maccaferri M, Sanguineti MC, Noli E, Tuberosa R: Population structure and
long-range linkage disequilibrium in a durum wheat elite collection. Mol
Breed 2005, 15(3):271-289.
25. Tenaillon MI, Sawkins MC, Long AD, Gaut RL, Doebley JF, Gaut BS:
Patterns
of
DNA sequence polymorphism along chromosome 1 of maize (Zea
mays ssp mays L.). Proc Natl Acad Sci USA 2001, 98(16):9161-9166.
26. Ching A, Caldwell KS, Jung M, Dolan M, Smith OS, Tingey S, Morgante M,
Rafalski AJ: SNP frequency, haplotype structure and linkage
disequilibrium in elite maize inbred lines. BMC Genet 2002, 3:19.
27. Hamblin MT, Fernandez MGS, Casa AM, Mitchell SE, Paterson AH,
Kresovich S: Equilibrium processes cannot explain high levels of short-
and medium-range linkage disequilibrium in the domesticated grass
Sorghum bicolor. Genetics 2005, 171(3):1247-1256.
28. Caldwell KS, Russell J, Langridge P, Powell W: Extreme population-
dependent linkage disequilibrium detected in an inbreeding plant
species, Hordeum vulgare. Genetics 2006, 172(1):557-567.
29. Rogowsky PM, Guidet FLY, Langridge P, Shepherd KW, Koebner RMD:
Isolation and characterisation of wheat-rye recombinants involving
chromosome arm 1DS of wheat. Theor Appl Genet 1991, 82(5):537-544.
30. Campoli C, Matus-Cadiz MA, Pozniak CJ, Cattivelli L, Fowler DB:
Comparative expression of Cbf genes in the Triticeae under different
acclimation induction temperatures. Molecular Genetics and Genomics
2009, 282(2):141-152.
31. Sutton F, Chen DG, Ge XJ, Kenefick D: Cbf genes of the Fr-A2 allele are
differentially regulated between long-term cold acclimated crown tissue
of freeze-resistant and - susceptible, winter wheat mutant lines. BMC
Plant Biol 2009, 9:34.
32. Skinner JS, von Zitzewitz J, Szucs P, Marquez-Cedillo L, Filichkin T,
Amundsen K, Stockinger EJ, Thomashow MF, Chen THH, Hayes PM:
Structural, functional, and phylogenetic characterization of a large CBF
gene family in barley. Plant Mol Biol 2005, 59(4):533-551.
33. Jaglo KR, Kleff S, Amundsen KL, Zhang X, Haake V, Zhang JZ, Deits T,
Thomashow MF: Components of the Arabidopsis C-repeat/dehydration-
responsive element binding factor cold-response pathway are
conserved in Brassica napus and other plant species. Plant Physiol 2001,
127(3):910-917.
34. Beales J, Laurie DA, Devos KM: Allelic variation at the linked AP1 and
PhyC loci in hexaploid wheat is associated but not perfectly correlated
with vernalization response. Theor Appl Genet 2005, 110(6):1099-1107.
35. Yan L, Loukoianov A, Tranquilli G, Helguera M, Fahima T, Dubcovsky J:
Positional cloning of the wheat vernalization gene VRN1. Proc Natl Acad
Sci USA 2003, 100(10):6263-6268.
36. Fricano A, Rizza F, Faccioli P, Pagani D, Pavan P, Stella A, Rossini L,
Piffanelli P, Cattivelli L: Genetic variants of HvCbf14 are statistically
associated with frost tolerance in a European germplasm collection of
Hordeum vulgare. Theoretical
and Applied Genetics 2009, 119(7):1335-1348.
37. Knox AK, Dhillon T, Cheng HM, Tondelli A, Pecchioni N, Stockinger EJ: CBF
gene copy number variation at Frost Resistance-2 is associated with
levels of freezing tolerance in temperate-climate cereals. Theor Appl
Genet 2010, 121(1):21-35.
38. Yang ZH: PAML 4: Phylogenetic analysis by maximum likelihood. Mol Biol
Evol 2007, 24(8):1586-1591.
39. Khlestkina EK, Ma HMT, Pestsova EG, Roder MS, Malyshev SV, Korzun V,
Borner A: Mapping of 99 new microsatellite-derived loci in rye (Secale
cereale L.) including 39 expressed sequence tags. Theor Appl Genet 2004,
109(4):725-732.
40. Hackauf B, Wehling P: Identification of microsatellite polymorphisms in
an expressed portion of the rye genome. Plant Breed 2002, 121(1):17-25.
41. Liu KJ, Muse SV: PowerMarker: an integrated analysis environment for
genetic marker analysis. Bioinformatics 2005, 21(9):2128-2129.
42. Petit RJ, El Mousadik A, Pons O: Identifying populations for conservation
on the basis of genetic markers. Conserv Biol 1998, 12(4):844-855.
43. Goudet J: FSTAT (Version 1.2): A computer program to calculate F-
statistics. J Hered 1995, 86(6):485-486.
44. Dice LR: Measure of the amount of ecologic association between
species. Ecology 1945, 26(3):297-302.
45. Excoffier L, Smouse PE, Quattro JM: Analysis of molecular variance
inferred from metric distances among DNA haplotypes: application to
human mitochondrial DNA restriction data. Genetics 1992, 131(2):479-491.
46. Excoffier L, Laval G, Schneider S: Arlequin (version 3.0): An integrated
software package for population genetics data analysis. Evolutionary
Bioinformatics 2005, 1:47-50.
47. Hill WG, Robertson A: Linkage disequilibrium in finite populations. Theor
Appl Genet 1968, 38:226-231.
48. Weir B: Genetic data analysis II. Sunderland, MA: Sinauer Associates; 1996.
49. Hill WG, Weir BS: Variances and covariance of squared linkage
disequilibrium in finite populations. Theor Popul Biol 1988, 33(1):54-78.
50. Breseghello F, Sorrells ME: Association mapping of kernel size and milling
quality in wheat (
Triticum aestivum L.)
cultivars. Genetics 2006,
172(2):1165-1177.
51. Nei M: Molecular Evolutionary Genetics. NY: Columbia University Press;
1987.
52. Yamasaki M, Schroeder S, Sanchez-Villeda H, Gaut B, McMullen MD:
Empirical analysis of selection screens for domestication and
improvement loci in maize by extended DNA sequencing. Plant Genome
2008, 1(1):33-43.
53. Krutovsky KV, Neale DB: Nucleotide diversity and linkage disequilibrium in
cold-hardiness- and wood quality-related candidate genes in Douglas fir.
Genetics 2005, 171(4):2029-2041.
54. Lin YH, Hwang SY, Hsu PY, Chiang YC, Huang CL, Wang CN, Lin TP:
Molecular population genetics and gene expression analysis of
duplicated CBF genes of Arabidopsis thaliana. BMC Plant Biol 2008, 8:16.
55. Lawton-Rauh A: Evolutionary dynamics of duplicated genes in plants. Mol
Phylogenet Evol 2003, 29(3):396-409.
56. Biswas S, Akey JM: Genomic insights into positive selection. Trends Genet
2006, 22(8):437-446.
57. Wachowiak W, Balk PA, Savolainen O: Search for nucleotide diversity
patterns of local adaptation in dehydrins and other cold-related
candidate genes in Scots pine (Pinus sylvestris L.). Tree Genet Genomes
2009, 5(1):117-132.
58. Yang Z: Adaptive molecular evolution. In Handbook of Statistical Genetics.
Volume 1. Edited by: Balding DJ, Bishop M, Cannings C. West Sussex: John
Wiley 2003:229-250.
59. Kryazhimskiy S, Plotkin JB: The Population Genetics of dN/dS. Plos Genet
2008, 4(12):e1000304.
60. Kilian B, Ozkan H, Kohl J, von Haeseler A, Barale F, Deusch O, Brandolini A,
Yucel C, Martin W, Salamini F: Haplotype structure at seven barley genes:
relevance to gene pool bottlenecks, phylogeny of ear type and site of
barley domestication. Mol Genet Genomics 2006, 276(3):230-241.
61. Tian F, Stevens NM, Buckler ES: Tracking footprints of maize
domestication and evidence for a massive selective sweep on
chromosome 10. Proc Natl Acad Sci USA 2009, 106:9979-9986.
62. George J, Dobrowolski MP, de Jong EV, Cogan NOI, Smith KF, Forster JW:
Assessment of genetic diversity in cultivars of white clover (Trifolium
repens L.) detected by SSR polymorphisms. Genome 2006, 49(8):919-930.
Li et al. BMC Plant Biology 2011, 11:6
/>Page 13 of 14
63. Bolaric S, Barth S, Melchinger AE, Posselt UK: Genetic diversity in European
perennial ryegrass cultivars investigated with RAPD markers. Plant Breed
2005, 124(2):161-166.
64. Zhang DL, Zhang HL, Wang MX, Sun JL, Qi YW, Wang FM, Wei XH, Han LZ,
Wang XK, Li ZC: Genetic structure and differentiation of Oryza sativa L.in
China revealed by microsatellites. Theor Appl Genet 2009,
119(6):1105-1117.
65. Xing Y, Frei U, Schejbel B, Asp T, Lubberstedt T: Nucleotide diversity and
linkage disequilibrium in 11 expressed resistance candidate genes in
Lolium perenne. BMC Plant Biol 2007, 7:43.
66. Kim S: Recombination and linkage disequilibrium in Arabidopsis thaliana.
Nat Genet 2007, 39:1151-1155.
67. Nordborg M, Hu TT, Ishino Y, Jhaveri J, Toomajian C, Zheng HG, Bakker E,
Calabrese P, Gladstone J, Goyal R, Jakobsson M, Kim S, Morozov Y,
Padhukasahasram B, Plagnol V, Rosenberg NA, Shah C, Wall JD, Wang J,
Zhao KY, Kalbfleisch T, Schulz V, Kreitman M, Bergelson J: The pattern of
polymorphism in Arabidopsis thaliana. PLoS Biol 2005, 3(7):1289-1299.
68. Gustafson JP, Ma XF, Korzun V, Snape JW: A consensus map of rye
integrating mapping data from five mapping populations. Theor Appl
Genet 2009, 118(4):793-800.
69. Badawi M, Danyluk J, Boucho B, Houde M, Sarhan F: The CBF gene family
in hexaploid wheat and its relationship to the phylogenetic complexity
of cereal CBFs. Mol Genet Genomics 2007, 277(5):533-554.
70. Kraakman ATW, Niks RE, Van den Berg P, Stam P, Van Eeuwijk FA: Linkage
disequilibrium mapping of yield and yield stability in modern spring
barley cultivars. Genetics 2004, 168(1):435-446.
doi:10.1186/1471-2229-11-6
Cite this article as: Li et al.: High levels of nucleotide diversity and fast
decline of linkage disequilibrium in rye (Secale cereale L.) genes
involved in frost response. BMC Plant Biology 2011 11:6.
Submit your next manuscript to BioMed Central
and take full advantage of:
• Convenient online submission
• Thorough peer review
• No space constraints or color figure charges
• Immediate publication on acceptance
• Inclusion in PubMed, CAS, Scopus and Google Scholar
• Research which is freely available for redistribution
Submit your manuscript at
www.biomedcentral.com/submit
Li et al. BMC Plant Biology 2011, 11:6
/>Page 14 of 14