báo cáo khoa học: " Apospory appears to accelerate onset of meiosis and sexual embryo sac formation in sorghum ovules" doc
Bạn đang xem bản rút gọn của tài liệu. Xem và tải ngay bản đầy đủ của tài liệu tại đây (1.11 MB, 13 trang )
RESEARC H ARTIC L E Open Access
Apospory appears to accelerate onset of meiosis
and sexual embryo sac formation in sorghum ovules
John G Carman
1*
, Michelle Jamison
2
, Estella Elliott
2,3
, Krishna K Dwivedi
2
, Tamara N Naumova
2,4
Abstract
Background: Genetically unreduced (2n) embryo sacs (ES) form in ovules of gametophytic apomicts, the 2n eggs
of which develop into embryos parthenogenetically. In many apomicts, 2n ES form precociously during ovule
development. Whether meiosis and sexual ES formation also occur precociously in facultative apomicts (capable of
apomictic and sexual reproduction) has not been studied. We determined onset timing of meiosis and sexual ES
formation for 569 Sorghum bicolor genotypes, many of which produced 2n ES facultatively.
Results: Genotype differences for onset timing of meiosis and sexual ES formation, relative to ovule development,
were highly significant. A major source of variation in timing of sexual germline development was presence or
absence of apomictic ES, which formed from nucellar cells (apospory) in some genotypes. Genotypes that
produced these aposporous ES underwent meiosis and sexual ES formation precociously. Aposporous ES formation
was most prevalent in subsp. verticilliflorum and in breeding lines of subsp. bicolor. It was uncommon in land races.
Conclusions: The present study adds meiosis and sexual ES formation to floral induction, apomictic ES formation,
and parthenogenesis as processes observed to occur precociously in apomictic plants. The temporally diverse
nature of these events suggests that an epigenetic memory of the plants’ apomixis status exists throughout its life
cycle, which triggers, during multiple life cycle phases, temporally distinct processes that accelerate reproduction.
Background
For angiosperms, apomixis means asexual reproduction
by seed [1]. It is strongly associated with hybridity and
polyploidy, and molecular mechanisms responsible for it
remain shrouded in complexity [2-4]. Apomixis involves
the reprogramming of unreduced (2n) cells of the ovule,
which thereafter follow a very different developmental
trajectory than h ad the plant been sexual. Specifically,
ovules of apomictic plants produce asexual totipotent
cells. These form in the nucellus, chalaza or integu-
ments,andembryosdevelopfromthemeitherdirectly
(adventitious embryony) or after 2n embryo sac (ES) for-
mation (gametophytic apomixis). Apomictic (2n)ES
usually resemble sexual ES, but embryony in them
occurs parthenogenetically and often precociously.
Whether in sexual plants or apomicts, embryony is the
result of epigenome modifications that begin as early as
floral transition [5,6].
Gametophytic apomixis is further divided into i)
apospory, where the 2n aposporous ES (AES) f orms
from a cell of the nucellus, chalaza or rarely an integu-
ment, and ii) diplospory, where the 2n ES forms from
an ameiotic megasporocyte (MMC). The formation of
viable seed in apomicts requires the formation of func-
tional endosperm, and this occurs pseudogamously or
autonomously, i.e. with or without fertilization of the ES
central cell, respectively. In adventitious embryony, a
sex ual ES with functional endosperm forms from which
the developing adventitious embryo derives nutrients.
The sexual embryo may survive and compete for nutri-
ents with adventitious embryos [1,7].
Apomixis in angiosperms occurs in polyploids or poly-
haploids and is found in 31 of 63 orders (compiled from
[2] using APG III nomenclature [8]). Though wide-
spread, it occurs infrequently, being reported in only
223 genera (of about 14,000), 41 of which belong to the
Poaceae. Of these, 24 belong to the Panicoideae, which
is a large and ancient subfamily of grasses many mem-
bers of which, including Sorghum L. (but not Zea L.),
have undergone few chromosome rearrangements and
* Correspondence:
1
Plants, Soils & Climate Department, Utah State University, Logan, Utah
84322-4820, USA
Full list of author information is available at the end of the article
Carman et al. BMC Plant Biology 2011, 11:9
/>© 2011 Carman et al; licensee BioMed Central Ltd. This is an Open Access article d istributed under the terms of the Creative Commons
Attribution License ( which permits unrestricted use, distribution, and reprodu ction in
any medium, pro vided the original work is properly cited.
no whole genome duplications since a whole genome
duplication occurred 65 million years ago that differen-
tiated grasses from other monocots [9-11]. Accord ingly,
Sorghum is an anciently diploidized paleotetraploid
(n = 10). It is divided into five subgen era, Sorghum,
Chaetosorghum, Heterosorghum, Parasorg hum and
Stiposorghum.SubgenusSorghum includes perennial
S. halapense Pers. (2n =4× = 40), perennial S. propin-
quum (Kunth) Hitchc. (2n =2× = 20), and annual
S. bicolor (L.) Moench (2n =2× = 20). The latter is divided
into subsp. bicolor (domesticated grain sorghums), subsp.
drummondii (stabilized derivatives between grain sor-
ghums and their closest wild relatives), and subsp. verticil-
liflorum (formerly subsp. arundinaceum, wild progenitors
of grain sorghum). Subspecies bicolor is further divided
into five races, bicolor, guinea, caudatum, kafir and durra,
and 10 intermediate races [12].
Low frequency AES for mation occurs in several subsp.
bicolor lines [13-17]. However, none of the reports provide
convincing molecular or cytological evidence of partheno-
genesi s, and claims to the contrary have met with skepti-
cism [18,19]. In this respect, Gustafsson [20] reviewed
evidence from several species that the 2n egginanAES
from a plant that rarely produces AES may not be capable
of parthenogenesis, an opinion shared by Asker and Jerling
[21]. Nevertheless, the interrelatedness of Panicoideae [22]
suggests that the AES formation observed in S. bicolor
may be symples iomorphic with that observed in the fully
functional aposporous Panicoideae.
In practice sexual and apomictic plants are differen-
tiated by i) cytological analyses of ovule development
[23], ii) progeny tests using morpho logical or molecular
markers [24], and iii) flow c ytometry of seed nuc lei to
identify distinguishing embryo to endosperm ploidy
level ratios [25]. However, several less-distinct traits also
differentiate many apomicts from their related sexuals.
For example in diplosporous species of Tripsacum L.
[26,27] and Elymus L. [28], onset of 2n ES formation,
relative to stage of ovule development, occurs prior to
onset of meiosis in related sexuals. Whether this is a
general phenomenon of diplospory has not been i nvesti-
gated. In aposporous apomicts, the potentially competi-
tive sexual germline is usually terminated by apoptosis
from the MMC stage to early sexual ES forma tion. AES
formation is detected cytologically as early as the MMC
stage to as late as ES maturation. Timing of apospory is
not rigid, and much within species and within plant var-
iation occurs [1,20,21,29]. Likewise, parthenogenesis
occurs prior to flower opening in many apomicts. This
has been observed in Alchemilla L., Aphanes L., Taraxa-
cum Cass., Wikstroemia Endl., Ochna L., Allium L.,
Chondrilla L., Hi
eracium L., Crepis L., Potentilla L., Poa
L., Elatostema J. R. & G. Forst., Tripsacum,andParthe-
nium L. [20,21].
In the present study, we determined onset timing of
megasporogenesis (female meiosis) and sexual ES forma-
tion relative to stage of ovule development for 569 gen-
otypes from three populations of S. bicolor.Wealso
determined the frequency of AES formation for each
genotype. The genotypes were then grouped according
to AES frequency, and the groups were compared based
on onset timing of megasporoge nesis and sexual ES for-
mation. The results suggest t hat the apospory program
in S. bicolor heterochronically accelerates, relative to
stage of ovule development, the onset of meiosis and
sexual ES formation.
Results
Ovary and ovule morphometrics
Regressions between ova ry and ovule lengths at meiosis
(dyad to early tetrad) and at the 1-nucleate ES (ES1)
and early 8-nucleate ES (ES8) stages across 25 acces-
sionswerehighlysignificant. H owever, the regression
equations explained <50% of the variability (r
2
)ateach
stage (Additional file 1). Hence, large and small ovaries
contained either large or small ovules, depending on
accession, and ovary l ength only poorly predicted germ-
line stage across accessions. For example, ovaries 0.3 cm
long contained ovules in t he meio cyte stage to the
maturing ES stage depending on acc ession (Additional
file 2).
Mean (±SE) ovule curvatures and areas (Figure 1A)
were determined at two develo pmental stages, meiocyte
and ES1, for 115 diploid genotype s and one naturally
occurring tetraploid (Additional file 3). ANOVA w as
used to determine which of these two ovule develop-
ment variables (curvature or area) would most closely
correlate with germline stage (meiocyte or ES1). The
dependent variable, coefficient of variation (CV), was
represented by the CV values of 460 means, 115 for
each of the four (2 × 2) method-by-stage combinations
(diploid genotypes only). At the meiocyte and ES1
stages, mean CV values (±SE) based on ovule curvature
were 0.151 (±0.004) and 0.134 (±0.004), respectively.
The corresponding CV values based on ovule area were
significantly larger, 0.210 (±0.006) and 0.185 (±0.005 ),
respectively. The main effects (method and stage) were
significant (P < 0.001), but the interaction effect was not
significant. This analysis indicated that ovule curvature
was less variable than ovule area at each germline stage.
TwosetsofANOVAwereconductedtodetermineif
variation in m ean ovule curvature, ovule area, and three
ovule area components (per genotype) varied according
to taxonomic group. In the first set , all 116 genotypes
from 57 accessions (Additional file 3) were partitioned
into seven taxonomic groups, which consisted of the
five subsp. bicolor races, accessions of subsp. v erticilli -
florum, and a group (other) that contained breeding
Carman et al. BMC Plant Biology 2011, 11:9
/>Page 2 of 13
lines and hybrids (Figure 2). Again, ovule curvature was
more effective than ovule area in differe ntiating taxo-
nomic groups, especially at the meiocyte stage. However,
distinct partitioning also occurred among taxonomic
groups based on the percentage of ovule area repre-
sented by the nucell us and integuments (Figure 2).
These dat a further indicate that ovule shape (ovule cur-
vature and r elative growth dynamics of the nucellus and
integuments) is more tightly correlated with germline
development than is ovule area.
At the meiocyte stage, ovule curvature was most
advanced for genotypes of the verticilliflorum group
(Figure 2). In addition to strong curvature, the verticilli-
florum group also had the largest and smallest
percentages of ovule area represented b y integuments
and nucellus, respectively. As ovules mature, the integu-
men ts grow rapidl y around the ovule, and consequently
a larger proportion of the ovule is composed of i ntegu-
ment. These data indicate that onset of meiosis was
delayed in the verticilliflorum group compared to other
groups(Figure2).Theoppositewasobservedforthe
kafirs. Here, ovules were only slightly curved at the
onset of meiosis, and the integuments and nucellus
represented the smallest and largest percentages of
ovule area, respectively (Figure 2). Hence, in the kafirs,
germline d evelopment is accelerated compared to other
taxonomic groups. Variationwithintaxonomicgroup
was also observed as indicated by highly significant (P <
A
B
C
AI
AI
DM
FM (degenerating)
DM
DM
LSC
LSC
D
E
AI
FM
LSC
AES2
DM
AES1
DM
DM
50 μm
50 μm
25 μm
40 μm
20 μm
VAC
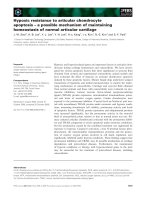
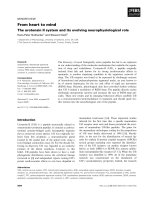
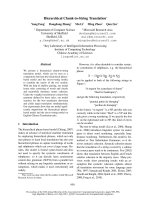
Figure 1 Differential interference contrast images of cleared Sorghum bicolor ovules in sagittal section. A) Procedure used to measure
ovule area components (germ cell, nucellus and integuments), ovule curvature (angle), and inner integument length (distance from base to tip);
from Carman [29], used with permission (caudatum, Agira, PI217855). B) Three degenerating megaspores (DM), the functional megaspore (FM),
an aposporous initial (AI), and two large stack cells (LSC) (RIL, TX 37-6). C) Four DM and a vacuolate (VAC) 1-nucleate aposporous embryo sac
(AES) (RIL, TX 152-6). D) Three DM, a degenerating FM, two AI, one of which is absorbing the FM, and two LSC (RIL, TX 4-7). E) Four DM and a 2-
nucleate AES (breeding line, IS3620C).
Carman et al. BMC Plant Biology 2011, 11:9
/>Page 3 of 13
0.001) effects for genotypes nested within taxonomic
group and for genotypes nested within accessions (Addi-
tional file 4). The only insignificant effect was the taxo-
nomic group by germline stage int eraction for
the percentage of ovule area represented by the germ
(Figure 2, Additional file 4).
Apospory in accessions and mapping populations
Nucellar cells normally die adjacent to the expanding
embryo sac. In the present study, this progressive pro-
cess of programmed nucellar cell death began shortly
after megasporogenesis and continued until after fertili-
zation when the nucellus was essentially consumed. In
ovules of highly aposporous angiosperms, one or m ore
nucellar cell(s) is re-programmed to undergo embryo
sac formation. Early indications of this reprogramming
include an abnormal doubling in size of the nucellar cell
and nuclear enlargement [1,21]. In the present study,
cells assuming these traits w ere counted as i)apospor-
ous initials (AI) when they occurred in the micropylar
region of the nucellus (usually adjacent to the MMC,
meiocyte, or degenera ting megaspores (DM)), or ii)
large stack c ells (LSC) when they occurred in the cha-
laza proximal to the MMC, meiocyte, or functional
megaspore (FM) (Figure 1B, D). LSC developed from
cells at the nucellus chalaza interface and belonged to
or were closely associated with the cell file (stack) from
which the MMC formed. Generally, LSC were much
more prevalent than AI (Additional file 3).
We defined the FM stage as onset of FM enlargement,
which coincided with DM degeneration (Figure 1B). We
defined the 1-nucleate ES stage as acquisition by the
FM of a vacuole similar in size to the nucleus. Likewise
an AI was referred to as an AES once it had produced a
similarly large vacuole. AESonlyrarelyformedfrom
LSC (based on observed locations of AES). Most were
derived from AI and formed in the m icropylar region.
Sexual ES and AES were further characterized by num-
ber of nuclei present (Figure 1C, E).
Some AI, LSC and AES did not form until the FM
stage. Hence, to minimize underestimating apospory,
only ovules ranging in development from the FM stage
through the ES2 stage were used in determining AI,
AES and LSC frequencies. The ES2 stage criterion was
used because determining the origin of the ES (sexual
or aposporous) in ovules beyond the ES2 stage was pro-
blematic. In these ovules, megaspore s and nucellar cells
adjacent to the enlarging ES had degenerated.
Frequencies of AI, LSC and AES were determined for
150 S. bicolor genotypes from 65 accessions (Additional
file 3, 116 genotypes; Additional file 5, 34 genotypes), a
mapping population consisting of 300 F
2
, and a mapping
population consisting of 119 recombinant inbred lines
(RIL [30]). Correlations between AES and AI and
between AES and LSC were high er among genotypes of
the accessions than among genotypes of the mapping
populations (Figure 3). In all three populations, the fre-
quency of AES formation was more highly correlated
with the frequency of AI fo rmation than with the fre-
quency of LSC formation. Compared to the genetically
diverse accessions, regression r
2
values between LSC
and AI were twice as high in the segregated F
2
and RIL
mapping populations (Figure 3). None of the regressions
between percentage germline degeneration (measured
for accessions only) and perc entages of AI, AES or LSC
(or combinations of these) was significant.
Eleven of the 150 diploid genotypes from 65 acces-
sions exceeded 3% AES formation (Additional file 3).
Five of these were from breeding lines of subsp. bicolor
(5 of 30 lines) and five w ere from accessions of subsp.
verticilliflorum (5 of 35 accessions). One, a caudatum,
represented all other taxonomic groups (1 of 85 acces-
sions). Two tests of equality of proportions were con-
ducted. These matched the “ other” group (1 of 85)
against the breeding lines (5 of 30) a nd the “ other”
group against the verticilliflorum (5 of 35). Both tests
Integument
30
35
40
Ovule
curvature
(degrees)
120
130
140
150
Dyad through early tetrad
1-nucleate ES stage
Ovule area
(
P
m
2
)
10000
20000
30000
Nucellus
55
60
65
Taxonomic
g
roup
Kafir
Other
Bicolor
Durra
Guinea
Caudatum
Verticilliflorum
Germ
1
2
3
4
5
Percent of ovule area
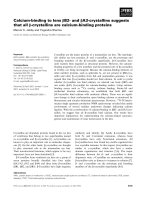
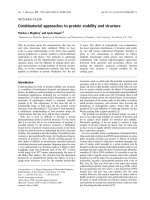
Figure 2 Means (±SE) for ovule curvature, ovule area, and
percentage of ovule area occupied by the nucellus,
integument and germ (meiocyte or embryo sac) for seven
taxonomic groups. Measurements were taken at the meiocyte
(dyad through early tetrad) and 1-nucleate embryo sac (ES) stages.
See Additional file 3 for individual genotype data and Additional file
4 for ANOVA results.
Carman et al. BMC Plant Biology 2011, 11:9
/>Page 4 of 13
were rejected (P < 0.001 and P < 0.01, respectively).
Hence, apospory wa s most prevalent in wild land races
of subsp. verticilliflorum and in breeding li nes of subsp.
bicolor.
Flow cytometry of leaf tissue w as used to determine
the ploidy of the 11 genotypes that exhibited ≥3% AES
formation. Ten were diploid, but o ne, which exhibi ted
the highest AES percentage (14% with 45% AI forma-
tion), was tetraploid (Figure 4). Three other genotypes
of this accession (IS 12702, subsp. verticilliflorum)were
diploid. These diploids had high AI levels relative to
other accessions (Additional files 3, 5), but only one
exhibited an AES frequency >3% (4.9%). Sever al other
genotypes with >3% AES formation were from acces-
sions in which multiple genotypes were analyzed but
only one genotype exhibited the high AES level (Addi-
tional files 3, 5). Only two genotypes (from two different
subsp. verticilliflorum accessions) exhibited >6% AES
formation. Eight genotypes exhibited >6% AI formation,
one caudatum, three from the breeding lines, and four
from subsp. verticilliflorum.
Apospory and ovule morphometrics
An objective of the current study was to d etermine if
tendencies for apospory in S. bicolor are associated with
AI
01020
0
2
4
LSC
0
10
20
30
AES
LSC
0102030
Ovules with trait
(
%
)
r
2
= 0.267***
r
2
= 0.056**
r
2
= 0.480***
AI
01020
O
vules with trait
(%)
0
4
8
12
LSC
0
10
20
30
40
AES
LSC
0204060
r
2
=
0.483***
r
2
= 0.258***
r
2
= 0.192***
AI
0 10203040
0
4
8
12
LSC
0
10
20
30
AES
LSC
0102030
r
2
= 0.234***
r
2
= 0.470***
r
2
= 0.273***
Accessions
F
2
RIL
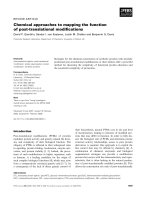
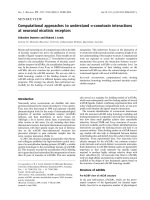
Figure 3 Correlations between percentages of ovules
containing large stack cells (LSC), aposporous embryo sacs
(AES) and aposporous initials (AI). Points represent frequencies
from 150 genotypes from 65 genetically diverse accessions, 300
genotypes from an F
2
mapping population, and 119 genotypes
from an F
8
recombinant inbred line (RIL) population. For regression,
** and *** denote significance at P < 0.01 and P < 0.001,
respectively.
B
A
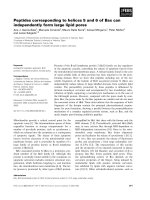
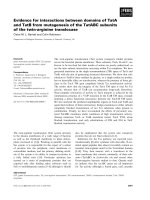
Figure 4 Fluorescence intensity histograms of leaf tissue nuclei
from diploid and tetraploid Sorghum bicolor. A) This histogram
is from diploid subsp. verticilliflorum, accession IS11010, genotype
7.5d. B) This histogram is from a naturally occurring tetraploid plant
from a typically diploid subsp. verticilliflorum accession, IS12702,
genotype 76d.
Carman et al. BMC Plant Biology 2011, 11:9
/>Page 5 of 13
other morphometric ovule development variables. To
accomplish this, k-means multivariate clustering was
used to partition genoty pes of accessions, F
2
,andRIL
into 3-4 groups (per population) with similar frequen-
cies of AI or AES. In all three populations, meiosis and
sexual ES formation occurred precociously in the groups
with the highest AES formation frequencies (Figure 5).
As noted above, 11 of 150 genotypes from 65 acces-
sions exhibited an AES frequency >3%. Three of these
grouped together to form the highest AES k-means clus-
ter, and the remaining eight clustered together to form
the second highest k-means group. Both groups under-
went meiosis and sexual ES formation early (low ovule
curvature values) compared to the other k-means groups
(Figure 5A, see Additional file 6 for ANOVA results).
Two of the three genotypes in the highest AES group
werefromasinglebreedinglineandthethirdwasa
subsp. verticilliflorum genotype. In the second highest
group (eight genotypes), three were from breeding lines,
four were from subsp. verticilliflorum and one was a
caudatum (subsp. bicolor). If earliness of meiosis and
sexual ES formation promote dapospory,ahigherfre-
quency apospory should have been observed among the
kafirs (Figure 2). However, the kafirs exhibited low AI
and AES frequencies. In contrast, five of the 11 highest
AES-forming genotypes belonged to subsp. verticilli-
florum, which on average u nderwent meiosis later than
most of the other taxonomic groups (Figure 2).
Ovule area values during meiosis were also signifi-
cantly lower for the 11 highest frequency AES-forming
genotypes (Figure 5A, more and most groups; Addi-
tional file 6). This was accompanied by significantly lar-
ger percentages of total ovule area represented by the
meiocyte (Figure 5A, Germline). This indicates that in
these relatively small non-curved ovules (of apospor-
ously active genotypes), the sex ual meiocyte was act ively
growing and dividing; and this occurred whether AES
were present or not. In contrast, percentage values for
ovule area represented by the nucellus and integuments
for the two highest AES-forming groups were variable
(Figure 5A). Note from Additional file 6 that variability
among genotypes in clusters was significant. ANOVA
were also performed for groups of genotyp es defined by
k-means clustering using AI frequencies, but significant
diff erences in ovule curvature or area were not detected
among these clusters.
Ovule curvature data for the meiocyte, ES1 and ES8
stages were collected for the 300 genotypes of the F
2
mapping population (Figure 5B). As with the accessions,
groups of F
2
with the highest and the next to highest
AES formation frequencies (nine and 25 genotypes,
respectively) underwent meiosis earlier than the other
groups. This precociousness persisted into the ES1 and
ES8 stages only f or genotypes from the highest AES
formation gro up (Figure 5B, see Additional file 7 for
ANOVA results). Mean ovule curvatures for k-mean s
clusters based on AI frequencies did not differ signifi-
cantly at any stage. Te sts were conducted to determine
if F
2
plants with a low mean ovule curvature exhibited
higher AES formation frequencies. For these tests, geno-
types of the F
2
population were clustered (k-means) by
mean ovule curvature at the meiocyte, ES1 and ES8
stages, and ANOVA were performed to determine if dif-
ferences existed among clusters in frequency of AES for-
mation. The F-values for these analyses were not
significant (Additional file 7).
Precociousness of meiosis and sexual ES formation in
the highest AES and AI frequency clusters was more
distinct among the well segregated F
8
RIL (Figure 5C)
than among the F
2
(Figure5B),andthedegreeofearli-
ness in the two highest AES groups was similar to
that observed among the genetically diverse accessions
(Figure 5A). Genotypes with high AI frequencies gener -
all y had high AES frequencies (Figure 3). However, sev-
eral exceptions were observed. Two of the eight RIL in
the highest AI formation group were in the lowest AES
formation group. Likewise one of six RIL in the high
AES formation group was in the low AI formation
group. Genotypes w ith several AI often did not exhibit
AES formation, and some genotypes with relativel y high
AES formation apparently passed through the AI phase
quickly as few AI were observed.
About 30% of the RIL clustered into the more and
most AI and AES formation groups. In contrast, only
about 10% of accessions and F
2
clustered into the more
and most groups. The high percentage of RIL in the
high AES and AI formation groups affected the ovule
curvature dynamics of the entire RIL population. This
was detected by clustering RIL according to mean ovule
curvature at the meiocyte and ES1 stages. Clusters of
genotypes exhibiting the lowest ovule curvature values
(developmentally precocious) exhibited significantly
higher AI and AES frequencies (Figure 5C, see Addi-
tional file 8 for ANOVA results). As noted above, such
analyses were not significant for the accessions or for
the F
2
population.
Discussion
In grasses, a single ovule develops from the ovary pl a-
centa. Initially, the ovule primordium (young funiculus)
grows inward and perpendicular to the inner ovary wall.
As the ovule grows, the nucellus and integuments form
and undergo anisotropic curvat ure downward and away
from the developing style (Figure 1A). In the present
study, ovule curvature values at specific germline stages
(meiosis and early sexual ES forma tion) were deter-
mined and found to be less variable, likely more cana-
lized, than ovule area values. As a result, curvature
Carman et al. BMC Plant Biology 2011, 11:9
/>Page 6 of 13
M ES1
Ovule
area (
P
m
2
)
10000
20000
30000
Ovule
curvature
(degrees)
120
130
140
150
Area (% of ovule)
55
60
65
30
32
34
36
38
40
Germline stage
M ES1
1
2
3
4
5
6
Germline stage
M ES1
AES
C. RIL population
A. Accessions
Germline stage
Germline stage
Germline
Nucellus
Integument
M ES1
Ovule
curvature
(degrees)
120
130
140
150
M ES1
B. F
2
population
AI
AES
M ES1
Ovules
with AI or
AES (%)
0
2
4
6
Germline stage
M ES1 ES8
Ovule
curvature
(degrees)
130
140
150
Population
mean (±SD)
AI or AES cluster
mean (±SE)
Few
More
Most
Population
mean (±SD)
AES Cluster (±SE)
Fewest AES
Few
More
Most
Population
mean (±SD)
Ovule curvature
cluster (±SE)
Low (angle)
Moderate
High
AI
Figure 5 Means for morphometric variables. A) Mean ovule curvature, ovule area, and percentage ovule area occupied by integument,
nucellus and germline (meiocyte or young embryo sac) for 115 diploid S. bicolor genotypes (population mean, ±SD) and for four groups of
these genotypes partitioned by k-means clustering based on frequency of aposporous embryo sac (AES) formation (AES cluster, ±SE).
Measurements were taken at the dyad through early tetrad (M) and the 1-nucleate embryo sac (ES1) stages. k-means clusters representing
genotypes with the fewest, few, more and most AES consisted of 89, 15, 8 and 3 genotypes, respectively (see Additional file 6 for ANOVA
results). B) Mean ovule curvature for 300 F
2
S. bicolor genotypes (±SD) and for four groups of the F
2
(±SE) partitioned by k-means clustering
based on frequency AES formation. Measurements were taken at the M, ES1, and early 8-nucleate embryo sac (ES8) stages. k-means clusters
representing F
2
with the fewest, few, more and most AES consisted of 177, 89, 25 and 9 genotypes, respectively (see Additional file 7 for ANOVA
results). C) Population (±SD) and cluster group (±SE) means based on 119 S. bicolor recombinant inbred lines (RIL). RIL were partitioned by k-
means clustering based on frequency of AI or AES per genotype (top graphs). k-means clusters representing RIL with few, more and most AI or
AES consisted of 81, 30 and 8 RIL or 76, 37 and 6 RIL, respectively. RIL were also partitioned by k-means clustering based on ovule curvature at
the M and ES1 stages (bottom graphs). k-means clusters representing RIL with low, moderate and high ovule curvature angles at M or ES1
consisted of 49, 49 and 21 RIL or 19, 49 and 51 RIL, respectively (see Additional file 8 for ANOVA results).
Carman et al. BMC Plant Biology 2011, 11:9
/>Page 7 of 13
measurements were superior to area measurements in
detecting differences among genotypes in onset timings
of germline stages.
Meiosis and sexual ES formation occurred preco-
ciously, relative to stage of ovule development, in high
AES-producing plants (Figure 5; Additional files 6, 7, 8).
Thi s was an unexpected result, and four possib le expla-
nations for its occurrence were considered. First, early
onset of germline development may trigger apospory,
especially in Sorghum, which, being a panicoid grass,
may already be prone to apospory (24 Panicoideae gen-
era contain aposporous species). However, many g eno-
types underwent early germline development but were
not aposporous. Hence, while apospory was a goo d pre-
dictor of early g ermline development, the la tter was a
poor predictor of the former (Additional files 7, 8: com-
pare ANOVA P and r
2
values for ovule curvature
among F
2
and RIL clustered by apospory with those
obtained for frequency of apospory among F
2
and RIL
clustered by ovule curvature).
Second, meiotic instabilities due to recent hybridity
may trigger apospory and early germline development.
As noted above, a di sproportionately high percentage of
genotypes with >3% AES formation were hybridization-
derived breeding lines. However, aposporous activity
among the 150 genotypes tested (from 65 accessions)
was not correlated with meiocyte abortion, even at P <
0.25. Hence, while hybridity may have increased the fre-
quency of apospory, meiotic instability does not appear
to be a factor.
Third, heterozygosity, due to recent hybridity, might
trigger apospory and early germline development. If this
were correct, we would expect apospory and early germ-
line development to decline substantially during the pro-
duction of the RIL p opulation. However, apospory was
present among the homozygous F
8
RIL at nearly the
same frequency (5.0% of RIL had >3.0% AES format ion)
as in genotypes from the accessions (7.3%) and F
2
(7.7%). Thus, hybridity in S. bicolor may bring together
different alleles that interact quantitatively to enhance
aposporous activity, but heterozygosity does not appear
to be important.
Fourth, the e xpression of an apomixis program in S.
bicolor, though weak, may cause precocious reproduc-
tion, whether apomict ic or sexual. This possibility best
explains our observations. As noted above, apospory in
a given geno type, even at the low f requenci es observed
herein, was a good predictor of early onset of sexual
germline development. The implication is that even
though the apospory program was too weak to induce
consistent AES formation, it was strong enough to more
consiste ntly induce early onset of sexual germline devel-
opment. While precocious aposporous and diplosporous
ES formation have been documented in many apomicts
[21,26-29], to our knowledge the p resent report is the
first to document what may be a controlled heterochro-
nic acceleration of sexual germline development by apo-
mix is. Studies using additi onal sexual plants and closely
related facultative apomicts are required to determine if
precociousness of sexual reproduction in facultative apo-
micts is a general phenomenon. For such studies, curva-
ture measurements should be useful in quantifying
stages of ovule development.
Phenological traits other than ovule development also
differentiate some apomicts from related sexuals. Early
flowering is one. In the Netherlands, peak flowering of
apomictic Taraxacum occurred 5 and 10 d earlier than
that observed for sympatric diploid sexuals on south
and north facing slopes, respectively [31]. Early flower-
ing in apomicts was also observed among 52 apomictic
and 879 sexual angiospermous species in Sweden. Here,
a significantly higher proportion of apomicts (compared
to the proportion of sexuals) flowered in the early spring
[21]. Early flowering was also observed in natural sym-
patric populations of sexual and apomictic Antennaria
Gaertn., Boechera Á.Löve&D.Löve,andElymus.For
Antennaria, Boechera, Elymus as well as Tripsacum,
flowering not only occ urred earlier in the apomicts but
tended to continue indefinitely when grown continu-
ously in ideal greenhouse conditions. In contrast, more
specific environments were required to induce flowering
in related sexuals (JGC, field collection and greenhouse
notes). These examples coupled with findings presented
Parthenogenesis
or
Syngamy
Apomeiosis
or
Meiosis
Accelerated onset of reproduction
by apomeiosis/parthenogenesis
or
Sexual reproduction by
meiosis/syngamy (stress associated)
Multicellular
body plan (1n)
variable (plants)
Multicellular
body plan (2n)
variable
Protist
s
More strongly conserved
Less strongly conserved
Figure 6 Three reproducti on decis ion po ints (r ectangles)
observed at temporally distinct life cycle phases during the
eukaryote life cycle. In cyclical apomicts, whether an apomictic or
sexual pathway is pursued is controlled environmentally. In
favorable environments, sex is suppressed and rapid reproduction
by apomixis occurs. In stressful conditions, apomixis is suppressed
and sex occurs (often resulting in stress-tolerant products). The two
modes of reproduction require different developmental events at
temporally distinct life cycle stages. An epigenomic memory of the
reproductive mode during the life cycle is implicated.
Carman et al. BMC Plant Biology 2011, 11:9
/>Page 8 of 13
herein, of a precocious meiosis and sexual ES formation,
suggest that sexual dimorphism in plants (systematic
molecular, phenological or ontogenetic differences
between male, female, sexual or apomict) may be more
life-cycle-pervasive than p reviously recognized. Sexual
dimorphism at the transcriptome level (mRNA extracted
from young vegetative tissues) was recently reported
between male and female Silene L. [32].
The precocity of temporally distinct li fe-cycle events
(floral i nduction, apomeiosis, ES formation, and parthe-
nogenesis) may have evolved independently in apomicts.
However, Asker and Jerling [21] doubted this stating
that a fitness-based rationale for such directional selec-
tion at different life-cycle stages is lacking. Alternatively,
the evidence to date is consistent with the existence of
an apomixis program that epigenetically controls,
throughout the life cycle, onset timings of temporally
divergent reproduct ion-related events (Figure 6). In
cyclically apomictic animals, e.g., certain water fleas,
aphids, flatworms, rotifers, gall wasps, gall midges, and
beetles, favorable environments induce a greatly acceler-
ated rate of reproduction through apomictic live-birth
parthenogenesis. But when these same individuals
encounter stress, the apomixis program is suppressed,
and sexual reproduction, through the formation of
quiescen t and stress-tolerant eggs, occurs [33]. Tenden-
cies toward a similar cyclical apomixis in plants have
been reported. Where this has been studied, percentage
sexual ES formation was highest when plants were
grown in suboptimal conditions (as in cyclically apomic-
tic animals) . Examples include facultative apomicts of i)
Boechera, where sexual ES formation was most frequent
in stressed inflorescences [34], ii) Calamagrostis Adans.,
where sexual ES formation was most frequent i n early-
forming spikelets [35], iii) Ageratina Spach [36] and
Limonium Mill. [37], where sexual ES formation was
most frequent in plants exposed to cold stress, iv)
Dichanthium Willem. [38-40], where sexual ES forma-
tion was most prevalent when these short-day plants
were grown in long days, and v) Paspalum L. [41] and
Brachiaria (T rin.) Griseb. [42], where frequency of
sexual ES formation was highest for plants grown in
conditions unfavorable for flowering.
The hypothesis that apomixis evolves repeatedly in
eukaryotes by a hybridization or polyploidization
induced genetic or epigenetic uncoupling of sexual
stages, where some stages are discarded and others are
fortuitously retained and re-coupled [2], has received
serious consideration [3-5,43]. However, a reliance on
fortuity at the molecular level is a troubling component
of this hypothesis, and the hypothesis i n general is
inconsistent with the observation that apomixis has
failed to arise spontaneously (even once) among many
tens of thousands of intra and inter-specific hybrids and
amphiploids that have been produced artificially during
the past 100 years. Herein, we suggest that the apparent
uncoupling/recoupling process is not fortuito us but evi-
dence of an ancient sex/apomixis switch (Figure 6) the
molecular components of which have been retained, to
a greater or lesser extent, in relatively few eukaryote
lineages during evolution. Hybridization and polyploidi-
zati on may o ccasionally epigenetically trigge r the switch
(from sex to apomixis or vice versa) but only in lineages
that have retained, a t the molecular level, a sufficient
capacity for each mechanism. If this ancient alternatives
hypothesis is correct, apomixis may be more complex
than previously envisioned. It may be a life-cycle phe-
nomenon, like sexual reproduction, that includes reset-
ting the epigenetic clock each generation. Accordingly,
apomixis in eukaryotes would share a common funda-
men tal theme, i.e., the formation of unreduced and epi-
genetically reset parthenogenetically active cells from
germline cells or closely associated cells (cells normally
associated with sexual reproduction).
Similarities in the environmental control of the sex/
apomixis switch between cyclically apomictic animals
and facultatively apomictic plants that exhibit cyclical
apomixis tendencies were recognized in the 1960s [39].
These similarities suggest that the unicellular common
ancestor of plants and animals was cyclically apomictic
or at least possessed processes by which cyclical apo-
mixis could evolve by parallel evolution. In this respect,
the precocious meiosis and sexual ES formation
observed in the present study (Figure 5) may be regu-
lated by the same epigenetic network that induces early
flowering in apomicts, a reproductive step occurring
much earlier in the life cycle, as well as precocious
embryogenesis fro m parthenogenetic eggs [20,21], a
reproductive step occurring much later in the life cycle.
Molecular studies are required to evaluate these
possibilities.
Conclusions
Much variation was found among S. bicolor accessions
in timing of germline develop ment relative to ovary and
ovule development. In this respect, ovule curva ture
appeared to be strongly canalized, and was more consis-
tent than ovule area in predicting onset timing of speci-
ficgermlineevents.AESformationwasmostprevalent
in subsp. verticilliflorum and in the breeding lines of
subsp. bicolor. It was uncommon in races of subsp. bico-
lor. Correlations between AES and AI were lower than
expected, which suggests that additional factors are
required for AES formation. Meiosis and sexual ES for-
mation occurred precociously in genotypes with high
AES frequencies. AES formation did no t appear to be
triggered by early onset of sexual germline dev elopment,
meiotic instabilities or heterozygosity. Instead, a weakly
Carman et al. BMC Plant Biology 2011, 11:9
/>Page 9 of 13
expressed apomixis program in certain genotypes
appeared to accelerate onset of reproduction, whether
apomictic or sexual.
The present study adds onset o f meiosis and sexual ES
formation to onset of the vegetative/floral transition, apo-
mictic ES formation, and parthenogenesis as processes
that occur early in apomictic plants. The temporally
diverse nature of these events suggests that an epigenetic
memory of the apomixis status of the plant e xists, which
is maintained throughout the life cycle (Figure 6). In
some plants, as in cyclically apomictic animals, this mem-
ory is degraded by reproductively marginal (stress-
related) conditions. The result is an increased frequency
of progeny that are produced sexually.
Apomictic plants share developmental and phenologi-
cal traits characteristic of apomictic organisms from
other kingdoms. These include i) a first division apo-
meiotic restitution (observed in many apomictic plants
and animals), ii) parthenogenesis, iii) precocious onset
of reproduction, and iv) tendencies toward cyclical apo-
mixis. In cyclically apomictic animals and in plants exhi-
biting cyclical apomixis tendencies, sex is favored during
stress and genetically reduced quiescent eggs are pro-
duced. In the same individuals, apomixis drives clonal
fecundity during reproductively favorab le conditions.
The quiescent egg phase is skipped: cyclically apomictic
animals, which produce quiescent eggs when reprodu-
cing sexually, undergo live birth, and the parthenoge-
netic eggs of apomict ic plants produce embryos
precociously. Whether apomicts from diverse kingdoms
share molecular components of a conserved apomixis/
sex switch is a question that awaits further elucidation.
Such a finding would imply that apomixis is more
ancient and more complex than previously envisioned.
Methods
Plant material
Seed of 72 S. bicolor accessions were obtained from the
U.S. Department of Agriculture (USDA, 54 accessions),
the International Crops Research Center for the Semi-
arid Tropics, Hyderabad, India (ICRISA T, 4 accessions),
and Boomerang Seed, Inc., Liberty Hill, TX, USA (14
breeding lines). All races of S. bicolor subsp. bicolor
(bicolor, guinea, caudatum, kafir, and durra) were repre-
sented by multiple accessions. The studied plants
included 21 S. bicolor subsp. bicolor breeding lines, 36
S. bicolor subsp. bicolor race or inter-race accessions,
and 15 S. bicolor subsp. verticilliflorum accessions
(Additional file 9). Additionally, seed of 119 F
8
RIL were
obtained from the USDA, Texas A&M University, Col-
lege Station, TX, USA [30]. Parents of this RIL mapping
population, BTx623 and IS3620C, were among the
accessions studied (Additional file 9). Additionally, 300
genotypes of an F
2
mapping population, produced from
a single F
1
, were studied. Early Kalo (NSL 3999) was the
female open-pollinated parent of the F
1
. The male par-
ent was not identified, but molecular genotyping of
Early Kalo, the F
1
, and F
2
confirmed the hybrid status of
the F
1
(data not shown).
Seeds were sown in pots containing a 3:1:1 mixture of
Sunshine Mix #1 (Sun Gro Horticulture Canada Ltd,
Vancouver, BC, Canada), peat moss, and soil, respec-
tively, and the resulting plants were grown in controlled
environment greenhouses at Utah State University,
Logan,UT,USA.Theplants,thinnedtooneplantper
pot, were exposed to a 32/25°C day/night temperature
regime, and supplemental 1000 W hig h-pressure
sodium-vapor lamps were used to extend the photoper-
iod to an 11/13 day/night photoperiod for short-day
plants and a 16/8 day/night regime for day- neutral
plants. A greenhouse equipped with automatic shading
was used to achieve rapid flowering for short-day acces-
sions. With supplemental lighting, daytime photosyn-
thetic photon flux at the top of the canopy seldom fell
below 600 μmol m
-2
sec
-1
. All plants were fertilized at
each watering through an injector that delivered fertili-
zer (15:20:20) at approximately 250 mg L
-1
.Toprovide
adequate samples of inflorescence s of each genotype,
ramets (groups of interconnected tillers) were excised
from the crowns of each plant and grown as separate
clones in separate pots.
Morphometrics
Young inflorescences at the early to mid boot stage were
fixed in formalin acetic acid alcohol (FAA) for 48 h and
stored in 70% ethanol. Ovaries (pistils) were excised,
cleared in 2:1 benzyl benzoate dibutyl phthalate, and
mounted in sagittal orientation [44]. Ovaries were stu-
died using differential interference contrast (DIC) optics
of a Zeiss Universal, an Olympus BH2, and four Olym-
pus BX53 microscopes, each equipped with digital
image analysis systems. Area measurements of the entire
ovule and its individual components (meiocyte or ES,
nucellus, and integuments) were obtained from optical
sections of sagittally oriented ovaries at the dyad to
early tetrad stage, the ES1 stage, and for some plants
the early ES8 s tage. Ovule curvature (angle) measure-
ments were also taken at these stages by inscribing a
linefromthetipofthelargestinnerintegumentofthe
anisotropically growing ovule to its base and then along
the base of th e ovule (Figure 1A). The intersecting ang le
was subtracted from 180, which provided a measure of
the stage of ovule development (larger values corre-
sponding to more developed ovules). Ovule area and
curvature measurements were taken from 15,369 cor-
rectly staged ovules, 2820 from 116 genotypes from 57
S. bicolor accessions ( 12 to 48 ovules per stage per
accession), 8328 from 300 F
2
(generally 12 ovules per
Carman et al. BMC Plant Biology 2011, 11:9
/>Page 10 of 13
stage per F
2
), and 4221 from 119 RIL (generally 12
ovules per stage per RIL).
Quantifying aposporous development
Frequency data for AI, AES and LSC were obtained
from ramets of 569 unique genotypes (150 plants from
65 accessions, 300 F
2
,119RIL).NumbersofAI,AES
and LSC observed were recorded for each genotype, and
frequency data by genotype were determined. Numbers
of ovules with a degenerating meiocyte or degenerating
early sexual ES were recorded f or each genotype. The
percentage of ovules per accession where one or more
AI, AES or LSC occurred was also determined. Frequen-
cies were obtained by analyzing 131,727 cleared,
mounted, and correctly staged (FM through ES2) ovules:
33,437 from the 65 accessions, 50,462 from the 300 F
2
,
and 47,828 from the 119 RIL. Sample size per genotype
ranged from 51-630 but was generally >100.
Associating apospory with ovule morphometrics
k-means multivariate clustering [45] was used to cluster
per-genotype AI or AES frequencies into three or four
groups of similar frequency and with intra-cluster var-
iance minimized. Three separate populations were ana-
lyzed: 115 diploid genotypes (from 57 accessions), 300
F
2
and 119 RIL. ANOVA was used to determine if dif-
ferences in ovule size (area) or curvature existed among
the k-means groups (low to high frequency AI or A ES)
of each population. k-means groups were also deter-
mined based on ovule curvature, and ANOVA was used
to determine if differences in AI or AES frequencies
existed among the k-means groups of each of the three
populations.
Flow cytometry of nuclear DNA content
Samples (0.5 cm
2
each) of pre-expanded S. bicolor leaves
were chopped for 30-60 sec using a razor blade in a few
drops of Partec Extraction Buffer (CyStai n UV precise P
reagent kit, Partec GmbH, Münster, Germany), incu-
bated for 2-5 min, and filtered using a Partec 50 μm
CellTrics filter for each sample. Partec DAPI (4,6-diami-
dino-2-phenylindole) Staining Buffer (1.6 ml) was then
added to each sample, and the samples were incubated
for several min. Using a Partec PA flow cytometer, each
sample was exposed to UV light (l < 420 nm) and
nuclear fluorescence was measured (l = 435-500 nm).
Relative fluorescence intensities from nuclei were gener-
ated and displayed using Partec software. Several diploid
S. bicolor plants (breeding lines and races are ge nerally
diploid [12]) were used as the ploidy standard. Multiple
samples were measured for each plant.
Additional material
Additional file 1: Correlations between mean ovary and ovule
lengths at the dyad to early tetrad (M), 1-nucleate embryo sac (ES1)
and 8-nucleate embryo sac (ES8) stages of germline development.
Points represent means from 25 accessions. See Additional file 9 for
accession information and Additional file 2 for sample sizes. For the
regression analyses, ** and *** denote significance at P < 0.01 and P <
0.001, respectively.
Additional file 2: Ovary length means (±SE) at the dyad to early
tetrad stage of meiosis (M
I&II
), the 1-nucleate embryo sac stage
(ES1) and the early 8-nucleate embryo sac stage (ES8) for 25
accessions. The two ANOVA main effects, accession and stage, and their
interaction were highly significant (P < 0.001). See Additional file 9 for
accession information. Numbers in bars are sample sizes.
Additional file 3: Frequency of aposporous initials (AI), aposporous
embryo sacs (AES) and large stack cells (LSC) in ovules and ovule
measurements, including mean ovule curvature (angle), ovule area
in sagittal section, and percentage of ovule area in sagittal section
consisting of the nucellus (NUC), the integument (INTEG), and the
germ cell (meiocyte or embryo sac, GERM) for 116 Sorghum bicolor
genotypes from 57 accessions (see Additional file 9 for accession
information).
Additional file 4: Abbreviated ANOVA table for data summarized in
Figure 2. Two analyses were performed, one for all 116 S. bicolor
genotypes listed in Additional file 3 and one that included only
genotypes from accessions of Additional file 3 represented by two or
more genotypes.
Additional file 5: Frequency of aposporous initials (AI), aposporous
embryo sacs (AES) and large stack cells (LSC) in ovules of 34 S.
bicolor genotypes from 27 accessions (see Additional file 9 for
accession information). Genotypes listed here supplement those listed
in Additional file 3 for the AI, AES and LSC tally.
Additional file 6: Abbreviated ANOVA table for morphometric
comparisons among accessions that were clustered based on
frequency aposporous embryo sac (AES) formation. The data are
summarized in Figure 5A.
Additional file 7: Abbreviated ANOVA table for ovule curvature
comparisons among F
2
that were clustered based on frequency
aposporous embryo sac (AES) formation. The data are summarized in
Figure 5B. Also listed are ANOVA F-ratios for mean AES frequency
comparisons made between groups of F
2
genotypes clustered by ovule
curvature (angle) at the meiocyte (dyad through early tetrad), 1-nucleate
embryo sac (ES1), and 8-nucleate embryo sac (ES8) stages.
Additional file 8: Abbreviated ANOVA table for ovule curvature
comparisons among RIL that were clustered based on frequency
aposporous initial (AI) or aposporous embryo sac (AES) formation.
The data are summarized in Figure 5C (top and bottom graphs). Also
listed are ANOVA F-ratios for mean AI or AES frequency comparisons
made between groups of RIL clustered by ovule curvature (angle) at the
meiocyte (dyad through early tetrad) and 1-nucleate embryo sac (ES1)
stages.
Additional file 9: Race or subspecies, common name, collection
identifiers and country of origin for 72 Sorghum bicolor accessions
evaluated for apomictic embryo sac formation and/or other
morphometric variables of ovule development.
Acknowledgements
For technical assistance we thank Becky Kowallis, Aaron Lawyer, John
Carman Jr., and Jayasree Pattanayak. We appreciate critical comments and
suggestions provided from Elvira Hörandl, Diego Hojsgaard, David Sherwood
Carman et al. BMC Plant Biology 2011, 11:9
/>Page 11 of 13
and several anonymous reviewers. This research was supported by Caisson
Laboratories, Inc., North Logan, UT; USDA SBIR award no. 2000-00086
(awarded to Caisson); U.S. Dep. of Com., NIST, ATP cooperative agreement
no. 70NANB4H3039 (awarded to Caisson); and the Utah Agricultural
Experiment Station, Utah State University, Logan, UT 84322-4845 (approved
as journal paper no. 8227).
Author details
1
Plants, Soils & Climate Department, Utah State University, Logan, Utah
84322-4820, USA.
2
Caisson Laboratories, Inc., North Logan, Utah 84322-4820,
USA.
3
College of Southern Idaho, Shields Building, P.O. Box 1238, Twin Falls,
Idaho 83303, USA.
4
Nalichnaja Street 14 ap. 59, 199406 St. Petersburg, Russia.
Authors’ contributions
JGC conceived of and provided the initial design of the study. MJ, EE, TNN
and KKD provided important suggestions for refining the design. MJ and
TNN provided cytological techniques and training, identified additional
important variables to analyze, and supervised data collection. EE and JGC
analyzed the data. JGC wrote the paper. All authors read and approved the
final manuscript.
Received: 1 October 2010 Accepted: 11 January 2011
Published: 11 January 2011
References
1. Nogler GA: Gametophytic apomixis. In Embryology of Angiosperms. Edited
by: Johri BM. Springer-Verlag; 1984:475-518.
2. Carman JG: Asynchronous expression of duplicate genes in angiosperms
may cause apomixis, bispory, tetraspory, and polyembryony. Biol J Linn
Soc 1997, 61:51-94.
3. Ozias-Akins P, van Dik PJ: Mendelian genetics of apomixis in plants. Ann
Rev Genet 2007, 41:509-537.
4. Tucker MR, Koltunow AMG: Sexual and asexual (apomictic) seed
development in flowering plants: molecular, morphological and
evolutionary relationships. Funct Plant Biol 2009, 36:490-504.
5. Rodrigues JCM, Koltunow AMG: Epigenetic aspects of sexual and asexual
seed development. Acta Biol Craco Series Bot 2005, 47:37-49.
6. Charon C, Moreno AB, Bardou F, Crespi M: Non-protein-coding RNAs and
their interacting RNA-binding proteins in the plant cell nucleus. Mol
Plant 2010, 3:729-739.
7. Naumova TN: Apomixis in angiosperms. Nucellar and Integumentary
Embryony. Boca Raton, CRC Press; 1993.
8. APG III: An update of the angiosperm phylogeny group classification for
the orders and families of flowering plants. Biol J Linn Soc 2009,
161:105-121.
9. Abrouk M, Murat F, Pont C, Messing J, Jackson S, Faraut T, Tannier E,
Plomion C, Cooke R, Feuillet C, Salse J: Palaeogenomics of plants: synteny-
based modeling of extinct ancestors. Trends Plant Sci 2010, 15:479-487.
10. Paterson AH, Bowers JE, Bruggmann R, Dubchak I, Grimwood J,
Gundlach H, Haberer G, Hellsten U, Mitros T, Poliakov A, Schmutz J,
Spannagl M, Tang H, Wang X, Wicker T, Bharti AK, Chapman J, Feltus FA,
Gowik U, Grigoriev IV, Lyons E, Maher CA, Martis M, Narechania A, Otillar RP,
Penning BW, Salamov AA, Wang Y, Zhang L, Carpita NC, Freeling M,
Gingle AR, Hash CT, Keller B, Klein P, Kresovich S, McCann MC, Ming R,
Peterson DG, Mehboob-ur-Rahman , Ware D, Westhoff P, Mayer KFX,
Messing J, Rokhsar DS: The Sorghum bicolor genome and the
diversification of grasses. Nature 2009, 457:551-556.
11. Van de Peer Y, Maere S, Meyer A: The evolutionary significance of ancient
genome duplications. Nat Rev Genet 2009, 10:725-732.
12. Dahlberg JA: Classification and characterization of sorghum. In Sorghum:
Origin, History, Technology, and Production. Edited by: Smith CW, Frederiksen
RA. John Wiley 2000:99-130.
13. Hanna WW, Schertz KF, Bashaw EC: Apospory in Sorghum bicolor (L.)
Moench. Science 1970, 170:338-339.
14. Reddy CS, Schertz KF, Bashaw EC: Apomictic frequency in sorghum R473.
Euphytica
1980, 29:223-226.
15.
Tang CY, Schertz KF, Bashaw EC: Apomixis in sorghum lines and their F1
progenies. Bot Gaz 1980, 141:294-299.
16. Rana BS, Reddy CS, Rao VJM, Rao NGP: Apomixis in grain sorghums:
analysis of seed set and effects of selection. Indian J Genet Plant Breed
1981, 41:118-123.
17. Elkonin LA, Enaleeva N-Kh, T svetova MI, Belyaeva EV, Ishin AG: Partially
fertile line wi th apospory obtained from tissue culture of male sterile
plant of sorghum (Sorghum bicolor L. Moench). Ann Bot 19 95,
76:359-364.
18. Marshall DR, Downes RW: A test for obligate apomixis in grain sorghum
R473. Euphytica 1977, 26:661-664.
19. Bala Ravi S: Apomixis in sorghum line R473 - truth or myth? A critical
analysis of published work. Curr Sci 1993, 64:306-315.
20. Gustafsson Å: Apomixis in higher plants. I. The mechanism of apomixis.
Lunds Univ Årssk 1946, 42:1-67.
21. Asker SE, Jerling L: Apomixis in Plants. Boca Raton: CRC Press; 1992.
22. Sánchez-Ken JG, Clark LG: Phylogeny and a new tribal classification of the
Panicoideae S.L. (Poaceae) based on plastid and nuclear sequence data
and structural data. Amer J Bot 2010, 97:1732-1748.
23. Crane DF: Classification of apomictic mechanisms. In The Flowering of
Apomixis: From Mechanisms to Genetic Engineering. Edited by: Savidan Y,
Carman JG, Dresselhaus T. Mexico, D.F.: CIMMYT, IRD, European Commission
DG VI (FAIR); 2001:24-43.
24. Sherwood RT: Genetic analysis of apomixis. In The Flowering of Apomixis:
From Mechanisms to Genetic Engineering. Edited by: Savidan Y, Carman JG,
Dresselhaus T. Mexico, D.F.: CIMMYT, IRD, European Commission DG VI
(FAIR); 2001:64-82.
25. Matzk F, Meister A, Schubert I: An efficient screen for reproductive pathways
using mature seeds of monocots and dicots. Plant J 2000, 21:97-108.
26. Leblanc O, Savidan Y: Timing of megasporogenesis in Tripsacum species
(Poaceae) as related to the control of apomixis and sexuality. Pol Bot
Stud 1994, 8:75-81.
27. Peel MD, Carman JG, Leblanc O: Megasporocyte callose in apomictic
buffelgrass, Kentucky bluegrass, Pennisetum squamulatum Fresen,
Tripsacum L. and weeping lovegrass. Crop Sci 1997, 37:724-732.
28. Peel MD, Carman JG, Liu ZW, Wang RRC: Meiotic anomalies in hybrids
between wheat and apomictic Elymus
rectisetus (Nees in Lehm.) A. Löve
& Connor. Crop Sci 1997, 37:717-723.
29. Carman JG: Do duplicate genes cause apomixis? In Apomixis: evolution,
mechanisms and perspectives. Edited by: Hörandl E, Grossniklaus U, van Dijk
PJ, Sharbel TF. ARG Gantner Verlag KG; 2007:63-91.
30. Menz MA, Klein RR, Mullet JE, Obert JA, Unruh NC, Klein PE: A high-density
genetic map of Sorghum bicolor (L.) Moench based on 2926 AFLP®, RFLP
and SSR markers. Plant Mol Biol 2002, 48:483-499.
31. Verduijn VH, Van Dijk PJ, Van Damme JMM: Distribution, phenology and
demography of sympatric sexual and asexual dandelions (Taraxacum
officinale s.l.): geographic parthenogenesis on a small scale. Biol J Linn
Soc 2004, 82:205-218.
32. Zluvova J, Zak J, Janousek B, Vyskot B: Dioecious Silene latifolia plants
show sexual dimorphism in the vegetative stage. BMC Plant Biol 2010,
10:208.
33. Suomalainen E, Saura A, Lokki J: Cytology and Evolution in
Parthenogenesis. CRC Press, Baca Raton; 1987.
34. Böcher TW: Cytological and embryological studies in the amphi-
apomictic Arabis holboellii-complex. Danske Viden Selskab, Biol Skrifter 1951,
6:1-59.
35. Nygren A: Form and biotype formation in Calamagrostis purpurea.
Hereditas 1951, 37:519-532.
36. Sparvioli E: Osservazioni cito-embryologiche in Eupatorium riparium Reg.
II. Megasporogenesi e sviluppo del gametofito femminile. Ann di Bot
1960, 26:481-504.
37. Hjelmqvist H, Grazi F: Studies on variation in embryo sac development.
Bot Not 1964, 117:141-166.
38. Knox RB, Heslop-Harrison J: Experimental control of aposporous apomixis
in a grass of the Andropogoneae. Bot Not 1963, 116:127-141.
39. Knox RB: Apomixis: seasonal and population differences in a grass.
Science 1967, 157:325-326.
40. Saran S, de Wet JMJ: Environmental control of reproduction in
Dichanthium intermedium. J Cyto Genet 1976, 11
:22-28.
41.
Quarin CL: Seasonal changes in the incidence of apomixis of diploid,
triploid, and tetraploid plants of Paspalum cromyorrhizon. Euphytica 1986,
35:515-522.
42. Lutts S, Ndikumana J, Louant BP: Male and female sporogenesis and
gametogenesis in apomictic Brachiaria brizantha, Brachiaria decumbens
and F
1
hybrids with sexual colchicine induced tetraploid Brachiaria
ruziziensis. Euphytica 1994, 78:19-25.
Carman et al. BMC Plant Biology 2011, 11:9
/>Page 12 of 13
43. Sharbel TF, Voigt M-L, Corral JM, Galla G, Kumlehn J, Klukas C, Schreiber F,
Vogel H, Rotter B: Apomictic and sexual ovules of Boechera display
heterochronic global gene expression patterns. Plant Cell 2010, 655-671.
44. Crane CF, Carman JG: Mechanisms of apomixis in Elymus rectisetus from
Eastern Australia and New Zealand. Amer J Bot 74:477-496.
45. SYSTAT: SYSTAT for Windows. SYSTAT Software, Inc 2004, Ver. No. 11.00.01.
doi:10.1186/1471-2229-11-9
Cite this article as: Carman et al.: Apospory appears to accelerate onset of
meiosis and sexual embryo sac formation in sorghum ovules. BMC Plant
Biology 2011 11:9.
Submit your next manuscript to BioMed Central
and take full advantage of:
• Convenient online submission
• Thorough peer review
• No space constraints or color figure charges
• Immediate publication on acceptance
• Inclusion in PubMed, CAS, Scopus and Google Scholar
• Research which is freely available for redistribution
Submit your manuscript at
www.biomedcentral.com/submit
Carman et al. BMC Plant Biology 2011, 11:9
/>Page 13 of 13