báo cáo khoa học: " Harpin-induced expression and transgenic overexpression of the phloem protein gene AtPP2-A1 in Arabidopsis repress phloem feeding of the green peach aphid Myzus persicae" pps
Bạn đang xem bản rút gọn của tài liệu. Xem và tải ngay bản đầy đủ của tài liệu tại đây (2.78 MB, 19 trang )
RESEARCH ARTICLE Open Access
Harpin-induced expression and transgenic
overexpression of the phloem protein gene
AtPP2-A1 in Arabidopsis repress phloem feeding
of the green peach aphid Myzus persicae
Chunling Zhang
1†
, Haojie Shi
1†
, Lei Chen
1,2†
, Xiaomeng Wang
1†
, Beibei Lü
1
, Shuping Zhang
1
, Yuan Liang
1
,
Ruoxue Liu
1
, Jun Qian
1
, Weiwei Sun
1
, Zhenzhen You
1
, Hansong Dong
1*
Abstract
Background: Treatment of plants with HrpN
Ea
, a protein of harpin group produced by Gram-negative plant
pathogenic bacteria, induces plant resistance to insect herbivores, including the green peach aphid Myzus persicae,
a generalist phloem-feeding insect. Under attacks by phloem-feeding insects, plants defend themselves using the
phloem-based defense mechanism, which is supposed to involve the phloem protein 2 (PP2), one of the most
abundant proteins in the phloem sap. The purpose of this study was to obtain genetic evidence for the function
of the Arabidopsis thaliana (Arabidopsis) PP2-encoding gene AtPP2-A1 in resistance to M. persicae when the plant
was treated with HrpN
Ea
and after the plant was transformed with AtPP2-A1.
Results: The electrical penetration graph technique was used to visualize the phloem-feeding activities of apterous
agamic M. persicae females on leaves of Arabidopsis plants treated with HrpN
Ea
and an inactive protein control,
respectively. A repression of phloem feeding was induced by HrpN
Ea
in wild-type (WT) Arabidopsis but not in
atpp2-a1/E/142, the plant mutant that had a defect in the AtPP2-A1 gene, the most HrpN
Ea
-responsive of 30 AtPP2
genes. In WT rather than atpp2-a1/E/142, the deterrent effect of HrpN
Ea
treatment on the phloem-feeding activity
accompanied an enhancement of AtPP2-A1 expression. In PP2OETAt (AtPP2-A1-overexpression transgenic
Arabidopsis thaliana) plants, abundant amounts of the AtPP2-A1 gene transcript were detected in different organs,
including leaves, stems, calyces, and petals. All these organs had a deterrent effe ct on the phloem-feeding activity
compared with the same organs of the transgenic control plant. When a large-scale aphid population was
monitored for 24 hours, there was a significant decrease in the number of aphids that colonized leaves of HrpN
Ea
-
treated WT and PP2OETAt plants, respectively, compared with control plants.
Conclusions: The repression in phloem-feeding activities of M. persicae as a result of AtPP2-A1 overexpression, and
as a deterrent effect of HrpN
Ea
treatment in WT Arabidopsis rather than the atpp2-a1/E/142 mutant suggest that
AtPP2-A1 plays a role in plant resistance to the insect, particularly at the phloem-feeding stage. The accompanied
change of aphid population in leaf colonies suggests that the function of AtPP2-A1 is related to colonization of the
plant.
* Correspondence:
† Contributed equally
1
Key Laboratory of Monitoring and Management of Crop Pathogens and
Insect Pests, Ministry of Agriculture of R. P. China, Nanjing Agricultural
University, Nanjing, 210095, PR China
Full list of author information is available at the end of the article
Zhang et al. BMC Plant Biology 2011, 11:11
/>© 2011 Zhang et al; licensee BioMed Central Ltd. This is an Ope n Access ar ticle distributed under the terms of the Creative Commons
Attribution License ( g/li censes/by/2.0), which permits unrestricted use, distribution, and reproduction in
any medium, provided the original wor k is properly cited.
Background
Harpins are multifunctional proteins produced by
Gram-negative plant pathogenic bacteria [1,2]. The first-
characterized [1] and well-studied harpin [2-7], HrpN
Ea
,
is secreted by Erwinia amylovora, the bacterial pathogen
that causes fire blight disease in rosaceous plants [1].
Multiple functions of harpin proteins, especially in elicit-
ing plant defense responses, were also elucidated initially
by studies using HrpN
Ea
as a paradigm [1-3]. Ea rly stu-
dies demonstrated that the external application of
HrpN
Ea
was able to induce resistance in a variety of plant
species [3-7], and that the induced resistance effectively
protected plants from attacks by insect herbivores
[2,7-9]. HrpN
Ea
-induced resistance to insects first was
suggested based on observations of field-grown peppers.
Plants that had been treated with HrpN
Ea
incurred fewer
injuries from the Europea n corn borer than comparable
untreated plants [2]. A deterrent effect on striped cucum-
ber beetles was observed in HrpN
Ea
-treated cucumber;
striped cucumber beetles pre ferred to colonize untreated
control plants rather than HrpN
Ea
-treated plants [8].
HrpN
Ea
-induced resistance was also effective in impeding
infestations of aphids, an important type of phloem-feed-
ing herbivores [9,10]. In c ucumber s grown under envir-
onmentally controlled conditions, HrpN
Ea
treatment had
a deterrent effect on colonization by the muskmelon
aphid Aphis gossypii (Glover), which preferred to colonize
control plants rather than HrpN
Ea
-treated plants [9]. In
Arabidopsis thaliana (Arabidopsis), moreover, HrpN
Ea
-
induced resistance was shown to repress infestation of
the green peach aphid Myzus persicae (Sulzer), a general-
ist phloem-feeding insect [10].
Phloem-feeding insects are highly specialized in their
mode of feeding [11] and present a unique stress on
plant fitness [12-15]. These insects use their slender sty-
lets to feed from a single-cell type, the phloem sieve ele-
ment [8,16]. The feeding process ca n be moni tored by
the electrical penetration graph (EPG) t echnique [16].
Pivotally, a stylet puncturing of the host plant cell,
shown as a probe in the EPG, may lead to uptake of the
phloem sap. In order to prevent protein clogging inside
the sieve element, ejection of watery saliva is essential in
feeding from the phloem [13,16]. This ejection is
detected in the EPG as E1 salivation and always pre-
cedes phloem sap ingestion [16]. During ingestion from
the sieve element, the watery E2 salivation occurs, and
this E2 saliva is added to the ingested sap, thought to
prevent phloem protei ns from cloggi ng insi de the capil-
lary food canal [16]. Therefore, salivation is a crucial
event during the phloem-feeding process for insects to
overcome a number of phloem-related plant properties
and reactions [13-19].
In response to the phloem-feeding stress, plants
defend themselves specifically using the phloem-based
defense (PBD) mechanism [14-16], which can be also
activated by other cues, such as wounding [20-22],
besides insect attacks [14,20-22]. Proposed components
of PBD include the ph loem protein 1 (PP1) and phloem
protein 2 (PP2), which represent a type of the most
abundant proteins in the phloem sap [23]. PP2 is a
phloem lectin conserved in plants [23,24] and is believed
to play a role in the establishment of PBD induced by
insect attacks [21,25,26] and other stresses, such as
wounding [16,21,22,26] and oxidative conditions [25] . In
pumpkin, PP1 monomers and PP2 dimers are covalently
cross-linked via disulphide bonds, forming high molecu-
lar weight polymers that close the sieve pores [21,25,26].
This response is induced by oxidative stress [25] but
normally accompanies the synthesis of the b-1,3-glucan
callose by callose synthase [20] that accumulates on
sieve plates after different stress treatments [21]. Phloem
protein plugging and callose closure of sieve pores, and
callose coagulation on sieve plat es as well, is hypothe-
sized to serve as a physical barrier to prevent the insect
from phloem-feeding activity [26]. Nevertheless, evi-
dence for the function of phloem proteins in insect
defense has been in paucity.
In the comple tely sequenced Arabidopsis genome,
PP2 (previously PP2-like) g enes were identified as a
large multigene family constituted of 30 members
[23,27], AtPP2-A1 to AtPP2A-15 and AtPP2-B1 to
AtPP2-B15 [23]. To our knowledge, however, little has
been known about bioprocesses affected by thes e genes
and properties of the encoded proteins. Although Arabi-
dopsis mutants t hat represent multiple mutation alleles
of AtPP2 have been generated [27,28], subsequent biolo-
gical effects have not been studied, and especially,
effects of AtPP2 mutations on the plant resistance to
insects are unclear. For example, different types of Ara-
bidopsis mutants were generated by T-DNA insertion at
distinct locations in the AtPP2-A1 DNA sequence;
atpp2-a1/P/-210 resulted from the insertion at nucleo-
tide residue -210 in the p romoter region. When grown
on an artificial medium, the atpp2-a1/P/-210 mutant
performs as the wild-type (WT) plant in response to
infestations of M. persicae adults and newborn nymphs
in 24 hours after colonization by the adults [29]. There
isasyetnoevidencetoshowifatpp2-a1/P/-210
impacts longer behaviors and feeding activities of the
insect and if other mutation alleles of AtPP2-A1 have
biological effects [27,28].
The purpose of this study was to o btain genetic evi-
dence that could elucidate a function of AtPP2-A1 in
Arabidopsis resistance to M. persicae.Webeganwith
determining the effect of AtPP2-A1 on phloem feeding
of aphids that colonized the plants treated with HrpN
Ea
according to previous evidence that the HrpN
Ea
treat-
ment and M. persicae infestation had some degrees of
Zhang et al. BMC Plant Biology 2011, 11:11
/>Page 2 of 19
overlapping effects on the induction of plant responses.
For example, formation of the PP2-PP1 complex needs
reactive oxygen burst in cucurbit [25] while reactive
oxygen burst is a conserved response in Arabidopsis
treate d with any harpins [30,31]. M. persicae infestation
induces an elevation of the ethylene level [32] and trig-
gers modest induction of ethylene-dependent responses
[32,33], whereas, HrpN
Ea
induces resistance to M. persi-
cae by activating the ethylene-signaling pathway [4,34].
Therefore, we devised to determine the possibility that
HrpN
Ea
-induced resistance involves the PBD mechanism
to encounter with M. persicae infestation. In order to
further test this hypothesis, we generated AtPP2-A1-
overexpression plants and investigated them to elucidate
the supposed function of AtPP2-A1. In this article, we
report evidence that harpin-induced expression and
transgenic overexpression of AtPP2-A1 induce a repres-
sion in the phloem-feeding activity of M. persicae.
Results
HrpN
Ea
treatment in Arabidopsis induces a repression in
phloem feeding and colonization by M. persicae
The HrpN
Ea
protein used in this study was produced by
prokaryotic expression with a vector that carried a
hrpN
Ea
gene insert; the hrpN
Ea
-absent Empty Vector
Preparation (EVP) that contained inactive proteins but
not HrpN
Ea
wasusedasacontrol[6].Weinvestigated
activities of M. persicae feeding from Arabidopsis (eco-
type Col-0) WT plants following treatment with EVP
and HrpN
Ea
, respectively. Because a period of five days
is usually required for the induction of plant defense
responses [3-8], plants at the fifth day posttreatment
(dpt) were artificially colonized with u niform ten-day-
old apterous (wingless) agamic M. persicae females
transferred f rom an Arabidopsis nursery. Aphid feeding
activities were studied by the EPG technique applied to
20 aphids that colonized leaves of Arabidopsis plants
treated with EVP and HrpN
Ea
, respectively. Feeding
activities were depicted as diff erent waveform patterns
recognized according to the standard previously estab-
lished [35] and widely used [13,16,17,36]. Based on the
EPG patterns , all the 20 aphids tested in five repetitions
of the experiments for each treatment accomplished
major steps of the feeding process, but aphid activities
varied greatly depending on feeding stages (Table 1).
Figure 1a shows a four-hour EPG record of aphid
feeding from the WT plant. The nonpunctur ing phase
(Figure 1a, np) indicated the stylet staying outside the
cuticle. Cell puncturing (Figure 1a, probe) led to the
pathway phase (Figure 1a, path ) in which the stylet pene-
trated between c ells en route to the vascular tissue [35].
In the four-hour EPG record, total number and duration
of the nonpuncturing phase, time to the firs t cell punc-
turing or the first pathway phase, and total numb er and
duration of the pathway phase were all similar in
HrpN
Ea
-treated plants as in control plants (Table 1). The
pathway phase represents insect’s efforts in navigating
the phloem and preparing to ingest sap from sieve ele-
ments [16,17]. Subsequently, aphids may proceed to the
phloem phase (Figure 1a, PP) in which ingestion of t he
phloem sap may occur [16]. The pathway phase may be
also connected with the xylem phase, indicating stylet
penetration of the xylem in the vascular tissue [16], but
xylem phase was not found in this study. Analyses of the
four-hour EPG record as a whole suggested that the
plant treatment with HrpN
Ea
did not evidently change
aphid activities outside vascular tissues when evaluated in
a four-hour course of surveys (Table 1). However, ana-
lyses by hour offered additio nal information. In the first
hour, especially, t he nonpuncturing phase was more fre-
quent with longer duration while the pathway phase was
more but shorter under the HrpN
Ea
treatment condition
compared with control. This result suggested that the
HrpN
Ea
treatment impeded aphids in early feeding activ-
ities, both puncturing of the plant cell and navigating of
the phloem. Subsequently, however, the phloem phase
was always shorter, in HrpN
Ea
-treated plants than in con-
trol plants, no matter if the EPG patterns were analyzed
by hour or based on the four-hour record as a whole
(Table 1).
Based on the four-hour EPG record, the proportions of
times within the pathway phase and time to the first
phloem phase were much longer, suggesting the impedi-
ment to aphids in locating the ingestion site within the v as-
cular tissue, in HrpN
Ea
-treated plants compared with
control plants (Figure 1a; Table 1). On HrpN
Ea
-treated
plants, moreover, aphids took fewer actions to puncture
cells (Table 1, Number of cell puncturing) and to enter the
phloem phase (Table 1 , Number of phloem phase) after the
first entry of phloem phase. These results suggested that
phloem properties of HrpN
Ea
-treated plants were changed
as unfavourable to aphid feeding. In consistence with this
notion, total duration of the phloem phase was markedly
shorter in HrpN
Ea
-treated plants than in control plants
(Table 1). Noticeably, duration of the phloem phase in the
second hour of the EPG monitoring, being 30 in HrpN
Ea
-
treated plants and 14 min in control plants, on average,
strongly suggested the deterrent effect of the HrpN
Ea
treat-
ment on the phloem-feeding a ctivity of M. persicae.
In the phloem phase, E1 and E2 salivations were recog-
nized by dissecting the EPG waveform patters (Figure 1b).
Compounds of E1 and E2 saliva produced by aphids after
stylet entry of the phloem are believed to function in pre-
venting protein clogging inside the sieve element and pre-
venting phloem proteins from clogging inside the capillary
food canal, respectively [16]. Thus, E1 and E2 saliv ations
play an important role in ingestion of the phloem sap by
the insects [13,16]. As shown in Table 1, durations of both
Zhang et al. BMC Plant Biology 2011, 11:11
/>Page 3 of 19
E1 and E2 salivations were much shorter in HrpN
Ea
-trea-
ted plants than control plants, confirming the deterrent
effect of the HrpN
Ea
treatment on the phloem-feeding
activity of M. persicae.
To correlate repression in the phloem-feeding activity
with colonization of Arabidopsis by M. persicae,wemoni-
tored a large-scale population of the insect and surveyed a
24-hour fluct uation in leaf colonies. A total of 1,200 uni-
form individuals of apterous and agamic M. persicae
females were monitored in four repetitions of the experi-
ments for plants treated with EVP and HrpN
Ea
, respec-
tively. The number of aphids that stayed in their colonies
on leaves was counted and the number of aphids that run
away from the leaf colonies was calculated at intervals in
Table 1 Four-hour electrical penetration graph (EPG) analyses of the green peach aphid Myzus persicae feeding from
wild-type (WT) Arabidopsis plants
Activity examined Control group mean
(SD*)
HrpN
Ea
treatment group mean
(SD*)
Student’s t-test (n =
20)
Number of nonpuncturing phase total 13.5 (2.2) 16.0 (3.5) **
1st h 6.0 (1.0) 13 (2.5) p < 0.01
2nd h 0 0
3rd h 6.5 (0.8) 2 (0.5) p < 0.01
4th h 1.0 (0.3) 1.0 (0.3) **
Duration of nonpuncturing, min total 19.8 (5.2) 16.8 (4.6) **
1st h 4.9 (0.3) 15.0 (3.9) p < 0.01
2nd h 0 0
3rd h 11.1 (3.6) 1.3 (0.4) p < 0.01
4th h 3.8 (1.2) 0.5 (0.2) p < 0.01
Time to 1st cell puncturing, min 2.1 (0.6) 2.1 (0.3) **
Time to 1st pathway, min 3.3 (0.5) 3.0 (0.4) **
Number of pathway phase total 19.5 (2.0) 16.5 (1.5) **
1st h 5.2 (0.5) 11.5 (1.0) p < 0.01
2nd h 3.0 (0.3) 2.0 (0.1) **
3rd h 7.3 (1.0) 2.0 (0) p < 0.01
4th h 4.0 (0.5) 2.0 (0.2) p < 0.01
Duration of pathway phase, min total 175.7 (48.9) 205.0 (62.5) p < 0.01
1st h 55.1 (6.7) 45.0 (7.5) p < 0.01
2nd h 37.2 (3.5) 43.9 (7.2) p < 0.05
3rd h 47.4 (5.6) 56.6 (8.0) p < 0.01
4th h 36/0 (3.2) 59.5 (10.5) p < 0.01
Time to 1st phloem phase, min 85.6 (10.7) 104.3 (12.0) p < 0.01
Number of cell puncturing after 1st phloem
phase
20.5 (2.0) 11 (1.6) p < 0.01
Number of phloem phase total 7 (1.0) 3.0 (0.2) p < 0.01
1st h 0 0
2nd h 3.0 (0.5) 1.5 (0.5) p < 0.01
3rd h 1.0 (0) 1.5 (0.5) **
4th h 3.0 (0.5) 0 p < 0.01
Duration of phloem phase, min total 44.5 (8.5) 18.2 (3.6) p < 0.01
1st h 0 0
2nd h 22.8 (5.0) 16.1 (3.5) p < 0.01
3rd h 1.5 (0.5) 2.1 (0.6) p < 0.01
4th h 20.2 (3.5) 0 p < 0.01
Duration of phloem feeding, min total 44.5 (8.5) 18.2 (3.6) p < 0.01
E1 12.6 (2.8) 5.0 (1.4) p < 0.01
E2 31.9 (3.5) 13.2 (3.1) p < 0.01
*SD, standard deviation. **Insignificant difference at p < 0.05.
Zhang et al. BMC Plant Biology 2011, 11:11
/>Page 4 of 19
24 hours (Figure 2). At each time point, the number of
aphid individuals run away from their colonies on leaves of
HrpN
Ea
-treated plants was greater than the number of the
insect run away from colonies on leaves of control plants
(Student’s t-test, P < 0.01). Proportions of aphids escaped
from leaf colonies in control plants were close at the differ-
ent intervals, but much higher proportions of aphid
escapes from leaf colonies in HrpN
Ea
-treated plants were
observed in the short period of two to four hours. And this
period was critical to the effect of HrpN
Ea
treatment on
colonization of the plant, consistent with the effect on the
phloem-feeding activity (Figure 1a). In 24 hours, a total of
74.8% aphids on average run away from their colonies
on leaves of HrpN
Ea
-treated plants, in contrast to
totally 17.7% aphids escaped from leaf colonies in control
plants (Figure 2; Student’s t-test, P < 0.01). In subsequent
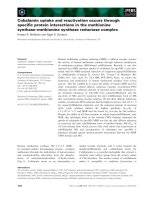
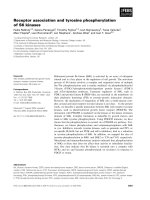
Figure 1 PG patterns and waveforms of the green peach aphid Myzus persicae on wild-type (WT) Arabidopsis. (a) Four-hour EPG record.
Plants were treated with the bacterial harpin protein HrpN
Ea
and specific control protein preparation EVP, respectively. Five days later, uniform
ten-day-old apterous aphid females were placed on upper sides of the top first expanded leaves. Feeding activities were detected immediately
with a four-channel Giga-4 direct current amplifier, which enabled simultaneous recording from four individual aphids. The EPG record
represents 20 aphids feeding on 20 plants treated differently and monitored in five repetitions of experiments. Reiteratively appeared EPG
waveforms are indicated once at proper spaces. PP, phloem phase; Path, pathway phase; np, no probing. (b) Two important waveforms in the
phloem phase dissected every five second using the EPG analysis software STYLET 2.5.
Zhang et al. BMC Plant Biology 2011, 11:11
/>Page 5 of 19
days, aphids that had run away from the original leaf colo-
nies were found in a drifting status, died, and appeared as
white carcases on other different parts of the plants. These
observations indicate that the HrpN
Ea
treatment impairs
the stability of Arabidopsis colonization by M. persicae.
Arabidopsis atpp2-a1/E/142 mutant pampers M. persicae
in phloem feeding
To gain information about relationships between pre-
viously identified 30 AtPP2 genes [ 23] and HrpN
Ea
-induced
repression in the phloem-feeding activity of M. persicae,we
studied expression of these genes in HrpN
Ea
-treated WT
Arabidopsis plants. Reverse transcriptase-polymerase chain
reaction (RT-PCR) was performed using the EF1a gene as
a reference [6,37] to detect the expression of 15 AtPP2-A
genes and 15 AtPP2-B genes [23]. As shown in Figure 3a,
transcript levels of the genes, except AtPP2-A1 and AtPP2-
A14,inHrpN
Ea
-treated plants were similar when tested at
the 24th hour posttreatment (hpt) as tested at 0 h pt
(immediately after the plant treatment). However, both
AtPP2-A1 and AtPP2-A14 were expressed at enhanced
extents in HrpN
Ea
-treated plants. Subseque nt real-time
RT-PCR analyses using the EF1a and Actin2 genes as
references [37,38] revealed a greater expression level o f
AtPP2-A1 than AtPP2-A14. Relatively, AtPP2-A1 and
AtPP2-A14 transcripts accumulated in 24 hours were 5
and 2 times more, respecti vely, in HrpN
Ea
-treated plants
than in control plants (Figure 3b).
To correlate the role of HrpN
Ea
in enhancing gene
expression with the role i n repressing phloem feeding o f M.
persicae, we inve stigated Arabidopsis mutants previously
generated by T-DNA insertion at AtPP2-A sequences. Two
AtPP2-A1 sequence-indexed lines were chosen for the test
because the AtPP2-A1 prot ein had been shown to a ffect
weight gain in M. persicae nymphs [24], and the other eight
AtPP2-A-modified mutants were considered f or comparison
because the AtPP2-A genes differed from AtPP2-A1 in
response to HrpN
Ea
(Figure 3a). T he ten m utants were con-
firmed for the presence of T-DNA insert according t o avail-
able information (Table 2); they were named conventionally
after lowercase gene symbols, suffixed with the insert loca-
tions, including gene DNA comp onents (P, promoter; E,
exon; I, intron) and nucleotide residue sites at the gene
DNA sequences. Muta nts were compared with WT in
expression of the c orresponding genes and aphid be haviors
on leaf colonies.
Parallel RT-PCR analyses of RNA samples isolated at 0
and 24 hpt revealed that the AtPP2-A genes performed
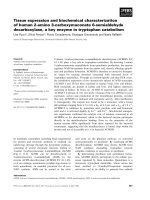
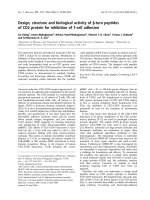
Figure 2 24-hour monitoring of M. persicae population in leaf colonies. (a) Appearance of aphid colonies on leaves. WT plants were treated
with HrpN
Ea
and EVP, respectively. Five days later, uniform aphids were placed on lower sides of the top two expanded leaves, 10 aphids/leaf;
leaves were photographed 24 hours later. The arrowhead points a nymph produced after leaf colonization. The numerical values, given as mean ±
standard deviation (SD), indicate the number of aphids that stayed on the leaf colony for 24 hours. A photo represents 120 leaf colonies on 60
plants. (b) Changes of aphid population in 24 hours. Leaf colonies on plants from (a) were surveyed, the number of aphids that stayed in a leaf
colony was scored, and percent decrease in the number of aphids that left the leaf colonies was calculated as mean ± standard deviation (SD) of
replicate results (n = 120 leaf colonies). The numerical values indicate total proportions (means ± SDs) of decreases in aphid populations within 1, 6
and 24 hpt (hour posttreatment).
Zhang et al. BMC Plant Biology 2011, 11:11
/>Page 6 of 19
differently in corresponding mutants compared with the
WT plant (Figure 3c). Both the basal expression (0 hpt)
and HrpN
Ea
-induced expression (24 hpt) of AtPP2-A1
was detected in the atpp2-a1/P/-210 mutant as in WT
but not in the atpp2-a1/E/142 mut ant (Figure 3c).
This result was confirmed by northern blot hybridization
(Figure 3d). And this result conformed to the PLACE
Web Signal Scan [39], wh ich revealed 37 types of cis-act-
ing regulatory DNA elements present in the predicted
344-bp promoter of AtPP2-A1. Eighteen elements exist as
a single copy and 19 elements have multiple copies,
located at distant 83 sites in the promoter sequence. How-
ever, none of the elements was disrupted by T-DNA inser-
tion and this might account for AtPP2-A1 expression in
atpp2-a1/P/-210. Similarly, none of 35 types of cis-acting
regulatory DNA elements scanned in the upstream -370
region of the AtPP2-A14 DNA sequence was disrupted in
atpp2-a14/P/-320. This mutant performed as WT in both
the basal expression and HrpN
Ea
-induced expression of
AtPP2-A14 (Figure 3c). The other eight mutants behaved
differently in expression of the corresponding AtPP2-A
genes. AtPP2-A3, -A11, -A13,and-A15 were not
expressed in their corresponding mutants atpp2-a3/I/
1650, -a11/E/177, -a13/E/1872, and -a15/E/312. In
contrast, atpp2-a10/P/-157, a11/P/-394, a12/P/-293, a14/
P/-320 performed as WT in the expression of the corre-
sponding AtPP2-A genes. In atpp2-a12/P/-293 and atpp2-
a12/P/-293, T-DNA insert did not disrupt any DNA
regulatory motifs present in AtPP2-A11 and AtPP2-A12
promoters. In atpp2-a10/P/-157, T-DNA insert disrupted
the p ollen-specific transcription activator element
AGAAA (#S000245) [40,41] located between -159 and
-155 in the AtPP2-A10 sequence. In atpp2-a11/P/-394, the
MYB recog nition site TGG TTT (#S000408) [42] located
between -398 and -393 in the AtPP2-A11 sequence was
disjoined by T-DNA insertion. However, both mutations
did not affect basal expression of the genes (Figure 3c). In
the ten mutants, therefore, only atpp2-a1/E/142 represents
an effective mutation allele, which may be responsibl e for a
transcriptional stop of AtPP2-A1 in the plant and result in
experimental compromises in both the basal expression
and HrpN
Ea
-induced expression of the gene.
The ten AtPP2-A-modified mutants were compared
with the WT plant in terms of colonization and feeding
by aphids. Based on monitoring of large-scale popula-
tions of apterous and agamic M. persicae females (1,200
aphids/treatment/plant genotype), the insect colonies on
leaves of atpp2-a1/E/142 were stable, show n as a smal-
ler rate of t he population decrea se in 24 hours, than
those on WT and t he other nine mut ants (Figure 4a;
ANOVA test, p < 0.01). In atpp2-a1/E/142, the deterrent
effect of HrpN
Ea
on colonization by the insect was little,
but the effect was evident in the other mutants as in
WT (Figure 4a). Based on the four-hour EPG record,
total durations of nonpuncturing and pathway phases
had little and insi gnificant differences between WT and
atpp2-a1/E/142 under the same condition, HrpN
Ea
treatment or con trol (Table 3). Then, the four- hour
EPG record of aphid f eeding from le aves was a nalyzed
to particularly calculate total duration of the phloem
phase (Figure 4b), which well reflected HrpN
Ea
-induced
repression in aphid feeding from the WT phloem (Table
1). Apparently, aphids preferred to feed from atpp2-a1/
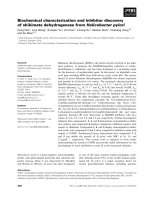
Figure 3 Analyses of AtPP2 gene expression. (a-d) Plants were
treated with HrpN
Ea
and sampled at 0 hpt (immediately after
treatment) and 24 hpt. Gene expression was determined by Reverse
transcriptase-polymerase chain reaction (RT-PCR) using EF1a as a
reference gene, by real-time RT-PCR using EF1a and ACTIN2 genes as
references, or by northern blot hybridization with specific probes. (a)
RT-PCR analyses of gene expression in WT plants. AtPP2-A1 through
AtPP2-A15 and AtPP2-B1 through AtPP2-B15 are abbreviated as A1
through A15 and B1 through B15, respectively. (b) Real-time RT-PCR
analysis of AtPP2-A1 and AtPP2-A14 expression in WT plants. Gene
transcript was quantified as mean ± SD (n = 4 repeats) relative to
reference genes and normalized to null-template controls. (c) RT-PCR
analyses to determine effects of the WT plant and AtPP2-A-modified
mutants on expression of selected AtPP2-A genes. The sequence-
indexed T-DNA insertion mutants are shown as ellipsis of prefixal
atpp2 (d) Northern blots hybridized with probes specific to AtPP2-A1
or EF1a. Both mutants are shown in abbreviated form.
Zhang et al. BMC Plant Biology 2011, 11:11
/>Page 7 of 19
E/142 (Figure 4c). In the mutant, total duration of the
phloem phase in 4 hours was much longer than that in
the other mutants and WT as well (Figure 4b; Table 3).
Both the second and fourth hour of the EPG record
indicated significant deterrent effect of the HrpN
Ea
treatment on aphid feeding from the WT phloem (Table
1), but the deterrent effect was lost in atpp2-a1/E/142
(Figure 4c; Table 3). Duration of the phloem phase in
the second-hour EPG was much shorter in WT plants
treated with HrpN
Ea
vs. EVP, but the duration was close
in atpp2-a1/E/142 in despite of treatments (Figure 4c;
Table 3). These results suggest that atpp2-a1/E/142
pampers M. persicae in phloem feeding an d that AtPP2-
A1 playsaroleinHrpN
Ea
-induced repression of the
phloem-feeding activity.
To gain information about the general function of
AtPP2-A1 in Arabidopsis resistance to M. persicae,we
compared atpp2-a1/E/142 with the other nine mutants
and with W T as well in the effects on multiplication of
the insect and subsequent nymph activities. The repro-
duction rate was scored as the ratio between total num-
bers of newborn nymphs and total numbers of aphid
adults that stayed on leaves in five days after colonization.
As shown in Figure 4d, reproduction rates were much
smaller under the condition of HrpN
Ea
treatment vs.
control (Student’ s t-test, p < 0.01) irrespective of the
plant genotypes, suggesting that HrpN
Ea
-induced repres-
sion of M. persicae multiplication [4] was not related to
the AtPP2-A1 gene. The gene, however, showed a repres-
sive effect on plant colonization by newborn nymphs.
Nymph colonies were more stable on atpp2-a1/E/142
with a smaller proportion o f the population decrease
than the other mutants or WT (Figure 4e; ANOVA test,
p <0.01).Inatpp2-a1/E/142, the deterrent effect of
HrpN
Ea
on colonization by nymphs was little, but the
effect was evident in the other mutants as in the WT
plant (Figure 4e). Evidently, AtPP2-A1 does not affect
aphid reproduction, but instead, the gene plays a role in
repressing plant colonization by nymphs as by adults.
AtPP2-A1-overexpression confers repressed phloem
feeding of M. persicae
The AtPP2-A1 gene was cloned into the binary vector
pBI121 under control by the cauliflower mosaic virus 35S
promoter (35S), creating pBI121::35S::AtPP2-A1 (Figure
5a). Transformation of WT Arabidopsis with the recombi-
nant unit generated PP2OETAt (AtPP2-A1-overexpression
transgenic A. thaliana) plants. Ten PP2OETAt lines
were selected and design ated as PP2OETAt1 through
PP2OETAt10 according to AtPP2-A1 expression levels
Table 2 Information on AtPP2-A-defected Arabidopsis mutants investigated in this study
Gene
name
Locus no. Mutant name T-DNA
insertion
site
Mutant seed
stock no.
a
TAIR
b
annotations
AtPP2-A1 AT4G19840 atpp2-a1/E/142 Exon, 142 CS837256 T-DNA insertion lines; a modified approach of thermal asymmetric
interlaced-PCR was used to amplify DNA fragments flanking the T-DNA
left border from the transformed lines; no phenotype information
available at this time.
AtPP2-A11 AT1G63090 atpp2-a1/P/-394 Promoter,
-394
CS842726
AtPP2-A1 AT4G19840 atpp2-a1/P/-210 Promoter,
-210
SALK_080914C Sequence-indexed T-DNA insertion lines; presence of the insertion was
analyzed by PCR; kanamycin resistance gene may be silenced; PCR- or
hybridization-based segregation analysis is required to confirm presence
and homozygosity of insertion; may be segregating for phenotypes that
are not linked to the insertion; may have additional insertions potentially
segregating; no phenotype information available at this time.
AtPP2-A10 AT1G10155 atpp2-a10/P/-157 Promoter,
-157
SALK_107807C
AtPP2-A3 AT2G26820 atpp2-a3/I/1650 Intron,
1650
SALK_005443C
AtPP2-A11 AT1G63090 atpp2-a11/E/117 Exon, 117 SALK_080546
AtPP2-A12 AT1G12710 atpp2-a12/P/-293 Promoter,
-293
SALK_015774
AtPP2-A13 AT3G61060 atpp2-a13/E/1872 Exon, 1872 SALK_046907
AtPP2-A14 AT5G52120 atpp2-a14/P/-320 Promoter,
-320
SALK_066553
AtPP2-A15 AT3G53000 atpp2-a1/E/312 Exon, 312 SALK_022649
a
Distribution seeds of atpp2-a1/P/-210, atpp2-a10/P/-157 and atpp2-a3/I/1650 are from confirmed lines and T2 or T3 generation for the other mutants.
b
TAIR, The Arabidopsis Information Resource databases.
Zhang et al. BMC Plant Biology 2011, 11:11
/>Page 8 of 19
(Figure 5b). Transformation of the WT plant with the
empty pBI121 vector, containing neither uidA nor AtPP2-
A1, generated the transgenic control plant, which behaved
as WT in all the tests (Figure 5b-5d). Also, WT, transgenic
control and PP2OETAt plants did not have evident differ-
ences in morphology. Homozygous T3 progenies of the
PP2OETAt lines were compared the WT and transge nic
control plants in AtPP2-A1 expression and in colonization
and feeding by apterous M. persicae females.
Real-time RT-PCR was conducted with RNA samples
from leaves and primers specific to AtPP2-A1. As shown
in Figure 5b, levels of the AtPP2-A1 transcript varied
with the different PP2OETAt lines, and levels of the
transcript were greater in all the PP2OETAt lines than
Figure 4 Comparison of Arabidopsis AtPP2-A-modified mutants and WT plant in colonization and phloem feeding by aphids.
(a) Changes of aphid population in 24 hours. Plants were treated with HrpN
Ea
and EVP, respectively. Five days later, uniform aphids were placed
on lower sides of the top two expanded leaves (10 aphids/leaf). The number of aphids that stayed in a leaf colony was scored at the 24th hour
after leaf colonization. Percent decrease (mean ± SD; n = 120 leaf colonies) in the number of aphids that run away from the leaf colonies was
calculated. (b) Total duration of the phloem phase in a four-hour EPG monitoring course. Plants treated as in (a) were colonized by aphids at
the fifth day after treatment; uniform aphids were placed on upper sides of the top first expanded leaves. Feeding activities were detected
immediately with a four-channel current amplifier system, and total duration of the phloem phase (mean ± SD; n = 20 aphids) was scored.
(c) The second-hour EPG record particularly indicating the phloem phase (PP) in WT and an AtPP2-A1-defected mutant. Experiments were the
same as in (b). The EPG record represents 20 aphids feeding from 20 plants of WT and the mutant, respectively. (d, e) Reproduction of aphid
adults and colonization behaviors of newborn nymphs. Experiments were similar as in (a) and insects were surveyed in five days after
colonization of leaves by adults. Reproduction rate was given as the ratio between total number of newborn nymphs and total number of
adults on leaf colonies. The population decrease was based on total number of nymphs and the number of nymphs that run away from the leaf
colony. Data represent mean ± SD (n = 120 leaf colonies).
Zhang et al. BMC Plant Biology 2011, 11:11
/>Page 9 of 19
the transgenic control plant. Compared with the trans-
genic control plant, PP2OETAt lines seemed more resis-
tant to colonization and feeding by aphids. Smaller
populations of aphids were able to stay for 24 hours o n
leaf colonies of PP2OETAt than the transgenic control
plant ( Figure 5c). Consistent ly, aphids preferred to feed
from the transgenic control plant rather than PP2OE-
TAt (Figure 5d). Total duration of the phlo em phase in
the four-hour EPG record was much short er in PP2OE-
TAt than in the control plant (Figure 5d).
Based on statistical analyses (ANOVA test, p < 0.01),
the ten PP2OETAt lines differed significantly from t he
transgenic control plant in levels of AtPP2-A1 expres-
sion (Figure 5b), the number of aphids that were able to
stay for 24 hours on leaf colonies (Figure 5c), and dura-
tions of the phloem phase (Figure 5d). In the ten
PP2OETAt lines, the number of aphids that were able
to stay for 24 hours on leaf colonies was increased
(Figure 5c), but durations of the phloem phase was
decreased (Figure 5d), with increases in levels of AtPP2-
A1 expression (Figure 5b). The PP2OETAt1 line showed
as the greatest expresser of AtPP2-A1 and the greatest
repressor of colonization and feeding by M. persicae.In
addition, a greater repression of phloem feeding by
aphids was observed in the presence than the absence of
HrpN
Ea
treatment (not shown), su ggesting that original
and introduced versions of the AtPP2-A1 gene might be
able coordinate their functio ns and might function
simultaneously, in PP2OXTA1.
AtPP2-A1 expression in different organs of PP2OETAt1 is
consistent with repression of phloem feeding by M.
persicae
PP2OETAt1 was further investigated in the genomic
integration of the introduced AtPP2-A1 gene, organ spe-
cifici ty of the gene expression, and the effect of M. per-
sicae feeding from the phloem. The Southern blot of
specifically ingested genomic DNA hybridized with the
AtPP2-A1-specific probe revealed that the introduced
AtPP2-A1 gene had been integrated into the genome
and existed as a double copy in PP2OETAt1 (Figure 6a).
Overexpression of the g ene was confirmed by northern
blot of leaf RNA samples hybridized with the probe spe-
cific to AtPP2-A1 (Figure 6b).
Real-time RT-PCR analyses revealed that AtPP2-A1
expression varied greatly in different organs of PP2OE-
TAt1. The expression of AtPP2-A1 was conspicuous in
leaves, stems, calyces, and petals but little transcript was
detected from flower stalks (Figure 6c). Amounts of the
AtPP2-A1 transcript were much greater in leaves, stems,
calyces, and petals of PP2OETAt1 than the transgenic
control plant. However, close amounts of the transcript
were detected from flower stalks of both plants. This
result suggested the overexpression of AtPP2-A1 in all
the organs except flower stalks of PP2OETAt1. Levels of
the gene overexpression were higher in l eaves, calyces,
and petals compared with stems (Figure 6c; ANOVA
test, p < 0.01).
The organ-differential levels of AtPP2-A1 overexpres-
sion were negatively correlated with the extents by
which apterous agamic M. persicae females fed from the
different o rgans. Based on total duration o f the phloem
phase in the four-hour EPG record (Figure 6d), aphids
preferred to feed from leaves, calyces, and petals, but
aphids were also able to feed from stems and flower
stalks. However, durations of the phloem phase were
much shorter when aphids were feeding from leaves,
stems, calyces, and petals of PP2OETAt1 compared with
the transgenic control plant (Student’s t-test, p < 0.01),
suggesting that the phloem-feeding activity was
repressed in the different organs of PP2OETAt1. Inver-
sely, the phloem phase of aphid feeding from the
PP2OETAt1 flower stalk lasted as longer as feeding
from the same organ of the transgenic contr ol plant
(Figure 6d), suggesting that aphids did not have a pre-
ference between both plants in feeding from flower
stalks.
Expression of AtPP2-A1 promoter-GUS is organ-unspecific
Because the introduced copies of AtPP2-A1 (Figure 6a)
are under direction by 35S (Figure 5a), the organ-differ-
ential expression in PP2OETAt1 (Figure 6c) does not
offer significant information about organ specificity of
the gene expression. Lack of the organ specificity was
Table 3 Four-hour EPG analysis of aphid feeding from WT Arabidopsis and the atpp2-a1/E/142 mutant
Activity examined WT group atpp2-a1/E/142 group
EVP treatment
mean (SD)
HrpN
Ea
treatment
mean (SD)
Student’s t-test
(n = 20)
EVP treatment
mean (SD)
HrpN
Ea
treatment (SD)
Student’s t-test
(n = 20)
Total duration of
nonpuncturing, min
21.1 (4.8) 18.9 (3.5) p > 0.05 31.4 (8.3) 28.5 (6.4) *
Duration of pathway
phase, min
175.0 (50.5) 201.5 (58.6) p < 0.05* 160.0 (42.0) 162.5 (45.5) *
Total duration of phloem
phase, min
43.9 (6.3) 19.6 (3.9) p < 0.005* 48.6 (9.2) 49.0 (11.5) *
*Insignificant difference at p < 0.05.
Zhang et al. BMC Plant Biology 2011, 11:11
/>Page 10 of 19
indicated by the transcript detected from different
organs of the transgenic control plant (Figure 6c). In an
experimental design to test whether the organ-unspecific
AtPP2-A1 expression was related with activity of the
AtPP2-A1 promoter, the promoter placed in front of
the uidA reporter gene (Figure 7a) was able to drive the
gene expression in the uidAETAt (uidA-expressing
transgenic A. thaliana) plant (Figure 7b). Six uidAETAt
lines were observed. They seemed to resemble each
other closely and were also similar to the transgenic
control plant (Figure 7b; uidAETAt1 as a representative
Figure 5 Genetic construction used in generation of PP2OETAt
(AtPP2-A1-overexpression transgenic Arabidopsis thaliana) and
comparison of PP2OETAt and control plants in AtPP2-A1
expression and aphid activities on leaves. (a) The construct. The
AtPP2-A1 (PP2) gene was inserted into the binary vector pBI121 at
the BamH I and Sac I restriction sites to replace uidA, a reporter
gene encoding b-D-glucuronidase. Nos P, promoter from the
nopaline synthase-encoding gene (Nos); NPT II, kanamycin resistance
gene; Nos T, Nos transcription terminator; 35S, the cauliflower
mosaic virus 35S promoter. (b-e) Experiments were done with 35-
day-old plants. Different letter labels in histograms indicate
significant differences (ANOVA test, p < 0.01). (b) Real-time RT-PCR
analysis of AtPP2-A1 expression in leaves. The gene transcript was
quantified as mean ± SD (n = 3 repeats) relative to reference genes
(EF1a and ACTIN2) and normalized to the null-template control. (c)
Changes of aphid population in 24 hours. Uniform aphids were
placed on lower sides of the top two expanded leaves (10 aphids/
leaf). Leaf colonies were surveyed, the number of aphids that stayed
in a leaf colony was scored, and percent decrease (mean ± SD; n =
120 leaf colonies) in the number of aphids that run away from the
leaf colonies was calculated. (d) Total duration of the phloem phase
in a four-hour EPG monitoring course. Uniform aphids were placed
on upper sides of the top first expanded leaves. Feeding activities
were detected immediately with a four-channel current amplifier
system, and total duration of the phloem phase (mean ± SD; n =
20 aphids) was scored.
Figure 6 Comparison of PP2OETAt1 and transgenic control
plants in organ-unspecific AtPP2-A1 expression and effects on
colonization and phloem feeding by aphids. (a, b) In the
experiments, PP2OETAt1 was compared with the transgenic control
plant (Control); 35-day-old plants grown in long day were
investigated. (a) Southern blot hybridized with the AtPP2-A1-specific
probe. Prior to blotting, the genomic DNA had been digested with
the restriction enzymes BamH I (B) and Sac I (S). (b) Northern blots
hybridized with probes specific to AtPP2-A1 and the reference gene
EF1a. (c) Real-time RT-PCR analysis of AtPP2-A1 expression in the
different organs of the plants. The gene transcript was quantified as
mean ± SD (n = 3 repeats) relative to reference genes and
normalized to null-template controls. (d) Total duration of the
phloem phase in a four-hour EPG monitoring course. Uniform
aphids were placed on the indicated organs. Feeding activities were
detected immediately with an EPG monitoring system, and total
duration of the phloem phase (mean ± SD; n = 20 aphids) was
scored.
Zhang et al. BMC Plant Biology 2011, 11:11
/>Page 11 of 19
line). In the uiDAETAt1 line, uidA was expressed mark-
edly in the stem, flower stalk, calyce, and petal, whereas,
stronger expression was found in the leaf (Figure 7c).
The uidA gene encodes b-glucuronidase (GUS) enzyme
[43]. GU S activity was detected in the root, stem, calyce,
and petal of PP2OETAt1 (Figure 7d). GUS activity was
not found in the flower stalk (Figure 7d), possibly due
to no uidA expression or little GUS beyond detectable
level. In addition, uidAETAt1 showed as tolerant as the
transgenic control plant to phloem feeding by M. persi-
cae (Table 4). This result indirectly suggests that AtPP2-
A1 plays a role, only when expressed itself, in repressing
the phloem-feeding activity.
Discussion
Although harpin proteins and their functions as proteinac-
eous elicitors in eliciting plant defense responses have
been found for decades [1-3], many aspects of the
mechanisms that underlie harpin-induced defenses remain
unclear. Important questions include, for example, how a
harpin protein as an exogenous signal is perceived by
plants and how the signal perception is connected to a
transducer to trigger a cellular pathway. Great attentions
have been paid to plant signal transduction in harpin-
induced resistance to pathogens [3,6,30,31,37,44] and
insect herbivores [2,4,8,34]. We have used HrpN
Ea
,the
first-characterized [1] and well-studied harpin [2-7], as a
model of proteinaceous elicitors to characterize induced
resistance against insect herbivores [2,4,8,34], particularly
the green peach aphid M. persicae, a generalist phloem-
feeding insect [10]. It has been shown that the HrpN
Ea
treatment and M. persicae infestation have some overlap-
ping effects on the induction of plant responses
[4,25,30-34], especially the PBD mechanism that is sug-
gested to involve the lectin-type phloem protein PP2
[23,24] as a component [14-16,25,26]. Although 30 mem-
bers of the PP2 multigene family have been identified i n
Arabidopsis [23] and AtPP2-modified Arabidopsis mutants
generated [27], little is known about biological effects,
especially on resistance to insects, of the genes and
mutants . The purpose of this
study is to elucidate the function of AtPP2-A1 in resis-
tance to M. persicae in Arabidopsis plants when treated
with HrpN
Ea
and under the condition of AtPP2-A1
overexpression.
We show that the treatment of Arabidopsis with HrpN
Ea
induces a repression in M. persicae feeding from the plant
phloem (Figure 1; Table 1) and colonization of plants by
the insect (Figure 2). Based on the EPG patterns, applying
HrpN
Ea
to WT Arabidopsis impedes aphids in stylet punc-
turing of the plant cell, en route to the vascular tissue
while looking for the phloem, and, especially, in the
phloem-feeding activity. So the HrpN
Ea
treatment is likely
to induce changes in cell wall properties unfavorable to
aphid feeding, but this notion remains to be examined.
HrpN
Ea
-induced deterrent effect on the phloem-feeding
activity has been found in the EPG data analyzed either
by hour or based on the four-hour record as a whole
(Table 1). The phloem-feeding activity could be reflected
Figure 7 Genetic constr uction used in generation of uidAETAt
(AtPP2-A1-promoter-uidA-expressing A. thaliana) and organ-
unspecific uidA expression in uidAETAt. (a) The construct. The
AtPP2-A1 promoter (PP2P) was inserted into the binary vector pBI121
at the Hind III and BamH I restriction sites to replace 35S while
reserve the reporter gene uidA encoding b-D-glucuronidase (GUS).
Labels are the same as in Figure 5a. (b) Appearance of 35-day-old
plants of the uidAETAt1 line compared with the transgenic control
plant. (c, d) RT-PCR analysis of uidA expression and GUS activity in
different organs of 35-day-old uidAETAt1 compared with the
transgenic control plant.
Zhang et al. BMC Plant Biology 2011, 11:11
/>Page 12 of 19
in the EPG by duration of the phloem phase composed of
E1 and E2 salivations (Figure 1), which are essential for
ingestion of the phloem sap [13,16,17,35]. Shortened dura-
tion of the phloem phase, in both E1 and E2 salivations
(Table 1), suggests that the insect’seffortiningestionof
the phloem sap is repressed under the HrpN
Ea
treatment
condition compared with control. It is also pertinent to
propose that the HrpN
Ea
treatment impacts the insect-
plant interaction. In terms of the insect, E1 and E2 saliva
are believed to prevent protein clogging inside the sieve
element and prevent phloem proteins from clogging inside
the capillary food canal [13,16] , respect ively. In the plant
side, phloem protein plugging of the sieve element pre-
sumably serves as a physical barrier to aphid feeding from
the phloem [26]. The lectin-type phloem protein PP2
[23,24] is supposed to play a role in plant response to the
feeding stress [21,25,26].
Molecular and genetic evidence supports a role of Ara-
bidopsis PP2 gene AtPP2-A1 in HrpN
Ea
-induced repres-
sion of M. persicae feeding f rom the plant p hloem. RT-
PCR analyses (Figure 3) suggest that AtPP2-A 1 is the
most HrpN
Ea
-responsive gene of 30 members of the PP2
multigene family [23]. PLACE Web Signal Scan [39] pro-
vides a clue to molecular basis of HrpN
Ea
response and
the AtPP2-A1 induction as well. For example, the gene
promoter contains three copies of the consensus GT-1
bindi ng box GA/GA/TAAA/T (#S000508) [45]. This ele-
ment is involved in the regulation of salicylic acid signal-
ing [45,46], which otherwise can be activated by HrpN
Ea
treatment in Arabidopsis [3]. Moreover, previous studies
have shown that HrpN
Ea
-induced resistance to M. persi-
cae is regulated by the ethylene signaling pathway [4],
which essentially involves perception of the ethylene sig-
nal by the receptor ETR1, the signal transduction to the
integral membrane protein EIN2 [4], and the regulation
of ethylene responsive factors (ERFs) [47,48]. The W-box
TGACC/T (#S000457) present in the AtPP2-A1 promo-
ter has been shown as required for wounding-induced
activation of the ERF3 gene [47]. The ERF3 protein is a
regulator of ethylene signaling [48], which otherwise is
activated to regulate induced resistance to M. persicae in
Arabidopsis plants responding to HrpN
Ea
treatment [4].
Thus, AtPP2-A1 is pertinently tho ught a part of the sig-
naling pathway that is required for HrpN
Ea
response, at
least during induction of the plant resistance to M.
persicae [4]. A role of AtPP2-A1 in the induced resistance
has been elucidated by evidence obtained from investi-
gating ten mutants (Table 2) in comparison with the WT
plant. The investigation demonstr ates that deterrent
effect of the HrpN
Ea
treatment on aphid feeding from the
phloem requires a functional AtPP2-A1 gene in the plant
(Figure 4). This notion is especially supported by the
absence of HrpN
Ea
-induced repression of the phloem-
feeding activity in the atpp2-a1/E/142 mutant (Figure 4;
Table3).Thisresultoffersanovelangletofurther
understanding on the PBD mechanism. Previously, this
defensive mechanism was known as a result of plant
responses to attacks by phloem-feeding insects
[14,15,20-22] and other stresses, such as wounding
[16,21,22,26]. Now, the PBD mechanism is known to
occur as a result of plant response to HrpN
Ea
,aprotei-
naceous elicitor of plant defenses [1-7,49]. This notion,
however, remains to be examined in regard to how
AtPP2-A1 contributes to PBD in response to the HrpN
Ea
treatment.
The function of AtPP2-A1 in conferring repression of
the phloem-feeding activity is further supported by evi-
dence obtained from investigating PP2OETAt (AtPP2-
A1-ove rexpression transgeni c A. thaliana)plants(Figure
5). Levels of AtPP2-A1 expression are significantly
greater in the 10 tested PP2OETAt lines than in the
trans genic control plant, conforming to the experimental
design for the gene overexpression. In the different
PP2OETAt lines, durations of the phloem phase are
decreased with increases in levels of AtPP2-A1 expres-
sion, suggesting that AtPP2-A1 overexpression confers a
repression in the phloem-feeding activity of M. persicae.
These observations al so identify the PP2OETAt1 line as
the greatest expresser of AtPP2-A1 an d the greatest
repressor of colonization and feeding by the insect. Remi-
niscently of cell-to-cell PP2 RNA movement in cucurbits
[50] and distant phloem transport flowering signals [51],
little amount of the AtPP2-A1 transcript in flower stalks
(Figure 6) may result from organ-to-organ trafficking to
fulfill the requirement for flower development. In the
other organs, however, AtPP2-A1 expression is consistent
with the repression of aphid feeding from the organs
(Figure 6). The organ-unspecifi c feature of AtPP2-A1
expression and function is also suggested indirectly by
investigating the transgenic plant uidAETAt1. In the
Table 4 Analysis of major activities of aphid feeding from uidAETAt (uidA-expressing transgenic Arabidopsis thaliana)
and transgenic control plants
Activity examined Control plant (SD) uidATEAt1 (SD) Student’s t-test (n = 20)
Total duration of nonpuncturing, min 23.5 (5.2) 21.9 (4.5) *
Duration of pathway phase, min 181.8 (56.0) 182.6 (61.6) *
Total duration of phloem phase, min 34.7 (5.5) 35.5 (5.6) *
*Insignificant difference at p < 0.05.
Zhang et al. BMC Plant Biology 2011, 11:11
/>Page 13 of 19
plant, uidA expression under direction of the AtPP2-A1
promoter is found in variou s organs (Figure 7), but these
organs do not have a repressive effect on aphid feeding
(Table 4). This result indirectly supported that AtPP2-A1
plays a role, only when expressed itself, in repression of
the phloem-feeding activity. Consistent to our observa-
tions on uidAETAt1, a previous study detected GUS
activity in different organs of transgenic plants that
expressed uidA under direction by the AtPP2-A promo-
ter [23]. In the present study, both uidA transcript and
GUS activity were detected in different organs of uidAE-
TAt1 (Figure 7). Due to our failure in obtaining trans-
genic plants that had been designed to express AtPP2-
A1-uidA under control by the AtPP2-A1 promoter, now
we can not provide more convening evidence for coinci-
dent organ localizat ion in AtPP2-A1 expression and
aphid feeding repression. However, repression of the
phloem-feeding activity seems a consistent attribute of
the different PP2OETAt lines (Figure 5) and a consistent
attribute of the different organs of PP2OETAt1 (Figure
6) as well, owing to AtPP2-A1 overexpression in both
cases. In the case of PP2OETAt1, whenever the level of
AtPP2-A1 expression is greater in an organ than in the
others, aphid feeing from the organ incurs a stronger
repression (Figure 6). These observations offer a convin-
cing support for the function of AtPP2-A1 in conferring
the plant resistance shown as a repression in phloem-
feeding activity of the insect. The results also indicate a
defensive significance of ubiquitous organ-unspecific
expression of PP2 genes in plants demonstrated pre-
viously [23] and observed in this study (Figure 7).
The contribution of lectin-type phloem proteins,
such as PP2, to the PBD mechanism is believed owing
to their functions as a physical barrier that preve nts
insectsfromphloemfeeding[26].Aprecedingeventis
the formation of the PP1-PP2 complex, which, how-
ever, has been demonstrated only in cucurbits,
whereas, other plant families do not have any PP1-like
protein [52]. The role of PP1-PP2 aggregation in the
clogging of sieve plates has been the matter of long
standing debates that have not yet been solved, and
still remains a hypothesis that is beyond elucidating
scopes of the present study. Lectin-type phloem pro-
teins take only a small proportion of phloem sap pro-
teins that have potential of defensive significance in
plants under attacks by phloem-feeding insects [21].
Thus, lectin-type phloem proteins are only one of dif-
ferent PBD components and are not likely to play an
entire role in plant resistance against attacks by the
insects [14-21]. Subtle differences in aphid population,
theinsectescapefromleafcolonies,forexample,
between HrpN
Ea
-treated plants and control plants (Fig-
ure 2), between atpp2-a1/E/142 and WT (Figure 4),
and between PP2OETAt and transgenic control plants
(Figure 5), also imply components alternative to
AtPP2-A1 in impacting aphid behaviors while coloniz-
ing the plants. Alternative defense components are
further indicated by HrpN
Ea
-induced impediments to
aphid feeding activities observed in the first-hour EPG
monitoring (Table 1). However, we do not have evi-
dence yet to show a proportion of AtPP2-A1’scontri-
bution to resistance against M. p ersicae in Arabidopsis
plants either when treated with HrpN
Ea
or under the
condition of At PP2-A1 overexpression.
Moreov er, AtPP2-A1 is a member of the PP2 multi-
gene family [23,27] and atpp2-a1/E/142 is one of AtPP2
mutation alleles in Arabidopsis [24]. The ot her AtPP2
genes and At PP2-modified mutants seem not involved
in HrpN
Ea
-induced repression of aphid feeding from the
phloem (Figure 4). This result suggests that different
members of the PP2 multigene family may have differ-
ent functions in the plant. So far, AtPP2-A1 is the only
phloem protein de monstrated as a lectin with the ability
to bind N-acetylglucosamine oligomers, and recombi-
nant AtPP2-A1 has been shown to affect weight gain in
M. persicae nymphs in an artificial diet [24]. The induc-
tion of AtPP2-A1 may be an indirect effect of the
HrpN
Ea
treatment, which is multifunctional, inducing
plant growth enhancement [4], resistance to pathogens
[3], insects [4] and drought stress [5], and resistance-
associat ed cell death [1,6]. These multiple effects have
been determined separately; and so whether they are
simultaneous is unclear. It is also unclear if other PP2
genes affect plant defenses rather than resistance. In
several species of angiosperms, including Arabidopsis,
different PP2 genes are expressed in various organs dur-
ing plant growth and development [23]. The ubiquitous
organ-unspecific PP2 expression suggests t hat different
PP2 genes may fulfill distinct functions at a special stage
of plant growth and development. It is possible that a
particular PP 2 gene may have different functions
depending on plant growth and development processes
or depending on an immediate requirement for encoun-
tering with distinct challenges, such as attacks by insects
and infection by pathogens. Studies to test this hypoth-
esis represent an interesting avenue for further research.
Conclusions
The HrpN
Ea
treatment has a deterrent effect on the
phloem-feeding activity of M. persicae and the deterrent
effect occurs in WT Arab idopsis rather tha n the atpp2-
a1/E/142 mutant. The phloem-feeding activity can be
also repressed as a result of AtPP2-A1 overexpression.
Both sets of evidence support the conclusion that
AtPP2-A1 plays a role in Arabidopsis resi stance to the
insect, particularly at the phloem-feeding stage. The
accompanied change of aphid population in leaf colonies
suggests that the function of AtPP2-A1 is related to
Zhang et al. BMC Plant Biology 2011, 11:11
/>Page 14 of 19
colonization of the plant and may have a broader
importance for the plant-insect interaction.
Methods
Plant growth and treatment
Arabidopsis genotypes used in this study included the
ecotype Col-0, transgenic plants created in this study,
and AtPP2-A sequence-indexed T-DNA insertion lines
generated previously (Table 2). Both types of modified
plants were created under the background of Col-0 and
characteri zed as homozygous at the transgene and
T-DNA insertion loci, respectively, before use in the
experiments. Plants were grown in 9-cm pots, 1 plant/
pot for the EPG monitoring and 5 plants/pot for other
experiments, under 22°C and 250 μE/m
2
/s illumination
[53]. A long day (16-h light/8-h dark) photoperiod was
applied to plants for transformation and AtPP2-A1
expression in di fferent organs, and short day (with 12-h
light/12-h dark) was used in other experiments. Plants
growninshortdaywereusedatdifferentstagesof
growth and development depending on experimental
purposes. Transgenic plants were used in different
experiments since the 35th day after planting. Thirty-
day-old plants of the WT and mutants were treated
with EVP and HrpN
Ea
, respectively. EVP and HrpN
Ea
were prepared [1,6] as 10 μg/ml aqueous solutions and
were applied in the presence of surfactant Silw et-77
(0.02%) by spraying plant tops with a low-pressure ato-
mizer. Treated plants were used at 5 dpt in monitoring
of aphid behaviors, and were used at 0 and 24 hpt in
determination of gene expression.
Aphid culture
AsingleisolateofM. persicae was collected from the
field-grown radish (Raphanus sativus L.) near Nanjing
in China. A clone of apterous agamic females was
obtained by acclimatization in WT Arabidopsis g rown
in the chamber (22°C; 250 μE/m
2
/s; short day). The col-
ony was maintained in nursery WT Arabidopsis seed-
lings and was transferred to fresh plants every two
weeks. Uniform ten-day-old aphids were used in this
study and were transferred to experimental plants with
a fine paintbrush.
Aphid feeding behavior
Aphid feeding activities were observed by the EPG tech-
nique using the Giga Amplifi er system (Laboratory of
Entomology, Wageningen Agricultural University, Wagen-
ingen, The Netherlands; />tems.htm). Uniform ten-day-old aphids were placed on
upper side of the top fi rst expanded leaves of plants. For
each genotype of the plant or each combination of a geno-
type and treatment (with EVP or HrpN
Ea
), 20 aphids
placed on 20 plants were monitored in five repetitions of
experiments. Immediat ely after aphids were placed on
leaves, a 20-mm diameter gold wire was attached to the
dorsal surface of e ach aphid’s abdomen using silver con-
ductive paint. The other end of the wire was connected to
a four-channel Giga-4 direct current amplifier with four
channels and 10
9
-Ω input resistance in an electrical circuit
that is also connected to the plant via an electrode placed
in the soil. The behavior of individual aphids was moni-
tored for 4 hours. Voltage waveforms were digitized at 100
Hz with an A/D converter USB device. Waveform patterns
were identified according to previously described cate-
gories [35]. Waveform recordings were dissected each 5
second with the EPG analysis software STYLET 2.5
installed in a computer connected to Giga-4 direct current
amplifier.
Plant colonization
Uniform ten-day-old aphids were placed on the lower
sides of the top two expanded leaves of plants; 10 aphids
per leaf. A total of 1,200 aphids were monitored in four
repetitions of the experiments for each single recombi-
nation of a treatment and a plant genotype. In each
experimental repetition, 300 aphids were placed on 30
leaves of 15 plants treated specifically. Aphid movement
from leaf colonies was monitored for five days, and the
number of aphids in a leaf colony was scored at inter-
vals in 24 hours. Aphid reproduction was surveyed
twice a day, and in each survey, newborn nymphs were
counted. Reproduction rate was quantifie d as the ratio
between total numbers of nymphs produced in five days
and total numbers of aphid adults that stayed in leaf
colonies during the same period. Nymphs produced in
five days were also monitored; the number of nymphs
that run away from leaf colonies was accounted.
Determination of gene expression in plants
Total RNA was isolated from leaves of EVP-treated
plants and HrpN
Ea
-treated WT plants, and was isolated
from leaves, stems, flower stalks, calyces, and petals of
transgenic plants. Gene expression was determined by
northern blot hybridization [31] and RT-PCR or real-
time RT-PCR [54] as described previously. Northern
blots of leaf RNA samples were hybridized to a digoxi-
genin-labeled AtPP2-A1 pr obe prepared using the DI G
Nucleic Acid Detec tion Kit [Roche Diagnostics (Shang-
hai) Trading Co., LTD]. An established quantitative
method [55] was adopted in real-time RT-PCR using
ACTIN2 and EF1a as reference genes [54,56]. Genes
were amplified <26 cycl es with a range of template con-
centration increases by 0.5 ng and from 0 to 3.0 ng in
25 μl reaction solutions to select desired doses. Reaction
treatments, RT-PCR protoc ols, product cloning and
sequencing verification were performed as described
[5,6]. The 25 μl reaction mixture was composed of 1 μl
Zhang et al. BMC Plant Biology 2011, 11:11
/>Page 15 of 19
first-strand cDNA diluted 1:10, 2.5 μMprimerand
1×SYBR Premix Ex Taq (TaKaRa Biotech. Co., Ltd,
Dalian, China). All reactions were performed in tripli-
cate with null-template controls in which cDNA was
absent. PCR cycling was: 95°C for 3 min, followed by 40
cycles of 30 sec at 95°C, 30 sec at 60°C and 30 sec at
72°C. Average expression levels of the genes were nor-
malized to the null-template controls . Average level of
the AtPP2-A1 transcrip t was quantified relative to EF1a
and ACTIN2. The expression of uidA in different organs
of the uidATE At plant was determined by R T-PCR
using the superscript II RNAse Hˉ Reverse Transcrip-
tase (Invitrogen Bio tech. Shanghai Trading Co., LTD).
Primers and related information are provided in Table 5.
Mutant screening
Information on sequence-indexed T-DNA insertion Arabi-
dopsis mutants tested in this study (Table 2) was from
The Arabidopsis Information Resource (TAIR, http://
www.arabidopsis.org) seed stock database. Mutant seeds
Table 5 Information on genes analyzed by reverse transcriptase-polymerase chain reaction in this study
Gene Locus no. Primers Product size (bp)
ACTIN2 AT3G18780 5’-CCCCTGAGGAGCACCCAGTTCTA-3’,
5’-CATACCCCTCGTAGATTGGCACAG-3’
219
AtPP2-A1 AT4G19840 5’-GCCTAACGGTAAGGAGAA-3’,
5’-TTACTGTTTGGGACGAAT-3’
205
AtPP2-A2 AT4G19850 5’-TCAATTACATGGGCAGAGTCTCAA-3’,
5’-TCTCCACCCACTTGTTCCTTTCTA-3’
401
AtPP2-A3 AT2G26820 5’-TGTGGTGGACGGAAGGTGCT-3’,
5’-CCTCCTGGCCTACTGTTGATGTAAAA-3’
716
AtPP2-A4 AT1G33920 5’-GATCTACGCAAGGGATCTTAGCATT-3’,
5’-CTCCAGCATTATCTGGTGATGTCACGAACT-3’
371
AtPP2-A5 AT1G65390 5’-GTAAAGTCAATCGTCAAGGCTGTTAA-3’,
5’-TTCTCCCAAGTATTCGGCAAGTC-3’
524
AtPP2-A6 AT5G45080 5’-ATGGCTTCTTCTTCCTCGGTTGTG-3’,
5’-GAGTTTGGTGCCTCGTTGATGGT-3’
797
AtPP2-A7 AT5G45090 5’-TAATGAATCCGCCGATGAAGC-3’,
5’-CAACACCTTTGACCACGAGCC-3’
638
AtPP2-A8 AT5G45070 5’-AATGCGATTCCCATCTTCTACAAAC-3’,
5’-CACTCATAACCACCTTCAGCGTCA-3’
565
AtPP2-A9 AT1G31200 5’-GTTCGCATCA
TAAGGCAGACTCCA-3’,
5’-TTCTTGAACAAAGGCTTCGTGGA-3’
521
AtPP2-A10 AT1G10150 5’-AATCCCTAACAGCTTGAAGCAGATC-3’,
5’-TGCAATAGCCTCAGTCCACCC-3’
694
AtPP2-A11 AT1G63090 5’-CGCTTCTTGGGCTGATTTCG-3’,
5’-GACTCCAGTTTCCTGCTTCGGTTA-3’
533
AtPP2-A12 AT1G12710 5’-TTGTCTTCTTCATCTTGTTTTGGGG-3’,
5’-CCGCTTCAACTGGTCTTTACACGAG-3’
837
AtPP2-A13 AT3G61060 5’-CAGATTGGTGGATTTACCTGAGAATT-3’,
5’-TTGTTGGTTGTCCGAAGTGGC-3’
598
AtPP2-A14 AT5G52120 5’-AGACAAACTTATTTACCGC-3’,
5’-AACTGCTTCTAACCACCAT-3’
244
AtPP2-A15 AT3G53000 5’-TTTCGTGGTGCGGCTTCTTC-3’,
5’-TGCGTGCAGTCAATCTGTTTCAT-3’
659
AtPP2-B1 AT2G02230 5’-CGAGTCCTCGGGACGCTTGT-3’,
5’-CCACGGACGCCTCATCCTAAA-3’
620
AtPP2-B2 AT2G02250 5’-CCGGTTCTTCGTCGATGGTG-3’,
5’-AAGCCGAGTAACGGGTTCCAG-3’
537
AtPP2-B3 AT2G02270 5’-TTTTGCTGCTTCGGTTTCG-3’,
5’-CCCATGAGATC
ACCATTCCCT-3’
792
AtPP2-B4 AT2G02280 5’-ATGAATACTCAAATCCTATC-3’,
5’-TTATGGGCTTTTCGTAGGGCGGATA-3’
435
AtPP2-B5 AT2G02300 5’-GTTCCTTGCTGCTTTGGTTTCG-3’,
5’-CCATCCACCCATCTTGCCTCT-3’
536
Zhang et al. BMC Plant Biology 2011, 11:11
/>Page 16 of 19
were provided as either homologous (atpp2-a1/P/-210,
atpp2-a10/P/-157, and atpp2-a3/I/1650) or heterozygous
(the other seven mutants) at the insertion loci (Table 2).
Homozygous progenies of heterozygous mutants were
obtained by a PCR-based screening protocol according to
information shown in Table 2. Provided mutant seeds
were used to grow progeny plant lines and new seeds were
harvested separately from five lines of each mutant. In the
next generation, five lines of a mutant were grown for use
to analyze the T-DNA insert and identify homozygous
plants. Genomic DNA was isolated separately from ten
plant individuals of each line and subjected to PCR ana-
lyses with Kan
r
-specific primers (Table 5). Seeds from the
line that had Kan
r
in all the ten plant individuals were
regarded as homozygous at the insertion locus.
Promoter analyses
Promoter sequences of the At PP2-A genes (Figure 3b)
were predicted wit h the AtcisDB program http://arabi-
dopsis.med.ohio-state.edu/. Presence and locations of
plant cis-acting regulatory DNA elements in the promo-
ter sequences were determined by analyses with the
PLA CE Web Signal Scan program htt p://www .dna.affrc.
go.jp/PLACE/signalup.html [39]. The cis-acting regula-
tory DNA elements were correlated with genes and pro-
cesses by browsing linked web information and
publications.
Generation and characterization of transgenic plants
The binary vector pBI121 (EMD Bioscience Inc., Gibbs-
town, NJ, USA), which contains the NPT II gene encoding
kanamycin resistance, 35S and uidA, was used to construct
transformation units. Full length cDNA of the AtPP2 gene
used in construction of pBI121::35S::AtPP2-A1 was
obtained by RT-PCR conducted with RNA isolate from
leaves of HrpN
Ea
-treated plants and AtPP2-A1-specific pri-
mers (5’ -
CGGGATCCATGAGCAAGAAACATTGCT-
CAG-3’ and 5’ -
CGAGCTCTTACTGTTTGGGACGA
ATTGCAACAC-3’; underline indicates protecti on bases;
italics indicate BamHIandSac Irestrictionbases).The
gene was inserted into the pBI121 vector at the BamHI
and Sac I restriction sites to replace uidA (Figure 5a). The
AtPP2-A1 promoter was obtained by PCR using the geno-
mic DNA from WT plant and the specific primers (5’-
CCCAAGCTTGATAATTTTTCAAGACCC-3’ and 5’-
CGGGATCCAAACCAGTATGATGTATT-3’;underline
indicates protection bases; italics indicate Hind III and
BamH I restriction bases). The promoter sequence was
inserted pBI121 at the Hind III and BamH I restriction
sites to replace 35S (Figure 7a), creating pBI121::PP2P::
uidA.
Recombinant vector was transferred into cells of Agro-
bacteri um tumefaciems strain EHA105. A suspension of
EHA105 cells containing the empty pBI121 vector (with-
out AtPP2-A1 and uidA inserts) or the re combinant
Table 5 Information on genes analyzed by reverse transcriptase-polymerase chain reaction in this study (Continued)
AtPP2-B6 AT2G02310 5’-TGGAATCTATCGGTGGAGGCG-3’,
5’-CAACTTGTATAGGCAAATCTCGTAAGC-3’
570
AtPP2-B7 AT2G02320 5’-AGCCGTTGTCTTTGGGTGATTT-3’,
5’-ACGTTTCGTATTGCGCTGAGTAG-3’
755
AtPP2-B8 AT2G02340 5’-TTCACAAGCCCTCAAGATGCG-3’,
5’-CACCACTCCAACTACAACTTCTACGG-3’
498
AtPP2-B9 AT2G02350 5’-TGCAACTGCGATGAATCTATCAAG-3’,
5’-CTGCTGGGCGTATTTACCCTCT-3’
448
AtPP2-B10 AT2G02360 5’-GCGTCGCTGCTACGGTTTCG-3’,
5’-GCTCAATCTCCATCCACCCATCTT-3’
579
AtPP2-B11 AT1G80110 5’-TGCGGCACCTGCTGGTCTTC-3’,
5’-CCCTTTGTCTCCTTGAGGCTCATCTC-3’
558
AtPP2-B12 AT5G24560 5’-GCGGCGGATTCCAATACCA-3’,
5’-AAGTTCAATCTCCAACCACCCATC-3’
525
AtPP2-B13 AT1G56240 5’-CCAACATCCTTGCCTTCACATC-3’,
5’-TCTCCAACCACCCGTCGTCT-3’
690
AtPP2-B14 AT1G56250 5’-ATAGCCAACATCCTTGCCTTCA-3’,
5’-TCAATCTCCATCCATCCGTCAT-3’
698
AtPP2-B15 AT1G09155 5’-ATCTCGTCGGCG
GCTGTCTC-3’,
5’-CTATCTCCATCCACCCATCGTCTC-3’
649
EF1a AT1G07930 5’-CCCCTTCGTCTCCCACTTCAGGATGTCTA-3’,
5’-GTTGTCACCTGGAAGTGCCTCAAGAAG-3’
189
Kan
r
HM047294 5’-GGCTATGACTGGGCACAACAGACAA-3’,
5’-GCGGCGATACCGTAAAGCACGAGGA-3’
683
uidA U00096 5’-GGGGTGGCAGTGAAGGGCGAACAGT-3’,
5’-TGGGAGAACATTAGGTAGACGCAGGTGA-3’
533
Zhang et al. BMC Plant Biology 2011, 11:11
/>Page 17 of 19
vector were used to transform WT Arab idopsis by blos-
som infiltration. Transformation with pBI121::GUS::
AtPP2-A1 and pBI121::PP2P::uidA generated PP2OETAt
and uidAETAt plants, respectively. Both types of trans-
genic plants were screened, multiplied and characterized
by a previously described pr ot ocol [31]. The phenotype
of kanamycin resistance was used in screening of
PP2OETAt candidates and the transgenic c ontrol plant
cand idates, respectively; the phenotype of both kanamy-
cin resistance and GUS activity was used in screening of
uidAETAt candidates. GUS activity was determined
using the histochemical techniques described previously
[57]. Screened transgenic plants were allowed to self-
pollinate and selected to the T3 generation [58]. T3
homozygous progenies were used in this study. The
genomic integration of the transgene in PP2OETAt was
detected by Southern blot analysis [54]. For Southern
blots, Arabidopsis genomic DNA was digested with
BamHIandSac I, and transferred to a nylon mem-
brane, followed by hybridization to a digoxigenin-labeled
AtPP2-A1 probe prepared using the DIG Nucleic Acid
Detection Kit [Roche Dia gnostics (Shanghai) Trading
Co., LTD].
Data treatment
Experiments were done three or four times with similar
results. The student’s t-test was used to compare data
obtained from HrpN
Ea
-treated plants with those
obtained from EVP-treated plants, and to compare data
obtained from the transgenic control plant with those
obtained from each line of PP2OETAt. Quantitative
data were also analyzed by the ANOVA test to compare
differences among the transgenic control plant and dif-
ferent lines of PP2OETAt, and among different organs
of transgenic plants.
Acknowledgements
We thank the two anonymous reviewers for comments on the manuscript
and scrutiny on characters of the mutants, our colleagues Miss Qiuxia Wang
and Dr. Shuwen Wu for assistance in the EPG technique and insect nursery
maintenance, and all the students in the lab for assistance in insect survey.
This study was supported by grants from China National Novel Transgeni c
Organisms Breeding Project (2009ZX08002-004B and 2008ZX0800 2-001) and
National Science Foundation of China (30771441).
Author details
1
Key Laboratory of Monitoring and Management of Crop Pathogens and
Insect Pests, Ministry of Agriculture of R. P. China, Nanjing Agricultural
University, Nanjing, 210095, PR China.
2
Institute of Utilization of Nuclear
Techniques, Zhejiang Academy of Agricultural Sciences, Hangzhou, 310021,
PR China.
Authors’ contributions
CZ, XW and SZ carried out EPG studies, investigated insect population, and
performed the statistical analysis. CZ and LC also participated in the design
of the study and drafted the manuscript. HS and BL did bioinformatics
analyses and determined gene expression. HS also investigated aphid
nymphs. XW, LY and RL generated and characterized transgenic plants. BL,
JQ, WS and ZY participated in the insect monitoring experiments. HD
conceived of the study, and participated in its design and coordination and
helped to draft the manuscript. All authors read and approved the final
manuscript.
Received: 20 August 2010 Accepted: 13 January 2011
Published: 13 January 2011
References
1. Wei ZM, Laby RJ, Zumoff CH, Bauer DW, He SY, Collmer A, Beer SV: Harpin,
elicitor of the hypersensitive response produced by the plant pathogen
Erwinia amylovora. Science 1992, 257:85-88.
2. Kim JF, Beer SV: hrp genes and harpins of Erwinia amylovora: a decade of
discovery. In Fire blight and its causative agent, Erwinia amylovora. Edited
by: Vanneste JL. C.A.B. International, Wallingford, U.K; 2000:141-162.
3. Dong H, Delaney TP, Bauer DW, Beer SV: Harpin induces disease resistance
in Arabidopsis through the systemic acquired resistance pathway
mediated by salicylic acid and the NIM1 gene. Plant J 1999, 20:207-215.
4. Dong HP, Peng J, Bao Z, Meng X, Bonasera JM, Chen G, Beer SV, Dong H:
Downstream divergence of the ethylene signaling pathway for harpin-
stimulated Arabidopsis growth and insect defense. Plant Physiol 2004,
136:3628-3638.
5. Dong HP, Yu H, Bao Z, Guo X, Peng J, Yao Z, Chen G, Dong H: The ABI2-
dependent abscisic acid signalling controls HrpN-induced drought
tolerance in Arabidopsis. Planta 2005, 221:313-327.
6. Peng J, Dong H, Dong HP, Delaney TP, Bonasera BM, Beer SV: Harpin-
elicited hypersensitive cell death and pathogen resistance requires the
NDR1 and EDS1 genes. Physiol Mol Plant Pathol 2003, 62:317-326.
7. Ren X, Liu F, Bao Z, Zhang C, Wu X, Chen L, Liu R, Dong H: Root growth of
Arabidopsis thaliana is regulated by ethylene and abscisic acid signaling
interaction in response to HrpN
Ea
, a bacterial protein of harpin group.
Plant Mol Biol Rep 2008, 26:225-240.
8. Zitter TA, Beer SV: Harpin for insect control. Phytopathology 1998, 88:
S104-S105.
9. Gou Z, Zhang S, Dong H: Effects of HrpN
Ea
on inducing aphid repellency
on Cucumis melo. Acta Agric Boreali-Sinica 2009, 24:188-192.
10. Pollard DG: Plant penetration by feeding aphids (Hemiptera,
Aphidoidea): A review. Bul Entomol Res 1972, 62:631-714.
11. Douglas AE: Phloem-sap feeding by animals: problems and solutions. J
Exp Bot 2006, 57:747-754.
12. Kempema LA, Cui X, Holzer FM, Walling LL: Arabidopsis transcriptome
changes in response to phloem-feeding silver leaf whitefly nymphs.
Similarities and distinctions in responses to aphids. Plant Physiol 2007,
143:849-865.
13. Mutti NS, Louis J, Pappan LK, Pappan K, Begum K, Chen M, Park Y,
Dittmer N, Marshall J, Reese JC, Reeck GR: A protein from the salivary
glands of the pea aphid, Acyrthosiphon pisum, is essential in feeding on
a host plant. Proc Nat Acad Sci USA 2008, 105:9965-9969.
14. De Vos M, Jander G: Myzus persicae (green peach aphid) salivary
components induce defence responses in Arabidopsis thaliana. Plant Cell
Environ 2009, 32:1548-1560.
15. Will T, van Bel AJ: Induction as well as suppression: How aphid saliva
may exert opposite effects on plant defense. Plant Signal Behav 2008,
3:427-430.
16. Tjallingii WF: Salivary secretions by aphids interacting with proteins of
phloem wound responses. J Exp Bot 2006, 57:739-745.
17. Klingler J, Creasy R, Gao L, Nair RM, Calix AS, Jacob HS, Edwards OR, Singh KB:
Aphid resistance in Medicago trunculata involves antixenosis and
phloem-specific, inducible antibiosis, and maps to a single locus flanked
by NBS-LRR resistance gene analogs. Plant Physiol 2005, 137:1445-1455.
18. Pegadaraju V, Louis J, Singh V, Reese JC, Bautor J, Feys BJ, Cook G,
Parker JE, Shah J: Phloem-based resistance to green peach aphid is
controlled by Arabidopsis PHYTOALEXIN DEFICIENT4 without its signaling
partner ENHANCED DISEASE SUSCEPTIBILITY1. Plant J 2007, 52:332-341.
19. Louis J, Leung Q, Pegadaraju V, Reese J, Shah J: PAD4-dependent
antibiosis contributes to the ssi2-conferred hyper-resistance to the green
peach aphid. Mol Plant-Microbe Interact 2010, 23:618-627.
20. Stone BA, Clarke AE: Chemistry and physiology of higher plant 1,3-
β-
glucans
(callose). In Chemistry and biology of 1,3-b-glucans. Edited by:
Stone BA, Clarke AE. Bundoora Australia: La Trobe University Press;
1992:365-429.
Zhang et al. BMC Plant Biology 2011, 11:11
/>Page 18 of 19
21. Kehr J: Phloem sap proteins: their identities and potential roles in the
interaction between plants and phloem-feeding insects. J Exp Bot 2006,
57:767-774.
22. Willats WGT, Knox JP: Molecules in context: probes for cell wall analysis.
In The Plant Cell Wall. Edited by: Rose JKC. Oxford UK: CRC Press;
2003:92-110.
23. Dinant S, Clark AM, Zhu Y, Vilaine F, Palauqui JC, Kusiak C, Thompson GA:
Diversity of the superfamily of phloem lectins (phloem protein 2) in
angiosperms. Plant Physiol 2003, 131:114-128.
24. Beneteau J, Renard D, Marche L, Douville E, Lavenant L, Rahbe Y, Dupont D,
Vilaine F, Dinant S: Binding properties of the N-acetylglucosamine and
high-mannose N-glycan PP2-A1 phloem lectin in Arabidopsis. Plant
Physiol 2010, 153:1345-1361.
25. Read SM, Northcote DH: Subunit structure and interactions of the
phloem proteins of Cucurbita maxima (pumpkin). Eur J Biochem 1983,
134:561-569.
26. Will T, van Bel AJE: Physical and chemical interactions between aphids
and plants. J Exp Bot 2006, 57:729-737.
27. Alonso JM, Stepanova AN, Leisse TJ, Kim CJ, Chen H, Shinn P,
Stevenson DK, Zimmerman J, Barajas P, Cheuk R, et al: Genome-wide
insertional mutagenesis of Arabidopsis thaliana. Science 2003,
301:653-657.
28. McElver J, Tzafrir I, Aux G, Rogers R, Ashby C, Smith K, Thomas C,
Schetter A, Zhou Q, Cushman MA, et al: Insertional mutagenesis of genes
required for seed development in Arabidopsis thaliana. Genetics 2001,
159:1751-1763.
29. Divol F, Vilaine F, Thibivilliers S, Kusiak C, Helene Sauge M, Dinant S:
Involvement of the xyloglucan endotransglycosylase/hydrolases
encoded by celery XTH1 and Arabidopsis XTH33 in the phloem
response to aphids. Plant Cell and Environ 2007, 30:187-201.
30. Liu F, Liu H, Jia Q, Wu X, Guo X, Zhang S, Song F, Dong H: The internal
glycine-rich motif and cysteine suppress several effects of the HpaG
Xooc
protein in plants. Phytopathology 2006, 96:1052-1059.
31. Peng J, Bao Z, Dong H, Ren H, Wang J: Expression of harpin
Xoo
in
transgenic tobacco induces pathogen defense in the absence of
hypersensitive cell death. Phytopathology 2004, 94:1048-1055.
32. De Vos M, Van Oosten VR, Van Poecke RMP, Van Pelt JA, Pozo MJ,
Mueller MJ, Buchala AJ, Métraux JP, Van L oon LC, Dicke M, Pieterse CMJ:
Signal signature and transcriptome changes of Arabidopsis during
pathogen and insect attack. Mol Plan t-Microbe Interact 2005,
18:923-927.
33. Thompson GA, Goggin FL: Transcriptomics and functional genomics of
plant defence induction by phloem-feeding insects. J Exp Bot 2006,
57:755-766.
34. Liu R, Lü B, Wang X, Zhang C, Zhang S, Qian J, Chen L, Shi H, Dong H:
Thirty-seven transcription factor genes differentially respond to a harpin
protein and affect resistance to the green peach aphid in Arabidopsis. J
Biosci 2010, 35:435-450.
35. Tjallingii WF, Esch TH: Fine-structure of aphid stylet routes in plant tissues
in correlation with EPG signals. Physiol Entomol 1993, 18:317-328.
36. Tjallingii WF: Electrical recording of stylet penetration activities. In Aphids:
Their Biology, Natural Enemies and Control. Volume 2B. Edited by: Minks AK,
Harrewijn P. Elsevier Amsterdam; 1987:95-108.
37. Chen L, Qian J, Qu S, Long J, Yin Q, Zhang L, Wu X, Sun F, Wu T, Hayes M,
Beer SV, Dong H: Identification of specific fragments of HpaG
Xooc
, a harpin
from Xanthomonas oryzae pv. oryzicola, that induce disease resistance
and enhance growth in plants. Phytopathology 2008, 98:781-791.
38. Sun L, Ren H, Liu R, Li B, Wu T, Sun F, Liu H, Wang X, Dong H: An h-type
thioredoxin functions in tobacco defense responses to two species of
viruses and an abiotic oxidative stress. Mol Plant-Microbe Interact 2010,
23:1470-1485.
39. Higo K, Ugawa Y, Iwamoto M, Korenaga T: Plant cis-acting regulatory DNA
elements (PLACE) database: 1999. Nucleic Acids Res 1999, 27:297-300.
40. Bate N, Twell D: Functional architecture of a late pollen promoter:
pollen-specific transcription is developmentally regulated by multiple
stage-specific and co-dependent activator elements. Plant Mol Biol 1998,
37:859-869.
41. Filichkin SA, Leonard JM, Monteros A, Liu PP, Nonogaki H: A novel endo-β-
mannanase gene in tomato LeMAN5 is associated with anther and
pollen development. Plant Physiol 2004, 134:1080-1087.
42. Abe H, Urao T, Ito T, Seki M, Shinozaki K, Yamaguchi-Shinozaki K: Arabidopsis
AtMYC2 (bHLH) and AtMYB2 (MYB) function as transcriptional activators
in abscisic acid signaling. Plant Cell 2003, 15:63-78.
43. Jefferson RA, Burgess SM, Hirsh D: β-Glucuronidase from Escherichia coli as
a gene-fusion marker. Proc Natl Acad Sci USA 1986, 83:8447-8451.
44. Miao WG, Wang XB, Li M, Song CF, Wang Y, Hu DW, Wang JS: Genetic
transformation of cotton with a harpin-encoding gene hpa
Xoo
confers an
enhanced defense response against different pathogens through a
priming mechanism. BMC Plant Biol 2010, 10:67.
45. Buchel AS, Brederode FT, Bol JF, Linthorst HJM: Mutation of GT-1 binding
sites in the Pr-1A promoter influences the level of inducible gene
expression in vivo Plant Mol Biol 1999, 40:387-396.
46. Yu D, Chen C, Chen Z: Evidence for an important role of WRKY DNA
binding proteins in the regulation of NPR1 gene expression. Plant Cell
2001, 13:1527-1540.
47. Nishiuchi T, Shinshi H, Suzuki K: Rapid and transient activation of transcription
of the ERF3 gene by wounding in tobacco leaves: Possible involvement of
NtWRKYs and autorepression. JBiolChem2004, 279:55355-55361.
48. Fujimoto SY, Ohta M, Usui A, Shinshi H, Ohme-Takagi M: Arabidopsis
ethylene-responsive element binding factors act as transcriptional
activators or repressors of GCC box-mediated gene expression. Plant Cell
2000, 12:393-404.
49. Zhang C, Bao Z, Liang Y, Yang X, Wu X, Hong X, Dong H: Abscisic acid
mediates Arabidopsis drought tolerance induced by HrpN
Ea
in the
absence of ethylene signaling. Plant Mol Biol Rep 2007, 25:98-114.
50. Balachandran S, Xiang Y, Schobert C, Thompson GA, Lucas WJ: Phloem sap
proteins from Cucurbita maxima and Ricinus communis have the
capacity to traffic cell to cell through plasmodesmata. Proc Natl Acad Sci
USA 1997, 94:14150-14155.
51. Giakountis A, Coupland G: Phloem transport of flowering signals. Curr
Opin Plant Biol 2008, 11:687-694.
52. Clark AM, Jacobsen KR, Bostwick DE, Dannenhoffer JM, Skaggs MI,
Thompson GA: Molecular characterization of a phloem-specific gene
encoding the filament protein, phloem protein 1 (PP1), from Cucurbita
maxima. Plant J 1997, 12:49-61.
53. Zhang S, Yang X, Sun M, Sun F, Deng S, Dong H: Riboflavin-induced
priming for pathogen defense in Arabidopsis thaliana. J Integr Plant Biol
2009, 51:167-174.
54. Wu T, Guo A, Zhao Y, Wang X, Wang Y, Zhao D, Li X, Ren H, Dong H:
Ectopic expression of the rice lumazine synthase gene contributes to
defense responses in transgenic tobacco. Phytopathology 2010,
100:573-581.
55. Livak KJ, Schmittgen TD: Analysis of relative gene expression data using
real-time quantitative PCR and the 2
-ΔΔCT
method. Methods 2001,
25:402-408.
56. Volkov RA, Panchuk II, Schöffl F: Heat-stress-dependency and
developmental modulation of gene expression: the potential of house-
keeping genes as internal standards in mRNA expression profiling using
real-time RT-PCR. J Exp Bot 2003, 54:2343-2349.
57. Jefferson RA, Kavanagh TA, Bevan MW: GUS fusions: β-glucuronidase as a
sensitive and versatile gene fusion marker in higher plants. EMBO J 1987,
6:3901-3907.
58. Weigle D, Glazebrook J: Arabidopsis: a Laboratory Manual. Cold Spring
New York: Cold Harbor Laboratory Press; 2002.
doi:10.1186/1471-2229-11-11
Cite this article as: Zhang et al.: Harpin-induced expression and
transgenic overexpression of the phloem protein gene AtPP2-A1 in
Arabidopsis repress phloem feeding of the green peach aphid Myzus
persicae. BMC Plant Biology 2011 11:11.
Zhang et al. BMC Plant Biology 2011, 11:11
/>Page 19 of 19