báo cáo khoa học: " In silico comparative analysis of SSR markers in plants" pptx
Bạn đang xem bản rút gọn của tài liệu. Xem và tải ngay bản đầy đủ của tài liệu tại đây (2.01 MB, 15 trang )
RESEARCH ARTIC LE Open Access
In silico comparative analysis of SSR
markers in plants
Filipe C Victoria
1,2
, Luciano C da Maia
1
, Antonio Costa de Oliveira
1*
Abstract
Background: The adverse environmental conditions impose extreme limitation to growth and plant development,
restricting the genetic potential and reflecting on plant yield losses. The progress obtained by classic plant
breeding methods aiming at increasing abiotic stress tolerances have not been enough to cope with increasing
food demands. New target gene s need to be identified to reach this goal, which requires extensive studies of the
related biological mechanisms. Comparative analyses in ancestral plant groups can help to elucidate yet unclear
biological processes.
Results: In this study, we surveyed the occurrence patterns of expressed sequence tag-derived microsatellite
markers for model plants. A total of 13,133 SSR markers were discovered using the SSRLocator software in non-
redundant EST databases made for all eleven species chosen for this study. The dimer motifs are more frequent in
lower plant species, such as green algae and mosses, and the trimer motifs are more frequent for the majority of
higher plant groups, such as monocots and dicots. With this in silico study we confirm several microsatellite plant
survey results made with available bioinformatics tools.
Conclusions: The comparative studies of EST-SSR markers among all plant lineages is well suited for plant
evolution studies as well as for future studies of transferability of molecular markers.
Background
In agriculture, productiv ity is affected by enviro nmental
conditions such as drought, salinity, hi gh radiation and
extreme temperatures faced by plants during their life
cycle, that impose severe limitations to the growth and
propagation, restricting their genet ic potential and, ulti-
mately, reflecting yield losses of agricultural crops.
Although, advances have been achieved through classical
breeding, further progress is needed to increase abiotic
stress tolerance in cultivated plants. New gene targets
need to be identified in order to reach these goals,
requiring extensive studies concerning the biological
processes related to abiotic stresses. Comparative analy-
sis between primitive and related groups of cultivated
species may shed some light on the understanding of
these processes.
Microsatellites or SSRs (Simple Sequence Repeats) are
sequences in which one or few bases are tandemly
repeated, ranging from 1-6 base pair (bp) long units.
They are ubiquitous in prokaryotes and eukaryotes,
present even in the smallest bacterial genomes [1-3].
Variations in SSR regions originate mostly from errors
during the replication process, frequently DNA
Polymerase slippage. These errors generate base pair
insertions or deletions, resulting, respectively, in larger
or smaller regions [4]. SSR assessments in the human
genome have shown that many diseases are caused b y
mutation in these sequences [5]. The genomic abun-
dance of microsatellites, and their ability to associate
with many phenotypes, make this class of molecular
markers a powerful tool for diverse application in plant
genetics. The identification of microsatellite markers
derived from EST (or cDNAs), and described as func-
tional markers, represents an even more useful possibi-
lity for these markers when compared to those based on
assessing anonymous regions [6-8]. EST-SSRs offer
some advantages over other genomic DNA-based mar-
kers, such as detecting the variation in the expressed
portion of the genome, giving a ‘’perfect’’mark er-trait
association; they can be developed from EST databases
* Correspondence:
1
Plant Genomics and Breeding Center, Faculdade de Agronomia Eliseu
Maciel, Universidade Federal de Pelotas, RS, Brasil
Full list of author information is available at the end of the article
Victoria et al. BMC Plant Biology 2011, 11:15
/>© 2011 Victoria et al; licensee BioMed Central Ltd. This is an Open Access article distributed under the terms of the Creative Commons
Attribution License ( which pe rmits unrestricted use, distribution, and reproduction in
any medium, provided the original work is properly cited.
at no cost and unlike genomic SSRs, they may be used
across a number of related species [9].
Many studies indicate UTRs as being more abundant
in microsatellites than CDS regions [10]. In a study of
micro- and minisatellite distribution in UTR and CDS
regions using the Unige ne database for s everal higher
plants groups, higher occurrence of these elements in
coding regions were found for all the studied species
[11]. Disagreements between earlier reports and the
later, reflect a deficiency in annotation when translated
and non-translated fractions are separated in the
Unigene transcript database. Dimer repe ats were also
frequent in CDS regi ons, which could be due to the fact
that the Unigene database contains predominantly EST
clusters. Therefore, there is a tendency for under-
representing the UTR regions in the annotated
sequences [11].
The characterization of tandem repeats and their
variation within and between different plant families,
could facilitate their use as genetic markers and conse-
quently allow plant-breeding strategies that focus on the
transfer of marker s from model to or phan species to be
applied. EST-SSR also have a higher probability of being
in linkage disequilibr ium with genes/QTLs controlling
economic traits, making them more useful in studies
involving marker-trait association, QTL mapping and
genetic diversity analysis [9].
On model organisms, microsatellites have been
reported to correspond to 0.85% of Arabidopsis thaliana
(L.) Heynh, 0.37% of maize (Zea mays L.), 3.21% of tiger
puffer (Takifugu rubripes Temminck & Schleg el), 0.21%
of the nematode Caenorhabditis elegans Maupas and
0.30% of yeast (Saccharomyces cerevisiae Meyer ex.
E.C. Hansen) geno mes [10]. Moreo ver, they constitute
3.00% of the human genome [12]. All kinds of repeated
element motifs, excluding trimers and hexamers, are sig-
nificantly less frequent in the coding sequences when
compared to intergenic DNA streches of A. thaliana,
Z. mays, Oryza sativa subsp japonica S. Kato (rice),
Glycine max (L.) Merr. (soybean) and Triticum aestivum
L. (wheat) [10].
Close to 48.67% of repeat elements found in many
species are formed by dimer motifs. In Picea abies
(L.) H. Karst. (Norway spruce), for example, the dimer
occurrence is 20 times more frequent in clones originat-
ing from intergenic regions vs. transcript regions [13].
Approximately 14% of protein translated sequences
(CDS - coding sequences) contain repetitive DNA
regions,andthisphenomenonis3foldsmorefrequent
in eukaryotes than prokaryotes [14]. Clustering studies
showing microsatellite occurrence in distinct protein
families (non-homologous) from either prokaryotic or
eukaryotic genomes, indicate that the origins of these
loci occurred after eukaryotic evolution [14-16]. The
highest and lowest repeat counts were found in rodents
and C. elegans, respectively [3].
In plant species, some reports have described the
levels of occurrence of microsatellites associated to
transcribed regions [7,8,10,11,17-22]. However, some
comparative and/or descriptive approaches, still can
offer new pers pectives on the features of these markers.
Furthermore, frequently new groups of plant species
have their genome sequenced, enabling the reassessment
of databases using new sequences, representing diver-
gent evolutionary groups and/or with different genetic
models.
The online platforms for nucleotide, protein and tran-
script (ESTs) databases available for the majority of spe-
cies are relatively small when compare d with model
species, eg Physcomitrella patens (Hedw.) Bruch &
Schimp., O. sativa and A. thaliana. Since the protocols
for the isolation of repetit ive element loci, such as
microsatellites, require intensive labour and can be
expensiv e, the exploitation of these elements in silico on
databases of model plants and their respective transfer
to orphan species, is a potentially fruitful strategy.
In this study we present our results on the SSR survey
for the development of plant SSR markers. The s urvey
was based on clustered non-redundant EST data , their
classification, characterization and comparative analysis
in eleven phylogenetically distant plant species including
two green algae, a hepatic, two mosses, two fern, two
gymnosperms, a monocot and a dicot.
Results and Disc ussion
We analysed 560,360 virtual transcripts with the
SSRLocator software (Table 1). The species with most
abundant records in Genbank was Arabidopsis thaliana
with 224,496 virtual transcripts (40%), followed by
Oryza sativa with 121,635 (21. 7%), Physcomitrela patens
with 79,537 (14.19%), Pinus t aeda with 58,522 (10.44%)
and Chlamydomonas reinhardtii with 40,525 (7.2% ).
The remaining species added up to 11.7% of virtual
transcripts analysed. When total geno me sizes are com-
pared for the model plants included in this analysis, the
virtual transcripts of P. patens (511 Mb) represent 0.01%
of genome size. For O. sativa (389 Mb) an d A. thaliana
(109.2 Mb) the ESTs analysed represent 0.02% and
0.18%, respectively, of the genome. The highest average
bp count per EST sequence was f ound for Selaginella
spp. (924 bp) followed b y M. polymorpha (777 bp),
C. reinhardtii (775 bp) and P. taeda (760 bp). The lower
average bp per sequence was found for G. gnemon (563
bp) and A. capillus-veneris (580 bp). For the model
plants, A. thaliana showed the lowest average bp count
(321 bp), with P. patens and O. sativa presenting similar
bp counts (737 and 755 bp, respectively). Shorter
observed sequences could be an indication of
Victoria et al. BMC Plant Biology 2011, 11:15
/>Page 2 of 15
incomplete representation of genes, but one must keep
in mind that average gene sizes could vary among spe-
cies, i.e., rice fl-cDNAs (1,747 bp) are 14% longer than
Arabidopsis fl-cDNAs (1,532 bp) (TAIR 9 and RIKEN,
accessed in 12.2.2010). The overall bp counts are very
similar to those found by other authors [23].
The frequency of SSR per EST database was higher
(4.66%) in Selaginella spp virtual transcripts (Table 2).
For model plants, 3.57% and 0.84% SSRs/EST were
found for O. sativa and A. thaliana, respectively.
The average motif length, excluding compound SSRs,
was 27.03 bp. Mesostigma EST database shows the
longest SSR a verage size with 34.13 bp, and the short-
est size was found for Marchantia polymorpha with
22.56 bp mean size. The SSR size for model plants was
similar. For P. patens, O. sativa and A. thaliana,aver-
age sizes of 24.2, 23.4 and 26.5 bp were found, respec-
tively. A total 1,106 EST se quences containe d more
than one SSR. Among the species, O. sativa and
P. patens are on the extremes of the distribution with
37.34% and 3.46% of virtual transcripts containing one
or more microsatellites. However, Adiantum capillus-
veneris EST database contained the highest percentage
of transcripts displaying more than one SSR (20.86%)
based on t he database size. Simil ar results were found
in our group [11], using the Unigene database for
grasses and other allies. In the same study, rice was
shown to have the highest frequency of ESTs contain-
ing more th an one SSR (11.28%). In the present study,
a similar value was found for rice (10.20%). These
small differences could be due to different redundancy
reduction parameters used in Unige ne species database
and CAP3 default settings. Other reports for higher
plants [19,20,24-26], showed different ranges, but
never higher than 2-3 fold. The variations encountered
in different reports are related to the strategy
employed by investigators (software, repeat number
and motif type) [11]. The results for each species,
regarding the percentage of SSRs found per EST data-
base size are shown on Table 2.
Table 1 EST database size and Overall occurrence of SSR, percentages and average length motifs per specie
Species EST database count pb Average pg count per EST GC Content %
Chlamydomonas reinhardtii 40,525 31,388,333 775 57.22
Mesostigma viride 6,401 4,273,634 668 51.36
Marchantia polymorpha 10,086 7,836,025 777 54.75
Syntrichia ruralis 7,114 4,764,692 670 49.20
Physcomitrella patens 79,537 58,636,814 737 47.60
Selaginella spp. 19,830 18,318,250 924 51.38
Adiantum capillus-veneris 16,138 9,363,530 580 45.97
Gnetum gnemon 6,076 3,420,021 563 44.33
Pinus taeda 58,522 44,467,932 760 43.64
Oryza sativa 121,635 91,859,132 755 47.52
Arabidopsis thaliana 224,496 72,013,660 321 41.10
Table 2 EST database size and Overall occurrences of SSRs, percentages and average length motifs per species
Species Number of
SSR loci
SSR/EST
database (%)
Average motif
length (bp)
EST sequences
with SSRs (%)
N. of seq. containing more
than one SSR (%)
Single
SSRs
Compound
SSRs
Chlamydomonas
reinhardtii
980 2.41 33.21 886 (2.19) 94 (9.78) 899 81
Mesostigma viride 81 1.26 34.12 73 (1.14) 8 (9.87) 73 8
Marchantia
polymorpha
437 4.33 22.56 436 (4.32) 1 (0.52) 425 12
Syntrichia ruralis 190 2.67 23.84 149 (2.09) 41 (10.09) 189 1
Physcomitrella
patens
2753 3.46 24.20 2577 (3.24) 176 (6.6) 2670 83
Selaginella spp. 968 4.66 23.71 868 (4.38) 100 (11.13) 927 41
Adiantum
capillus-veneris
749 4.64 31.14 599 (3.71) 150 (20.86) 624 125
Gnetum gnemon 212 3.48 23.62 195 (3.21) 17 (8.45) 203 9
Pinus taeda 568 0.97 30.89 530 (0.91) 38 (6.85) 539 29
Oryza sativa 4347 3.57 23.44 3934 (3.23) 413 (10.19) 4199 148
Arabidopsis
thaliana
1890 0.84 26.52 1822 (0.81) 68 (3.62) 1837 53
Victoria et al. BMC Plant Biology 2011, 11:15
/>Page 3 of 15
The microsatellite survey using SSRLocator showed
that 13,133 SSRs were available as potential marker loci.
From those, 12,585 loci were found in single formation
and only 590 were found in compound formation. The
fern A. capillus-veneris showed the highest percentage
(20%)ofcompoundSSRloci.Whencomparedwith
other available SSR marker search tools, similar results
were found. Using MISA software, a total of 13,861
SSRs were availabl e as potential marker loci, being
13,172 SSRs single and 689 compound SSRs for all stu-
died species. Adiantum EST database showed the high-
est percent age of SSR in compound formation (15.55 %).
This trend does not hold for the majority of lower
plants. P. patens, for example, presen ted few EST-SSR s
in compound formation (3.57%) and possibly the fern
lowerdatabasesizeismaskingtheresults.Whenitis
compared with the majority of plant groups, P. taeda is
the only species showing a hi gh percentage of com-
pound SSRs (5.81%), corroborating other studies which
report that compound and imperfect tandem repeats are
most common in pines [27-29].
A total of 3,723 EST-SSRs were found in P. patens
database using the MISA software [23]. The SSRLocator
analysis resulted in 2,839 SSR for this species. When the
same non-redundant databases were run in other biofor-
matics tools, the results were similar to MISA. Using the
SciKoco package [30] combined with MISA, Sputinik
andModifiedscripts,itwaspossibletonarrowSSR
results to a 2-fold range variation.
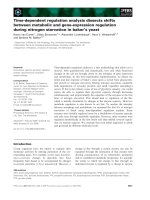
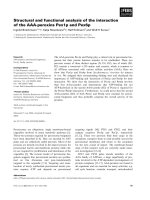
The search for repet itive elements in EST databases of
the eleven taxa listed above enabled the comparison of
patterns of occurrence of these elements in lower
and higher plants (Figure 1). In some species such as
C. reinhard tii, Mesostigma viride and bry ophytes,
we found that dimer (NN) microsatellite s are more
common when compared to higher plants (Figure 2).
The trimer (NNN) microsatellites are predominant in
higher plants (See additional files), i n agreement with
other SSR survey studies [6,10,11,21] supporting the
relative distribution o f motifs in these plant groups.
However, gymnosperm species showed the lowest SSR
occurrence within the derived plant groups. Pinus and
Gnetum results indicate low SSR frequencies as intrinsic
characteristics of gymnosperms, such as suggested by
other results obtained with distinct methods
[10,23,28,29]. The patterns of occurrence of dimers and
trimers found in the EST databases of the selected spe-
cies are shown on Additional files 1 and 2, respectively.
The average GC-content in the 11 datasets was
48.55%. Significantly increased GC-contents were
detected for the green algae Chlamydomo nas (57.22%)
and Mesostigma (51.36%), for the moss Syntrichia
ruralis (54.75%) and the fern moss Sellaginella spp.
(51.38%). These results are in agreement with other
genomiccomparativeanalysesofawiderangeofplant
groups, where the lo wer groups presented the higher
contents [23,31,32]. The remaining species showed simi-
lar results (Table 1).
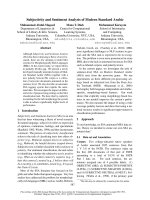
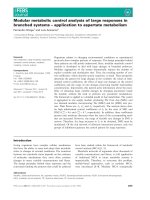
Dimer and Trimer most frequent motifs
For algae species, the most frequent dimer motif s were
AC/GT and CA/TG (Figure 2). For example, in C. rein-
hardtii, from 548 dimer oc currences, 199 AC/GT and
233 CA/TG motifs were found. The predominant trimer
motifs found were GCA/TGC, CAG/CTG and GCC/
GGC (Addi tional file 3) with 55, 46 and 39 occurrences
in 263 trimers found for algae species. For nonvascular
plants, the predominant dimer motifs were AG/CT
(239/1,049), AT/AT (226/1,049) and GA/TC (340/
1,049), as found for P. patens. For mosses, the most
Figure 1 SSR motifs occurrences by plant group studied. SSR motifs (%) in all plant groups studied (Chlorophyta+Mesostigmatophyceae =
unicelullar green algae; Bryophyta l.s. = hornworts, liverworts and mosses; Filicophyta+Lycopodiophyta = ferns; Cycadophyta+Coniferophyta =
Gimnosperms; Magnoliophyta = flowering plants)
Victoria et al. BMC Plant Biology 2011, 11:15
/>Page 4 of 15
frequent trimers found within the studied species were
GCA/TGC, AAG/CTT and AGC/GCT. For vascular
plants, t he most frequent motifs were AG/CT and GA/
TC. In O. sativa, 246 (43%) and 191(33%) occ urrences
for these motifs were found, respectively, in a total of
578 dimer occurrences. The GC/GC was only detected
in C. reinhardtii. There has been a report on the abun-
dance of GC elements in Chlamydo monas genome
libraries [33].
For the other species this motif has not been reported
in high frequencies [10,11,23,28,34].
Among trimer motifs, there was a predominance of
AAG/CTT, AGA/TCT, GGA/TCC and GAA/TTC in
higher plants. In lower plants, the motifs GCA/TGC and
CAG/CTG were predominant. The trimer motif CCG/
CGG is predominant in the algae C. reinhardtii and the
model mos s P. patens, and could reflect the h igh GC
content in these two species. However, this relationship
does not hold for the other cryptogams analysed. The
increased CCG/CGG frequency has been described ear-
lier for grasses and has been related to a high GC-content
[10]. In this context , the CCG/CGG increase in Chlamy-
domonas and P. patens was consistent, but, a previous
studyreportedthatitcannotbetakenasarule,since
higher GC values were found for other lower groups with
low CCG/CGG contents [23]. For rice CCG/CGG is the
predominant motif and its content appears to be high in
the members of the grass family [11,21].
Comparing all plant groups selected for this in silico
study, the most frequent dimer motifs found were AG/
CT and GA/TC, occurring for all plant species. The
most frequent trimers were AAG/CTT and GCA/TGC
occurring in the 11 studied species.
Tetramers, Pentamers and Hexamers
Tetramer and pentam er mo tifs were rare for all studied
species except for M. viride.Thisalgaeshowedthe
higher frequencies in loci formed by motifs longer than
three nucleotides with 36.95% of tetramer and 19.56% of
pentamer motifs. Although these results are in agree-
ment with other study [23], it is difficult to state that
this is a rule for this species, since the EST database size
for Mesostigma is the smallest one available among the
studied databases. In general, tetramer and pentamer
motifs predominantly found for Oryza, Physcomitrella
and Selaginela where CATC/GATG, CTCC/GGAG,
GATC/GATC, TGCT/AGCA (Additional file 4) and
CTTCT/AGAAG, GGAGA/TCTCC, GGCAG/CTGCC,
TCTCG/CGAGA and TGC TG/CAGCA (Additional file
5) and these were the most frequent motifs, at least for
two out of three of these species.
Hexamer motifs wer e predominant in novel taxa s uch
as gymnosperms and flowering plants [3,21,35]. P. taeda
and G. gnemom showed the highest frequency (26.95%)
of these motifs, but none of the hexamer motifs found in
Gnetum and Pinus werefoundincommonwithother
plant EST databases. However, one can not state the
absence of hexamer motif patterns in plant groups, since
in Bryophytes there is a possibility of patterns occurring
within closely related groups. For P. pat ens and
M. polymorpha the AGCAGG/AGCAGG, AGCTGG/
CCAGGT, CAGCAA/TTGCTG and TGGTGC/GCA
Figure 2 Predominant loci containing dinucleotide microsatellites motifs per species.
Victoria et al. BMC Plant Biology 2011, 11:15
/>Page 5 of 15
CCA motifs occur in both species (Additional file 6).
Based on plastid molecular data, Marchantiophyta and
Bryophyta originated about 450 Mya [36] and its possible
that some repeats are conserved for recently formed
groups, but it would be neces sary to include others spe-
cies in further analyses to confirm this hypothesis. For
the other SSR types (7, 8, 9 and 10 repeats) frequencies
were very low (less than 2 occurrences per motif) and
were not further characterized.
Physcomitrella patens SSR loci versus Gene Ontology
assignments
For the 4,909 SSR loci found for P. patens EST
sequences, 1,750 had GO assignments. More than 25%
of these hits were exclusive to P. patens. However, up to
70% of SSR loci were found as conserved across the
moss and t he higher plant species O. sa tiva, Vitis
vinifera L. and A. thaliana. On Ta ble 3, the distribution
of the best Blast hits is presented.
Regarding biological processes, the majority of SSR
loci found were involved with metabolic (32.17%) and
cellular (31.02%) processes (Figure 3). Comparing all
P. patens genome sequences with Gene Ont ology
assignment and those containing SSRs ( Figure 4), there
was a concentration of SSRs in metabolic process genes.
Biological adhesion, rhythmic processes, growth and cell
killing processes had the lowest SSR contents among
the P. patens transcripts. Similar results were found
comparing P. patens and A. thaliana EST libraries [37].
This author suggested that genes that are involved in
protein metabolism and biosynthesis are well conserved
between mosses and vascular plants. These patterns
were confirmed for mosses using Syntrichia ruralis and
P. patens transcript databases, respectively [38,39]. For
cellular components (Figure 5) the majority of SSRs
found are related to intracellular co mponent gene
sequences (52.52%) and membrane elements (12.15%).
This ontology levels were reported as the majority of
GO assignments in for P. patens annotated sequences
[39].Currently,morethanhalfofcellularcomponent
GO annotations for P. patens genome [32] are related
with membrane structure (Figure 6). Our results show
the enrichment of SSR occurrence mainly for genes
related to this structural level. The whole genome mole-
cular function assignment level in Gene Ontology
revealed a predominance of binding genes (80.51%), sug-
gesting these are representatively higher in P. patens
genome (Figure 7). However, when EST sequences con-
taining SSRs are assessed with the Gene Ontology
assigned molecular function (Figure 8), a relative
increase of other functions is revealed. Sequences asso-
ciated with binding decrease (42.81%), and those related
to catalytic activity (33.76%), and structural molecule
activity (10.80%) increase. These findings agree to the
expectations concerning the cellular function and are
consistent with ratios observed for rice, Arabidopsis, and
for the bryophytes Syntrichia ruralis and P. patens
[32,38-41]. The higher occurrence of SSR loci in this
ontology level indicate a good potential for using these
molecular markers to saturate pathways associated to
those functions described above.
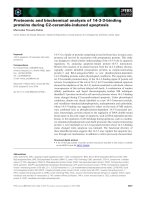
Predicted coding for SSR loci
The predicted amino acid content for the SSR loci
detected in the eleven species studied is shown in Figure
9. The amino acids arginine (Arg), alanine (Ala) and
Serine (Ser) were predominant for all species. Alanine
was predominant for the majority of cryptogams, ran-
ging from 14.85% to 29.7%. Exceptions were observed
for Adiantum, Mesostigma and Physcomitrell a,inwhich
serine (Ser), glutamic acid (Glu) and leucine (Leu) were
the predominant amino acid (up to 17%). Seri ne (up to
11%) was predominant for fern species and for Gnetum
Table 3 Distribution of Blast hits for Physcomitrella
patens SSR loci sequences against several taxa with GO
assignment
Taxa Best Hits (%)
Physcomitrella patens 26.90
Oryza sativa 10.89
Vitis vinifera 10.80
Arabidopsis thaliana 9.00
Populus trichocarpa 8.60
Zea mays 7.18
Picea sitchensis 5.60
Ricinus communis 4.80
Glycine max 3.90
Sorghum bicolor 3.90
Medicago truncatula 1.48
Nicotiana tabacum 0.75
Solanum tuberosum 0.63
Micromonas pusilla 0.56
Micromonas sp. 0.55
Chlamydomonas reinhardtii 0.48
Triticum aestivum 0.47
Solanum lycopersicum 0.46
Elaeis guineensis 0.41
Hordeum vulgare 0.40
Ostreococcus lucimarinus 0.39
Ostreococcus tauri 0.35
Cyanothece sp. 0.29
Psium sativum 0.28
Brassica rapa 0.28
Spinacia oleraceae 0.25
Gossypium hirsutum 0.21
Pinus contorta 0.21
Victoria et al. BMC Plant Biology 2011, 11:15
/>Page 6 of 15
Figure 4 Distribuition of Physcomitrella patens genome sequences with Gene Ontology assignments into biological processes. (Data:
Rensing et al., 2008).
Figure 3 Distribuition of Physcomitrella patens SSR loci within sequences of known biological processes in Gene Ontology.
Victoria et al. BMC Plant Biology 2011, 11:15
/>Page 7 of 15
Figure 6 Distribuition of Physcomitrella patens genome sequences with Gene Ontology assignments into cellular component. (Data:
Rensing et al., 2008).
Figure 5 Distribuition of Physcomitrella patens SSR loci within sequences of known cellular component in Gene Ontology.
Victoria et al. BMC Plant Biology 2011, 11:15
/>Page 8 of 15
and Arabidopsis, Pinus and Oryza showed arginine as
the predominant amino acid (10.46% and 23.31%,
respectively). Tyrosine (Tyr), asparagine (Asp), aspartic
acid (Asn) were the amino acids found at lower frequen-
cies among SSR loci for all species and were practically
absent in the algae species surveyed. In bryophytes,
methionine was only found in Physcomitrella,butata
small frequency (1.7%). For all higher plant species data-
bases used in this survey, arginine, alanine, serine, gluta-
mic acid, proline (Pro) and leucine were among the
Figure 8 Distr ibuition of Physcomitrella patens genome sequences with Gene Ontology assignments into molecular function. (Data:
Rensing et al., 2008).
Figure 7 Distribuition of Physcomitrella patens SSR loci within sequences of known molecular function in Gene Onthology.
Victoria et al. BMC Plant Biology 2011, 11:15
/>Page 9 of 15
predominant amino acids, agreeing with previous
reports for flowering plants [11,3,22,42-45]. No reports
were found for amino acid distribution in SSR loci in
lower plants.
The small EST data bases available for some species
did not seem to have hampered the results, since the
predicted loci distribution found were consistent within
the taxonomic groups. The absence of a relationship
between genome size and ta ndem repeat loci content
were reported based in grass genome studies [11], where
large genomes such as sugarcane (Saccharum offici-
narum L.), maize and wheat did not present higher fre-
quencies of SSR loci.
Relationship of Codon-bias with EST-SSR motif occurrences
The high GC-content in some EST-SSR motifs found i n
the present study can be a result of a codon usage pre-
ferencebyplantspecies.Whenwecomparethecodon
usageforthemodelspeciesincludedinthisstudy
(Chlamy domonas reinhardtii, Physcomitrella patens,
Oryza sativa and Arabidopsis thaliana) the occurrence
of some repeat motifs are reflected in codon-bias known
for each species. Higher frequencies of GC were found
in the first and third codon position for all four species.
However, for the basal plant (C. reinhardtii), the prefer-
ence for GC3 was much higher than the other three
species. The first (GC1) and t he third (GC3) codon
position reached 64.8% and 86.21% of the occurrences,
respectively. For rice, GC1 and GC3 frequencies were
58.19% and 61.6%, respectively. For the other model
plants, the occurrences at GC3 were l ower than the
occurrences in GC1, i.e., for Physcomitrella patens and
Arabidopsis t haliana, GC1 (55.49% and 50.84%, respec-
tively) and GC3 (54.6% and 42.4%, respectively) values
were found. When one associates these codon usage
values with the SSR motif frequencies fo und, a striking
result is obtained for C. reinhardtii and rice. In the first,
the most frequent motifs were GCA/TGC, CAG/CTG
and GCC/GGC and could be explained by the GC1s
and GC3s codon preference. In rice the CCG/CGG pre-
dominant motif could also be a reflection of GC3s
codon preference. For Arabidopsis,themostfrequent
motif found in this study (GAA/TTC) is also the most
preferred codon used by this species (GAA) with 34.3%
of the occurrences. It also reflects the GC1 preference
in the codon usage in t his species. In the model moss
species the most frequent motifs do not show a relation-
ship with the GC codo n usage (Fi gure 10). Despit e the
similarities in ave rage codon bi as between P. patens and
Arabidopsis thaliana, the distribution pattern is differ-
ent, with 15% of moss genes being unbiased [46]. An
association b etween the frequency of microsatellite
motifs and codon usage could explain the occurrences
found in P. patens. For example, the most representative
motifs GCA/TGC, AAG/CTT and AGC/GCT are also
foundamongthemostusedcodonsGCA,AAGand
AGC (20.7%, 33.6% and 15%, respectively).
The width of the GC3 distribution in floweri ng plants
wasfoundtobearesultofvariationinthelevelsof
Figure 9 Predicted amino acid occurrences in SSR loci within plant groups studied.
Victoria et al. BMC Plant Biology 2011, 11:15
/>Page 10 of 15
directional mutation pressure or selection against muta-
tional biases. L ikewise, the low frequency of GC2 occur-
rences is a result of a strong selectiv e pressure against
peptide substitution. The balance between these forces
could be shaping the distribu tion of EST-SSR by mean s
of codon usage preference [47].
Positive and negative selection sites in EST-SSR across
species
SSRs represent hyper mutable loci subject to reversible
changes in their length [8]. Significant differences in
SSR representations exist even among closely related
species, suggesting that SSR abundance may change
relatively rapidly during evolution [48]. To infer about
the selection pressures (dN/dS ratio) on EST-SSR found
for the 11 species chosen for this work, we used the
common most frequent motif in all spe cies (AAG/CTT
and GCA/TGC). The dN-dS te st revealed few negatively
selected sites in the triplets for each EST-SSR (Addi-
tional file 7). The positive selection in SSR based
sequence was reported in other studies [8,49-51]. More
than 50% of sites for both motifs analyzed across species
were under a positive selection (dN/dS > 1), suggesting
a weak selection pressure on these EST-SSR motifs, as
was reported for other species [52,53]. The occurrence
of selective sweeps or background selection in ancestral
lineages [54] cannot be discarded, however it could not
be tested with the present data.
In silico transferability of EST-SSR across species
Across-species transferability of EST-SSRs is greater
than genomic SSRs, as they originate from expressed
regions and therefore they are more conserved across a
number of related species [6].
The virtual PCR shows a lower tra nsferability of
Chlamydomonas reinhardtii EST-SSR for most of the
Figure 10 Correlation between synonymous codon usage bias and GC composition in Physcomitrella patens EST-SSR sequences.
Victoria et al. BMC Plant Biology 2011, 11:15
/>Page 11 of 15
plant species tested. The best results were found for
Adiantum and Arabidopsis, where successful rates of
positive EST-SSR amplicons derived from algae were
26% and 9%, respectively. When EST-SSR primers
designed from Arabidopsis were used against other spe-
cies, again low transferability rates were found, being
the best positive cases found in Physcomitrella, Pinus
and rice with amplification rates of 1.04%, 1.20% and
1.90%. The summary of in silico PCR results can be
accessed in the Additional files section of this article.
Some reports suggest that SSR markers have higher
transferability rates when used between closely related
species [6,22,55]. In t his work virtual PCR amplification
did follow the same trend.
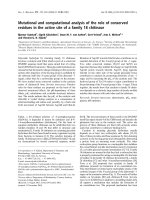
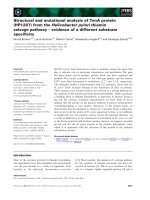
For the positive EST-SSRs found for the in silico
transfer, ten sets of Physcomitrella EST-SSR primers
were used to illustrate the transferability results using
an electronic tool [56] to simulate gel electrophoresis
(Figure 11). For th e three teste d EST-databases only two
primers amplified a single locus in each species (SSR9
and SSR10). In the other sets 2, 3 and even 4 virtual
amplicons were observed (Additional file 8). For Chla -
mydomonas, 70% of the tested primers resulted in one
amplicon and 10% each resulted in 2, 3 or 4 amplifica-
tions. However, only 20% of amplicons obtained in this
algae species are related to the EST-SSR sequence, sug-
gesting that the majority of designed EST-SSR primers
act as degenerate when applied to Chlamydomonas.For
rice, 30%, 40% and 10% of tested primers resulted in
one, two or three amplifications, respectively. In Arabi-
dopsis 40%, 40% and 20% of tested primers results in
one, two or three amplifications, respectively. For both
flowering plants, 50% of tested primers amplified moss
EST-SSR homologue sequences, showing a high rate of
success for transferability across species. These results
agree with other studies where the transfer success rates
decrease with the increasing evolutionary distance
[55,57-60]. The use of th is molecular marker across dis-
tant taxonomical groups are not impossible, however
our findings confirm that only a few retain their EST-
SSR homologue sequences, making this effort hardly
worthwhile [61].
Conclusions
These results make it possible to create strategies for
transferring molecular markers based on microsatellites
from model to orphan species.
Microsatellites were found in all species studied and
variable transfer rates were found as a function of
genetic distance among taxa. The motifs found are influ-
enced by species codon usage preference. The two most
common motifs among the eleven species are under a
positive selection pressure. Primers generating one
amplicon in the genome of origin may generate multiple
amplicons in other taxa and only a few retain their ori-
ginal targeting sequence. The similarities between the
Figure 11 Eletronical eletrophoresis gel for 10 primers set design for Physcomitrella patens EST-SSR (SSRn) across Chlamydomonas
reinhardtii (Chml) Oryza sativa (Os) and Arabidopsis thaliana (At) EST databases.
Victoria et al. BMC Plant Biology 2011, 11:15
/>Page 12 of 15
results here presented and other initiatives using similar
bioinformatics Perl scripts, such as MISA [23], support
SSRLocator as a useful tool for SSR survey analyses.
Methods
An exploratory in silico analysis of SSRs was made in ESTs
databases of 11 taxa, as follows: two unicellular green algae
( Chlamydomonas r einhardtii Dang, Mesostigma viride
Lauterborn.), three bryophytes s. l. [Marchantia polymor-
pha L., Physcomitrella patens and Syntricha ruralis
(Hed w.) Weber & Mohr], two ferns (Selag inella spp. and
Adiantum capillus-veneris L.), two gymnosperms (Gnetum
gnemon L. and Pinus taeda L.) and two flowering plants, a
monocot (Oryza sativa)andadicot(Arabidopsis thali-
ana). These species were chosen because the amount of
available ESTs data in Genbank (NCBI). As these data-
bases may have redundanc y, w e used the program CAP3
[62] for MacOX, to construct contigs with the sequences
and get non-redundant sequences for each database
following the default settings.
Taxa data were loaded into the software SSRLocator
[63], to investigate the presenc e of tandem repetitive ele-
ments (SSRs). The analysis w as performed following
the search parameters for repetitive elements in class I
(≥ 20 bp) described as more efficient molecular markers
[17]. Data resulting from in silico analyses were assessed
for occurrence patterns in chosen taxa databases. The
same analysis was performed using MISA script http://
pgr c.ipk-gatersleben.de/misa/ software to search for SSR
occurrences per contig. Several instructions in the algo-
rithm used in SSRLocator resemble those from MISA [19]
and SSRIT [17]. However, additional instructions have
been inserted in SSRLocator’s code. Instead of allowing the
overlap of a few nucleotides when two SSRs are adjacent
to each other and one of them is shorter than the mini-
mum size for a given class as found in MISA and SSRIT, a
module written in Delphi language records the data and
eliminates such overlaps. For GC content, Perl scripts
were used and the results were stored in text files (.txt) for
later comparative analyses.
For the predict ed amino acid content s in the SSR loci,
an additional routine script was written in the SSRLoca-
tor software. This script determined which amino acids
were coded by trimer, hexamer and nonamer motifs
found in the EST database analysed [63].
To validate the frequenc ies obtained using the SSRLo-
cator software, the Physcomitrella patens EST database
was chosen.
This database was run with other SSR search scripts
and softwares, such as MISA [19] and SPUTINIK [64],
running in SCIROKO package [30], MINE SSR http://
www.genome.clemson.edu/resources/online_tools/ssr,
SSRIT following the SSR categories defined a bove [17].
The results were exported into Microsoft Excel
spreadsheets (MacOSX-Oficce 2008) and respectively
grouped by taxon.
A codon-bias for the model plants included in this
research (Chlamydomonas reinhardtii, Physcomitrella
patens, Oryza sativa and Arabidopsis tha liana)was
made comparing with the preferencial codon table for
each species available at />codon/. T he sequences containing EST-SSR for Physco-
mitrella patens was submitted to CodonO server [65]
to confirm the preferencial codon usage compared
with the know codon table for this species. To investi-
gate the selective pressure on the triplets on the
EST-SSR which occurs in all studied species a dN-dS
statistics [66] was used to verify the synonymous and
noun-synonymous sub stitutions in the preferential
codons nearby the repeats chosen using the molecular
phylogenetics package MEGA4 [67].
The Physcomitrella patens SSR result s were run
through a Gene Ontology (GO) assignment database in
or
der to assess associations between SSR loci and biolo-
gical processes, cellular components and molecular
function of known genes. A fasta file with all EST-SSRs
found in P. patens was subjected to Blast2GO software
and ran against the GO annotated sequences, and the
obtained hits were compiled.
To verify the potential transferability of this molecular
markers we have tested in silico all EST-SSR found for
the plant ancestral lineage, and for the derivative plant
group, represented here by the green algae Chlamydomo-
nas reinhardtii and Arabidopsis thaliana, across t he
others species EST database used for the present SSR
survey. Electronic PCR [68] was used to verify the
transferability of EST-SSRs across studied species. The
positive results found were used to simulate a gel electro-
phoresis with aid of SIMGEL.exe included in the SPCR
package [56] using the Physcomitrella patens EST-SSR
sequences to design primer s and Chlamydomonas,rice
and Arabidopsis as templates. The virtual amplicons
resulted for each primer set tested across species were
aligned to verify the homology between the amplicons.
Additional material
Additional file 1: Patterns of occurrence for dimer SSR motifs in
percentage.
Additional file 2: Patterns of occurrence for trimer SSR motifs in
percentage.
Additional file 3: Predominant trinucleotide microsatelites motifs
loci occurrences per species.
Additional file 4: Predominant tetramers microsatelites motifs loci
occurrences per species.
Additional file 5: Predominant pentamers microsatelites motifs loci
occurrences per species.
Additional file 6: Predominant hexamers microsatelites motifs loci
occurrences per species.
Victoria et al. BMC Plant Biology 2011, 11:15
/>Page 13 of 15
Additional file 7: dN/dS table for the common most frequent motifs
for 11 species tested EST databases.
Additional file 8: Eletronical PCR results table.
Acknowledgements
We would like to thank the Developmental Center of Technology (CDTec/
UFPEL) for the support to the first author. This work was supported by the
National Council for Scientific and Technological Development CNPq
(process # 480938/2009-1 and 475122/2007-0).
Author details
1
Plant Genomics and Breeding Center, Faculdade de Agronomia Eliseu
Maciel, Universidade Federal de Pelotas, RS, Brasil.
2
Graduate Program in
Biotechnology, Universidade Federal de Pelotas, RS, Brasil.
Authors’ contributions
FCV carried out all in silico studies, including the SSR survey, the electronic
PCR and the sequence alignment for selective sites mining and drafted the
manuscript. LCM created the SSR script used and participated in the design
of the study. ACO conceived the study, and participated in its design and
coordination. All authors read and approved the final manuscript.
Received: 10 July 2010 Accepted: 19 January 2011
Published: 19 January 2011
References
1. Morgante M, Olivieri AM: PCR-amplified microsatellites as markers in
plant genetics. The Plant Journal 1993, 3(1):175-182.
2. Jurka J, Pethiyagoda C: Simple repetitive DNA sequences from Primates:
Compilation and analysis. Journal of Molecular Evolution 1994, 40:120-126.
3. Tóth G, Gáspári Z, Jurka J: Microsatellites in different eukaryotic genomes:
survey and analysis. Genome Research 2000, 10:967-981.
4. Iyer RR, Pluciennik A, Rosche WA, Sinder RR, Wells RD: DNA polymerase III
proofreading mutants enhance the expansion and deletion of triplet
repeat sequence in Escherichia coli. Journal of Biological Chemistry 2000,
275(3):2174-2184.
5. Mirkin SM: DNA structures, repeat expansions and human hereditary
disorders. Current Opinion in Structural Biology 2006, 16(3):351-358.
6. Varshney RK, Graner A, Sorrells ME: Genic microsatellite markers in plants:
features and applications. Trends in Biotechnology 2005, 23(1):48-55.
7. Varshney RK, Hoisington DA, Tyagy AK: Advances in cereal genomics and
applications in crop breeding. Trends in Biotechnology 2006,
24(11):490-499.
8. Kashi Y, King DG: Simple sequence repeats as advantageous mutators in
evolution. Trends Genet 2006, 22:253-259.
9. Gupta PK, Rustgi S, Sharma S, Singh R, Kumar N, Balyan HS: Transferable
EST-SSR markers for the study of polymorphism and diversity in bread
wheat. Molecular Genetics and Genomics 2003, 270:315-323.
10. Morgante M, Hanafey M, Powell W: Microsatellites are preferentially
associated with nonrepetitive DNA in plant genomes. Nature Genetics
2002, 3(2):194-200.
11. Maia LC, Souza VQ, Kopp MM, Carvalho FIF, Oliveira AC: Tandem repeat
distribution of gene transcripts in three plant families. Genetics and
Molecular Biology 2009, 32(4):1-12.
12. Subramanian S, Mishra RK, Singh L: Genome-wide analysis of
microsatellite repeats in humans: their abundance and density in
specific genomic regions. Genome Biology 2003, 4(2):R13.
13. Li YC, Korol AB, Fahima T, Beiles A, Nevo E: Microsatellites: genomic
distribution, putative functions and mutational mechanisms: a review.
Molecular Ecology 2002, 11:2453-2465.
14. Marcotte EM, Pellegrini M, Yeates TO, Eisenberg D: A census of protein
repeats. Journal of Molecular Biology 1999, 293:151.
15. Kashi Y, King D, Soller M: Simple sequence repeats as a source of
quantitative genetic variation.
Trends in genetics 1997, 13:74-78.
16.
Wren JD, Forgacs E, Fondon JW III, Pertsemlidis A, Cheng SY, Gallardo T,
Williams RS, Shohet RV, Minna JD, Garner HR: Repeat polymorphisms
within gene regions: phenotypic and evolutionary implications. American
Journal of Human Genetics 2000, 67:345-356.
17. Temnykh S, DeClerck G, Lukashova A, Lipovich L, Cartinhour S, McCouch S:
Computational and experimental analysis of microsatellites in rice (Oryza
sativa L.): frequency, length variation, transposon associations, and
genetic marker potential. Genome Research 2001, 11(8):1441-52.
18. McCouch SR, Teytelman L, Xu Y, et al: Development and mapping of 2240
new SSR markers for rice (Oryza sativa L.). DNA research 2002, 9(6):199-207.
19. Thiel T, Michalek W, Varshney RK, Graner A: Exploiting EST databases for
the development of cDNA derived microsatellite markers in barley
(Hordeum vulgare L.). Theoretical and Applied Genetics 2003, 1-6:411-422.
20. Nicot N, Chiquet V, Gandon B, Amilhat L, Legeai F, Leroy P, Bernard M,
Sourdille P: Study of simple sequence repeat (SSR) markers from wheat
expressed sequence tags (ESTs). Theoretical and Applied Genetics 2004,
1-9(4):8008-5.
21. Lawson MJ, Zhang L: Distinct patterns of SSR distribution in the
Arabidopsis thaliana and rice genomes. Genome Biology 2006, 7:R14, 3.
22. Zhang L, Yuan D, Yu S, Li Z, Cao Y, Miao Z, Qian H, Tang K: Preference of
simple sequence repeats in coding and non coding regions of
Arabidopsis thaliana. Bioinformatics 2004, 20:1081-1086.
23. von Stackelberg MV, Rensing SA, Reski R: Identification of genic moss SSR
markers and a comparative analysis of twnty-four algal and plant gene
indices reveal species-specific rather than group-specific characteristics
of microsatellites. BMC Plant Biology 2006, 6:9.
24. Cordeiro GM, Casu R, McIntyre CL, Manners JM, Henry RJ: Microsatellite
markers from sugarcane (Saccharum spp.) ESTs cross transferable to
erianthus and sorghum. Plant science 2001, 16(6):1115-1123.
25. Kantety RV, La Rota M, Matthews DE, Sorrells ME: Data mining for simple
sequence repeats in expressed sequence tags from barley, maize, rice,
sorghum and wheat. Plant molecular biology 2002, 48(5-6):5-1-11.
26. Asp T, Frei UK, Didion T, Nielsen KK, Lübberstedt T: Frequency, type, and
distribution of EST-SSRs from three genotypes of Lolium perenne, and
their conservation across orthologous sequences of Festuca arundinacea,
Brachypodium distachyon, and Oryza sativa. BMC plant biology
2007,
12(7):36.
27.
Echt CS, May-Marquardt P, Hseih M, Zahorchak R: Characterization of
microsatellire markers in eastern white pine. Genome 1996, 39:1102-1108.
28. Echt CS, May-Marquardt P: Survey of microsatellite DNA in pine. Genome
1997, 40:9-17.
29. Fisher PJ, Gardner RC, Richardson TE: Single locus microsatellites isolated
using 5’anchored PCR. Nucleic Acids Research 1996, 24:4369-4372.
30. Kofler R, Schlotterer C, Lelley T: SciRoKo: A new tool for whole genome
microsatellite search and investigation. Bioinformatics 2007, 23:1683-1685.
31. Qiu Y-L, Lee J, Bernasconi-Quadroni B, Soltis DE, et al: The earliest
Angiosperms: Evidence from mitochondrial, palstid and nuclear
genomes. Nature 1999, 402:404-407.
32. Rensing SA, Lang D, Zimmer AD, et al: The Physcomitrella genome reveals
insights into the conquest of land by plants. Science 2008, 319:64-69.
33. Wakarchuk WW, Müller FW, Beck C: F. Two GC-rich elements of
Chlamydomonas reinhardtii with complex arrangements of directly
repeated sequences motifs. Plant Molecular Biology 1992, 18:143-146.
34. Yashoda R, Sumathi R, Chezhian P, Kavitha S, Ghosh M: Eucalyptus
microsatellites mined in silico: survey and evaluation. Journal of Genetics
2008, 87(1):21-25.
35. Jiang D, Zhong GY, Hong QB: Analysis of microsatellites in citrus
unigenes. Acta genetica Sinica 2006, 33(4):345-53.
36. Magallón S, Hilu KW: Land plants (Embryophyta). In The Timetree of Life.
Edited by: S. B. Hedges, S. Kumar. Oxford, University Press; 2009:133-137.
37. Nishiyama T, Fujita T, Shin-I T, Seki M, Nishide H, Uchiyama I, Kamiya A,
Carninci P, Hayashizaki Y, Shinozaki K, Kohara Y, Hasebe M: Comparative
genomics of Physcomitrella patens gametophytic transcriptome and
Arabidopsis thaliana: Implication for land plant evolution. PNAS 2003,
100(13):8007-8012.
38. Oliver MJ, Dowd SE, Zaragoza J, Mauget SA, Payton PR: The rehydration
transcriptome of the desiccation-tolerant bryophyte Tortula ruralis:
Transcript classification and analysis. BMC Genomics 2004, 5:89.
39. Lang D, Eisinger J, Reski R, Resing SA: Representation and High-Quality
Annotation of the Physcomitrella patens Transcriptome Demonstrates a
High Proportion of Proteins Involved in Metabolism in Mosses. Plant
Biology 2005, 7:238-250.
Victoria et al. BMC Plant Biology 2011, 11:15
/>Page 14 of 15
40. Ware D, Jaiswal P, Ni J, Pan X, Chang K, Clark K, Teytelman L, Schmidt S,
Zhao W, Cartinhour S, McCouch S, Stein L: Gramene: a resource for
comparative grass genomics. Nucleic Acids Research 2002, 30:103-105.
41. Rhee SY, Beavis W, Berardini TZ, et al: The Arabidopsis Information
Resource (TAIR): a model organism database providing a centralized,
curated gateway to Arabidopsis biology, research materials and
community. Nucleic Acids Research 2003, 31:224-228.
42. Jung S, Abbott A, Jesudurai C, Tomkins J, Main D: Frequency, type,
distribution and annotation of simple sequence repeats in Rosaceae
ESTs. Functional & integrative genomics 2005, 5(3):136-43.
43. La Rota M, Kantety RV, Yu JK, Sorrells ME: Nonrandom distribution and
frequencies of genomic and EST-derived microsatellite markers in rice,
wheat, and barley. BMC Genomics 2007, 18(1):23, 6.
44. Varshney RK, Thiel T, Stein N, Langridge P, Graner A: In silico analysis on
frequency and distribution of microsatellites in ESTs of some cereal
species. Cell Mol Biol Lett 2002, 7:537-546.
45. Parida SK, Anand Raj Kumar K, Dalal V, Singh NK, Mohapatra T: Unigene
derived microsatellite markers for the cereal genomes. Theor Appl Genet
2006, 112:808-817.
46. Rensing SA, Fritzomsky D, Lang D, Reski R: Protein encoding genes in an
ancient plant: analysis of codon usage, retained genes and splice sites
in a moss, Physcomitrella patens. BMC genomics 2005, 6:43.
47. Kawabe A, Miyashita NT: Patterns of codon usage bias in three dicot an
four monocot plant species. Genes and Genetic System 2003, 78:343-352.
48. Mrázek J: Analysis of distribuition indicates diverse functions of simple
sequence repeats in Mycoplasma genomes. Molecular Biology and
Evolution 2006, 23:1370-1385.
49. King DG, Kashi Y: Indirect selection for mutuability. Heredity 2007,
99:123-124.
50. King DG, Soller M: Variation and fidelity: The evolution of simple
sequence repeats as functional elements in adjustable genes. In
Evolutionary Theory and Processes: Modern Perspectives. Edited by: Wasser SP.
Kluwer Academic Publisher, the Netherlands; 1999:65-82.
51. Vigouroux Y, Matsuoka Y, Doebley J: Directional evolution for
microstellites size in maize. Molecular Biology and Evolution 2003,
20:1480-1483.
52. Ellis JR, Burke JM: EST-SSRs as a resource for population genetic analyses.
Heredity 2007, 99:125-132.
53. Yatabe Y, Kane NC, Scotti-Saintagne C, Rieseberg LH:
Rampant gene
exchange across a strong reproductive barrier between the annual
sunflowers, Helianthus annuus and H petiolaris. Genetics 2007,
175:1883-1893.
54. Wrigth SI, Gaut BS: Molecular population genetics and the search for
adaptative evolution in plants. Molecular Biology and Evolution 2005,
22(3):506-519.
55. Chapman MA, Hvala J, Strever J, et al: Development, polymorphism, and
cross-taxon utility of EST-SSR markers from safflower (Carthamus
tinctorius L.). Theoretical and Applied Genetics 2009, 120:85-91.
56. Cao Y, Wang L, XU K, Kou C, Zhang Y, Wei G, He J, Wang Y, Zhao L:
Information theory-based algorithm for in silico prediction of PCR
products with whoke genomic sequences as templates. BMC
bioinformatics 2005, 6:190.
57. Brondani C, Rangel PHN, Borba TCO, Brondani RPV: Transferability of
microsatellite and sequence tagged site markers in Oryza species.
Hereditas 2003, 138:187-192.
58. Castillo A, Budak H, Varshney RK, Dorado G, Graner A, Hernandez P:
Tranferability and polimorphism of barley EST-SSR markersused for
phylogenetic analysus in Hordeum chilense. BMC plant biology 2008, 8:97.
59. Yodav OP, Mitchell SE, Fulton TM, Kresovich S: Tranferring molecular
markers from sorghum, rice and other cereals to pearl millet and
identifying polumorphic markers. Journal of SAT Agricultural Research 2008,
6:1-4.
60. Zeid M, Yu JK, Goldowitz I, Denton ME, et al: Cross-amplification of EST-
derived markers among 16 grass species. Field Crops Research 2010,
118:28-35.
61. Barbará T, Palma-Silva C, Paggi GM, Bered F, Fay MF, Lexer C: Cross-species
transfer of nuclear microsatellites markers: potential and limitations.
Molecular Ecology 2007, 16:3759-3767.
62. Huang X, Madan A: CAP3: A DNA sequence assembly program. Genome
Research 1999, 9:868-877.
63. Maia LC, Palmieri DA, Souza VQ, Kopp MM, Carvalho FIF, Oliveira AC: SSR
Locator: Tool for Simple Sequence Repeat Discovery Integrated with
Primer Design and PCR Simulation. International Journal of Plant Genomics
2008, Article ID 412696, 9 pages.
64. Abajan C, SPUTINIK: 1994 [ />65. Angellotti MC, Bhuiyan SB, Chen G, Wan X-F: CodonO: codon usage bias
analysis within and across genomes. Nucleic Acids Research 2007, 35:
W132-W136.
66. Yang Z, Bielawski JP:
Statistical methods for detecting molecular
adaptation. Trends in Ecology and Evolution 2000, 12:496-503.
67. Tamura K, Dudley J, Nei M, Kumar S: MEGA4: Molecular Evolutionary
Genetics Analysis (MEGA) software version 4.0. Molecular Biology and
Evolution 2007, 24:1596-1599.
68. Schuler GD: Sequence mapping by eletronic PCR. Genome Research 1997,
7(5):541-550.
doi:10.1186/1471-2229-11-15
Cite this article as: Victoria et al.: In silico comparative analysis of SSR
markers in plants. BMC Plant Biology 2011 11:15.
Submit your next manuscript to BioMed Central
and take full advantage of:
• Convenient online submission
• Thorough peer review
• No space constraints or color figure charges
• Immediate publication on acceptance
• Inclusion in PubMed, CAS, Scopus and Google Scholar
• Research which is freely available for redistribution
Submit your manuscript at
www.biomedcentral.com/submit
Victoria et al. BMC Plant Biology 2011, 11:15
/>Page 15 of 15