báo cáo khoa học: " Prediction of transcriptional regulatory elements for plant hormone responses based on microarray data" docx
Bạn đang xem bản rút gọn của tài liệu. Xem và tải ngay bản đầy đủ của tài liệu tại đây (633.17 KB, 14 trang )
Yamamoto et al. BMC Plant Biology 2011, 11:39
/>
RESEARCH ARTICLE
Open Access
Prediction of transcriptional regulatory elements
for plant hormone responses based on
microarray data
Yoshiharu Y Yamamoto1*, Yohei Yoshioka1, Mitsuro Hyakumachi1, Kyonoshin Maruyama2,
Kazuko Yamaguchi-Shinozaki2, Mutsutomo Tokizawa1, Hiroyuki Koyama1
Abstract
Background: Phytohormones organize plant development and environmental adaptation through cell-to-cell
signal transduction, and their action involves transcriptional activation. Recent international efforts to establish and
maintain public databases of Arabidopsis microarray data have enabled the utilization of this data in the analysis of
various phytohormone responses, providing genome-wide identification of promoters targeted by phytohormones.
Results: We utilized such microarray data for prediction of cis-regulatory elements with an octamer-based
approach. Our test prediction of a drought-responsive RD29A promoter with the aid of microarray data for
response to drought, ABA and overexpression of DREB1A, a key regulator of cold and drought response, provided
reasonable results that fit with the experimentally identified regulatory elements. With this succession, we
expanded the prediction to various phytohormone responses, including those for abscisic acid, auxin, cytokinin,
ethylene, brassinosteroid, jasmonic acid, and salicylic acid, as well as for hydrogen peroxide, drought and DREB1A
overexpression. Totally 622 promoters that are activated by phytohormones were subjected to the prediction. In
addition, we have assigned putative functions to 53 octamers of the Regulatory Element Group (REG) that have
been extracted as position-dependent cis-regulatory elements with the aid of their feature of preferential
appearance in the promoter region.
Conclusions: Our prediction of Arabidopsis cis-regulatory elements for phytohormone responses provides guidance
for experimental analysis of promoters to reveal the basis of the transcriptional network of phytohormone
responses.
Background
Phytohormones control plant morphology, development,
and environmental adaptation through cell-to-cell signal
transduction. They function not only independent as
solo, but also in cooperative or competitive, interdependent ways in duos or trios. Altering the balance between
auxin and cytokinin changes the fate of tissue differentiation in vitro [1]. Gibberellin has an antagonistic effect
to abscisic acid for seed maturation and germination [2].
Ethylene activates auxin action by stimulation auxin biosynthesis and modulating auxin transport [3], and salicylic acid and jasmonic acid act competitively in
* Correspondence:
1
Faculty of Applied Biological Sciences, Gifu University, Yanagido 1-1, Gifu
City, Gifu 501-1193, Japan
Full list of author information is available at the end of the article
pathogen responses [4]. A recent report suggests
sequential activation of jasmonic acid, auxin, salicylic
acid responses in mediating systemic acquired resistance
[5]. These relationships between phytohormones are a
part of the huge transcriptional network for complex
phytohormone responses. Because of the biological
importance of this network, intensive efforts have been
dedicated for decades to the molecular identification of
phytohormone receptors, transporters, intracellular signal transducers, transcription factors, and target promoters. Having gained understanding of several examples
from hormone perception to gene activation, one of the
most important current topics is how we understand
the hormonal regulation of gene expression at the genome level, or the entire transcriptional network where
multiple hormone responses intersect. Genome-wide
© 2011 Yamamoto et al; licensee BioMed Central Ltd. This is an Open Access article distributed under the terms of the Creative
Commons Attribution License ( which permits unrestricted use, distribution, and
reproduction in any medium, provided the original work is properly cited.
Yamamoto et al. BMC Plant Biology 2011, 11:39
/>
determination of all the corresponding cis-regulatory
elements is one of the challenges we should take up.
Previously, we have identified hundreds of promoter
constituents by the LDSS (Local Distribution of Short
Sequences) strategy, that is an in silico method to detect
position-sensitive promoter elements regardless of their
biochemical or biological roles [6,7]. Application of this
method to the Arabidopsis genome resulted in the successful detection of 308 octamers that belong to a group
of putative cis-regulatory elements, the Regulatory Element Group (REG), in addition to novel core promoter
elements [8].
Comparison between the REG and reported cis-regulatory elements of Arabidopsis suggested that the elements identified in the REG include about half of the
known cis-elements, the other half remaining undetected. These results, demonstrating the limited sensitivity of LDSS, were considered reasonable because LDSS
has a methodological limitation in that it fails to detect
cis-elements of the position-insensitive type [7,9].
The functions of half of the detected REGs remain
unknown, and of the half known, their precise biological
roles are not clear to date. In order to give biological
annotation to REGs, we decided to utilize microarray
data to predict the biological responses of cis-elements
that are defined by the corresponding microarray experiments. Although there are several well-established methodologies for the prediction in motif-based search
algorithms (Gibbs Sampler [10,11], MEME [11,12], and
their parallel analysis platform, MELINA II [13]), we
needed an octamer-based approach in order to give
compatibility to REG analysis. In this report, we describe
the development of an octamer-based prediction
method using microarray data of phytohormone
responses and all the predicted data by analysis of 622
hormone-responsive Arabidopsis promoters.
Results
Searching for overrepresented regions in a promoter with
the aid of RAR
Our method is achieved in the following two steps.
Firstly, the Relative Appearance Ratio (RAR) is calculated for each octamer (see methods). This comparative
value indicates the degree of overrepresentation in a stimulus-responsive promoter set over a set of total genic
promoters in a genome. A high RAR indicates enrichment of a corresponding octamer in the responsive promoter set, and thus octamers with high RARs are
suggested to be involved in gene regulation that reflects
the characteristics of the selected promoter set. Secondly, a prepared RAR table for all the octamers is
applied to a specific promoter. This application is
achieved by scanning the promoter with octamers giving
the corresponding RAR values one by one.
Page 2 of 14
Scan of the drought responsive RD29A promoter
The RD29A promoter is one of the most characterized
drought-responsive promoters having undergone intensive functional analyses, and several cis-regulatory elements in the promoter have been experimentally
identified [14,15]. We applied our prediction method to
the RD29A promoter to estimate the sensitivity and
reliability of the prediction.
The results of promoter scanning of RD29A with a
RAR table prepared with microarray data of drought
treatment [16] are shown in Figure 1. The scan revealed
several high RAR peaks between -300 to -50 relative to
the transcription start site (TSS) (shaded area, Figure 1).
These peaks predict cis-regulatory elements for drought
response.
During the analysis of RD29A and others, we found
that octamers with very high RAR values (20~100) are
often very rare sequences among all the genic promoters
(data not shown). One possible reason for these high
values is statistical fluctuation. In order to avoid these
potential false positives, we calculated P values for each
octamer-RAR combination under the assumption of
random distribution, and RAR with P > 0.05 was
masked as zero. The resultant filtered RAR is referred to
as RARf. As expected, a decrease in the number of octamers with a positive RAR (> 3) was observed only for
fractions of rare octamers (Figure S1, Additional file 1).
Using the RARf, the RD29A promoter was scanned
again (Figure 2). Panel A shows three independent information, that are summary of our predictions ("microarray” in the panel), information from Plant Promoter
Database (ppdb), and functional analysis.
The top assembled graphs show scan data with the
RAR and RARf tables for response to drought [16],
response to ABA [17], and response to overexpression
of DREB1A, a key transcription factor for cold and
drought responses, in transgenic plants [18]. Lines show
the RAR values for each promoter while filled (blue)
bars indicate RARf values. Therefore, the open areas in
the graphs are statistically insignificant whatever the
RAR values are. According to the scan data, 5 sites,
designated as Drt1 to 5, were selected as potential cisregulatory elements for the drought response of RD29A.
By comparing the peak heights of drought, ABA, and
DREB1Aox, Drt1 and 2 are suggested to be sites for
DREB1A-related drought response, Drt3 and 5 for ABAmediated drought response, and Drt4 for drought
response not mediated by DREB1A or ABA.
The second blue line shows information form the
ppdb [19], and the database identify positions of REGs
and a TATA box in the promoter. Of the identified
REGs in the promoter, Drt4 and 5 coincide with
AtREG536 and AtREG557/472, respectively. The predicted cis-elements at the sequence level are shown in
Yamamoto et al. BMC Plant Biology 2011, 11:39
/>
Page 3 of 14
Relative Appearance Ratio (RAR)
All promoters in the genome
Co-regulated promoter set
overrepresented ?
Position from TSS (RD29A)
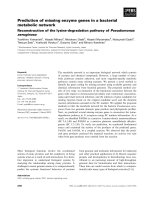
Figure 1 Scanning of a promoter by a RAR table. The Relative Appearance Ratio (RAR) that reflects the degree of overrepresentation in a
selected set of 362 up-regulated promoters over the total promoters in a genome, is prepared for all the octamers, and the RAR table was
applied to a drought-responsive promoter, RD29A. The promoter scanning was achieved by evaluation of octamers in the promoter sequence
by 1 bp-steps. Horizontal dotted line shows a height of 3.0.
Panel B. The rest Drt elements (1 to 3) do not have corresponding REGs.
The bottom purple line in the panel summarizes the
results of functional analysis reported by YamaguchiShinozaki et al. [14,15], and Narusaka et al. [15]. They
have identified four cis-regulatory elements, DRE, DREcore, and ABRE for the drought response, in addition to
AS1 (not shown) that is a functional element not
involved in the drought response.
Comparison of our predicted cis-elements (Drt1 to 5)
with those already reported revealed reasonable results
for our prediction as follows: 1) Drt1 and Drt2 are the
site of a drought-responsive element, DRE [14,15], and
include direct binding sequences of DREB1/2 [20,21], 2)
Drt3 is a drought-responsive element [15] that has less
conserved recognition sequence for DREB1/2 than Drt1/
2 [21] and 3) Drt5 is an ABA-mediated drought responsive element, ABRE [15]. In addition, less direct
reported evidence suggest as follows: 4) ABA-mediated
activation of CBF4/DREB1D by drought stress [22] does
support the idea ABA-mediated activation of RD29A via
DRE-containing Drt3, 5) Drt4 partially matches with the
barley Coupling Element 3 (CE3: AACGCGTGCCTC,
underline sequence corresponds to Drt4) that cooperatively functions in ABA response with ABRE [23],
suggesting a possible role of Drt4 in mediating ABA
response. Although a motif for CE3, prepared from barley, maize, and rice promoters, is reported to be practically absent from the Arabidopsis genome [24],
identification of a putative CE3 element from a droughtresponsive promoter may suggest that Arabidopsis also
uses CE3 with a different sequence preference from
monocots.
In summary, our cis-element prediction of the RD29A
promoter is good and there is no obvious conflict with
functional studies. These results demonstrate that the
methodology utilized provides prediction data that can
support large-scale functional analysis at a practical confidence level.
Two possible cases for cis-elements as indirect targets
When we were preparing the RARf table for DREB1Aox,
we found many ABRE-related sequences were present in
the high RARf group, in addition to the expected DRE.
For example, Table 1 shows REGs that have high RARf
values of DREB1Aox. The highest REG has a DRE
motif, but the lower ones in the table often contain the
ACGT motif, that includes ABRE. Figure 3 shows the
number of octamers that have a high RARf of DREB1Aox, and the figure also shows that both DREs and
Yamamoto et al. BMC Plant Biology 2011, 11:39
/>
A
Page 4 of 14
Position from TSS (RD29A)
-500
-400
-300
-200
Drt1
-100
Drt2 Drt3 Drt4
0
Drt5
ABA
DREB1A ox
microarray
RAR
Drought
ppdb
functional
analysis
B
Yamaguchi-Shinozaki, 1994;
Narusaka, 2003
At5G52310 RD29A Promoter
Drt1
Drt2
Drt3
TTAGGATGGAATAAATATCATACCGACATCAGTTTGAAAGAAAAGGGAAAAAAAGAAAAAATAAATAAAAGATATACTACCGACATGAGTTCCAAAAAGCAAAAAAAAAGATCAAGCCGACACAG
ATACCGACATC: Drought
Drought: ACCGACATGA
Drought: GCCGACAC
ATACCGACATC: DREB1Aox
DREB1Aox: ACCGACATGAG
ABA: AGCCGACACA
TACCGACAT: DRE
DRE: TACCGACAT
DRE-core: GCCGAC
Drt4
Drt5
ACACGCGTAGAGAGCAAAATGACTTTGACGTCACACCACGAAAACAGACGCTTCATACGTGTCCCTTTATCTCTCTCAGTCTCTCTATAAACTTAGTGAGACCCTCCTCTGTTTTACTCACAAAT
ACACGCGTAG: Drought
TACGTGTCCC: Drought
ATACGTGTCCC: ABA
ACACGCGT: AtREG536
TACGTGTC: AtREG557
TCTCTATA: AtTATA323
peak TSS: A
ACGTGTCC: AtREG472
CTCTATAA: AtTATA280
TACGTGTC: ABRE
TCTATAAA: AtTATA245
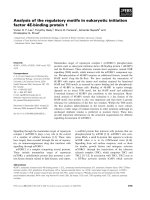
Figure 2 Analysis of the RD29A promoter. Panel A. The three graphs show scanning results based on microarray data of the drought
response (green), the ABA response (red), and DREB1A overexpressors (orange). The regions filled with the blue bar indicate the statistically
confident (P < 0.05) areas. Predicted cis-elements that are related to drought, ABA, and DREB1Aox are indicated as Drt1 to 5 (at top of the
graphs). Blue line in the middle summarizes the prediction data by the ppdb, and elements in the REG in the promoter are shown. Purple line
at the bottom shows cis-regulatory elements identified by functional analysis. Panel B. The sequence of RD29A promoter. Green, red and orange:
predicted cis-elements from promoter scanning; blue: ppdb information; purple: functionally identified cis-elements.
ACGTs are found in the high RARf group, and that
DREs are higher than ACGTs.
We put forward two hypotheses for the detection of
ABRE (Figure 4). The first hypothesis is indirect stimulation of ABRE by DREB1A (Panel A). However, the
ABA response is not suggested to be triggered by
DREB1A [25], so this hypothesis is unlikely. The fact
that there is no activation of trans-factors for ABRE,
AREB1/2/ABF3 in DREB1A overexpressors [18] also
opposes the hypothesis. The second hypothesis is the
co-existence of DRE and ABRE in a same promoter.
This can happen if these two motifs function cooperatively, or if there is no direct cooperation but they have
a biological relationship that allows for independent
DREB1A- and ABA- mediated signals on the promoter.
In order to examine the second hypothesis, we looked
at the possibility of the co-existence of RARf-positive
DRE- and ACGT-related octamers. As shown in Table
2, these two groups do co-localize with each other.
Therefore, the high RARf values of DREB1Aox for
ABRE-related octamers are suggested to be a consequence of the second hypothesis (Panel B, Figure 4).
Yamamoto et al. BMC Plant Biology 2011, 11:39
/>
Page 5 of 14
Table 1 REGs with high RARf of DREB1Aox
REG ID
Octamer
Motif
DREB1Aox
ABA
AtREG638
AGTCGGTC
DRE
9.44
5.57
0
AtREG448
ATGCCACG
4.89
3.54
1.78
AtREG453
CACGTGTA
4.81
5.47
2.36
AtREG557
GACACGTA
ACGT
4.66
8.19
3.00
AtREG472
ACGTGTCC
ACGT
4.60
11.95
3.24
AtREG478
ACGTGTCG
ACGT
4.41
10.48
5.77
AtREG489
ACGTCACG
ACGT
4.15
4.29
0
AtREG513
AtREG628
ACGTGGAC
ACACGTGA
ACGT
ACGT
3.65
3.64
3.02
2.67
0
1.90
AtREG428
ACGACACG
3.58
5.32
3.20
AtREG544
ACCACGTG
ACGT
3.51
4.35
2.48
AtREG612
GGCCCACA
GCCCA
3.33
0
0
AtREG527
AACGACAC
3.12
0
0
AtREG460
CACACGTG
3.07
5.44
A
Drought
1.96
ACGT
ACGT
Calculation of the RARf is carried out in a direction-insensitive manner.
B
Number of Octamers
A
DRE core
ACGT
30
20
10
0
>10
10 to 7
7 to 5
RARf of DREB1Aox
B
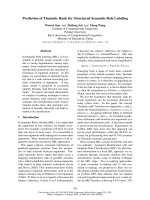
Figure 4 Possible models for the selection of an indirect target.
For both panels, site A is the direct target of a transcription factor
(TF) “A” and B is the indirect site. The figure illustrates two models
for the detection of site B, in addition to site A. Panel A. Sequential
model. One of the gene products activated by site A (’C gene’ in
the figure) targets site B. Panel B. Bystander model. Sites A and B
coexist in the same promoter and may cooperatively function to
activate the target promoter. Another possibility is that site B is not
involved in the gene activation by TF “A” but is involved in a
distinct signaling pathway, resulting in site A and B, having only a
biological relationship. A possible example of this latter case is the
coexistence of a site for an environmental response and for tissuespecific expression (e.g., light response and leaf-specific expression).
Figure 3B shows a sequence motif of the ACGT-containing octamers colocalizing with the DRE in the 760
promoters shown in Table 2. The motif has a bias
toward ABRE (PyACGTGGC, [25]) as shown at the 9th
(G) and 10th (G) positions.
Nucleotide position
Figure 3 DRE and ABRE detected by DREB1Aox. Among the
high RARf octamers for DREB1Aox, ones containing the DRE and
ACGT (ABRE) motifs were selected, and the number of the octamers
is shown according to their RARf values (A). DRE is the direct target
of DREB1A, and ABRE is not. Selected octamers containing ACGT
motif were aligned with ClustalW [37] and subjected to WebLogo
[38] (B).
Table 2 Co-localization of DRE and ACGT elements with
high RARfs of DREB1Aox
All
ACGT
ACGT ratio
All
14960
2886
19.29%
DRE
2642
760
28.77%
DRE ratio
17.66%
26.33%
The number of promoters is shown. The probability of this distribution based
on Fisher’s Exact Test is: P = 1.81E-17.
Yamamoto et al. BMC Plant Biology 2011, 11:39
/>
Page 6 of 14
Cis-element prediction for phytohormone responses
Subsequently, we analyzed microarray data of phytohormone responses in shoots. The data source is listed in
Table 3. Using the same methodology as for the analysis
of the drought response, RAR and RARf tables were calculated for each microarray data, and then octamers
with high RARf values (RARf > 3) were extracted. As
shown in Table 3, 500 to 1,400 octamers, have been
selected as having a high RARf for each phytohormone,
and in total 7,983 octamers were picked-up. This large
number might suggest the inclusion of false-positives in
spite of the filtering. The number of REGs in the predicted sequences is 53 out of 308 in total, and the prediction for the REG octamer would not be as
overestimated as for the non REG-type octamers. All
the REGs identified in these analyses are shown in
Table 4. These data will be incorporated to our promoter database, the ppdb [19] in the near future.
Evaluation of prediction
The prepared RARf tables for various hormone
responses enable cis-element predictions of hormoneresponsive promoters. Our prediction based on the
RARf tables was then evaluated with the aid of published results. Articles were surveyed reporting identification of cis-elements for hormone or drought
responses of Arabidopsis promoters. During the
search, we noticed that most of the previous articles
analyzing phytohormone-responsive promoters have
an objective of finding at least one cis-element that
enables the responses, and only a few article tried to
identify all the regulatory elements within a promoter
of interest. We selected a few articles analyzing
RD29B and PR1 promoters, in addition to ones dealing with RD29A as we have seen before. These
articles include systematic linker scan analysis or
intensive functional analysis.
Subsequently, we did promoter scan using appropriate
RARf tables (drought for RD29B and SA for PR1), and
peaks with a height over 3.0 were selected as predicted
cis-elements. Table 5 shows comparison of predicted
and experimentally confirmed cis-elements detected
from the intensively analyzed regions of the three promoters. As shown in the table, majority of the prediction fit with the experimental results ("Positive” in the
Prediction assessment column). “False positive” in the
column means these loci are predicted as cis-elements
but have conflicts with reported experimental results.
Besides real failure of prediction, we suggest two possible reasons for the disagreement. One is difference
between physiological (and experimental) conditions for
preparation of RARf tables and reported promoter analyses. Another possible reason is related to sensitivity of
detection of transcriptional responses. For example, -669
of the PR1 promoter (Table 5) was concluded as no
contribution to the salicylic acid response using the
GUS reporter (LS5) [26], but utilization of more sensitive LUC reporter could detect SA-response by LS5
[27]. This example demonstrate importance of selection
of reporter genes for assays, and documents the
reported promoter analysis may provide rather tentative
results. These possible reasons lead underestimation of
the assessment shown in Table 5.
For comparison, motif extraction by MEME and Gibbs
Sampler was achieved using the same promoter sets
used to prepare the RARf tables. As shown in the left
two columns, promoter sets of drought and SA
responses failed to detect any motifs in RD29A/B and
PR1 promoters, respectively. Further analysis showed
the promoter set of ABA response could detect some of
Table 3 Extraction of overrepresented octamers in promoters with hormone and drought responses
Ref
Selected promoter
REG number1
ABA
TAIR_ME00333 [17]
98
40
1,370
Ethylene
BL
TAIR_ME00334 [17]
TAIR_ME00335 [17]
88
82
1
0
1,162
943
Microarray
Octamer number
CK
TAIR_ME00356 [17]
165
4
1,105
Auxin
TAIR_ME00336 [17]
67
3
1,008
JA
TAIR_ME00337 [17]
254
2
577
SA
TAIR_ME00364 [17]
197
0
813
614
H2O2
Drought
DREB1A ox
any treatment
all
[39]
260
7
TAIR_ME00338 [16]
362
14
559
MEXP-2175 [18]
81
23
53
1,106
7,983
308
65,536
Data for responses in shoots or seedlings were selected. ABA: 10 uM abscisic acid for 1 h; ethylene: 10 uM ACC for 3 h; BL: 10 nM brassinolide for 3 h; CK: 1 uM
zeatin for 3 h; auxin: 1 uM IAA for 3 h; JA: 10 uM methyl jasmonate for 3 h; SA: 10 uM salycilic acid for 3 h; H2O2: 3% solution for 3 h; drought: 1 h-treatment;
DREB1Aox: constitutive overexpression of DREB1A driven by a 35S promoter. 1Count of complementary sequence is merged because REG is defined as
orientation-insensitive.
Yamamoto et al. BMC Plant Biology 2011, 11:39
/>
Page 7 of 14
Table 4 Identification of hormone-responsive REGs
REGs with high RARf values
REG ID
oct
ABA Ethylene
AtREG366
CACGTGTC
9.132
0
BL
0 0.344
0
0
0 0.492
2.747
2.631 ABA
AtREG367
CACGTGGC
6.309
0
0 0.363
0
0
0
0
2.204
2.462 ABA
AtREG371
ACGTGGCG
6.427
0
0
0
0
0
0
0
2.066
0 ABA
AtREG379
ACGTGGCA
3.464
0
0
0
0
0
0
0
1.765
2.959 ABA
AtREG382
ACACGTGG
7.351
0
0
0
0
0
0
0
2.671
0 ABA
AtREG389
ACGTGTCA
5.964
0
0
0
0
0
0
0
2.069
2.255 ABA
AtREG404
AtREG408
CCCGGCCC
CACGTGGA
0
6.095
0
0
0 4.197
0
0
0
0
0
0
0
0
0
0
0
2.406
0 CK
0 ABA
AtREG428
ACGACACG
5.324
3.294
0
0 2.283
0
0
3.203
AtREG438
ATGACACG
3.409
0
0
0
0
0
0
0
0
0 ABA
AtREG440
CACGTCAG
4.46
0
0
0
0
0
0
0
0
0 ABA
AtREG441
AACCGCGT
0
0
0
0
0
0
0
2.6
3.969
AtREG446
ATTGGCCC
0
0
0 3.137
0
0
0
0
0
AtREG448
ATGCCACG
3.538
0
0
0
0
0
0
0
1.779
AtREG450
ACGTGGCT
3.3
0
0
0
0
0
0
0
0
AtREG453
AtREG457
CACGTGTA
CCGGCCCA
5.469
0
0
0
0
0
0 4.458
0
0
2.59
0
0
0
0
0
2.355
0
4.812 ABA, DREB1Aox
0 CK
AtREG460
CACACGTG
5.438
0
0
0
0
0
0
0
1.963
3.07 ABA, DREB1Aox
AtREG464
CACGTGGG
3.333
0
0
0
3.9 3.086
0
0
0
0 ABA, Auxin, JA
AtREG466
CACGTCAC
3.689
0
0
0
0
0
0
0
0
0 ABA
AtREG468
CGTGGCAG
3.422
0
0
0
0
0
0
0
0
0 ABA
AtREG470
ACGTGTCT
5.361
0
0
0
0
0
0
0
1.964
0 ABA
AtREG471
CGTGGCGA
6.784
0
0
0
0
0
0
0
0
AtREG472
AtREG478
ACGTGTCC
ACGTGTCG
11.95
10.48
0
0
0
0
0
0
0
0
0 2.285
0
0
0
0
3.235
3.577
AtREG481
GACACGTC
5.088
0
0
0
0
0
0
0
0
AtREG488
CCGCGTTA
0
0
0
0
0
0 4.104
0
2.792
AtREG489
ACGTCACG
4.287
0
0
0
0
0
0
0
0
AtREG498
CGTGTCAC
4.889
0
0
0
0
0
0 0.205
2.059
0 ABA
AtREG502
CCGCGTGA
0
0
0
0
0
0
0
0
3.834
0 Drought
AtREG513
ACGTGGAC
3.018
0
0
0
0
0
0
0
0
AtREG515
AtREG517
ACGTCAGC
ACACGTCA
2.858
5.332
0
0
0
0
0
0
0
0
0 3.413
0
0
0
0
0
0
AtREG527
AACGACAC
0
0
0
0
0
0
0
0
0
AtREG536
ACACGCGT
6.784
0
0
0
0
0
0
0
3.214
AtREG544
ACCACGTG
4.347
0
0
0
0
0
0
0
2.484
AtREG547
ACGTGGAT
3.101
0
0
0
0
0
0
0
1.679
AtREG553
CAACGGTC
0
0
0
0
5.769
0
0
0
0
AtREG557
GACACGTA
8.185
0 2.877
0
0
0
0
0
2.998
AtREG560
AtREG562
CCGCCACG
ACGTGTAC
4.988
4.064
0
0
0
0
0
3.303
0
0
0
0
0
0
0
1.956
AtREG578
ACGTCATC
3.34
0
0
0
0
0 1.994
0
0
0 ABA
AtREG588
ACGTGTGA
3
0
0
0
0
0
0
0
0
2.722 ABA
AtREG590
AACACGTG
7.004
0
0
0
0 3.541
0.36
0
2.942
AtREG595
ACCCCTGA
0
0
0 3.817
0
0
0
0
AtREG606
ACGTGACA
3.205
0
0
0
0 1.855 2.391
0
0
0 ABA
AtREG608
AAGCCACG
3.053
0
0
0
0
0
0
0
0
0 ABA
AtREG612
AtREG615
GGCCCACA
GGGACCCA
0
4.26
0
0
0 2.858
0
0
0
0
0
0
0
0
0
0
0
0
3.327 DREB1Aox
0 ABA
AtREG628
ACACGTGA
2.672
0
0
0 2.835
0 1.888
1.899
3.637 DREB1Aox
0
0
CK Auxin
0
0
JA
0
SA H2O2 Drought DREB1Aox annotation
3.579 ABA, DREB1Aox, Ethylene,
Drought
0 Drought
0 CK
4.892 ABA, DREB1Aox
0 ABA
0 ABA
4.6 ABA, DREB1Aox, Drought
4.41 ABA, DREB1Aox, Drought
0 ABA
0 SA
4.15 ABA, DREB1Aox
3.652 ABA, DREB1Aox
0 SA
0 ABA
3.122 DREB1Aox
0 ABA, Drought
3.506 ABA, DREB1Aox
0 ABA
0 Auxin
4.66 ABA, DREB1Aox
0 ABA
0 IN tabl
0 ABA, JA
0 CK
Yamamoto et al. BMC Plant Biology 2011, 11:39
/>
Page 8 of 14
Table 4 Identification of hormone-responsive REGs (Continued)
AtREG631
CGCGTGAA
0
0
0
0
0
0
0
0
3.332
AtREG638
AGTCGGTC
5.571
0
0
0
0
0 2.771
0
0
AtREG646
CGTAATTA
3.016
0
0
0
0
0
0
0
0
0 Drought
9.436 DREB1Aox, ABA
0 ABA
Data of the complementary sequence is merged.
the cis-elements in RD29A and RD29B promoters.
These comparisons revealed considerably higher sensitivity of the RARf-based approach than conventional
MEME and Gibbs Sampler.
Results shown in Table 5 are summarized in Table 6.
The table shows efficient success rate (58 ~ 67%) and
high sensitivity (Cover rate, 88 ~ 89%). These results
demonstrate our prediction based on the prepared RARf
tables are well effective, and useful as a guide for experimental promoter analysis.
We then checked if the high RARf octamers contained
the sequences expected. Table 7 shows a list of transcription factor-recognition sequences. According to our
current knowledge, the ABA response is in part
mediated by ABRE, an ACGT-related motif, the auxin
response by AuxRE, and the ethylene response by the
GCC box. Classification of high RARf octamers by these
motifs revealed complex results (Figure 5A). This complexity is due in part to the intricate nature of the transcription network, and also to the detection of indirect
cis-elements.
Elevation of the cut-off value for the RARf from 3 to 5
resulted in a reduction in octamer numbers, and a
change in distributions along motifs, resulting in clearer
characteristics for each group of response (Panel B).
Panel B shows the result as follows: the most major
octamers for the ABA response have the ACGT motif,
and the ones for DREB1Aox have DRE. The most major
octamers for ethylene and auxin were expected to be
the GCC box and AuxRE, respectively, but this was not
Table 5 Verification of prediction by experimental analysis
AGI code
Position
from
TSS1
Predicted ciselement
RARf
REG
Prediction Reference4 Response Element
assessment
name
MEME
Gibbs
Sampler
Drought2 SA3
AT5G52310
(RD29A)
ATACCGACATCA
Positive
YamaguchiShinozaki,
1994
Drought
DRE
No
detect.
No
detect.
3.94
ACTACCGACATGAG
Positive
Narusaka,
2003
Drought
DRE
No
detect.
No
detect.
-137
4.22
AAGCCGACACA
Positive
Narusaka,
2003
Drought
DRE-core
No
detect.
No
detect.
-125
3.76
ACACGCGTAGA
?5
Narusaka,
2003
Drought
No
detect.
-82
3.44
ACAGACGC
False
positive
YamaguchiShinozaki,
1994
Drought
No
detect
No
detect
-71
5.01
ATACGTGTCCCT
AtREG557,472
Positive
Narusaka,
2003
Drought
No
detect.
No
detect.7
-163
3.16
CGTACGTGTCA
AtREG450
False
positive
Uno, 2000
Drought
No
detect
No
detect7
-137
*
Absent7
Uno, 2000
Drought
ABRE
No
detect.
No
detect.7
-112
AT2G14610
(PR1)
3.12
-175
AT5G52300
(RD29B)
-231
3.21
Positive
Uno, 2000
Drought
ABRE
No
detect.
No
detect.
6
GTACGTGTCA
AtREG536
AtREG557,
389
ABRE
7
No
detect.
7
3.82
ACGTCACT
Positive
Pape, 2010
INA /SA
LS5
No
detect.
No
detect.
-657
6.38
TACTTACGTCAT
Positive
Lebel, 1998;
Pape, 2010
INA6/SA
LS7
No
detect.
No
detect.
-607
1
-669
3.65
TAGGCAAG
False
positive
Lebel, 1998
INA6/SA
No
detect
No
detect
Position from major TSS data from ppdb. 21 h-treatment. 3See Table 3 for experimental conditions. 4Source of functional analysis. *RARf for ABA response is 3.7.
Lack of the corresponding functional data. 6INA: 2,6-dichloro isonicotinic acid, a SA analog. 7Detected with the promoter set of ABA response. For analysis of
RD29B by MEME and Gibbs Sampler, it was included to the applied promoter set. Promoter scan for prediction was achieved for the regions where linker scan or
intensive functional analyses were achieved, and peaks with RARf > 3.0 were selected as prediction. Utilized RARf tables are shown in the table.
5
Yamamoto et al. BMC Plant Biology 2011, 11:39
/>
Page 9 of 14
Table 6 Summary of prediction assessment
Method
Prediction
Positive
False positive
Absent
Success rate
Cover rate
RARf-based scan
12
7
3
1
58~67%
88~89%
MEME
0
0
0
9
0%
0%
Gibbs Sampler
0
0
0
9
0%
0%
Results of Table 5 are summarized.
the case. One possible reason for this is the difference in
stringency for each motif. For example, ACGT and
CGCG are tetramers, but AuxRE and the GCC box are
defined as heptamers, so comparison of octamer numbers with these motifs is not fair. In order to overcome
such inequalities, high RARf octamers were re-organized
according to each motif (Panel C). The panel shows that
the highest octamer number for ACGT comes from
ABA, and DRE from DREB1Aox, again giving reasonable
results. The number of octamers for AuxRE and the
GCC box groups is much fewer than for the groups of
ACGT or DRE, as expected. The highest numbers for
AuxRE and the GCC box come from treatments including auxin and ethylene, respectively. GCCCA, an element
for cell proliferation-dependent expression [6], contains
CK (cytokinin) as the most major response group. All
these results (asterisked in Panel C) revealed our prediction is good, and agrees with our current knowledge on
transcriptional responses to phytohormones.
Preparation of reliable RARf tables allows us to scan
native promoters. We next scanned 622 promoters that
showed 5-fold or more activation by phytohormones
with the corresponding RARf tables. The combination
of the scanned promoters and applied RARf tables is
shown in Table S1 (Additional file 2), and all the high
RARf regions (> 3) of the analyzed promoters are shown
in Table S2 (Additional file 3). The table also gives
information of the corresponding positions, sequences,
REG IDs, and also the presence of transcription factorrecognition motifs listed in Table 7. The prediction data
for the 622 hormone-activated promoters helps functional analysis of individual promoters, and also evaluation of sequence polymorphism among accessions in
these promoters.
Possible crosstalk
There are two types of signaling crosstalk that can be
observed in the promoter region: 1) merging of two distinct signals on a cis-element, and 2) merging of two
signals on a promoter by the co-existence of corresponding cis-elements. In this report, we provide information for the former situation by analyzing native
promoters that show hormone responses.
From the scanned data of 622 native promoters, we
extracted overlapping octamers with high RARf values for
multiple RARf tables. Table S3 (Additional file 4) shows
all the overlapping high RARf octamers whose distance is
4 bp or less. The obtained data was summarized in Figure
6. From the data, we suggest three examples of predicted
crosstalk as indicated in the graph. 1) ABA ~ Drought ~
DREB1Aox. This crosstalk is biologically reasonable, as we
have seen during the analysis of the RD29A promoter. 2)
Ethylene ~ Auxin. In agreement with the predicted crosstalk, two types of regulation of the auxin response by ethylene are known. One is activation of auxin biosynthesis by
ethylene [3,28], and the other is elevation of auxin concentration by modulation of auxin transport by ethylene
[3,29]. 3) SA ~ H2O2. SA-induction of H2O2 accumulation
is reported [30]. Again, these analyses suggest the prediction of cis-elements is reliable.
Framework for cis-element prediction
Figure 7 illustrates a framework for cis-element prediction developed in this study. As shown, microarray data
and promoter sequence are used for the promoter scan.
The REG and also the sequence of core promoter elements are derived from the ppdb, and this information
is added to high RARf octamers. The promoter scan
data is the final output of the analysis.
Discussion
Confirmation of our established prediction scheme,
although not a novel methodology, has revealed that the
output prediction data is reasonable and acceptable as a
working hypothesis for experimental verification. Our
predictions have been shown to include indirect targets
in addition to direct ones (Figure 3, 4, and Table 2), but
this problem can be handled more easily if users are
aware of it. One possible approach to avoid indirect targets might be by the utilization of a more stringent
threshold for RARf. However, we suggest that this
approach is not practical because the population of high
RARf octamers varies considerably according to the
microarray experiment. For example, while many DREcontaining octamers have RARf values of DREB1Aox
between 10 and 5, there are few octamers in such a
range for drought response. We suggest that this variation in octamer population reflects the physiological
complexity of the response. According to this idea, the
drought response is more complex and diverse than that
of to DREB1A overexpression. In short, fine-tuning of
the cutoff value for RARf values should be done for
Yamamoto et al. BMC Plant Biology 2011, 11:39
/>
Page 10 of 14
Table 7 List of transcription factor-recognition motifs
Motif
name
Transcription factors
Motif
Response
Reference
ACGT
bZIP, PIF, bHLH
ACGT
ABA (ABRE), various environmental stimuli including light (G box) and biotic
stress (G box)
[40]
DRE
DREB1/2 (ERF/AP2
subfamily)
CCGAC
Cold, drought
[25]
CGCG
AtSR
CGCG1
Various stresses
[41]
Myc
Dof
Myc
Dof
CANNTG
AAAG
ABA
Various regulation
[42]
[43]
GCCCA
TCP
GCCCA
Meristematic expression
[6]
H box
MYB
CCTACC
Biotic stress
[44]
Biotic stress, ABA, senescence
[45]
W box
WRKY
TTGAC(C/T)
AACCGG
unknown
AACCGG
AuxRE
ARF
TGTCTC
Auxin
[46]
GCC box
ERF/AP2
AGCC(A/G)
CC
Ethylene, biotic stress
[44]
[6]
1
Defined in this study.
each RARf table, and thus is not an easy approach. Our
solution is to set a rather loose threshold (RARf > 3)
and then for users to carefully interpret the prediction.
This strategy can keep high sensitivity.
MEME and Gibbs Sampler are popular extraction
methods of motifs that appear in an input sequence set.
Because they are not good at detection of minor motifs
in the input population, preparation of precise (not too
large) size of the input where majority of the population
have the target motifs is critical for successful extraction. In this point of view, it would be reasonable that
they could detect some of the motifs in RD29A/B promoters using the ABA-responsive set but failed using
the drought-responsive one, because drought stress
would activate much more dispersed signaling pathways
than ABA application. Remarkably, our RARf-based prediction could detect cis-elements using the droughtresponsive set with high sensitivity (88 ~ 89%), demonstrating superiority of the RARf-based comparative
approach in sensitivity and thus utility.
While promoter scanning with RARf tables is a straightforward way for the analysis of specific promoters of interest, there is a benefit. The scanning method can reduce
false-positive sequences in the RARf tables, because octamers that do not exist in the analyzed promoters are
neglected. In this article, we set a differential selection of
promoters for the preparation of the RARf tables (> 3 fold
activation in gene expression) and for scanned promoter
sets (> 5 fold). This differential selection is a strategy to
remove some of the false-positive octamers.
As a huge collection of plant microarray data
(ArrayExpress) has been established, our analysis
scheme, shown in Figure 7, allows us to predict cis-elements not just for hormone responses. Although functional validation of predicted cis-elements needs to be
done by specialized plant physiologists in each research
field, the prediction itself can be done by non-specialists,
allowing extensive prediction that can support wide
aspects of plant physiological studies.
In order to prove the biological roles of the predicted ciselements, the elements need to be subjected to experimental verification. This can be achieved in two ways: loss-offunction experiments by introducing point mutations into
the target promoters, and gain-of-function experiments
using a synthetic promoter approach. The experimental
methodologies for both approaches have been well paved,
so there will be no technical problems in the verification.
Our prediction data for phytohormone responses is therefore expected to be utilized for such experimental analyses.
In our preliminary experiments for the identification of ciselements for toxic aluminum ion responses in roots, accuracy of our de novo prediction is suggested to be high, just
as in the case of the RD29A promoter (Kobayashi Y, Yamamoto YY, and Koyama H, unpublished results).
RD29A is one of the most intensively analyzed promoters whose function has been studied for more than a
decade [25]. Therefore, we were surprised to find a
novel putative cis-element (Drt4) that has not been
noticed in previous experimental analyses. These findings may suggest that with the established promoter
analysis, even if it is intensively done, there is the possibility that functional elements may be overlooked. This
idea should not be surprising, because traditional promoter analysis (5’ deletions, gain-of-function-experiments by core promoter swaps and point mutations) is
designed to identify at least one functional elementfor
the expected biological response, and not to determine
the entire promoter structure. In order to understand
the entire promoter structure, we suggest that bioinformatics-guided analysis is now indispensable.
Yamamoto et al. BMC Plant Biology 2011, 11:39
/>
1000
A
Page 11 of 14
RARf > 3
ACGT
DRE
CGCG
MYC
Dof
GCCCA
H box
W
AACCGG
AuxRE
GCC box
Number of octamers
100
10
1
0
ABA
Number of octamers
100
B
Ethylene
BL
CK
Auxin
JA
H2O2
SA
Drought DREB1Aox
RARf > 5
ACGT
DRE
CGCG
MYC
Dof
GCCCA
H box
W
AACCGG
AuxRE
GCC box
10
1
0
ABA
Number of octamers
100
* C
Ethylene
BL
CK
Auxin
JA
SA
H2O2
Drought DREB1Aox
RARf*> 5
*
ABA
Ethylene
*
10
BL
CK
Auxin
*
1
*
JA
SA
H2O2
Drought
DREB1Aox
0
ACGT
DRE
CGCG
MYC
Dof
GCCCA
H box
W
AACCGG AuxRE GCC box
Figure 5 Recognition motifs by transcription factors of high RARf octamers. The number of high RARf octamers is shown in regard to
sequence motifs. A. Octamers with RARf values of more than 3 are shown according to phytohormone responses. B. Octamers with RARf values
of more than 5 are shown according to phytohormone responses. C. Octamers with RARf values of more than 5 are shown according to
sequence motifs. Data marked with asterisks are mentioned in the text.
Yamamoto et al. BMC Plant Biology 2011, 11:39
/>
Page 12 of 14
Figure 6 Possible crosstalk at predicted cis-elements. The number of octamers that were coincidently detected by two phytohormone responses
is shown. When the distance of two octamers is 4 pb or less, they were counted as having coincident localization. The numbers at the top of bars
(1 to 3) indicate the following crosstalk, and are mentioned in the text. 1: ABA ~ Drought ~ DREB1Aox, 2: Ethylene ~ Auxin, 3: SA ~ H2O2.
Conclusions
In this study, we utilized Arabidopsis microarray data to
predict cis-regulatory elements for ABA, auxin, brassinolide, cytokinin, ethylene, jasmonic acid, salicylic acid,
and hydrogen peroxide, in addition to drought response
and DREB1A-mediated gene activation, from total 622
responsive promoters. These results provide opportunities to analyze promoter function by predictionoriented approaches. Microarray data is also utilized to
give annotation of REGs, that have been predicted as
cis-regulatory elements dependent of promoter position
in our previous analysis. The annotated REGs will be
used in ppdb, Plant Promoter Database.
Methods
Promoter sequence
Promoter sequences from -1,000 to -1 relative to the
major TSS were prepared for 14,960 Arabidopsis genes.
The major TSS was determined by large scale TSS tag
sequencing [8] or 5’ end information of RAFL cDNA
clones [19,31]. The Arabidopsis genome sequence and
its gene models were obtained from TAIR [32].
Preparation of RAR tables and promoter scanning
Microarray data (Table 3) was used to prepare lists of
genes that showed expression of more than 3.0 fold
above the control. Treatments that gave high RAR
values with lower P values were selected. The RAR for
each octamer was calculated from the following formula
using home-made C ++ and Perl programs, and also
Excel (Microsoft Japan, Tokyo).
RAR = (count in an activated promoter set/number of
promoters in the set)/(count in total promoters/number
of total promoters)
For each octamer-RAR combination, the P value was
calculated by Fisher’s Exact Test. The P values were
transformed into LOD scores, and RAR values with a
LOD score of less than 1.3 (P = 0.05) were filtered out
to set as 0. The masked RAR values are referred to as
RARf values in this report. RAR and RARf values for
Yamamoto et al. BMC Plant Biology 2011, 11:39
/>
microarray data
promoter sequence
frequency comparison
ltering with P value
selection of
scanned
promoters
Page 13 of 14
RAR/ RARf
table
Additional material
genome sequence
gene model
TSS data
Additional file 1: Figure S1: Filtering of octamers by RARf. Number
of octamers showing high RAR values (> 3) is shown regarding total
count of each octamers among 14,498 genic promoters. Rare octamers
in the promoter region are shown to be filtered out by this statistical
evaluation.
Additional file 2: Table S1: List of scanned promoters. Combinations
of promoters and RARf tables used for promoter scan are shown. Totally
622 promoters that show response to any phytohormones were selected
for the scanning. All the detected signals are shown in Additional file 2
(Table S2).
ppdb
Additional file 3: Table S2: Peaks of the scanned promoters. All the
peaks detected by 730 scanning data for the 622 promoters shown in
Additional file 2 (Table S1) were extracted and shown. Position means
distance from the major TSS used in ppdb. Corresponding REG ID and
recognition motif are also indicated.
promoter scan
can
Additional file 4: Table S3: Possible cross-talk at regulatory
elements. Coincident detection by two different RARf tables is shown. If
distance of two peaks by different RARf tables is within 4 bp, they are
considered as co-localized and incorporated into the table. Totally 1188
co-localized peaks were detected. Position means distance from the
major TSS used in ppdb. This table is the basis of Figure 6.
cis-element prediction
Figure 7 Data flow of our prediction. The data sources of the
analysis are microarray data, promoter sequence, and ppdb data
based on LDSS analysis. The possible outputs of the analysis are a
list of high RARf octamers, promoter scan data, and a list of high
RARf regions in the scan data.
the REG annotation (Table 4) were calculated in a direction-insensitive manner, where information of the complementary octamer was merged.
Promoter scanning with RAR, RARf and LOD tables
was achieved using homemade-Perl scripts and Excel.
Promoters used for scanning showed over 5 fold-activation by hormone treatments. Cut-off value of RARf was
set as 3.0 in order to pick up all the potential cis-elements, leaving the other sequences that are not worth
further analysis. Because of this selection policy, secondary selection after promoter scanning is necessary for
more reliable prediction. Threshold for the selection
should be determined according to the utilized microarray experiments and also scanned promoters.
The same promoter sets used for preparation of RAR/
RARf tables were applied to motif extraction by MEME
and Gibbs Sampling methods at Melina II [13,33].
Motif expression by WebLogo
Selected ACGT-containing octamers were aligned with
ClustalW [34], considering counts of appearance, and
subsequently subjected to WebLogo for the sequence
logo expression as shown in Figure 3B[35].
Data release
The promoters containing the REGs shown in Table 4
can be viewed at the ppdb (Plant Promoter Database,
[19,36]). The REGs’ annotation describing their possible roles (Table 4) will be incorporated into the ppdb
in the near future. Raw scanning data of the 622 hormone-activated promoters will be supplied upon
request.
List of abbreviations
ABA: abscisic acid; ABRE: ABA responsive element; BL: brassinolide; CK:
cytokinin; DRE: drought responsive element; INA: 2,6-dichloro isonicotinic
acid; JA: jasmonic acid; RAR: relative appearance ratio; RARf: relative
appearance ratio filtered; SA: salicylic acid; TSS: transcription start site.
Acknowledgements
We would like to acknowledge Dr. Yoh Sakuma of Ehime University for
critical reading of the manuscript and useful discussions about drought- and
ABA-responsive elements. We also thank Ms. Ayaka Hieno for surveying
articles. This work is in part supported by a Grant-in-Aid for Scientific
Research (A to HK; B to MH; A and B to YYY) from MEXT.
Author details
Faculty of Applied Biological Sciences, Gifu University, Yanagido 1-1, Gifu
City, Gifu 501-1193, Japan. 2Japan International Research Center for
Agricultural Sciences, Ohwashi 1-1, Tsukuba, Ibaraki 305-8686, Japan.
1
Authors’ contributions
YYY designed and performed the analyses. YY and HM prepared public
microarray data for calculation of RAR/RARf tables. KM and KYS prepared
microarray data of DREB1Aox. MT and HK helped calculation of P-values for
RARf preparation. All authors read and approved the final manuscript.
Received: 30 November 2010 Accepted: 24 February 2011
Published: 24 February 2011
References
1. Taiz L, Zeiger E: Cytokinins: regulators of cell divition. Plant Physiol. 4
edition. Sunderland, MA, USA: Sinauer Associates Inc. Publishers; 2006,
544-569.
2. Lovegrove A, Hooley R: Gibberellin and abscisic acid signalling in
aleurone. Trends Plant Sci 2000, 5(3):102-110.
3. Ruzicka K, Ljung K, Vanneste S, Podhorska R, Beeckman T, Friml J,
Benkova E: Ethylene regulates root growth through effects on auxin
biosynthesis and transport-dependent auxin distribution. Plant Cell 2007,
19(7):2197-2212.
4. Bari R, Jones JD: Role of plant hormones in plant defense responses.
Plant Mol Biol 2009, 69(4):473-488.
5. Truman WM, Bennett MH, Turnbull CG, Grant MR: Arabidopsis auxin
mutants are compromised in systemic acquired resistance and exhibit
aberrant accumulation of various indolic compounds. Plant Physiol 2010,
152(3):1562-1573.
Yamamoto et al. BMC Plant Biology 2011, 11:39
/>
6.
7.
8.
9.
10.
11.
12.
13.
14.
15.
16.
17.
18.
19.
20.
21.
22.
23.
24.
25.
Yamamoto YY, Ichida H, Matsui M, Obokata J, Sakurai T, Satou M, Seki M,
Shinozaki K, Abe T: Identification of plant promoter constituents by
analysis of local distribution of short sequences. BMC Genomics 2007,
8:67.
Yamamoto YY, Obokata J: Extraction of position-sensitive promoter
constituents. In Computational biology: new research. Edited by: Russe AS.
Hauppauge, NY: Nova Science Publishers; 2009:361-373.
Yamamoto YY, Yoshitsugu T, Sakurai T, Seki M, Shinozaki K, Obokata J:
Heterogeneity of Arabidopsis core promoters revealed by high density
TSS analysis. Plant J 2009, 60:350-362.
FitzGerald PC, Shlyakhtenko A, Mir AA, Vinson C: Clustering of DNA
sequences in human promoters. Genome Res 2004, 14(8):1562-1574.
Thijs G, Marchal K, Lescot M, Rombauts S, De Moor B, Rouze P, Moreau Y: A
Gibbs sampling method to detect overrepresented motifs in the
upstream regions of coexpressed genes. J Comput Biol 2002, 9(2):447-464.
Lawrence CE, Altschul SF, Boguski MS, Liu JS, Neuwald AF, Wootton JC:
Detecting subtle sequence signals: a Gibbs sampling strategy for
multiple alignment. Science 1993, 262(5131):208-214.
Bailey TL, Elkan C: Fitting a mixture model by expectation maximization
to discover motifs in biopolymers. Proc Int Conf Intell Syst Mol Biol 1994,
2:28-36.
Okumura T, Makiguchi H, Makita Y, Yamashita R, Nakai K: Melina II: a web
tool for comparisons among several predictive algorithms to find
potential motifs from promoter regions. Nucleic Acids Res 2007, , 35 Web
Server: W227-231.
Yamaguchi-Shinozaki K, Shinozaki K: A novel cis-acting element in an
Arabidopsis gene is involved in responsiveness to drought, lowtemperature, or high-salt stress. Plant Cell 1994, 6(2):251-264.
Narusaka Y, Nakashima K, Shinwari ZK, Sakuma Y, Furihata T, Abe H,
Narusaka M, Shinozaki K, Yamaguchi-Shinozaki K: Interaction between two
cis-acting elements, ABRE and DRE, in ABA-dependent expression of
Arabidopsis rd29A gene in response to dehydration and high-salinity
stresses. Plant J 2003, 34(2):137-148.
Kilian J, Whitehead D, Horak J, Wanke D, Weinl S, Batistic O, D’Angelo C,
Bornberg-Bauer E, Kudla J, Harter K: The AtGenExpress global stress
expression data set: protocols, evaluation and model data analysis of
UV-B light, drought and cold stress responses. Plant J 2007, 50(2):347-363.
Goda H, Sasaki E, Akiyama K, Maruyama-Nakashita A, Nakabayashi K, Li W,
Ogawa M, Yamauchi Y, Preston J, Aoki K, et al: The AtGenExpress hormone
and chemical treatment data set: experimental design, data evaluation,
model data analysis and data access. Plant J 2008, 55(3):526-542.
Maruyama K, Sakuma Y, Kasuga M, Ito Y, Seki M, Goda H, Shimada Y,
Yoshida S, Shinozaki K, Yamaguchi-Shinozaki K: Identification of coldinducible downstream genes of the Arabidopsis DREB1A/CBF3
transcriptional factor using two microarray systems. Plant J 2004,
38(6):982-993.
Yamamoto YY, Obokata J: ppdb, a plant promoter database. Nucleic Acids
Res 2008, 36:D977-981.
Liu Q, Kasuga M, Sakuma Y, Abe H, Miura S, Yamaguchi-Shinozaki K,
Shinozaki K: Two transcription factors, DREB1 and DREB2, with an EREBP/
AP2 DNA binding domain separate two cellular signal transduction
pathways in drought- and low-temperature-responsive gene expression,
respectively, in Arabidopsis. Plant Cell 1998, 10(8):1391-1406.
Sakuma Y, Liu Q, Dubouzet JG, Abe H, Shinozaki K, Yamaguchi-Shinozaki K:
DNA-binding specificity of the ERF/AP2 domain of Arabidopsis DREBs,
transcription factors involved in dehydration- and cold-inducible gene
expression. Biochem Biophys Res Commun 2002, 290(3):998-1009.
Haake V, Cook D, Riechmann JL, Pineda O, Thomashow MF, Zhang JZ:
Transcription factor CBF4 is a regulator of drought adaptation in
Arabidopsis. Plant Physiol 2002, 130(2):639-648.
Shen Q, Zhang P, Ho TH: Modular nature of abscisic acid (ABA) response
complexes: composite promoter units that are necessary and sufficient
for ABA induction of gene expression in barley. Plant Cell 1996,
8(7):1107-1119.
Gomez-Porras JL, Riano-Pachon DM, Dreyer I, Mayer JE, Mueller-Roeber B:
Genome-wide analysis of ABA-responsive elements ABRE and CE3
reveals divergent patterns in Arabidopsis and rice. BMC Genomics 2007,
8:260.
Yamaguchi-Shinozaki K, Shinozaki K: Organization of cis-acting regulatory
elements in osmotic- and cold-stress-responsive promoters. Trends Plant
Sci 2005, 10(2):88-94.
Page 14 of 14
26. Lebel E, Heifetz P, Thorne L, Uknes S, Ryals J, Ward E: Functional analysis of
regulatory sequences controlling PR-1 gene expression in Arabidopsis.
Plant J 1998, 16(2):223-233.
27. Pape S, Thurow C, Gatz C: The Arabidopsis thaliana PR-1 Promoter
Contains Multiple Integration Sites for the Co-activator NPR1 and the
Repressor SNI1. Plant Physiol 2010.
28. Yoo SD, Cho Y, Sheen J: Emerging connections in the ethylene signaling
network. Trends Plant Sci 2009, 14(5):270-279.
29. Negi S, Ivanchenko MG, Muday GK: Ethylene regulates lateral root
formation and auxin transport in Arabidopsis thaliana. Plant J 2008,
55(2):175-187.
30. Rao MV, Paliyath G, Ormrod DP, Murr DP, Watkins CB: Influence of salicylic
acid on H2O2 production, oxidative stress, and H2O2-metabolizing
enzymes. Salicylic acid-mediated oxidative damage requires H2O2. Plant
Physiol 1997, 115(1):137-149.
31. Seki M, Narusaka M, Kamiya A, Ishida J, Satou M, Sakurai T, Nakajima M,
Enju A, Akiyama K, Oono Y, et al: Functional annotation of a full-length
Arabidopsis cDNA collection. Science 2002, 296(5565):141-145.
32. TAIR. [ />33. Melina II. [ />34. ClustalW. [ />35. WebLogo. [ />36. ppdb. [].
37. Thompson JD, Higgins DG, Gibson TJ: CLUSTAL W: improving the
sensitivity of progressive multiple sequence alignment through
sequence weighting, position-specific gap penalties and weight matrix
choice. Nucleic Acids Res 1994, 22(22):4673-4680.
38. Crooks GE, Hon G, Chandonia JM, Brenner SE: WebLogo: a sequence logo
generator. Genome Res 2004, 14(6):1188-1190.
39. Yamamoto YY, Shimada Y, Kimura M, Manabe K, Sekine Y, Matsui M,
Ryuto H, Fukunishi N, Abe T, Yoshida S: Global classification of
transcriptional responses to light stress in Arabidopsis thaliana.
Endocytobio Cell Res 2004, 15:438-452.
40. Foster R, Izawa T, Chua NH: Plant bZIP proteins gather at ACGT elements.
Faseb J 1994, 8(2):192-200.
41. Yang T, Poovaiah BW: A calmodulin-binding/CGCG box DNA-binding
protein family involved in multiple signaling pathways in plants. J Biol
Chem 2002, 277(47):45049-45058.
42. Urano K, Kurihara Y, Seki M, Shinozaki K: ’Omics’ analyses of regulatory
networks in plant abiotic stress responses. Curr Opin Plant Biol 2010,
13(2):132-138.
43. Yanagisawa S: Dof domain proteins: plant-specific transcription factors
associated with diverse phenomena unique to plants. Plant Cell Physiol
2004, 45(4):386-391.
44. Gurr SJ, Rushton PJ: Engineering plants with increased disease resistance:
how are we going to express it? Trends Biotechnol 2005, 23(6):283-290.
45. Rushton PJ, Somssich IE, Ringler P, Shen QJ: WRKY transcription factors.
Trends Plant Sci 2010, 15(5):247-258.
46. Ulmasov T, Hagen G, Guilfoyle TJ: Dimerization and DNA binding of auxin
response factors. Plant J 1999, 19(3):309-319.
doi:10.1186/1471-2229-11-39
Cite this article as: Yamamoto et al.: Prediction of transcriptional
regulatory elements for plant hormone responses based on microarray
data. BMC Plant Biology 2011 11:39.
Submit your next manuscript to BioMed Central
and take full advantage of:
• Convenient online submission
• Thorough peer review
• No space constraints or color figure charges
• Immediate publication on acceptance
• Inclusion in PubMed, CAS, Scopus and Google Scholar
• Research which is freely available for redistribution
Submit your manuscript at
www.biomedcentral.com/submit