báo cáo khoa học: " Relative expression of genes of terpene metabolism in different tissues of Artemisia annua L" pot
Bạn đang xem bản rút gọn của tài liệu. Xem và tải ngay bản đầy đủ của tài liệu tại đây (2.07 MB, 12 trang )
RESEARCH ARTICLE Open Access
Relative expression of genes of terpene
metabolism in different tissues of Artemisia
annua L
Linda Olofsson, Alexander Engström, Anneli Lundgren, Peter E Brodelius
*
Abstract
Background: Recently, Artemisia annua L. (annual or sweet wormwood) has received increasing attention due to
the fact that the plant produces the sesquiterpenoid endoperoxide artemisinin, which today is widely used for
treatment of malaria. The plant produces relatively small amounts of artemisinin and a worldwide shortage of the
drug has led to intense research in order to increase the yield of artemisinin. In order to improve our
understanding of terpene metabolism in the plant and to evaluate the competition for precursors, which may
influence the yield of artemisinin, we have used qPCR to estimate the expression of 14 genes of terpene
metabolism in different tissues.
Results: The four genes of the artemisinin biosynthetic pat hway (amorpha-4,11-diene synthase, amorphadiene-12-
hydroxylase, artemisinic alde hyde Δ11(13) reductase and aldehyde dehydrogenase 1) showed remarkably higher
expression (between ~40- to ~500-fold) in flower buds and young leaves compared to other tissues (old leaves,
stems, roots, hairy root cultures). Further, dihydroartemisinic aldehyde reductase showed a very high expression
only in hairy root cultures. Germacrene A and caryophyllene synthase were mostly expressed in young leaves and
flower buds while epi-cedrol synthase was highly expressed in old leaves. 3-Hydroxy-3-methyl-glutaryl coenzyme A
reductase exhibited lower expression in old leaves compared to other tissues. Farnesyldiphosphate synthase,
squalene synthase, and 1-deoxy-D-xylulose-5-phosphate reductoisomerase showed only modest variation in
expression in the different tissues, while expression of 1-deoxy-D-xylulose-5-phosphate synthase was 7-8-fold
higher in flower buds and young leaves compared to old leaves.
Conclusions: Four genes of artemisinin biosynthesis were highly expressed in flower buds and young leaves
(tissues showing a high density of glandular trichomes). The expression of dihydroartemisinic aldehyde reductase
has been suggested to have a negative effect on artemisinin production through reduction of dihydroartemisinic
aldehyde to dihydroartemisinic alcohol. However, our results show that this enzyme is expressed only at low levels
in tissues producing artemisinin and consequently its effect on artemisinin production may be limited. Finally,
squalene synthase but not other sesquiterpene synthases appears to be a significant competitor for farnesyl
diphosphate in artemisinin-producing tissues.
Background
The genus Artemisia, belonging to the Asterac eae family,
contains a large number of aromatic plants. During the
latest decades, A. annua L. (annual or sweet wormwood)
has received increasing attention due to the fact that the
plant produces the sesquiterpenoid endoperoxide artemi-
sinin, which today is widely used for the treatment of
malaria [1]. The plant produce relatively small amounts
of artemisinin and a worldwide shortage of the drug has
led to intense research in order to increase the yield of
artemisinin in the plant or to develop alternative meth-
ods of artemisinin production [2]. Artemisinin and a
number of other terpenoids are produced in glandular
secretory trichomes present on aerial surfaces of the
plant. The glandular trichomes are 10-cell structures
with three pairs of secretory cells [3]. The apical cells are
transparent proplastid- or leucoplast-containing cells,
* Correspondence:
School of Natural Sciences, Linnaeus University, SE-39182 Kalmar, Sweden
Olofsson et al. BMC Plant Biology 2011, 11:45
/>© 2011 Olofsson et al; licensee BioMed Central Ltd. This is an Open Access article distributed unde r the terms of the Creative
Commons At tribution License ( which permits unrestricted use , distribut ion, and
reproduction in any medium, provided the original work is pr oper ly cited.
and the two cell pairs below the apical cel ls, the sub-api-
cal cells, are green chloroplast-containing cells. The sub-
stances that are produced in these cells are excreted into,
and stored in the subcuticular sac, which is covering the
secretory cells [3]. This has led to the focus on these
structures when studying genes involved in terpene bio-
synthesis in general and for artemisinin biosynthesis in
particular.
The major components of the essential oil from A.
annua are mono- and sesquiterpenes produced in tri-
chomes [4]. The large number of structurally different
terpenoids indicates that several mono- and sesquiter-
pene synthases are expressed in A. annua.Infact,sofar
five different sesquiterpene synthases (epi-cedrol synthase
(ECS) [5], amorpha-4,11-diene synthase (ADS) [6]; b-car-
yophyllene synthase (CPS) [7], germacrene A synthase
(GAS) [8] and b-farnesene synthase (BFS) [9] have been
cloned from the plant. However, it is likely that addi-
tional sesquiterpene synthases are expressed in A. annua
since other classes of sesquiterpenes such as eudesmanes
(e.g. b-selinene), guaianes (e.g. a-guaiene), longipinanes
(e.g. b-longipinene) and santalanes (e.g. a-santalol) have
been isolated from the plant [10]. All these sesquiterpene
synthasesmaycompeteforthesamesubstrate,farnesyl
diphosphate (FDP), which is a precursor of artemisinin.
Consequently, the activity of various sesquiterpene
synthases may influence the yield of artemisinin in the
plant. In addition, FDP is used for the synthesis of squa-
lene, which is the precursor of sterols and triterpenes.
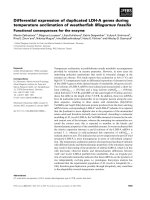
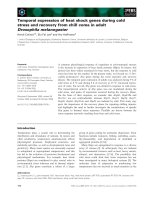
Figure 1 shows the biosynthetic pathway leading to
artemisinin as it is understood today along with other
pathways of terpene metabolism in A. annua.Thefirst
committed step in artem isinin biosynthesis is the conver-
sion of FDP to amorpha-4,11-diene by ADS [6,11]. In the
following step, amorpha-4,11-diene is hydroxy lated to
yield artemisinic alcohol. This reaction is catalyzed by a
cytochrome P450 dependent hydroxylase (CYP71AV1)
[12]. This enzyme can also oxidize the alcohol to artemi -
sinic aldehyde and then further on to artemisinic acid
[12]. It has long been assumed that artemisinic acid is a
direct precursor of artemisinin. However, recent feeding
experiments with artemisinic acid [13] and dihydroarte-
misinic acid [14] have shown that the latter substance is
the precursor of artemisinin. Dihydroartemisin ic acid is
formed from artemisinic aldehy de in two steps via dihy-
droartemisinic aldehyde. The reduction is catalyzed by
artemisinic aldehyde Δ11(13) reductase (DBR2) [15] and
the oxidation to the acid by aldehyde dehydrogenase 1
(ALDH1) [16]. It has not been fully evaluated if the
CYP71AV1 enzyme can catalyze the oxidation of dihy-
droartemisinic aldehyde to the co rresponding acid
[16,17].
The conversion of dihydroartemisinic acid to artemisi-
nin is believed to be a non-enzymatic spontaneous
reaction [14]. In a similar way, artemisinic acid is con-
verted to arteannuin B as indicated in Figure 1[13].
Recently, a dihydroartemisinic aldehyde reductase
(RED1) has been cloned from A. annua [18]. This
enzyme can potentially convert dihydroartemisini c alde-
hyde into dihydroartemisinic alcohol, a substance that
appears to be a “ dead end product”, thereby affecting
the yield of artemisinin in a negative way.
The genetic variation within A. annua appears to be
high. At least two chemotypes with different composi-
tions of the essential oil during the vegetative period
have been described [19]. One chemotype shows high
content of dihydroartemisinic acid and artemisinin,
while the second chemotype shows high content of arte-
misinic acid and arteannuin B but low amounts of arte-
misinin. According to previous investigations, there is
no conversion in planta of artemisinic acid to dihy-
droartemisinic acid or vice versa [13]. It has been
suggested that arteannuin B can be converted to artemi-
sinin in planta [20].
In order to increase our understanding of terpene
metabolism in the plant A. annua and to evaluate the
competition for precursors, which may influence the
yield of artemisinin in the plant, we have used qPCR to
estimate the expression of genes of terpene metabolism
in different plant tissues. cDNA made from flower buds,
young leaves, old leaves, stems, roots and hairy roots
has been used as templates for the qPCR studies. In
total, 14 different transcripts have been monitored using
three reference genes. The different tissues have also
been studied b y fluorescence microscopy to determine
trichome densities.
Results and Discussion
Trichomes
The glandular trichomes of A. annua have been exten-
sively studied and it is well established that the produc-
tion of specific terpenoids, including artemisinin, takes
place within the secretory cells of such trichomes
[21,22]. Furthermore the yield of terpenoids in various
plants is highly dependent on t richo me abundance [23].
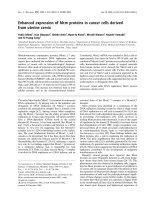
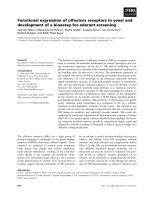
In order to investigate the diff erences in trichome den-
sit y on different plant tissues, glandular trichomes of A.
annua were visualized by fluorescence microscopy
(Figure 2) and found in all aerial tissues of the plant
such as flower buds (panels A and B), leaves (panels C-
F), stems (panels G and H) at different densities, but as
expected not on roots (panels I and J) or hairy root cul-
tures of A. annua (panels K and L).
From Figure 2, it is evident that youn g leaves (panels
C and D) carry co nsiderably higher density of trichomes
than older leaves (panels E and F). All these tissues
were taken from 5-6 months old plants with flower
buds, which had been induced by a 21 days short day
Olofsson et al. BMC Plant Biology 2011, 11:45
/>Page 2 of 12
treatment (8 h day). We have estimated, by counting tri-
chomes, that on young leaves there are around 300±40
trichomes/cm
2
while the corresponding number for old
leaves was 130 ± 25 trichomes/cm
2
. The original num-
ber of trichomes seem to be spread out on a larger sur-
face as the leaf expands with age.
Gene expression
In order to examine the gene expression of 14 enzymes
of terpene metabolism and three reference transcripts
by qPCR, 18 primer pairs were synthesized as listed in
Table 1. The efficiency of these primer pairs was calcu-
lated from the qPCR experiments and was found to be
between 1.82 and 1.93 as summarized in Table 1.
Relative expression of genes of terpene metabolism in
different tissues
The gene expression of the 14 enzymes of terpene meta-
bolism was studied in different tissues of A. annua and
the results are summarized in Table 2 and Figure 3.
Transcripts of all the genes studied could be detected in
Figure 1 Summary of terpene metabolism in Artemisia annua. Enzymes in red have been cloned from A. annua. The Genbank accession
numbers are given after each cloned enzyme. Cytosol: AACT: acetoacetyl-CoA thiolase; ADS: amorpha-4,11-diene synthase (AF138959); ALDH1:
aldehyde dehydrogenase 1 (FJ809784); BAS: b-amyrin synthase (EU330197); BFS: b-farnesene synthase (AY835398); CPR: cytochrome P450
reductase (EF197890); CPS: b-caryophyllene synthase (AF472361); CYP71AV1: amorphadiene-12-hydroxylase (DQ453967); DBR2: artemisinic
aldehyde Δ11(13) reductase (EU704257); ECS: epi-cedrol synthase (AJ001539); FDS: farnesyl diphosphate synthase (U36376); GAS: germacrene A
synthase (DQ447636); HMGR: 3-hydroxy-3-methyl-glutaryl coenzyme A reductase (AF142473); HMGS: 3-hydroxy-3-methyl-glutaryl coenzyme A
synthase (GQ468550); IDI: isopentenyl diphosphate isomerase (DQ666334); MVK: mevalonate kinase; PMD: diphosphomevalonate decarboxylase;
PMK: phosphomevalonate kinase; RED1: dihydroartemisinic aldehyde reductase (GU167953); SMO: squalene monooxygenase; SQS: squalene
synthase (AY445505). Plastid: BPS: b-pinene synthase (AF276072); CMK: 4-cytidine 5’-diphospho-2-C-methyl-D-erythritol kinase; DXR: 1-deoxy-D-
xylulose-5-phosphate reductoisomerase (AF182287); DXS: 1-deoxy-D-xylulose-5-phosphate synthase (AF182286); GGDS: geranylgeranyl
diphosphate synthase; GDS: geranyl diphosphate synthase; HDR: hydroxy-2-methyl-2-(E)-butenyl 4-diphosphate reductase (EU332141); HDS;
hydroxy-2-methyl-2-(E)-butenyl 4-diphosphate synthase (FJ479720); IDI: isopentenyl diphosphate isomerase (DQ666334); LS: linalool synthase
(AF154125); MCT: 2-C-methyl-D-erythritol-4-(cytidyl-5-diphosphate) transferase; MCS: 2-C-methyl-D-erythritol-2,4-cyclodiphosphate synthase.
Olofsson et al. BMC Plant Biology 2011, 11:45
/>Page 3 of 12
all tissues at different amounts using qPCR. The only
exception was that no ADS could be detected in roots.
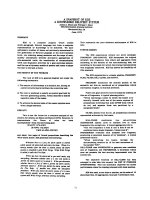
In Figure 3, expression levels in the different tissues are
all compared separately to old leaves, which were arbi-
trary chosen as reference tissue. The results of the dif-
ferent experiments are presented below.
Relative expression of genes encoding HMGR and FDS in
different tissues
The mevalonate pathway produces IDP and DMADP for
production of different types of terpenoids as summar-
ized in Figure 1. O ne enzyme of the mevalonate path-
way (3-hydroxy-3-methyl-glutaryl-CoA reductase;
HMGR) has been studied by qPCR in this paper. Our
results show that HMGR was expressed at higher levels
in biosynthetically active tissues such as flower buds,
young leaves, roots and hairy roots. The C
T
-values for
this transcript in these tissues were relatively low (23.8-
24.7) indicating that HMGR was expressed at relatively
high levels (Table 2). HMGR is a rate-limi ting enzyme
of the mevalonate pathway [24,25], and recently it has
been shown that HMGR e xpression limits artemisinin
formation in A. annua [26]. The regulation of the meva-
lonate pathway by HMGR was reflected in the result
that around 20- and 8-fold more expression was seen in
highly biosynthetically active flower buds and young
leaves, respectively, than in old leaves (Figure 3 ). Ster-
mer et al. showed that the HMGR activity is much
reduced in mature tissues, correlating well with the
results presented here [27]. It is interesting to note that
HMGR also was enhanced 20-fold in roots. This might
be due to the relatively rapid growth of roots and the
requirement for sterols and protective terpenoids [25].
Farnesyl diphosphate synthase (FDS) plays a central
role in the conversion of IDP and DMADP, produced
by the mevalonate pathway, to various terpenoids such
as sterols and sesquiterpenes. A small gene family
encodes isoenzymes of FDS in plants. FDS1 is a house-
keeping gene as it is expressed in all tissues at all devel-
opmental stages [28]. It is involved in the synthesis of
isoprenoids serving basic plant cell functions such as
production of sterols for various membranes. Overex-
pression of FDS1 in A. annua resultsinanincreasein
artemisinin production [29,30] indicating that it is a
rate-limiting enzyme in this pathway. FDS2 is often
inducible and found in special tissues at particular stages
of development [28] and is also involved in phytoalexin
biosynthesis. FDS1 [31,32] and FDS2 (GenBank acces-
sion number AF136602) have been cloned from A.
annua.ThetwoFDS genes from A. annua show 96.6%
nucleotide sequence identity and the segment that was
amplified with the primers used (Table 1) is identical in
the two genes. Consequently, t he expression of both
genes was monitored in our qPCR experiments. From
Figure 3 it is evident that the total expression of FDS1/
0.5 mm 0.5 mm
0.5 mm 0.5 mm
0.5 mm
0.5 mm
0.5 mm
0.5 mm
0.5 mm 0.5 mm 0.5 mm 0.5 mm
Figure 2 Light and fluorescence microscopy of various tissues f rom Artemisi a annua. A and B: Flower bud; C and D: young leaf; E and F:
old leaf; G and H: stem; I and J: root; K and L: hairy root.
Olofsson et al. BMC Plant Biology 2011, 11:45
/>Page 4 of 12
FDS2 is essentially the same in all tissues, and the rela-
tively small variation observed may be explained by the
fact that the housekeeping gene FDS1 constitutes a
major part of total FDS1/FDS2 and that the eventual
different level of FDS2 expression in different tissues
thereby becomes masked.
Relative expression of genes of the MEP pathway in
different tissues
The MEP pathway produces the precur sors for many
different terpenoids as shown in Figure 1. Three of the
eight enzymes of the MEP pathway, 1-deoxy-D-xyl ulose
5-phosphate synthase (DXS), 1-deoxy-D-xylulose 5-
phosphate reductase (DXR) and hydroxy-2-methyl-2-
(E)-butenyl 4-diphosphate reduc tase (HDR), have been
studied by qPCR in this paper. Our results show that
the expression of DXS was 7-8-fold higher in flower
buds and young leaves compared to old leaves (Figure
3).ItiswellestablishedthatDXS,thefirstenzymeof
the MEP pathway, plays a major role in the overall regu-
lation of the pathway [33]. Higher expression of DXS
leads to an enhanced production of IDP and DMADP,
which may influence the synthesis of terpenoids in the
plastid. However, an enhanced DXS activity may also
influence the production of artemisinin since it has
recently been shown that one C
5
-unit of FDP, the pre-
cursor of artemisinin, is produced by the MEP pat hway
[34]. In the other tissues, the expression of DXS was
equal to that in old leaves. DXR and HDR may also
have rate-limiting roles for the production of IDP and
DMADP [33]. The expression of DXR appears to be
somewhat enhanced in flower buds and hairy roots but
lower in stems and roots. The expression of HDR was
10-30-fold higher in old leaves than in the other tissues.
Relative expression of genes of artemisinin biosynthesis in
different tissues
During the last decade, a number of enzymes of artemi-
sinin biosynthesis have been cloned and a putative path-
way has been constructed as outlined in Figure 1. We
have monitored the expression of f our genes (ADS,
CYP71AV1, DBR2 and ALDH1) involved in the conve r-
sion of FDP to dihydroartemisinic acid, which is a late
precursor of artemisinin [14]. We have also included
RED1 in these studies as it has been suggested that this
enzyme may have an influence on the yield of artemisi-
nin by withdrawing dihydroartemisinic aldehyde from
further conversion to artemisinin [18].
Table 1 Efficiency and nucleotide sequences of primers used in qPCR
Transcript* Calculated primer
efficiency
Forward Primer Sequence Reverse Primer Sequence Fragment size
(bp)
b-actin 1.91 5’-CCAGGCTGTTCAGTCTCTGTAT-3’ 5’-CGCTCGGTAAGGATCTTCATCA-3’ 180
ADS 1.88 5’-GGGAGATCAGTTTCTCATCTATGAA-3’ 5’-CTTTTAGTAGTTGCCGCACTTCTT-3’ 95
ALDH1 1.82 5’-CATCGGAGTAGTTGGTCACAT-3’ 5’-GTTTCTGACCCAAATCCAGGTTGA-3’ 120
CPR 1.90 5’-GCTCGGAACAGCCATCTTATTCTT-3’ 5’-GAAGCCTTCTGAGTCATCTTGTGT-3’ 174
CPS 1.85 5’-CAACGATGTAGAAGGCTTGCTTGA-3’ 5’-GTAGATAGTGTTGGGTTGGTGTGA-3’ 150
CYP71AV1 1.83 5’-CGAGACTTTAACTGGTGAGATTGT-3’ 5’-CGAAGCGACTGAAATGACTTTACT-3’ 144
DBR2 1.91 5’-GCGGTGGTTACACTAGAGAACTT-3’ 5’-ATAATCAAAACTAGAGGAGTGACCC-3’ 228
DBR2/OPR3 1.84 5’-ATCATCAACAAGCAAGCCCATTTCAAA-3’ 5’-CGATAGTCTTCAACCACCTCTAGTA-3’ 125
DXR 1.92 5’-GGTGATGAAGGTGTTGTTGAGGTT-3’ 5’-AGGGACCGCCAGCAATTAAGGT-3’ 160
DXS 1.92 5’-GTGCTTCCAGACCGTTACATTGA-3’ 5’-AGCCTCTCGTGTTTGCCCAAGGT-3’ 120
ECS 1.86 5’-GCAACAAGCCTACGAATCACTCAA-3’ 5’-CGTGAAAAATTAAGGACCCTCATAG-3’ 126
FDS1/FDS
2 1.93 5’-ATCTGCCCTTGGTTGGTGTATTGA-3’ 5’-GTTGCCCTCTGCGTGTATGAGA-3’ 92
GAS 1.83 5’-CTCGTTACTCCTTGGCAAGAATCAT-3’ 5’-GCTCCATAGCACTAATATCCCACTT-3’ 147
HDR 1.86 5’-TCAGGAGCGACAAGATGCTATGTA-3’ 5’-AGTGTGAGGTGTTGCTTGAGTTGA-3’ 95
HMGR 1.83 5’-GGGCGTGGAAAATCTGTTGTGTTC-3’ 5’-GAACCAGCAATAGCAGAACCAGTAA-3’ 136
PAL 1.87 5’-ATCGGGAAACTCATGTTCGCTCAA-3’ 5’-AACTTGGGTTACGTCCACCAGAAA-3’ 97
RED1 1.92 5’-TGTCAACTGTGTCCATCCAGGTT-3’ 5’-ACCATCATCGGGCAACAAAGCAA-3’ 118
SQS 1.82 5’-GACCAGTTCCACCATGTTTCTACT-3’ 5’-GCTTTGACAACCCTATTCCAACAAG-3’ 190
The mean efficiency of the amplicons was calculated by the program Linreg v. 12.1 based on the log linear phase of the amplification curve. The transcripts in
bold were used as reference genes in the calculation of expression ratios.
* ADS, amorpha-4,11-diene synthase; ALDH1, aldehyde dehydrogenase 1; CPR, cytochrome P450 reductase; CPS, b-caryophyllene synthase; CYP71AV1,
amorphadiene-12-hydroxylase; DBR2, artemisinic aldehyde Δ11(13) reductase; DXR, 1-deoxy-D-xylulose 5-phosphate reductase; DXS, 1-deoxy-D-xylulose 5-
phosphate synthase; ECS, epi-cedrol synthase; FDS, farnesyl diphosphate synthase; GAS, germacrene A synthase; HDR, hydroxy-2-methyl-2-(E)-butenyl 4-
diphosphate reductase; HMGR, 3-hydroxy-3-methyl-glutaryl-CoA reductase; OPR3, 12-oxophytodienoate reductase; PAL, phenylalanine ammonia lyase; RED1,
dihydroartemisinic aldehyde reductase; SQS, squalene synthase.
Olofsson et al. BMC Plant Biology 2011, 11:45
/>Page 5 of 12
The first committed enzyme of artemisinin biosynth-
esis is ADS [11], which has been cloned by several
investigators [6,35-37]. The next enzyme, CYP71AV1,
was cloned by two groups independently [12,38]. The
following two enzymes, DBR2 and ALDH1, were cloned
and characterized by Zhang et al. [15] and Teoh et al.
[16], respectivel y. Finally, RED1 was cloned and char ac-
terized by Rydén et al. [18].
InTable3wesummarizepreviousstudiesofgene
expression of enzymes involved in artemisinin biosynth-
esis in A. annua. The specific expression of CYP71AV1,
DBR2 and ALDH1 in glandular trichomes of A. annua
has been shown by PCR, and ADS has been shown to
be expressed in glandular trichomes by immuno gold
staining in combination with silver enhancement [39].
The relative expression of these different genes cannot
be compared since the data in Table 3 is from several
different studies and on different varieties of A. annua.
It may, however, be concluded from Table 3 that the
biosynthetic enzymes are expressed in flower buds,
leaves and stems that carry glandular trichomes but not
in roots.
In A. annua, DBR2 belongs to a small family of eno-
late reductases and a second enzyme of this family is
12-oxophytodienoate reductase (OPR3), which in Arabi-
dopsis is involved in jasmonic acid biosynthesis [40].
The OPR3-like gene of A. annua (Genbank accession
number EU848577) shows a very high similarity to
DBR2, and in our initial attempt to determine the rela-
tive expression of DBR2, a primer pair (see Table 1)
with identical nucleotide sequence in the DBR2 and
OPR3-like sequences was used. Consequently, the two
transcripts were amplified simultaneously. The com-
bined expression of these two genes is essentially the
same in flower buds, young leaves and old leaves (Figure
3; panels A and B). However, a 21 bp deletion in the
DBR2 sequence was thereafter used to design, by span-
ning this deletion, a reversed primer that is specific for
DBR2. Using this primer, the expressio n of DBR2 could
be determined as discussed below.
The qPCR data presented here clearly demonstrate
that the expression levels of ADS, CYP71AV1, DBR2
and ALDH1 were very high in flower buds and young
leaves compared to old leaves (Figure 3; panel A and B) ,
i.e. ~500 and ~150 times more ADS, ~150 an d ~150
times more CYP71AV1, ~40 and ~70 times more DBR2
and ~250 and ~130 times more ALDH1 in flower buds
and young leaves, respectively. These high expression
Table 2 Average measured C
T
-values
Transcript* Flower buds Young leaves Old leaves Stems Roots Hairy roots
b-actin 23.8 22.3 23.4 21.6 22.9 21.1
b-actin
#
20.8 22.1 22.5 20.7 24.4 20.3
ADS 23.3 22.2 29.9 30.0 n.d. 35.9
ALDH1 25.8 27.7 31.7 34.3 37.4 39,5
CPR 21.5 21.0 19.9 19.5 20.7 21.0
CPS 27.9 27.5 31.4 30.3 35.5 37,7
CYP71AV1 26.9 24.2 33.8 30.6 31.3 30.7
DBR2
#
19.9 20.1 27.2 26.4 27.9 29.6
DBR2+OPR3 23.8 23.0 24.4 23.0 23.8 25.1
DXR 24.6 24.7 24.8 23.8 25.6 23.4
DXS 21.9 20.8 23.0 21.1 22.6 23.1
ECS 28.1 25.7 20.6 29.1 30.5 35.6
FDS1/FDS2 24.6 23.5 23.5 23.8 25.3 23.5
GAS 30.6 25.1 32.6 34.2 32.6 34.0
HDR 24.4 22.4 19.7 22.4 25.4 24.3
HMGR 24.6 24.4 28.6 24.6 23.8 24.7
PAL 21.8 20.0 21.3 19.4 20.8 21.7
RED1 31.7 30.7 26.0 34.6 25.7 20.9
SQS 26.7 26.5 25.2 25.1 26.5 25.7
Two independent triplet reactions were used for the calculation of average C
T
-values. n.d. = not detected. The rows in bold represent the reference samples. The
transcripts labelled with
#
were analyzed in a separate experiment.
* ADS, amorpha-4,11-diene synthase; ALDH1, aldehyde dehydrogenase 1; CPR, cytochrome P450 reductase; CPS, b-caryophyllene synthase; CYP71AV1,
amorphadiene-12-hydroxylase; DBR2, artemisinic aldehyde Δ11(13) reductase; DXR, 1-deoxy-D-xylulose 5-phosphate reductase; DXS, 1-deoxy-D-xylulose 5-
phosphate synthase; ECS, epi-cedrol synthase; FDS, farnesyl diphosphate synthase; GAS, germacrene A synthase; HDR, hydroxy-2-methyl-2-(E)-butenyl 4-
diphosphate reductase; HMGR, 3-hydroxy-3-methyl-glutaryl-CoA reductase; OPR3, 12-oxophytodienoate reductase; PAL, phenylalanine ammonia lyase; RED1,
dihydroartemisinic aldehyde reductase; SQS, squalene synthase.
Olofsson et al. BMC Plant Biology 2011, 11:45
/>Page 6 of 12
levels indicate a h igh capacity to produce artemisinin
precursors in these tissues carrying biosynthetically
active trichomes. These findings are supported by a
study on the induction of enzymes involved in artemisi-
nin biosynthesi s by jasmonic acid [41]. It was shown by
qPCR that the levels of ADS, CYP71AV1, DBR2 and
ALDH1 were around 50, 13, 160 and 55 times higher in
isolated trichomes (from flower buds) than in leaves,
respectively [41], which once again shows that the genes
encoding enzymes of artemisinin biosynthesis are speci-
fically expressed in trichomes.
Even though a 70-150-fold difference in expressio n of
the four genes was observed between young and old
leaves, the trichome density on these tissues only differs
around three times. Obviously, the relative amount of
the biosynthetic enzymes is much higher in young tri-
chomes, and the regulation of expression of these
enzymes appears to be linked to the developmental
stage of the trichomes.
The qPCR data may be used to estimate the relative
amount of transcripts using the 2
-ΔΔCT
method [42] and
the b-actin as reference gene. As an example, we have
made such an estimation for flower buds. For this crude
esti mation, we assume that the number of active sites is
proportional to the level of transcription and that the
enzymes are working at substrate saturation with an
optimal NADPH/NADP
+
ratio. Under such conditions
the k
cat
-value is a good indicator of the conversion of
substrate to product. Consequently, we may calculate
the relative turnover potential for the different enzymes.
The values were normalized to RED1 (=1) due to its
low abundance in flower buds. Using published k
cat
-
values for the different enzymes, we may calculate their
relative turnover potential in planta as summarized in
Table 4. For CYP71AV1 no k
cat
-value is available and
therefore this enzyme is not included in this estimation.
It may be concluded that ADS is a rate-limiting enzyme
due to its low k
cat
-value and that the other trichome-
specific enzymes DBR2 and ALDH1 (Figure 3) are pre-
sent in excess assuming that they are acting on the
same pool of intermediates. Due to differences in the
k
cat
-value, ALDH1 exhibits a 5-fold higher potential
conversion of dihydroartemisinic aldehyde as compared
to artemisinic aldehyde (Table 4).
From Figure 3, we may conclude that only part of the
FDS1/FDS2 activity is present in trichomes and involved
in artemisinin biosynthesis. In fact, it may be speculated
that FDS1 is a critical enzyme for the yield of artemisi-
nin. If we assume that only one percent of the FDS1
activity is found in trichome cells, the relative turnover
pot ential is in the same range as ADS. This assumption
is supported by the fact that upregulation of FDS by
transcript
ADS
CYP
DBR2
ALDH1
RED1
FDS
HDR
GAS
ECS
SQS
HMGR
DXS
DXR
expression ratio
64
32
16
8
4
2
1
0.5
0.25
0.125
0.063
0.032
0.016
0.004
0.008
CPS
E
transcript
ADS
CYP
DBR2
ALDH1
RED1
FDS
HDR
GAS
ECS
SQS
HMGR
DXS
DXR
expression ratio
16
8
4
2
1
0.5
0.25
0.125
0.063
0.032
0.016
0.004
0.008
CPS
transcript
ADS
CYP
DBR2
ALDH1
RED1
FDS
HDR
GAS
ECS
SQS
HMGR
DXS
DXR
expression ratio
4
2
1
0.5
0.25
0.125
0.063
0.032
0.016
0.001
0.008
CPS
transcript
ADS
CYP
DBR2
ALDH1
RED1
FDS
HDR
GAS
ECS
SQS
HMGR
DXS
DXR
expression ratio
256
128
64
32
16
8
4
0.5
0.25
0.125
0.063
0.032
0.016
0.008
CPS
transcript
ADS
CYP
DBR2
ALDH1
RED1
FDS
HDR
GAS
ECS
SQS
HMGR
DXS
DXR
expression ratio
512
256
128
64
32
16
8
0.5
0.25
0.125
0.063
0.032
0.016
0.004
0.008
CPS
D
C
B
A
DBR2
+ OPR3
0.002
Expression
Rat io
0.004
0.002
2
1
DBR2
+ OPR3
DBR2
+ OPR3
DBR2
+ OPR3
DBR2
+ OPR3
2
4
8
4
2
1
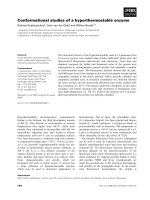
Figure 3 Expression of genes invo lved in terpene metabolism
in different tissues of Artemisia annua. Expression levels were
measured through qPCR using the primers listed in Table 1. The
expression ratios were calculated relative to the expression in old
leaves. A: Flower buds; B: young leaves; C: stems; D: roots; E: hairy
roots. All graphs represent the values of two independent qPCR
runs with cDNA prepared from different plants. Sample triplicates
were used in all qPCR runs. Expression ratios are illustrated by box-
and-whisker plots. Boxes above expression ratio 1 represent higher
gene expression levels compared to old leaves. Note that the
expression ratio scale is logarithmic and not the same in all graphs.
Olofsson et al. BMC Plant Biology 2011, 11:45
/>Page 7 of 12
genetic transformation of A. annua using constitutive
promoter resulted in an increased artemisinin produc-
tion [29] indicating that FDS1 also may be a rate-limit-
ing enzyme in artemisinin biosynthesis. However, due to
the relative high potential conversion capacity of DBR2
and ALDH1 it may be assumed that as amorpha-4,11-
dieneisformedbyADS,itisefficientlyconvertedall
the way to dihydroartemisinic acid, which accumulates
in this chemotype of A. annua. This is supported by the
fact that e ssentially no amorpha-4,11-diene is detected
by GC-MS of an hexane extract from this variety of A.
annua (unpublished). Finally, since dihydroartemisinic
acid accumulates in this chemotype, we may conclude
that the activity of DBR2 is significantly higher than that
of CYP71AV1. The fact that DBR2 is a soluble cytosolic
protein while CYP71AV1 is embedded in the ER may
influence the metabolic flow and the rate of intracellular
transport of intermediates has to be considered. At pre-
sent, we do not have any information on the transport
of intermediates of artemisinin biosynthesis within cells.
It would be interesting to study the ratio of DBR2 and
CYP71AV1 in the two different chemotypes of A. annua
since these enzymes are the key enzymes for the forma-
tion of dihydroartemisinic acid and artemisinic acid,
respectively.
Next it may be concluded that RED1 does not appear
to have any significant influence on the biosynthesis of
artemisinin, which was suggested by Rydén et al. [18]
due to a high K
m
for dihydroartemisinic aldehyde, low
relative turnover potential and only partial localization
to trichomes. Expression of RED1 in flower buds, young
leaves and stems was relatively low and just a fraction
of that observed in old leaves (Figure 3A-3C). Further-
more, it is interesting to note that a high expressio n of
RED1 was observed in hairy roots of A. annua, i.e.
around 50 times more than in old leaves (Figure 3E).
The function of RED1 in hairy roots is not known but
in this case the high RED1 activity together with an
extremely low ALDH1 expression may influence the
yield of artemisinin in hairy roots, which is relatively
low [43,44].
Finally, no ADS c ould be detected in root s of A.
annua while small amounts were found in hairy roots.
Hairy roots produce as mentioned above small amounts
of artemisinin. However, ALDH1 was almost not detect-
able in hairy roots, which may lead to the formation of
artemisinic acid and arteannuin B instead of artemisinin.
These compounds have been isolated from hairy root
cultures of A. annua [45].
Relative expression of genes of sesquiterpene biosynthesis
in different tissues
In addition to ADS, four other sesquiterpene synthases
have been cloned from A. annua.Theseenzymeswith
very similar kinetic properties compete for the FDP
available and may therefore influence the producti on of
artemisinin precursors. Three of these sesquiterpene
synthases, i.e. CPS, ECS and GAS have been monitored
by qPCR in this study.
Table 3 Relative gene expression of enzymes of artemisinin biosynthesis in different tissues of A. annu a
Transcript Trichome Flower Leaf Stem Root Method Reference
ADS n.d. +++ +++ +++ - RT-PCR [37]
CYP71AV1 +++++ +++ + n.d. + RT-PCR [12]
DBR2 +++++ ++ + n.d. - qRT-PCR [15]
ALDH1 +++++ +++ + n.d. - RT-PCR [16]
RED1 n.d. + ++ - n.d. RT-PCR [18]
The results are not directly comparable between enzymes. An estimation based on published figures of the relative level of enzymes in different tissues is
indicated with +-signs. - = no expression; n.d. = not determined.
Table 4 Estimation of relative turnover potential for enzymes of artemisinin biosynthesis using the 2
-ΔΔCT
method [42]
Enzyme Substrate K
m
(μM) k
cat
(s
-1
) ΔΔC
T
Normalized transcript amount
relative to RED1 2
-ΔΔCT
relative
turnover
Reference for kinetic
constants
FDS1 IDP 29.4 0.7 -7.1 137 96 [32]
GDP 17.2
ADS FDP 2 0.004 -8.4 338 1.4 [54]
DBR2 AA 19 2.6 -7.9 239 621 [15]
ALDH1 DHAA 8.8 7.7 -5.9 60 462 [16]
AA 2.6 1.5 -5.9 60 90
RED1 DHAA 67 0.28 0.0 1 0.3 [18]
b-Actin was used as reference gene. The C
T
-values for flower buds (Table 2) were used for the calculations. The RED1 gene was used for the normalization of
values. Substrates: AA, artemisinic aldehyde; AAOH, artemisinic alcohol; AD, amorpha-4,11-diene; DHAA, dihydroartemisinic aldehyde; FDP, farnesyl diphosphate;
GDP, geranyldiphosphate; IDP, isopentenyldiphosphate.
Olofsson et al. BMC Plant Biology 2011, 11:45
/>Page 8 of 12
The expression of ECS was much lower in flower buds
and young leaves than in old leaves (Figure 3A and 3B),
while expression of CPS and GAS was considerably
higher in these tissues as compared to old leaves. In old
leaves, ECS appears to be the only sesquiterpene
synthase highly expressed. The function of ECS in A.
annua has not yet been established.
The relative amounts of the sesquiterpene synthases
has been calculated using the 2
- ΔΔCT
method [42] for
some tissues as summarized in Table 5 using b-actin
as reference. The values were normalized to GAS
expression in stems (=1) due to its low abundance
there. As can be seen in Table 5, ADS is the dominat-
ing sesquiterpene synthase in flower buds and young
leaves, i.e. the tissues where the biosynthesis of artemi-
sinin precursors take place. It may be concluded that
ADS is capable to channel a major part of the available
substrate into artemisinin biosynthesis. Ma et al [2009]
showed that upregulation of ADS by genetic transfor-
mation of A. annua resulted in an increased formation
of artemisinin showing that ADS is a rate-limiting
enzyme [46].
Relative expression of genes of sterol and triterpene
biosynthesis in different tissues
A key enzyme in the biosynthesis of sterols and triter-
penes is squalene synthase (SQS), which condensates
two molecules of FDP to squalene. The expression of
SQS varied only modest between different tissues in our
qPCR study. SQS is a microsomal enzyme and dif ficult
to purify and characterize. Consequently, there is no
reported k
cat
-value for any plant enzyme, but a k
cat
=
3.3 sec
-1
has been reported for a soluble recombinant
yeast enzyme [47]. The A. annua enzyme has been
cloned and is similar to the enzymes from A. thaliana
and Nicotiana tabacum [48].AsseeninTable5,asig-
nificant amount of SQS was expre ssed in the tissues
with high artemisinin biosynthesis. Assuming a k
cat
-
value for the A. annua SQS in the order of 1 sec
-1
(= 2
FDPs used per second), results in about 45- and 25-fold
higher turnover potential, of FDP to products, for SQS,
as compared to the turnover potential of ADS in flower
buds and young leaves, respectively. The fraction of SQS
expressed in trichome cells may channel part of avail-
able FDP into sterols and thereby lower the yield of
artemisinin. Zhang et al. showed that down-regulation
of SQS by hairpin-RNA-mediated gene silencing in A.
annua resulted in a 3-fold increased artemisinin produc-
tion [49].
Conclusions
The aim of our studies was to increase our understanding
of terpene metabolism i n the plant A. annua.TheqPCR
data presented in this paper demo nstrate that four genes
of the artemisinin biosynthetic pathway (ADS,
CYP71AV1, DBR2 and ALDH1) showed remarkably
higher expression (between 40- to 500-fold) in flower buds
and young leaves compared to other tissues (old leaves,
stems, roots and hairy root c ultures) (Figure 3). These
high expression levels indicate a much highe r capacity to
produce artemisinin precursors in flower buds and young
leaves, which is partly due to the considerably higher den-
sity of trichomes on these tissues (Figure 2).
Our aim was also to evaluate the competition for pre-
cursors, which may influence the yield of artemisinin in
the plant. The expression of other sesquiterpene
synthases was much lower than ADS in tissues produ-
cing artemisinin precursors (i.e. flower buds and young
leaves). Consequently, their influence on artemisinin
yield appear to be relatively limited and downregulat ion
of other sesquiterpene synthase(s) will most likely not
affect artemisinin production in A. annua.
However, squalene syn thesis may influen ce the yield
of artemisinin, since the potential utilization of FDP by
SQS is most likely higher than that of ADS. The fact
that ADS is a cytosolic enzyme and SQS is localized to
the ER may be favorable for the sesquiterpene
synthase.Further,theratioofCYP71AV1andDBR2
may be critical for the type of end product formed;
high DBR2 activity will result in an efficient formation
of dihydroartemisinic aldehyde, dihydroartemisinic acid
and artemisinin while high CYP71AV1 activity may
result in artemisinic acid and arteannuin B. A direct
comparison of the capacity of these two enzymes is
notpossibleduetothefactthatnokineticdatais
available for CYP71AV1. However in this chemotype
of A. annua, the turnover capacity of DBR2 is appar-
ently sufficient to convert most of the artemisinic alde-
hyde to dihydroartemisinic aldehyde for further
conversion to artemisinin. It is notable that the RED1
activity was very low in artemisinin-producing tissues
and consequently this enzyme appears not to influence
the yield of the artemisinin precursor dihydroartemisi-
nic acid to any significant extent.
Table 5 Estimation of relative amounts of sesquiterpene
synthases and squalene synthase in various tissues of
Artemisia annua using the 2
-ΔΔCT
method [42]
Normalized transcript amount relative to GAS 2
-ΔΔCT
Enzyme Flower buds Young leaves Old leaves Stems
ADS 8780 6654 69 18
CPS 360 170 24 15
GAS 56 890 11 1
ECS 315 590 43000 34
SQS 830 340 1780 550
The C
T
-values in Table 2 were used for the calculations, and b-actin was used
as reference gene. The GAS gene in stems was used for the normalization of
values.
Olofsson et al. BMC Plant Biology 2011, 11:45
/>Page 9 of 12
Methods
Tissue Preparation
Seeds of Artemisia annua L. cv Artemis were obtained
from Anamed, Germany (). This
variety is a high dihydroartemisinic acid chemotype (the
ratio artemisinic acid to dihydroartemisinic acid is 0.36
[50]). Plants were grown under 16 h days and 8 h nights
at 22°C to a height of approximately 1 m followed by
flower bud induction at 8 h days and 16 h nights at 22°C.
Artemisia annua L. hairy root cultures, kindly pro-
vided by Dr. Kanyaratt Supaibulwatana, Mahidol Univer-
sity, Bangkok, were grown in MSMO medium (Sigma-
Adrich, Stockholm, Sweden) pH 5.8, supplemented with
3% (w/v) sucrose at room temperature on a rotary sha-
ker at 75 rpm.
Flower buds, young leaves, old leaves, stems, roots and
hairy roots were collected separately from 5-6 months
old plants after induction of flower buds, frozen in
liquidnitrogen,groundtoafinepowderinamortar
and used for RNA extraction.
RNA extraction
RNA extraction was performed using Purelink™ Plant
RNA Reagent kit (Invitrogen, Carlsbad, California, USA)
for small scal e RNA isolation according to the manufac-
turer’ s instructions. Frozen plant tissue powder (100
mg) was used for each RNA extraction. The RNA was
DNase treated using DNase I (Fermentas, St Leo-Roth,
Germany) to remove remaining genomic DNA.
First strand cDNA synthesis
RNA (1 μg) was reverse transcribed using RevertAid™
H Minus-MuLV reverse transcriptase (Fermentas)
primed with 0.5 μg oligo(dT)
18
primer. The RNA was
removed from the first strand cDNA by RNase treat-
ment using RNase H (Fermentas) according to the man-
ufacturer’s instructions.
Quantitative PCR (qPCR)
The qPCR was performed using specific primers (Table
1) on a 7500 qPCR equipment (Applied Biosystems, Fos-
ter City, USA). First strand cDNA was used as template
in 20 μl reactions including 10 μlPowerSYBR
®
Green
PCR Master Mix (Applied Biosystems) and 2 pmol of
each primer. The qPCR cycling was performed at 50 °C
(2 min), 95 °C (10 min), 40 cycles at 95 °C (15 s), 60 °C (1
min) and finally a dissociation stage at 95 °C (15 s), 60 °C
(1 min), 95 °C (15 s). The dissociation stage was per-
formed to determine the PCR product size and to detect
possible primer dimers. Triplets of all samples were run,
and a negative control of the Master Mix in addition of
primers was performed in all qPCR runs.
Any outliers in the triplets were detected by Grubbs
test and removed. The mean efficiency of the amplicons
was calculated by the program Linreg v. 12.1 based on
the log linear phase of the amplification curve [51].
Baseline corrected data was imported set between cycles
3-15, from the 7500 qPCR software (Applied Biosys-
tems) to the Linreg software. Linreg calculated window
of linearity for each amplicon and the efficiency from
the curve fit showing highest correlation value between
4-6 points within the window of linearity. The cycle
threshold (C
T
) values and efficiency values given by the
Linreg software were used for further analysis. The Best-
Keeper software [52] was used to search for stable refer-
ence genes among all genes tested. Based on
BestKeeper, the genes CPR, b-actin and PAL were
selected as reference genes. Relative expression levels
were calculated using the REST 2009 soft ware V. 2.0.13
(Qiagen, Hilden, Germany) [53].
Fluorescence Microscopy
Flower buds, young leaves, old leaves, stems and roots
were selected from t he same A. annua plant and micro-
scopy studies were performed to compare the amount
of trichomes on different plant tissue. All micrographs
were captured using a Nikon e400 C-SHG1 fluorescence
microscope equipped with digital camera, using light
microscopy and filter settings for FITC (l
ex
480 nm;
l
em
= 535 nm) and Texas Red (l
ex
570 nm; l
em
= 625
nm, images not shown). Autofluorescence was separated
in the red and green channels and brightness adjusted
using NIS-elements imaging software v. 2.20 (Nikon,
Badhoevedorp, The Netherlands). All tissue i mages have
been captured using the same magnification (4x objec-
tive; 10x on ocular).
Abbreviations
AA: artemisinic aldehyde; AAOH: artemisinic alcohol; AD: amorpha-4,11-
diene; ADS: amorpha-4,11-diene synthase; ALDH1: aldehyde dehydrogenase
1; CPR: cytochrome P450 reductase; CPS: β-caryophyllene synthase;
CYP71AV1: amorphadiene-12 -hydroxylase; DBR2: artemisinic aldehyde Δ11
(13) reductase; DHAA: dihydroartemisinic aldehyde; DXR: 1-deoxy-D-xylulose
5-phosphate reductase; DXS: 1-deoxy-D-xylulose 5-phosphate synthase; ECS:
epi-cedrol synthase; FDP: farnesyldiphosphate; FDS: farnesyl diphosphate
synthase; GAS: germacrene A synthase; GDP: geranyldiphosphate; HDR:
hydroxy-2-methyl-2-(E)-butenyl 4-diphosphate reductase; HMGR: 3-hydroxy-3-
methyl-glutaryl-CoA reductase; IDP: isopentenyldiphosphate; MSMO:
Murashige and Skoog medium with minimal organics; OPR3: 12-
oxophytodienoate reductase; PAL: phenylalanine ammonia lyase; RED1:
dihydroartemisinic aldehyde reductase; SQS: squalene synthase.
Acknowledgements
We are grateful to the reviewers of this paper who made us aware of the
high similarity between DBR2 and OPR3. We are grateful to Dr. Kanyaratt
Supaibulwatana, Mahidol University, Bangkok who supplied the hairy root
culture of Artemisia annua L. The financial support by the Faculty of Science
and Engineering is acknowledged.
Olofsson et al. BMC Plant Biology 2011, 11:45
/>Page 10 of 12
Authors’ contributions
LO planned the experimental setup and PB was involved in the study
design. AL prepared the plants. LO and AE carried out the RNA extraction,
cDNA synthesis and qPCR analysis and analyzed the data. LO and AL
performed the fluorescence microscopy. PB, LO, AL drafted and wrote the
manuscript. All authors have read and approved the final manuscript.
Received: 2 November 2010 Accepted: 9 March 2011
Published: 9 March 2011
References
1. Bosman A, Mendis KN: A major transition in malaria treatment: The
adoption and deployment of artemisinin-based combination therapies.
Am J Trop Med Hyg 2007, 77:193-197.
2. Covello PS: Making artemisinin. Phytochemistry 2008, 69:2881-2885.
3. Duke SO, Paul RN: Development and fine structure of the glandular
trichomes of Artemisia annua L. Int J Plant Sci 1993, 154:107-118.
4. Simon JE, Charles D, Cebert E, Grant L, Janick J, Whipkey A: Artemisia
annua L.: a promising aromatic and medicinal. In Advances in new crops.
Edited by: Janick J and Simon JE. Portland: Timber Press; 1990:522-526.
5. Mercke P, Crock J, Croteau R, Brodelius PE: Cloning, expression and
characterization of epi-cedrol synthase, a sesquiterpene cyclase from
Artemisia annua L. Arch Biochem Biophys 1999, 369:213-222.
6. Mercke P, Bengtsson M, Bouwmeester HJ, Posthumus MA, Brodelius PE:
Molecular cloning, expression, and characterization of amorpha-4,11-
diene synthase, a key enzyme of artemisinin biosynthesis in Artemisia
annua L. Arch Biochem Biophys 2000, 381:173-180.
7. Cai Y, Jia J-W, Crock J, Lin Z-X, Chen X-Y, Croteau R: A cDNA clone for β-
caryophyllene synthase from Artemisia annua. Phytochemistry 2002,
61:523-529.
8. Bertea CM, Voster A, Verstappen FW, Maffei M, Beekwilder J,
Bouwmeester HJ: Isoprenoid biosynthesis in Artemisia annua: cloning and
heterologous expression of a germacrene A synthase from a glandular
trichome cDNA library. Arch Biochem Biophys 2006, 448:3-12.
9. Picaud S, Brodelius M, Brodelius PE: Expression, purification and
characterization of β-farnesene synthase from Artemisia annua L.
Phytochemistry 2005, 66:961-967.
10. Brown GD: The biosynthesis of artemisinin and the phytochemistry of
Artemisia annua L. Molecules 2010, 15:7603-7698.
11. Bouwmeester HJ, Wallaart TE, Janssen MH, van Loo B, Jansen BJ,
Posthumus MA, Schmidt CO, de Kraker JW, Konig WA, Franssen MC:
Amorpha-4, 11-diene synthase catalyses the first probable step in
artemisinin biosynthesis. Phytochemistry 1999, 52:843-854.
12. Teoh KH, Polichuk DR, Reed DW, Nowak G, Covello PS: Artemisia annua L.
(Asteraceae) trichome-specific cDNAs reveal CYP71AV1, a cytochrome
P450 with a key role in the biosynthesis of the antimalarial
sesquiterpene lactone artemisinin. FEBS Lett 2006, 580
:1411-1416.
13.
Brown GD, Sy LK: In vivo transformations of artemisinic acid in Artemisia
annua plants. Tetrahedron 2006, 63:9548-9566.
14. Brown GD, Sy LK: In vivo transformations of dihydroartemisinic acid in
Artemisia annua plants. Tetrahedron 2004, 60:1139-1159.
15. Zhang Y, Teoh KH, Reed DW, Maes L, Goossens A, Olson DJ, Ross AR,
Covello PS: The molecular cloning of artemisinic aldehyde Δ11(13)
reductase and its role in glandular trichome-dependent biosynthesis of
artemisinin in Artemisia annua. J Biol Chem 2008, 283:21501-21508.
16. Teoh KH, Polichuk DR, Reed DW, Covello PS: Molecular cloning of an
aldehyde dehydrogenase implicated in artemisinin biosynthesis in
Artemsia annua. Botany 2009, 87:635-642.
17. Rydén A-M: Identification, characterization and expression of early
biosynthetic genes from Artemisia annua. PhD Thesis University of
Groningen, Department of Pharmaceutical Biology; 2010.
18. Rydén A-M, Ruyter-Spira C, Quax WJ, Osada H, Muranaka T, Kayser O,
Bouwmeester H: The Molecular cloning of dihydroartemisinic aldehyde
reductase and its implication in artemisinin biosynthesis in Artemisia
annua. Planta Med 2010, 76(15):1778-1783.
19. Wallaart TE, Pras N, Beekman AC, Quax WJ: Seasonal variation of
artemisinin and its biosynthetic precursors in plants of Artemisia annua
of different geographical origin; proof for the existence of chemotypes.
Planta Med 2000, 66:57-62.
20. Dhingra V, Narasu ML: Purification and characterization of an enzyme
involved in biochemical transformation of arteannuin B to artemisinin
from Artemisia annua. Biochem Biophys Res Commun 2001, 281:558-561.
21. Ferreira JFS, Janick J: Distribution of artemisinin in Artemisia annua. In
Progress in new crops. Edited by: Janick J. Arlington: ASHS Press;
1996:579-584.
22. Tellez MR, Canel C, Rimando AM, Duke SO: Differential accumulation of
isoprenoids in glanded and glandless Artemisia annua L. Phytochemistry
1999, 52:1035-1040.
23. Biswas KK, Foster AJ, Aung T, Mahmoud SS: Essential oil production:
relationship with abundance of glandular trichomes in aerial surface of
plants. Acta Physiol Plant 2009,
31:13-19.
24.
Chappell J, Wolf F, Proulx J, Cuellar R, Saunders C: Is the reaction catalyzed
by 3-hydroxy-3-methylglutaryl coenzyme A reductase a rate-limiting
step for isoprenoid biosynthesis in plants? Plant Physiol 1995,
109:1337-1343.
25. Schaller H, Grausem B, Benveniste P, Chye M-L, Tan CT, Song Y-H, Chua N-
H: Expression of the Hevea brasiliensis (H.B.K.) müll. Arg. 3-hydroxy-3-
methylglutaryl coenzyme A reductase 1 in tobacco results in sterol
overproduction. Plant Physiol 1995, 109:761-770.
26. Ram M, Khan MA, Jha P, Khan S, Kiran U, Ahmad MM, Javed S, Abdin MZ:
HMG-CoA reductase limits artemisinin biosynthesis and accumulation in
Artemisia annua L. plants. Acta Physiol Plant 2010, 32:859-866.
27. Stermer BA, Bianchini GM, Korth KL: Regulation of HMG-CoA reductase
activity in plants. J Lipid Res 1994, 35:1133-1140.
28. Cunillera N, Boronat A, Ferrer A: Spatial and temporal patterns of GUS
expression directed by 5’ regions of the Arabidopsis thaliana farnesyl
diphosphate synthase genes FPS1 and FPS2. Plant Mol Biol 2000,
44:747-758.
29. Han JL, Liu BY, Ye HC, Wang H, Li ZQ, Li GF: Effects of overexpression of
the endogenouse farnesyl diphosphate synthase on the artemisinin
content in Artemisia annua L. J Integr Plant Biol 2006, 48:482-487.
30. Banyai W, Kirdmanee C, Mii M, Supaibulwatana K: Overexpression of
farnesyl pyrophosphate synthase (FPS) gene affected artemisinin
content and growth of Artemisia annua L. Plant Cell Tiss Organ Cult .
31. Matsushita Y, Kang WK, Charlwood BV: Cloning and analysis of a cDNA
encoding farnesyl diphosphate synthase from Artemisia annua. Gene
1996, 172:207-209.
32. Zhao Y, Ye H, Li G, Chen D, Liu Y: Cloning and enzymology analysis of
farnesyl pyrophosphate synthase gene from a superior strain of
Artemisia annua L. Chi Sci Bull 2003, 48:63-67.
33. Cordoba E, Salmi M, León P: Unravelling the regulatory mechanisms that
modulate the MEP pathway in higher plants. J Exp Bot 2009,
60:2933-2943.
34. Schramek N, Wang H, Römisch-Margl W, Keil B, Radykewicz T,
Winzenhörlein B, Beerhues L, Bacher A, Rohdich F, Gershenzon J, Liu B,
Eisenreich W: Artemisinin biosynthesis in growing plants of Artemisia
annua.A
13
CO
2
study. Phytochemistry 2010, 71 :179-187.
35. Chang Y-J, Song S-H, Park S-H, Kim S-U: Amorpha-4,11-diene synthase of
Artemisia annua: cDNA isolation and bacterial expression of a terpene
synthase involved in artemisinin biosynthesis. Arch Biochem Biophys 2000,
383:178-184.
36. Wallaart TE, Bouwmeester HJ, Hille J, Poppinga L, Maijers NC: Amorpha-
4,11-diene synthase: cloning and functional expression of a key enzyme
in the biosynthetic pathway of the novel antimalarial drug artemisinin.
Planta 2001, 212:460-465.
37. Li ZQ, Liu Y, Liu BY, Wang H, Ye HC, Li GF: Cloning, E. coli expression and
molecular analysis of amorpha-4,11-diene synthase from a high-yield
strain of Artemisia annua L. J Integ Plant Biol 2006, 48:1486-1492.
38. Ro DK, Paradise EM, Ouellet M, Fisher KJ, Newman KL, Ndungu JM, Ho KA,
Eachus RA, Ham TS, Kirby J, Chang MC, Withers ST, Shiba Y, Sarpong R,
Keasling JD: Production of the antimalarial drug precursor artemisinic
acid in engineered yeast. Nature 2006, 440:940-943.
39. Olsson ME, Olofsson LM, Lindahl A-L, Lundgren A, Brodelius M,
Brodelius PE: Localization of enzymes of artemisinin biosynthesis to the
apical cells of glandular secretory trichomes of Artemisia annua L.
Phytochemistry 2009, 68:1864-1871.
40. Schaller F, Biesgen C, Müssig C, Altmann T, Weiler EW: 12-
Oxophytodienoate reductase 3 (OPR3) is the isoenzyme involved in
jasmonate biosynthesis. Planta 2000, 210:979-984.
Olofsson et al. BMC Plant Biology 2011, 11:45
/>Page 11 of 12
41. Maes L, Van Nieuwerburgh FCW, Zhang Y, Reed DW, Pollier J, Vande
Casteele SRF, Inzé D, Covello PS, Deforce DLD LD, Goossens A: Dissection
of the phytohormonal regulation of trichome formation and
biosynthesis of the antimalarial compound artemisinin in Artemisia
annua plants. New Phytologist 2011, 189:176-189.
42. Livak KJ, Schmittgen TD: Analysis of relative gene expression data using
real- time quantitative PCR and the 2
-ΔΔCT
method. Methods 2001,
25:402-408.
43. Liu CZ, Wang YC, Ouyang F, Ye HC, Li GF: Production of artemisinin by
hairy root cultures of Artemisia annua L. Biotechnol Lett 1997, 19:927-929.
44. Weathers PJ, Bunk G, McCoy MC: The effect of phytohormones on growth
and artemisinin production in Artemisia annua hairy root. In Vitro Cell Dev
Biol - Plant 2005, 41:47-53.
45. Banerjee S, Zehra M, Gupta MM, Kumar S: Agrobacterium rhizogenes-
mediated transformation of Artemisia annua: production of transgenic
plants. Planta Med 1997, 63:467-469.
46. Ma C, Wang H, Lu X, Wang H, Xu G, Liu B: Terpenoid metabolic profiling
analysis of transgenic Artemisia annua L. by comprehensive two-
dimensional gas chromatography time-of-flight mass spectrometry.
Metabolomics 2009, 5:497-506.
47. Zhang D, Jennings SM, Robinson GW, Poulter CD: Yeast squalene
synthase: Expression, purification and characterization of soluble
recombinant enzyme. Arch Biochem Biophys 1993, 304:133-143.
48. Liu CZ, Ye HC, Wang H, Li GF: Molecular cloning, Escherichia coli
expression and genomic organization of squalene synthase gene from
Artemisia annua. Acta Bot Sin 2003, 45:608-613.
49. Zhang L, Jing F, Li F, Li M, Wang Y, Wang G, Sun X, Tang K: Development
of transgenic Artemisia annua (Chinese wormwood) plants with an
enhanced content of artemisinin, an effective anti-malarial drug, by
hairpin-RNA-mediated gene silencing. Biotechnol Appl Biochem 2009,
52:199-207.
50. Ferreira JFS, Gonzalez JM: Analysis of underivatized artemisinin and
related sesquiterpene lactones by high-performance liquid
chromatography with ultraviolet detection. Phytochem Anal 2009,
20:91-97.
51. Ruijter JM, Ramakers C, Hoogaars WMH, Karlen Y, Bakker O, van den
Hoff MJB, Moorman AFM: Amplification efficiancy, linking baseline and
bias in the analysis of quantitative PCR data. Nucl Acids Res 2009, 37:e45.
52. Pfaffl MW, Tichopád A, Prgomet C, Neuvians TP: Determination of stable
housekeeping genes, differentially regulated target genes and sample
integrity: BestKeeper - Excel-based tool using pair-wise correlations.
Biotechnol Lett 2004, 26:509-515.
53. Pfaffl MW, Horgan GW, Dempfle L: Relative expression software tool
(REST) for group-wise comparison and statistical analysis of relative
expression results in real-time PCR. Nucl Acids Res 2002,
30:e36.
54. Picaud S, Olofsson L, Brodelius M, Brodelius PE: Expression, purification
and characterization of amorpha-4,11-diene synthase from Artemisia
annua L. Arch Biochem Biophys 2005, 436(2):215-226.
doi:10.1186/1471-2229-11-45
Cite this article as: Olofsson et al.: Relative expression of genes of
terpene metabolism in different tissues of Artemisia annua L. BMC Plant
Biology 2011 11:45.
Submit your next manuscript to BioMed Central
and take full advantage of:
• Convenient online submission
• Thorough peer review
• No space constraints or color figure charges
• Immediate publication on acceptance
• Inclusion in PubMed, CAS, Scopus and Google Scholar
• Research which is freely available for redistribution
Submit your manuscript at
www.biomedcentral.com/submit
Olofsson et al. BMC Plant Biology 2011, 11:45
/>Page 12 of 12