báo cáo khoa học: " Postmenopausal estrogen and progestin effects on the serum proteome" pot
Bạn đang xem bản rút gọn của tài liệu. Xem và tải ngay bản đầy đủ của tài liệu tại đây (161.33 KB, 14 trang )
Genome Medicine
2009,
11::
121
Research
PPoossttmmeennooppaauussaall eessttrrooggeenn aanndd pprrooggeessttiinn eeffffeeccttss oonn tthhee sseerruumm pprrootteeoommee
Sharon J Pitteri
1
, Samir M Hanash
1
, Aaron Aragaki
1
, Lynn M Amon
1
,
Lin Chen
1
, Tina Busald Buson
1
, Sophie Paczesny
1,2
, Hiroyuki Katayama
1,3
,
Hong Wang
1
, Melissa M Johnson
1
, Qing Zhang
1
, Martin McIntosh
1
,
Pei Wang
1
, Charles Kooperberg
1
, Jacques E Rossouw
4
, Rebecca D Jackson
5
,
JoAnn E Manson
6
, Judith Hsia
7
, Simin Liu
8
, Lisa Martin
9
,
and Ross L Prentice
1
Addresses:
1
Public Health Sciences Division, Fred Hutchinson Cancer Research Center, 1100 Fairview Ave N, Seattle, WA 98109, USA;
2
Department of Pediatrics, University of Michigan Comprehensive Cancer Center, 1500 East Medical Center Drive, Ann Arbor, MI 48109,
USA;
3
Biomarkers and Personalized Medicine Unit, Eisai Inc., 4 Corporate Drive, Andover, MA 01810, USA;
4
WHI Project Office, National
Heart, Lung, and Blood Institute, National Institutes of Health, 6701 Rockledge Drive, Bethesda, MD 20892, USA;
5
Division of
Endocrinology, Ohio State University, 198 McCampbell, 1581 Dodd Drive, Columbus, OH 43210, USA;
6
Division of Preventive Medicine,
Brigham and Women’s Hospital, Harvard Medical School, 75 Francis Street, Boston, MA 02115, USA;
7
Research and Development,
AstraZeneca LP, 1971 Rockland Road, Wilmington, DE 19803, USA;
8
Division of Public Health, Epidemiology & David Geffen School of
Medicine, Department of Medicine, Box 951772, Los Angeles, CA 90095, USA;
9
Department of Medicine, George Washington University,
2121 Eye St, NW; Washington, DC 20052, USA
Corresponding author: Ross L Prentice,
AAbbssttrraacctt
BBaacckkggrroouunndd
: Women’s Health Initiative randomized trials of postmenopausal hormone therapy
reported intervention effects on several clinical outcomes, with some important differences
between estrogen alone and estrogen plus progestin. The biologic mechanisms underlying these
effects, and these differences, have yet to be fully elucidated.
MMeetthhooddss
: Baseline serum samples were compared with samples drawn 1 year later for 50 women
assigned to active hormone therapy in both the estrogen-plus-progestin and estrogen-alone
randomized trials, by applying an in-depth proteomic discovery platform to serum pools from 10
women per pool.
RReessuullttss
: In total, 378 proteins were quantified in two or more of the 10 pooled serum
comparisons, by using strict identification criteria. Of these, 169 (44.7%) showed evidence
(nominal
P
< 0.05) of change in concentration between baseline and 1 year for one or both of
estrogen-plus-progestin and estrogen-alone groups. Quantitative changes were highly correlated
between the two hormone-therapy preparations. A total of 98 proteins had false discovery rates
<0.05 for change with estrogen plus progestin, compared with 94 for estrogen alone. Of these,
84 had false discovery rates <0.05 for both preparations. The observed changes included multiple
proteins relevant to coagulation, inflammation, immune response, metabolism, cell adhesion,
Published: 24 December 2009
Genome Medicine
2009,
11::
121 (doi:10.1186/gm121)
The electronic version of this article is the complete one and can be
found online at />Received: 9 September 2009
Revised: 7 November 2009
Accepted: 24 December 2009
© 2009 Pitteri
et al.
; licensee BioMed Central Ltd.
This is an Open Access article distributed under the terms of the Creative Commons Attribution License ( />which permits unrestricted use, distribution, and reproduction in any medium, provided the original work is properly cited.
BBaacckkggrroouunndd
Postmenopausal hormone therapy was shown to have
multiple effects of public-health importance in the Women’s
Health Initiative (WHI) randomized, placebo-controlled
hormone-therapy trials of 0.625 mg/day conjugated equine
estrogen (E-alone) [1] or of this same estrogenic preparation
plus 2.5 mg/day medroxyprogesterone acetate (E+P) [2],
over respective average intervention periods of 7.1 and
5.6 years. The observed effects were similar for the two
preparations for some outcomes, including stroke [3,4] and
hip fracture [5,6]; whereas E+P effects were unfavorable
(P < 0.05) compared with those for E-alone for other out-
comes, including coronary heart disease (CHD) [7,8], breast
cancer [9,10], and venous thromboembolism (VT) [11,12],
and a global index [1,2] that was designed to summarize
major health benefits versus risks [13].
Several of the articles just cited formally examined whether
interactions occurred between the hormone-therapy hazard
ratios and baseline study-subject characteristics. Although
some moderate variations were detected (for example, for
E-alone and breast cancer [10]), these tended to provide
limited insight into the biologic mechanisms and pathways
involved in the observed clinical effects. A cardiovascular
disease nested case-control study also was conducted to
relate baseline values of candidate biomarkers and post-
randomization biomarker changes to observed hormone-
therapy effects. This study confirmed baseline biomarker
disease associations and identified some pertinent bio-
marker changes after hormone-therapy initiation, but
identified few interactive or explanatory biomarkers for
either CHD [14] or stroke [15], although the E+P hazard
ratio elevation for CHD appeared to be smaller among
women having relatively low baseline low-density lipo-
protein cholesterol [14].
It follows that much remains to be explained about the
pattern of biologic changes induced by these hormone-therapy
preparations in relation to the outcome effects mentioned
earlier. Proteomic discovery work has the potential to
identify biomarkers that may help to explain E+P or E-alone
clinical effects or differences in effects between the two
preparations. Hence, we applied a comprehensive quanti-
tative proteomic approach designated Intact Protein
Analysis System (IPAS) [16-19] to compare the serum
proteome at 1 year after randomization to baseline for
50 women assigned to E+P and for 50 women assigned to
E-alone, in the WHI hormone-therapy trials. These women
were selected to be free of major disease outcomes through
the WHI clinical trial intervention phase and were selected
to be adherent to their assigned hormone regimen over the
first year of treatment, but were otherwise randomly selected
from women assigned to active treatment in the trial
cohorts. The IPAS approach involves extensive fractionation
followed by tandem mass spectrometry and is capable of
identifying proteins over seven orders of abundance. For
reasons of throughput, serum pools were formed from
10 E+P women (five baseline and five 1-year pools), or from
10 E-alone women, before proteomic analysis.
We recently reported [20] proteomic changes from the
E-alone component of this project. An impressive 10.5% of
proteins had false discovery rates, for a change, of <0.05.
The affected proteins had relevance to multiple pathways,
including coagulation, metabolism, osteogenesis, and
inflammation, among others. Ten of 14 protein changes
tested were confirmed with enzyme-linked immunosorbent
assays (ELISAs) in the original samples, and in serum
samples from 50 nonoverlapping randomly chosen women,
selected by using the same criteria, from the E-alone trial
treatment group.
Here, we sought to uncover proteins and pathways that are
differentially affected by E+P therapy relative to E-alone that
would provide leads for the comparatively unfavorable
effects with E+P observed in these trials.
MMeetthhooddss
SSttuuddyy ccoohhoorrttss
The use of human samples was approved by the Fred
Hutchinson Cancer Research Center Institutional Review
Board. Fifty study subjects were randomly selected from the
8,506 women assigned to active E+P in the WHI clinical
trial, which also included 8,102 women assigned to placebo.
All women were postmenopausal, with a uterus, and in the
age range from 50 to 79 years, at recruitment during 1993
through 1998. The selected women were required to have
been adherent to study medication (80% or more of pills
taken) over the first year after randomization, and without a
/>Genome Medicine
2009, Volume 1, Issue 12, Article 121 Pitteri
et al.
121.2
Genome Medicine
2009,
11::
121
growth factors, and osteogenesis. Evidence of differential changes also was noted between the
hormone preparations, with the strongest evidence in growth factor and inflammation pathways.
CCoonncclluussiioonnss
: Serum proteomic analyses yielded a large number of proteins similarly affected by
estrogen plus progestin and by estrogen alone and identified some proteins and pathways that
appear to be differentially affected between the two hormone preparations; this may explain their
distinct clinical effects.
major clinical event (CHD, stroke, VT, breast or colorectal
cancer, or hip fracture) over the intervention and follow-up
period (through March 2005). A second nonoverlapping
subset of E+P women was selected, by using the same
criteria, for replication studies with ELISA. As previously
reported [20], the same selection criteria were used for the
E-alone discovery and replication phases of the study.
Women enrolled in the E-alone trial (10,739) satisfied the
same eligibility criteria as E+P enrollees, but were post-
hysterectomy at randomization. Women who used hormone
therapy before trial enrollment had mostly stopped such
treatment, months or years before enrollment, and were
otherwise required to undergo a 3-month washout before
randomization. Serum samples, collected at baseline and
1 year, were stored at -80° C until proteomic analyses.
SSaammppllee pprreeppaarraattiioonn,, pprrootteeiinn ffrraaccttiioonnaattiioonn,, aanndd mmaassss
ssppeeccttrroommeettrryy aannaallyyssiiss
These methods were previously described [20] in detail and
are only briefly summarized here. As in the E-alone project
component, pools formed from 30 µl of serum for 10
randomly selected women from the 50 E+P group women
were formed from baseline and 1-year specimens.
After immunodepletion of the six most abundant proteins
(albumin, IgG, IgA, transferrin, haptoglobin, and anti-
trypsin), pools were concentrated, and intact proteins having
cysteine residues were isotopically labeled with acrylamide
(baseline pools received the ‘light’ C12 acrylamide; 1-year
pools the ‘heavy’ C13 acrylamide). The baseline and 1-year
pools were than mixed together for further analysis.
The combined sample was diluted, and each sample was
separated into 12 subsamples by using anion exchange
chromatography, and each subsample was further separated
into 60 fractions by using reversed-phase chromatography,
giving a total of 720 fractions for each original mixed
sample. Aliquots of 200 µl from each fraction, corres-
ponding to about 200 µg of protein, were separated for mass
spectrometry ‘shotgun’ analysis.
Lyophilized aliquots from the 720 individual fractions were
subjected to in-solution trypsin digestion, and individual
digested fractions, four to 60 from each reversed-phase run,
were combined into 11 pools, giving a total of 132 (12 × 11)
fractions for analysis from each original mixed baseline and
1-year pool. Tryptic peptides were analyzed with an LTQ-FT
mass spectrometer. Spectra were acquired in a data-depen-
dent mode in a mass/charge range of 400 to 1,800, and the
five most abundant +2 or +3 ions were selected from each
spectrum for tandem mass spectrometry (MS/MS) analysis.
PPrrootteeiinn iiddeennttiiffiiccaattiioonn aanndd bbaasseelliinnee vveerrssuuss 11 yyeeaarr ccoonncceennttrraattiioonn
aasssseessssmmeenntt
The acquired LC-MS/MS data were automatically processed
by the Computational Proteomics Analysis System [21].
Database searches were performed by using X!Tandem
against the human International Protein Index (IPI) by
using tryptic search. Database search results were analyzed
by using PeptideProphet [22] and ProteinProphet [23].
The relative quantitation of 1-year to baseline concentration
for cysteine-containing peptides identified by MS/MS was
extracted by using a script designated Q3 ProteinRatioParser
[16], which calculates the relative peak areas of heavy to light
acrylamide-labeled peptides. Peaks with zero area were reset
to a background value to avoid singularities. Peptides having
PeptideProphet ≥0.75, Tandem expect score <0.10, and
mass deviation <20 ppm were considered for quantification.
Proteins were identified as those having ProteinProphet
scores ≥0.90, and their ratios were calculated by taking the
geometric mean of all the associated peptide ratios. Proteins
from all 10 IPAS experiments were aligned by their protein
group number, assigned by ProteinProphet, to identify
master groups of indistinguishable proteins across experi-
ments. Ratios for these protein groups were logarithmically
transformed and median-centered at zero. The following
protein groups were removed in this analysis: groups that
had fewer than five peptide ratios across all 10 experiments;
groups that contained proteins that were targeted for
depletion; and groups in which all proteins had been
annotated as ‘defunct’ by IPI.
SSttaattiissttiiccaall aannaallyyssiiss ooff 11 yyeeaarr vveerrssuuss bbaasseelliinnee pprrootteeiinn
ccoonncceennttrraattiioonnss
Protein log-(concentration) ratios were analyzed by first
normalizing further, so that the median of the log-ratios is
zero for all the proteins identified from a mixed baseline and
1-year sample. Concentration changes after E+P use were
identified by testing the hypothesis that the mean of the log-
ratios across the (up to 5) mixed samples is zero, by using a
weighted moderated t statistic [24] implemented in the R
package LIMMA [25]: the log-ratios were weighted by the
number of quantified peptides for each protein, and a matrix
of weights was included in the linear model. The variance
was estimated by using the sum of the sample variances from
the E+P and E-alone data, with the requirement of at least one
degree of freedom for variance estimation. Benjamini and
Hochberg’s method [26] was used to accommodate multiple
testing for the large number of proteins quantified, through
the calculation of estimated false discovery rates (FDRs).
The same method was used to identify proteins for which the
1-year to baseline change in concentration differed between
E+P and E-alone. Specifically, a moderated t statistic was
used to test for a difference in means between the log-ratios
for E+P and those for E-alone, with common log-ratio
variance for the two preparations.
BBiioollooggiicc ppaatthhwwaayy aannaallyyssiiss
We developed a regularized Hotelling T
2
procedure (Chen
LS, Prentice RL, and Wang P, submitted for publication,
/>Genome Medicine
2009, Volume 1, Issue 12, Article 121 Pitteri
et al.
121.3
Genome Medicine
2009,
11::
121
2009) to identify sets of proteins, defined by biologic
pathways, that change concentration with E+P, or that
change differentially in the E+P and E-alone project compo-
nents. This testing procedure takes advantage of the
correlation structure among the log-ratios for proteins in a
given set. Protein sets were defined by using the KEGG
database [27,28].
To accommodate multiple hypotheses testing issues, the
significance for individual proteins or for biologic pathways,
is based on a 5% FDR criterion.
EELLIISSAA bbaasseedd vvaalliiddaattiioonn
ELISAs are commercially available for some of the proteins
for which evidence emerged of change after E+P use, or of
differential change between E+P and E-alone. ELISA tests
were applied according to manufacturer’s protocols for
individual baseline and 1-year serum samples from an
additional randomly selected nonoverlapping 50 E+P and 50
E-alone women, for independent validation of leads from the
proteomic discovery work. P values were obtained by
applying t tests to log-transformed 1-year-to-baseline concen-
tration ratios. Log-ratios from ELISA and IPAS were
compared to assess discovery platform signals.
RReessuullttss
The average age at enrollment for the selected 50 E+P
women is 63.2, similar to that for the trial cohort as a whole.
Other study-subject characteristics were generally similar
also to those for the entire trial cohort [2], as was also the
case for the 50 selected E-alone women [20]. Subject
characteristics for both studies are shown in Table 1. Some
characteristics varied among the pools of size 10, as expected
with the random assignment of women to pools. For
example, the average baseline age (standard deviation) for
the five E+P pools was 60.6 (8.4), 65.8 (5.3), 63.5 (8.5), 63.2
(7.1), and 62.8 (7.0), respectively. The project generated
2,576,869 spectra from the E+P pools, as compared with
2,458,506 from the E-alone pools. These led to the identifi-
cation of 3,669 IPI-based proteins from the E+P pools
compared with 4,679 from the E-alone analyses; and 942
IPI-based relative protein concentrations for E+P, versus
1,054 for E-alone, including 698 that were quantified in both
E+P and E-alone analyses.
SSeerruumm pprrootteeiinn ccoonncceennttrraattiioonn rraattiiooss
Protein concentration ratios were further filtered and curated
by using stringent standards (see Methods) for protein
identification, including a requirement that a protein is
quantified in at least two of the 10 IPAS experiments leading
to a focus on 378 proteins (IPIs), all but 10 of which were
quantified for both E+P and E-alone. A remarkable 169
(44.7%) of these showed evidence (nominal P < 0.05) of
change from baseline to 1-year with E+P or E-alone, or with
both. For E+P, 371 proteins were quantified under these
quality standards, of which 132 (35.6%) had P < 0.05 as
compared with 18.6 expected by chance, and 98 (26.4%) had
FDRs <0.05 compared with 94 for E-alone. Of these, 84 had
FDR <0.05 for both preparations. Table S1 in Additional
file 1 shows estimated 1-year-to-baseline concentration log
ratios for all 378 proteins ranked according to the minimum
of P values for change with E+P or change with E-alone.
Significance levels (P values) are also given for a test of
equality of the E+P and E-alone ratios.
Table 2 lists proteins for which strong evidence (FDR < 0.01)
exists of changed concentration with E+P or with E-alone,
according to biologic pathways that were found to be
associated with E-alone use in [20]. Nominal P values and
FDRs for change also are provided. Of note, five proteins
involved in the insulin growth factor pathway are repre-
sented in Table 2. Five of these proteins have 1.25-fold or
greater changes in their concentrations with E-alone or E+P
treatment or both. Protein NOV homologue (NOV) and
insulin-like growth factor 1 (IGF1) were both decreased with
E-alone and E+P. Insulin-like growth factor-binding protein 1
(IGFBP1) level was increased with both E-alone and E+P.
Strong evidence of the E+P effect exists on each of blood
coagulation and inflammation, metabolism, osteogenesis,
complement and immune response, and cell adhesion. More-
over, the changes (base 2 logarithm of 1-year-to-baseline
concentration ratio in Table 2) are mostly quantitatively very
similar between E+P and E-alone, attesting to major effects
of conjugated equine estrogens on the serum proteome.
Table 3 presents the differences in quantitative ratios for
E+P minus E-alone that were nominally significantly differ-
ent (P < 0.05) from each other. For this analysis, we tested
the 368 proteins meeting our identification and quantifi-
cation criteria that were common to both E+P and E-alone.
Twenty-six proteins were identified with nominal P values
<0.05 for differential change between E+P and E-alone. The
list includes proteins involved in insulin growth factor
binding and inflammation. Insulin growth factor-binding
proteins (IGFBPs) may be affected differently by E+P
compared with E-alone. Specifically, three proteins show
nominally statistically significant differences with E+P
compared with E-alone. IGFBP1 is increased (log
2
ratio,
1.27) with E-alone, but the increase is mitigated with E+P
(log
2
ratio, 0.528). IGFBP4 is increased with E-alone (log
2
ratio, 0.511), but not with E+P (log ratio, 0.179). NOV, also
known as IGFBP9, is decreased with E-alone (log
2
ratio, -
0.344) and decreased to a greater extent with E+P (log
2
ratio, -0.759).
PPrrootteeiinn sseett aannaallyysseess
In addition to the protein classifications presented earlier,
the 368 proteins quantified for both E+P and E-alone were
subjected to protein set analysis. In total, 41 KEGG human
disease pathways were represented by at least two proteins
in this group. Each protein has been quantified in at least
/>Genome Medicine
2009, Volume 1, Issue 12, Article 121 Pitteri
et al.
121.4
Genome Medicine
2009,
11::
121
/>Genome Medicine
2009, Volume 1, Issue 12, Article 121 Pitteri
et al.
121.5
Genome Medicine
2009,
11::
121
TTaabbllee 11
BBaasseelliinnee cchhaarraacctteerriissttiiccss aammoonngg wwoommeenn iinncclluuddeedd iinn hhoorrmmoonnee tthheerraappyy pprrootteeoommiiccss pprroojjeecctt ((
nn
== 5500 ffoorr EE++PP aanndd ffoorr EE aalloonnee ttrriiaallss))
E+P E-alone
Number % Number % P value
a
Age group at screening, years 0.20
50-59 17 34.0 25 50.0
60-69 21 42.0 13 26.0
70-79 12 24.0 12 24.0
Minority race/ethnicity 3 6.0 8 16.0 0.20
Postmenopausal hormone therapy use 0.69
Never used 31 62.0 26 52.0
Past user 15 30.0 19 38.0
Current user (3-month ‘wash out’ before enrollment) 4 8.0 5 10.0
Smoking 0.50
Never 34 69.4 29 58.0
Past 14 28.6 19 38.0
Current 1 2.0 2 4.0
Parity 0.74
Never pregnant/no term pregnancy 6 12.0 4 8.0
≥1 term pregnancy 44 88.0 46 92.0
Age at first birth, years 0.38
<20 8 21.1 15 34.1
20-29 29 76.3 27 61.4
30+ 1 2.6 2 4.5
Treated diabetes 2 4.0 7 14.0 0.16
Treated for hypertension or BP ≥140/90 15 31.9 17 37.0 0.67
History of high cholesterol requiring pills 2 4.3 2 4.5 >0.99
Statin use at baseline 0 0.0 2 4.0 0.49
Aspirin (≥80 mg) use at baseline 8 16.0 8 16.0 >0.99
History of MI 1 2.0 0 0.0 >0.99
History of angina 1 2.0 3 6.0 0.62
History of CABG/PTCA 1 2.0 0 0.0 >0.99
History of DVT or PE 1 2.0 0 0.0 >0.99
Family history of breast cancer (female) 6 13.0 7 14.6 >0.99
History of fracture on or after age 55 3 8.3 1 3.1 0.62
Gail Model Five Year Risk of Breast Cancer 0.26
<1 7 14.0 10 20.0
1 - <2 31 62.0 34 68.0
2 - <5 12 24.0 6 12.0
Number of falls in last 12 months 0.97
None 31 66.0 30 69.8
1 time 9 19.1 7 16.3
2 times 6 12.8 6 14.0
3 or more times 1 2.1 0 0.0
Mean SD Mean SD
P
value
b
Age at screening, years 63.2 7.2 61.4 7.9 0.24
Body-mass index (BMI), kg/m
2
28.8 6.0 31.1 6.1 0.05
aa
P
value based on Fisher’s Exact test of association.
b
P
value based on two-sample
t
test. MI = myocardial infarction; CABG/PCTA = coronary artery
bypass graft/percutaneous transluminal angiography; DVT = deep vein thrombosis; PE = pulmonary embolus.
/>Genome Medicine
2009, Volume 1, Issue 12, Article 121 Pitteri
et al.
121.6
Genome Medicine
2009,
11::
121
TTaabbllee 22
GGeennee oonnttoollooggyy ccllaassssiiffiiccaattiioonn ooff pprrootteeiinnss wwiitthh ssttaattiissttiiccaallllyy ssiiggnniiffiiccaanntt cchhaannggeess ((FFDDRR << 00 0011)) ffoorr EE++PP oorr EE aalloonnee
E+P E-Alone
Log
2
ratio Log
2
ratio
year 1 year 1
relative to relative to
Protein Description baseline
P
value FDR baseline
P
value FDR
Blood coagulation and inflammation
VTN
Vitronectin 0.352 2.16E-07 2.68E-05 0.368 7.09E-08 8.98E-06
CP
Ceruloplasmin 0.679 5.19E-07 2.87E-05 0.752 3.01E-07 2.86E-05
SERPINC1
Antithrombin III variant -0.196 5.05E-06 0.000157 -0.143 5.50E-05 0.00106
PLG
Plasminogen 0.224 1.56E-05 0.000404 0.230 1.24E-05 0.000393
HABP2
Uncharacterized protein 0.251 5.23E-05 0.00108 0.309 7.24E-05 0.00131
F12
Coagulation factor XII 0.261 0.000102 0.00158 0.252 0.000219 0.00268
APOH
β
2
-Glycoprotein 1 0.149 0.000199 0.00242 0.193 8.89E-05 0.00135
ATRN
Attractin -0.190 0.000213 0.00242 -0.126 0.00366 0.0214
F9
Coagulation factor IX 0.540 0.000214 0.00242 0.572 0.000511 0.00498
TFPI
Tissue factor pathway inhibitor -0.396 0.000315 0.00317 -0.369 8.49E-05 0.00135
KNG1
Kininogen-1 0.152 0.00106 0.00786 0.228 5.60E-05 0.00106
Metabolism
GC
Vitamin D-binding protein 0.231 3.10E-06 0.000115 0.237 2.75E-06 0.000131
HPX
Hemopexin 0.123 6.65E-05 0.00118 0.117 0.000124 0.00162
RBP4
Plasma retinol-binding protein 0.167 0.000117 0.00161 0.177 0.000262 0.00311
APOA2
Apolipoprotein A-II 0.212 0.000532 0.00483 0.302 1.75E-05 0.000475
ENPP2
Ectonucleotide Pyrophosphatase/ 0.369 0.00692 0.0333 0.650 0.000749 0.00619
phosphodiesterase family member 2
Osteogenesis
FETUB
Fetuin-B 0.783 1.09E-09 4.04E-07 0.741 1.02E-09 3.89E-07
COL1A1
Collagen α-1(I) chain -0.896 5.40E-07 2.87E-05 -0.575 8.80E-05 0.00135
AHSG
α
2
-HS-glycoprotein 0.211 3.44E-06 0.000116 0.243 7.46E-07 5.02E-05
NOTCH2
Neurogenic locus notch -0.784 0.000315 0.00317 -0.062 0.648 0.815
homologue protein 2
Complement and immune response
PGLYRP2
N-acetylmuramoyl-L-alanine amidase -0.343 1.49E-06 6.17E-05 -0.335 3.72E-06 0.000141
ORM2
α
1
-acid glycoprotein 2 -0.181 1.63E-05 0.000404 -0.144 8.38E-05 0.00135
C4BPA
C4B-binding protein α chain -0.200 3.34E-05 0.000731 -0.148 0.000377 0.00398
CFHR1
Complement factor H-related protein 1 0.162 8.95E-05 0.00145 0.185 2.96E-05 0.000661
CFB
Complement factor B 0.137 0.000106 0.00158 0.210 5.58E-06 0.000193
C8A
Complement component C8 α chain -0.206 0.000163 0.00216 -0.202 0.000121 0.00162
C4BPB
C4B-binding protein β chain -0.260 0.00018 0.0023 -0.196 0.00156 0.0112
PGLYRP1
Peptidoglycan recognition protein 0.321 0.000232 0.00253 -0.056 0.458 0.68
CFHR5
Complement factor H-related 5 0.179 0.000264 0.00281 0.241 2.76E-05 0.000656
MASP2
Mannan-binding lectin serine protease 2 0.200 0.000435 0.00415 0.173 0.000643 0.00568
CFHR2
Complement factor H-related protein 2 0.181 0.000449 0.00417 0.205 0.00016 0.00203
C8B
Complement component C8 β chain -0.221 0.00059 0.00522 -0.199 0.0015 0.0112
ITIH4
Inter-α-trypsin inhibitor heavy chain H4 0.458 0.000733 0.00634 0.374 0.00495 0.0273
VNN1
Pantetheinase 0.477 0.000888 0.00688 0.517 0.00124 0.00963
C6
complement component C6 -0.123 0.00151 0.011 -0.171 0.000123 0.00162
B2M
β
2
-microglobulin 0.208 0.00205 0.0144 0.230 0.0011 0.00873
LRG1
Leucine-rich α
2
-glycoprotein 0.278 0.00553 0.0278 0.445 0.000582 0.0054
MBL2
Mannose-binding protein C -0.190 0.00677 0.0331 -0.341 9.37E-05 0.00137
Continued overleaf
two IPAS experiments in both E+P and E-alone. Table 4
indicates pathways that show a baseline versus 1-year
difference for E+P and E-Alone at FDR < 0.05 by using a
regularized Hotelling T
2
test. We also tested the equality of
log-concentration ratios between the two regimens for
proteins in these pathways by using the same test statistic.
Two pathways had FDR < 0.05 (Table 5). The gonadotropin-
releasing hormone (GnRH) signaling pathway, known to be
regulated by estrogen, was represented by two proteins
(matrix metalloproteinase 2 (MMP2) and phospholipase A
2
(PLA2G1B)), and a pathway associated with bladder cancer
was represented by three proteins (MMP2, thrombospondin 1
(THBS1), and vascular endothelial growth factor C (VEGFC)).
Both pathways had nominal P values of 0.002, with corres-
ponding FDRs of 0.041. MMP2, a collagenase with the
ability to break down extracellular matrix proteins, was
common to both pathways, and substantially explains the
difference between the two regimens for these pathways.
/>Genome Medicine
2009, Volume 1, Issue 12, Article 121 Pitteri
et al.
121.7
Genome Medicine
2009,
11::
121
TTaabbllee 22 ((
CCoonnttiinnuueedd
))
GGeennee oonnttoollooggyy ccllaassssiiffiiccaattiioonn ooff pprrootteeiinnss wwiitthh ssttaattiissttiiccaallllyy ssiiggnniiffiiccaanntt cchhaannggeess ((FFDDRR << 00 0011)) ffoorr EE++PP oorr EE aalloonnee
E+P E-Alone
Log
2
ratio Log
2
ratio
year 1 year 1
relative to relative to
Protein Description baseline
P
value FDR baseline
P
value FDR
Complement and immune response (
Continued
)
LILRA3
Leukocyte immunoglobulin-like -0.237 0.00874 0.0374 -0.281 0.000277 0.00319
receptor subfamily A member 3
FN1
Fibronectin -0.193 0.0663 0.176 -0.358 0.000574 0.0054
Cell adhesion
ICAM1
Intercellular adhesion molecule 1 -0.299 2.69E-05 0.000626 -0.142 0.00171 0.012
MEGF10
Multiple epidermal growth -1.330 0.0365 0.114 -1.100 0.000671 0.0058
factor-like domains 10
Growth factor activity
IGFBP7
Insulin-like growth factor-binding -0.295 0.000404 0.00395 -0.133 0.0342 0.109
protein 7
NOV
Protein NOV homologue -0.759 0.00083 0.00672 -0.344 0.0123 0.0506
IGF1
Insulin-like growth factor IA -0.353 0.000981 0.00745 -0.371 0.000403 0.00414
IGFBP1
Insulin-like growth factor-binding 0.528 0.00242 0.0158 1.270 3.66E-06 0.000141
protein 1
IGFBP4
Insulin-like growth factor-binding 0.179 0.102 0.234 0.511 0.000697 0.00588
protein 4
Other
SHBG
Sex hormone-binding globulin 1.460 1.14E-08 2.13E-06 1.450 2.57E-08 4.88E-06
AGT
Angiotensinogen 1.150 3.09E-07 2.87E-05 1.200 2.05E-06 0.000111
LUM
Lumican -0.382 4.81E-07 2.87E-05 -0.163 0.00175 0.0121
TFF3
Trefoil factor 3 2.590 8.84E-07 4.11E-05 2.160 2.06E-05 0.000522
OAF
Out at first protein homologue 0.398 7.32E-06 0.000209 0.393 4.17E-05 0.000881
A1BG
α
1B
-Glycoprotein 0.167 5.71E-05 0.00112 0.266 7.92E-07 5.02E-05
ABI3BP
Target of NESH-SH3 -0.290 6.07E-05 0.00113 -0.184 0.00149 0.0112
CLEC3B
Tetranectin -0.240 7.65E-05 0.00129 -0.158 0.00102 0.00827
FBN1
Fibrillin-1 -0.365 0.000114 0.00161 -0.269 1.45E-05 0.000423
DBH
Dopamine β-hydroxylase -0.262 0.000207 0.00242 -0.186 0.00203 0.013
FGA
Fibrinogen α chain 0.364 0.00076 0.00643 0.303 0.00741 0.0373
SPARCL1
SPARC-like protein 1 -0.311 0.0008 0.00661 -0.043 0.508 0.722
CPN2
Carboxypeptidase N subunit 2 0.161 0.000865 0.00685 0.190 0.000331 0.0036
AMBP
AMBP protein 0.116 0.00283 0.0174 0.148 0.00061 0.00552
PEAR1
Platelet endothelial aggregation -0.650 0.00948 0.0379 -0.722 0.000424 0.00424
receptor 1
AFM
Afamin 0.058 0.119 0.259 0.177 0.00033 0.0036
P
value = significance level for test of no change in protein concentration; FDR = estimated false discovery rate for this test.
EELLIISSAA bbaasseedd pprrootteeiinn aassssaayyss iinn aann iinnddeeppeennddeenntt sseett ooff ssuubbjjeeccttss
The 26 proteins with nominal P < 0.05 for differential change
between E+P and E-alone based on IPAS mass spectrometry
findings each had FDR > 0.3, so that many of these may be
attributable to chance. We sought to determine whether
concordant changes in these proteins can be demonstrated
in an independent set of subjects and with independent
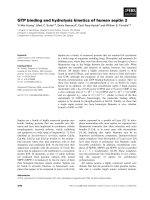
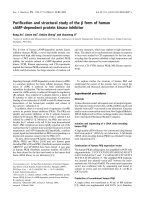
methods. Figure 1 shows 1-year-to-baseline concentration
log-ratios (95% confidence intervals (CIs)) from IPAS mass
spectrometry data along with corresponding values from
ELISA evaluation of 1-year-to-baseline ratios for an indepen-
dent set of 50 women selected from the active-treatment
group in the E+P trial. Corresponding IPAS and ELISA
information also is provided for E-alone. We observed
concordance of IPAS and ELISA data between the two sets of
subjects for six of eight proteins assayed. The lack of
replication for ceruloplasmin (CP) and ICAM1 may be due to
multiple comparison effects in the discovery component or
other factors, notably distinct epitope targets by ELISA
assays compared with quantified peptides by mass
spectrometry.
DDiissccuussssiioonn
These analyses show that 1 year of use of E+P has a profound
effect on the serum proteome, with more than a fourth
(26.4%) of quantified proteins having FDR < 0.05 for change.
Eight proteins with altered levels were further tested in an
/>Genome Medicine
2009, Volume 1, Issue 12, Article 121 Pitteri
et al.
121.8
Genome Medicine
2009,
11::
121
TTaabbllee 33
DDiiffffeerreennccee iinn YYeeaarr 11 ffrroomm bbaasseelliinnee ccoonncceennttrraattiioonn rraattiiooss ((EE++PP mmiinnuuss EE AAlloonnee)) ffoorr aallll pprrootteeiinnss wwiitthh ddiiffffeerreennccee ooff
PP
<< 00 0055
Difference of log
2
ratios (year 1
Protein Description relative to baseline): E+P minus E-alone P-Diff FDR
LUM
Lumican -0.219 0.00141 0.317
IGFBP1
Insulin-like growth factor-binding protein 1 -0.742 0.00227 0.317
PGLYRP1
Peptidoglycan recognition protein 0.377 0.00259 0.317
NOTCH2
Neurogenic locus notch homologue protein 2 -0.723 0.00426 0.33
ACTB
Actin cytoplasmic 1 0.667 0.00527 0.33
LYVE1
Lymphatic vessel endothelial hyaluronic acid receptor 1 -0.217 0.00538 0.33
AZGP1
α
2
-Glycoprotein 1 zinc 0.496 0.00776 0.408
ICAM1
Intercellular adhesion molecule 1 -0.158 0.0126 0.511
SPARCL1
SPARC-like protein 1 -0.268 0.0138 0.511
COL1A1
Collagen α-1(I) chain -0.321 0.015 0.511
A1BG
α
1B
-glycoprotein -0.099 0.0153 0.511
SEPP1
Selenoprotein P 0.756 0.0181 0.549
F5
Coagulation factor V 0.301 0.0194 0.549
CFL1
Cofilin-1 0.597 0.023 0.549
C6orf115
Similar to protein C6ORF115 1.070 0.0233 0.549
MMP2
72-kDa type IV collagenase 1.190 0.0246 0.549
HRG
Histidine-rich glycoprotein -0.136 0.0282 0.549
ABCA9
ATP-binding cassette subfamily A member 9 3.280 0.0284 0.549
MMRN1
Multimerin-1 0.691 0.0293 0.549
AFM
Afamin -0.120 0.0298 0.549
MCAM
Cell-surface glycoprotein MUC18 -0.357 0.0409 0.614
NOV
Protein NOV Homologue -0.415 0.0409 0.614
TFF2
Trefoil factor 2 -1.920 0.0412 0.614
ECM1
Extracellular matrix protein 1 -0.184 0.0412 0.614
IGFBP4
Insulin-like growth factor-binding protein 4 -0.332 0.0442 0.614
CFB
Complement factor B -0.073 0.0444 0.614
P-Diff = significance level for test of equality of protein-concentration ratios for E+P and E-alone; FDR = estimated false discovery rate for this test.
independent set of samples. ELISA assays of six of the eight
proteins showed changes concordant with the mass spectro-
metry data. The correlation of initial concentration ratios by
mass spectrometry with ELISA ratios from an independent
set of samples supports the reliability of the protein changes
observed. Our previous report on E-alone [20] provided a
detailed discussion of the proteins that changed after
treatment with conjugated equine estrogens, in which 19% of
proteins were changed after 1 year of treatment. Findings for
10 proteins were confirmed and validated by ELISA assays.
Proteins altered with E-alone therapy had relevance to
processes such as coagulation, inflammation, growth factors,
osteogenesis, metabolism, and cell adhesion, among others.
The most striking feature of the present E+P analysis is the
similarity in these quantitative proteomic changes when
medroxyprogesterone acetate is added to the daily conju-
gated equine estrogen. For changes with E+P, 98 proteins
had FDR < 0.05 compared with 94 proteins for E-alone. Of
these, 84 proteins had FDR < 0.05 for both preparations,
and corresponding intensity ratios tended to be quite similar
between the two regimens for most of these proteins. Hence,
our prior discussion [20] of proteins and pathways that were
changed after E-alone is largely applicable to the E+P
hormone preparation as well. The 1 year of aging between
the baseline and 1-year blood-sample collection could have
some influence on the serum proteome, but any such
influence should be absent for the comparison of E+P versus
E-alone changes, because age-related changes would apply
equally for the two regimens.
When we specifically sought proteins for which the change
with E+P differed from that for E-alone, a number of
potential proteins (Table 3) emerged, but chance could not
/>Genome Medicine
2009, Volume 1, Issue 12, Article 121 Pitteri
et al.
121.9
Genome Medicine
2009,
11::
121
TTaabbllee 44
KKEEGGGG ppaatthhwwaayyss hhaavviinngg ttwwoo oorr mmoorree qquuaannttiittaatteedd pprrootteeiinnss ffoorr wwhhiicchh eevviiddeennccee ooff ddiiffffeerreennttiiaall cchhaannggee bbeettwweeeenn bbaasseelliinnee ttoo 11 yyeeaarr ccoonncceennttrraattiioonn wwiitthh EE++PP
aanndd EE aalloonnee wwaass ssiiggnniiffiiccaanntt,, wwiitthh FFDDRR << 00 0055
Number quantified protein
P
value
a
FDR
E+P Pathway
Porphyrin and chlorophyll metabolism 2 <0.001 <0.001
Dorsoventral axis formation 4 <0.001 <0.001
Motor signaling pathway 2 0.002 0.009
Pancreatic cancer 2 0.002 0.009
Focal adhesion 14 0.003 0.011
Bladder cancer 3 0.005 0.015
Renal cell carcinoma 3 0.009 0.023
Notch signaling pathway 5 0.011 0.024
Ether lipid metabolism 2 0.012 0.024
Long term depression 2 0.022 0.039
Regulation of actin cytoskeleton 8 0.025 0.041
Cytokine-cytokine receptor interaction 21 0.032 0.048
E-alone pathway
Porphyrin and chlorophyll metabolism 2 <0.001 <0.001
GNRH signaling pathway 2 <0.001 <0.001
Ether lipid metabolism 2 0.001 0.011
Bladder cancer 3 0.002 0.016
a
From a regularized Hotelling
T
2
test.
TTaabbllee 55
KKEEGGGG ppaatthhwwaayyss hhaavviinngg ttwwoo oorr mmoorree qquuaannttiittaatteedd pprrootteeiinnss ffoorr wwhhiicchh
eevviiddeennccee ooff ddiiffffeerreennttiiaall cchhaannggee bbeettwweeeenn EE++PP aanndd EE aalloonnee wwaass ssiiggnniiffiiccaanntt,,
wwiitthh FFDDRR << 00 0055
E+P
versus
E-Alone GNRH signaling pathway Bladder cancer
Number of proteins 2 3
Proteins in the pathway
MMP2
,
PLA2G1B MMP2
,
THBS
VEGFC
P
value
a
0.002 0.002
FDR
a
0.041 0.041
a
From a regularized Hotelling
T
2
test.
be ruled out as an explanation for any particular protein. To
check whether these suggested differences could be
attributable to differences in the E+P and E-alone study
cohorts (Table 1) we repeated the Table 3 analyses with the
mean age and mean BMI at baseline in each pool as
adjustment factors. The log intensity ratio differences were
not appreciably affected by this adjustment, although P
values tended to become less significant because of
reduction in ‘degrees of freedom’ for the moderated t tests.
Interestingly, after this adjustment, the FDR for NOTCH2
decreased to 0.02. None of the other FDRs in this sensitivity
analysis were <0.05. Aberrant NOTCH signaling has been
implicated in tumorigenesis and has been reported to play
an oncogenic role in breast cancer [29,30]. A decrease of
NOTCH2 serum levels with E+P, but not E-alone, could be
related to alteration of signaling and increased risk of breast
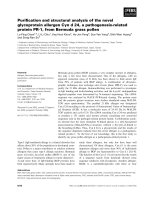
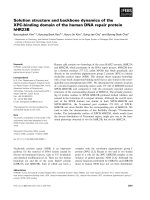
cancer with E+P but not with E-alone. A differential change
between E+P and E-alone in IGFBP1 was supported by
ELISA data in an independent set of 50 subjects for each
regimen (Figure 2) and may provide an important lead to
understanding clinical effects that differ between the two
preparations, including breast cancer. As elaborated later,
Table 3 also contains proteins that are associated with
atherogenesis.
First, consider proteins involved in the insulin growth
factor-signaling pathway. The overall pattern (Table 3) is a
greater increase in insulin growth factor-binding proteins
(IGFBP1, IGFBP4) with E alone compared with E+P,
whereas the decrease in NOV was relatively greater with
E+P. ELISA testing produced trends in these same direc-
tions for all three proteins, but only that for IGFBP1
approached statistical significance in the independent set.
Collectively, these analyses suggest that progestin may
attenuate some of the estrogen-induced increases in IGF-
binding proteins.
It has been previously suggested that medroxyprogesterone
acetate has only a weak degree of opposition to the estrogen-
induced decrease of total IGF-1 (which is primarily of
hepatic origin), in agreement with our study findings for
IGF-1 levels [31]. However, given reduced levels of IGF-
binding proteins, it would be expected that less IGF is
bound, possibly increasing the availability of free IGF. The
/>Genome Medicine
2009, Volume 1, Issue 12, Article 121 Pitteri
et al.
121.10
Genome Medicine
2009,
11::
121
FFiigguurree 11
Mean log
2
-transformed ratios (95% confidence interval): Intact Protein Analysis System and enzyme-linked immunosorbent assay (ELISA).
Gene Name
Mean Ratio(Year1/Baseline, log2)
IGF1 IGFBP1 IGFBP2 CP F10 ICAM1 MCAM NOV TFF3
−2 −1 0 1 2
E+P ELISA
E+P IPAS
E ELISA
E IPAS
IGF-signaling pathway plays a role in cell proliferation,
tissue development, and tumorigenesis. The IGF pathway
has been linked to colorectal malignancy [32,33], and serum
levels of IGF1 have been associated with colon cancer risk
[34]. Changes in the IGF pathway with E+P compared with
E-alone could potentially explain some of the differences in
the clinical outcomes. In particular, IGF-1 is a strong
mitogen, and varying levels of free IGF-1 between E+P and
E-alone treatment could help explain the increased risk of
breast cancer with E+P.
In addition to proteins related to the IGF pathway, several
other proteins of biologic interest in the context of E+P
versus E-alone effects on the serum proteome are presented
in Table 3. Expression of the α
2
-glycoprotein 1 zinc (AZGP1)
gene is regulated predominantly androgens and progestins
[35,36]. Our data suggest an increase in AZGP1 protein
levels with E+P and a decrease with E-alone. AZGP1 has
been identified as a potential prognostic marker for early-
stage breast cancer and a useful immunohistochemical
marker of apocrine cell differentiation in human breast
tissue [37]. Increased levels of circulating AZGP1 in E+P
compared with E-alone may be associated with increased
risk of breast cancer in the former group. Circulating levels
of extracellular matrix proteins (collagen α-1 chain (COL1A1),
lumican (LUM), and extracellular matrix protein 1 (ECM1)
may also be differentially affected by E+P compared with E-
alone, whereas MMP2, a metalloproteinase that breaks
down COL1A1, may be increased with E+P compared with E.
The extracellular matrix plays a variety of physiological
roles, many of which are related to cancer, including tumor
invasion. Changes in the extracellular matrix with E+P
compared with E-alone could also help explain the
differences in cancer risks associated with these treatments.
Several proteins listed in Table 3 have been linked to
atherogenesis, and thus may suggest avenues for exploring
mechanisms underlying a more-substantial early increase in
CHD risk with E+P than with E-alone in the randomized
trials. For example, matrix metalloproteinases (for example,
MMP2) are thought to participate in atherogenic
inflammation [38]. The role of innate immunity in athero-
genesis is less well established; PGLYRP1 participates in
recognition of bacteria by neutrophils, but is independently
/>Genome Medicine
2009, Volume 1, Issue 12, Article 121 Pitteri
et al.
121.11
Genome Medicine
2009,
11::
121
FFiigguurree 22
Differences of mean log
2
-transformed ratios (95% CI): Intact Protein Analysis System and enzyme-linked immunosorbent assay (ELISA).
Gene Name
Difference of Mean Ratio(Year1/Baseline, log2)
VON2PM
M
MACM1
M
ACI4PB
F
GI1
P
BFGI
−2 −1 0 1 2
IPAS
ELISA
associated with coronary artery calcification and abdominal
aortic plaque [39]. The difference in PGLYRP1 concentration
among women taking E+P versus E-alone suggests a
possible mechanistic link.
Other extracellular matrix proteins (Table 3) may also shed
light on the relation between E+P and CHD events. One such
protein, lumican (LUM), contributes to variation in proteo-
glycan composition of arterial intima by location within the
human vasculature. Enhanced deposition of lumican has
been observed in the intima of the atherosclerosis-prone
internal carotid artery compared with the internal thoracic
artery, a relatively atherosclerosis-resistant vessel [40]. The
relation between serum and tissue proteoglycan levels, the
impact of proteoglycan composition on plaque stability, and
the clinical significance of lumican all remain to be
determined.
Our proteomic comparisons (Table 3) may also provide
insight into the greater elevation in venous thromboembolic
event risk when progestin was added to conjugated estro-
gens. For example, coagulation factor V (F5) binds to multi-
merin 1 (MMFN1), with high affinity for storage in human
platelet granules, and may modulate thrombosis [41].
Some important considerations exist in assessing the effects
of estrogens and progestins broadly on the serum proteome.
The preparations considered here are conjugated equine
estrogen and medroxyprogesterone acetate. Further studies
would be needed to determine whether the changes reported
here also arise for the other estrogen (for example, 17β-
estradiol) and progesterone (norethisterone acetate or
levonorgestrel) treatments. Related to this, these substances
are taken orally, and the first-pass hepatic metabolism of
oral estrogens is known to stimulate a wide variety of proteins,
synthesized in the liver. Of the 378 proteins reported here,
73 are included in the liver-specific gene set listed in Hsiao
and colleagues [42] (Table S1 in Additional file 1). For example,
of 66 significantly upregulated proteins (FDR < 0.05), 35 are
in the liver-specific gene path, as were 28 of 71 for E-alone.
Of the proteins emphasized in the preceding discussion,
IGFBP1, AZGP1, and F5, but not others, are part of the liver-
specific list. Given that transdermal estrogen, which is being
increasingly used in clinical practice to treat menopausal
symptoms, bypasses the liver, these proteins may not be
affected when estrogen is administered transdermally.
CCoonncclluussiioonnss
In summary, E+P, like E-alone, has a profound effect on the
serum proteome and affects multiple pathways that are
relevant to observed clinical effects on cancer, cardio-
vascular disease, and fractures, among others. The addition
of 2.5 mg/d medroxyprogesterone acetate to 0.625 mg/d
conjugated equine estrogen may have an impact on the IGF
pathway proteins and may affect circulating levels of
extracellular matrix proteins (for example, MMP2) of poten-
tial relevance to the less-favorable E+P effects, compared
with those for E-alone, on breast cancer, and CHD. Similarly
the addition of medroxyprogesterone acetate may also
augment the effects of conjugated estrogens on coagulation
factors (for example, factor V), of potential relevance to a
relatively greater elevation in venous thromboembolism
with E+P. These and other leads from our proteomic study
will benefit from further testing in women who experienced
major clinical outcomes and in matched controls from the
WHI hormone therapy trials, to evaluate more directly the
potential of these protein-concentration changes to contri-
bute to a biologic explanation for observed trial-outcome
patterns.
AAbbbbrreevviiaattiioonnss
AZGP1 = α
2
-glycoprotein 1 zinc; CHD = coronary heart disease;
CIs = confidence intervals; COL1A1 = collagen α-1 chain; CP =
ceruloplasmin; E = conjugated equine estrogen; E+P = con-
jugated equine estrogen plus medoxyprogesterone acetate;
ECM1 = extracellular matrix protein 1; ELISA = enzyme-
linked immunosorbent assay; F5 = coagulation factor V;
FDR = false discovery rate; GnRH = gonadotropin-releasing
hormone; ICAM1 = intercellular adhesion molecule 1; IGF =
insulin-like growth factor; IGFBP = insulin-like growth
factor-binding protein; IPAS = Intact Protein Analysis
System; IPI = International Protein Index; LC-MS/MS =
liquid chromatography tandem mass spectrometry; LUM =
lumican; MMFN1 = multimerin 1; MMP2 = matrix metallo-
proteinase 2; NOV = protein NOV homologue; PGLYRP1 =
peptidoglycan recognition protein; PLA2G1B = phospholipase
A
2
; THBS1 = thrombospondin 1; THY1 = THY-1 membrane
glycoprotein; VCAM1 = vascular cell adhesion protein 1;
VEGFC = vascular endothelial growth factor C; VT = venous
thromboembolism; WHI = Women’s Health Initiative.
CCoommppeettiinngg iinntteerreessttss
The authors declare that they have no competing interests.
AAuutthhoorrss’’ ccoonnttrriibbuuttiioonnss
SJP, SMH, CK, JR, RDJ, JEM, JH, SL, LM, and RLP
participated in drafting the manuscript. Data acquisition was
performed by HW and HK. Data were analyzed and
interpreted by SJP, SMH, LA, LC, SP, HK, QZ, MM, PW, and
RLP. Immunoassays were performed by TBB and MMJ. SMH
and RLP were responsible for the study design. Statistical
analysis was performed by AA, LC, MM, PW, and RLP.
AAddddiittiioonnaall ffiilleess
The following additional files for this article are available
online: Additional file 1 contains Table S1, which shows year
/>Genome Medicine
2009, Volume 1, Issue 12, Article 121 Pitteri
et al.
121.12
Genome Medicine
2009,
11::
121
1 to baseline log-transformed concentration ratios after
estrogen plus progestin (E+P) or estrogen (E-Alone)
exposure for all 378 quantified proteins.
AAcckknnoowwlleeddggeemmeennttss
Funding/Support: This work was supported by the National Heart, Lung,
and Blood Institute, National Institutes of Health, U. S. Department of
Health and Human Services [contracts HHSN268200764314C,
N01WH22110, 24152, 32100-2, 32105-6, 32108-9, 32111-13, 32115,
32118-19, 32122, 42107-26, 42129-32, and 44221]. Clinical Trials Regis-
tration: ClinicalTrials.gov identifier: NCT00000611. The work of Dr.
Prentice was partially supported by grant CA53996 from the National
Cancer Institute.
Role of the sponsor: Decisions concerning study design, data collection
and analysis, interpretation of the results, the preparation of the manu-
script, or the decision to submit the manuscript for publication resided
with committees comprising WHI investigators that included NHLBI rep-
resentatives.
Program office: (National Heart, Lung, and Blood Institute, Bethesda,
Maryland) Jacques Rossouw, Shari Ludlam, Joan McGowan, Leslie Ford,
and Nancy Geller.
Clinical coordinating center: (Fred Hutchinson Cancer Research Center,
Seattle, WA) Ross Prentice, Garnet Anderson, Andrea LaCroix, Charles
L. Kooperberg; (Medical Research Labs, Highland Heights, KY) Evan Stein;
(University of California at San Francisco, San Francisco, CA) Steven Cum-
mings.
Clinical centers: (Albert Einstein College of Medicine, Bronx, NY) Sylvia
Wassertheil-Smoller; (Baylor College of Medicine, Houston, TX) Haleh
Sangi-Haghpeykar; (Brigham and Women’s Hospital, Harvard Medical
School, Boston, MA) JoAnn E. Manson; (Brown University, Providence, RI)
Charles B. Eaton; (Emory University, Atlanta, GA) Lawrence S. Phillips;
(Fred Hutchinson Cancer Research Center, Seattle, WA) Shirley Beres-
ford; (George Washington University Medical Center, Washington, DC)
Lisa Martin; (Los Angeles Biomedical Research Institute at Harbor-UCLA
Medical Center, Torrance, CA) Rowan Chlebowski; (Kaiser Permanente
Center for Health Research, Portland, OR) Erin LeBlanc; (Kaiser Perma-
nente Division of Research, Oakland, CA) Bette Caan; (Medical College of
Wisconsin, Milwaukee, WI) Jane Morley Kotchen; (MedStar Research
Institute/Howard University, Washington, DC) Barbara V. Howard;
(Northwestern University, Chicago/Evanston, IL) Linda Van Horn; (Rush
Medical Center, Chicago, IL) Henry Black; (Stanford Prevention Research
Center, Stanford, CA) Marcia L. Stefanick; (State University of New York
at Stony Brook, Stony Brook, NY) Dorothy Lane; (The Ohio State Uni-
versity, Columbus, OH) Rebecca Jackson; (University of Alabama at Birm-
ingham, Birmingham, AL) Cora E. Lewis; (University of Arizona,
Tucson/Phoenix, AZ) Cynthia A. Thomson; (University at Buffalo, Buffalo,
NY) Jean Wactawski-Wende; (University of California at Davis, Sacra-
mento, CA) John Robbins; (University of California at Irvine, Irvine, CA) F.
Allan Hubbell; (University of California at Los Angeles, Los Angeles, CA)
Lauren Nathan; (University of California at San Diego, La Jolla/Chula Vista,
CA) Robert D. Langer; (University of Cincinnati, Cincinnati, OH) Margery
Gass; (University of Florida, Gainesville/Jacksonville, FL) Marian Limacher;
(University of Hawaii, Honolulu, HI) J. David Curb; (University of Iowa,
Iowa City/Davenport, IA) Robert Wallace; (University of
Massachusetts/Fallon Clinic, Worcester, MA) Judith Ockene; (University
of Medicine and Dentistry of New Jersey, Newark, NJ) Norman Lasser;
(University of Miami, Miami, FL) Mary Jo O’Sullivan; (University of Min-
nesota, Minneapolis, MN) Karen Margolis; (University of Nevada, Reno,
NV) Robert Brunner; (University of North Carolina, Chapel Hill, NC)
Gerardo Heiss; (University of Pittsburgh, Pittsburgh, PA) Lewis Kuller;
(University of Tennessee Health Science Center, Memphis, TN) Karen C.
Johnson; (University of Texas Health Science Center, San Antonio, TX)
Robert Brzyski; (University of Wisconsin, Madison, WI) Gloria E. Sarto;
(Wake Forest University School of Medicine, Winston-Salem, NC) Mara
Vitolins; (Wayne State University School of Medicine/Hutzel Hospital,
Detroit, MI) Michael S. Simon. Women’s Health Initiative Memory Study:
(Wake Forest University School of Medicine, Winston-Salem, NC) Sally
Shumaker.
RReeffeerreenncceess
1. Women’s Health Initiative Steering Committee:
EEffffeeccttss ooff ccoonnjjuuggaatteedd
eeqquuiinnee eessttrrooggeenn iinn ppoossttmmeennooppaauussaall wwoommeenn wwiitthh hhyysstteerreeccttoommyy:: tthhee
WWoommeenn’’ss HHeeaalltth
h IInniittiiaattiivvee rraannddoommiizzeedd ccoonnttrroolllleedd ttrriiaall
JAMA
2004,
229911::
1701-1712.
2. Writing Group for the Women’s Health Initiative Investigators:
RRiisskkss
aanndd bbeenneeffiittss ooff eessttrrooggeenn pplluuss pprrooggeessttiinn iinn hheeaalltthhyy ppoossttmmeennooppaauussaall
wwoommeenn:: pprriinncciippaall rrees
suullttss ffrroomm tthhee WWoommeenn’’ss HHeeaalltthh IInniittiiaattiivvee rraann
ddoommiizzeedd ccoonnttrroolllleedd ttrriiaall
JAMA
2002,
228888::
321-333.
3. Hendrix SL, Wassertheil-Smoller S, Johnson KC, Howard BV,
Kooperberg C, Rossouw JE, Trevisan M, Aragaki A, Baird AE, Bray
PF, Buring JE, Criqui MH, Herrington D, Lynch JK, Rapp SR, Torner J,
WHI Investigators:
EEffffeeccttss ooff ccoonnjjuuggaatteedd eeqquuiinnee eessttrrooggeenn oonn ssttrrookkee
iinn tthhee WWoommeenn’’ss HHeeaalltthh IInniittiiaattiivvee
Circulation
2006,
111133::
2425-2434.
4. Wassertheil-Smoller S, Hendrix SL, Limacher M, Heiss G, Kooper-
berg C, Baird A, Kotchen T, Curb JD, Black H, Rossouw JE, Aragaki
A, Safford M, Stein E, Laowattana S, Mysiw WJ; WHI Investigators:
EEffffeecctt ooff eessttrrooggeenn pplluuss pprrooggeessttiinn oonn ssttrrookkee iinn ppoossttmmeennooppaauussaall
wwoommeenn:: tthhee WWoommeenn’’ss HHeeaalltthh IInni
ittiiaattiivvee:: aa rraannddoommiizzeedd ttrriiaall
Jama
2003,
228899::
2673-2684.
5. Cauley JA, Robbins J, Chen Z, Cummings SR, Jackson RD, LaCroix
AZ, LeBoff M, Lewis CE, McGowan J, Neuner J, Pettinger M, Stefan-
ick ML, Wactawski-Wende J, Watts NB; Women’s Health Initiative
Investigators:
EEffffeeccttss ooff eessttrrooggeenn pplluuss pprrooggeessttiinn oonn rriisskk ooff ffrraaccttuurree
aanndd bboonnee mmiinneerraall ddeennssiittyy:: tthhee WWoommeenn’
’ss HHeeaalltthh IInniittiiaattiivvee rraannddoommiizzeedd
ttrriiaall
JAMA
2003,
229900::
1729-1738.
6. Jackson RD, Wactawski-Wende J, LaCroix AZ, Pettinger M, Yood
RA, Watts NB, Robbins JA, Lewis CE, Beresford SA, Ko MG,
Naughton MJ, Satterfield S, Bassford T; Women’s Health Initiative
Investigators:
EEffffeeccttss ooff ccoonnjjuuggaatteedd eeqquuiinnee eessttrrooggeenn oonn rriisskk ooff ffrraacc
ttuurreess aanndd BBMMDD iinn ppoossttmmeennooppaauussaall wwoomme
enn wwiitthh hhyysstteerreeccttoommyy::
rreessuullttss ffrroomm tthhee WWoommeenn’’ss HHeeaalltthh IInniittiiaattiivvee rraannddoommiizzeedd ttrriiaall
J Bone
Miner Res
2006,
2211::
817-828.
7. Hsia J, Langer RD, Manson JE, Kuller L, Johnson KC, Hendrix SL, Pet-
tinger M, Heckbert SR, Greep N, Crawford S, Eaton CB, Kostis JB,
Caralis P, Prentice R; Women’s Health Initiative Investigators:
CCoonnjjuu
ggaatteedd eeqquuiinnee eessttrrooggeennss aanndd ccoorroonnaarryy hheeaarrtt ddiisseeaassee:: tthhee WWoommeenn’’ss
HHeeaalltthh IInniittiiaattiivvee
Arch Intern Med
2006,
116666::
357-365.
8. Manson JE, Hsia J, Johnson KC, Rossouw JE, Assaf AR, Lasser NL,
Trevisan M, Black HR, Heckbert SR, Detrano R, Strickland OL,
Wong ND, Crouse JR, Stein E, Cushman M; Women’s Health Initia-
tive Investigators:
EEssttrrooggeenn pplluuss pprrooggeessttiinn aanndd tthhee rriisskk ooff ccoorroonnaarryy
hheeaarrtt ddiisseeaassee
N Engl J Med
2003,
334499::
523-534.
9. Chlebowski RT, Hendrix SL, Langer RD, Stefanick ML, Gass M, Lane
D, Rodabough RJ, Gilligan MA, Cyr MG, Thomson CA, Khandekar J,
Petrovitch H, McTiernan A; WHI Investigators:
IInnfflluueennccee ooff eessttrrooggeenn
pplluuss pprrooggeessttiinn oonn bbrreeaasstt ccaanncceerr aanndd mmaammmmooggrraapphhyy iinn hheeaalltthhyy ppoosstt
mmeenno
oppaauussaall wwoommeenn:: tthhee WWoommeenn’’ss HHeeaalltthh IInniittiiaattiivvee RRaannddoommiizzeedd
TTrriiaall
JAMA
2003,
228899::
3243-3253.
10. Stefanick ML, Anderson GL, Margolis KL, Hendrix SL, Rodabough RJ,
Paskett ED, Lane DS, Hubbell FA, Assaf AR, Sarto GE, Schenken RS,
Yasmeen S, Lessin L, Chlebowski RT; WHI Investigators:
EEffffeeccttss ooff
ccoonnjjuuggaatteedd eeqquuiinnee eessttrrooggeennss oonn bbrreeaasstt ccaanncceerr aanndd mmaammmmooggrraapphhyy
ssccrreeeenniinngg iinn ppoossttmme
ennooppaauussaall wwoommeenn wwiitthh hhyysstteerreeccttoommyy
JAMA
2006,
229955::
1647-1657.
11. Curb JD, Prentice RL, Bray PF, Langer RD, Van Horn L, Barnabei
VM, Bloch MJ, Cyr MG, Gass M, Lepine L, Rodabough RJ, Sidney S,
Uwaifo GI, Rosendaal FR:
VVeennoouuss tthhrroommbboossiiss aanndd ccoonnjjuuggaatteedd eeqquuiinnee
eessttrrooggeenn iinn wwoommeenn wwiitthhoouutt aa uutteerruuss
Arch Intern Med
2006,
116666::
772-780.
12. Cushman M, Kuller LH, Prentice R, Rodabough RJ, Psaty BM, Stafford
RS, Sidney S, Rosendaal FR:
EEssttrrooggeenn pplluuss pprrooggeessttiinn aanndd rriisskk ooff
vveennoouuss tthhrroommbboossiiss
JAMA
2004,
229922::
1573-1580.
13. Anderson GL, Kooperberg C, Geller N, Rossouw JE, Pettinger M,
Prentice RL:
MMoonniittoorriinngg aanndd rreeppoorrttiinngg ooff tthhee WWoommeenn’’ss HHeeaalltthh IInniittiiaa
ttiivvee RRaannddoommiizzeedd HHoorrmmoonnee TThheerraappyy TTrriia
allss
Clin Trials
2007,
44::
207-
217.
14. Rossouw JE, Cushman M, Greenland P, Lloyd-Jones DM, Bray P,
Kooperberg C, Pettinger M, Robinson J, Hendrix S, Hsia J:
IInnffllaammmmaa
ttoorryy,, lliippiidd,, tthhrroommbboottiicc,, aanndd ggeenneettiicc mmaarrkkeerrss ooff ccoorroonnaarryy hheeaarrtt
ddiisseeaassee rriisskk iinn tthhe
e WWoommeenn’’ss HHeeaalltthh IInniittiiaattiivvee TTrriiaallss ooff HHoorrmmoonnee
TThheerraappyy
Arch Intern Med
2008,
116688::
2245-2253.
15. Kooperberg C, Cushman M, Hsia J, Robinson JG, Aragaki AK, Lynch
JK, Baird AE, Johnson KC, Kuller LH, Beresford SA, Rodriguez B:
CCaann bbiioommaarrkkeerrss iiddeennttiiffyy wwoommeenn aatt iinnccrreeaasseedd ssttrrookkee rriisskk?? TThhee
WWoommeenn’’ss HHeeaalltthh IInniittiiaattiivvee HHoorrmmoonnee TTrriiaallss
PLoS Clin Trials
2007,
22::
e28.
/>Genome Medicine
2009, Volume 1, Issue 12, Article 121 Pitteri
et al.
121.13
Genome Medicine
2009,
11::
121
16. Faca V, Coram M, Phanstiel D, Glukhova V, Zhang Q, Fitzgibbon M,
McIntosh M, Hanash S:
QQuuaannttiittaattiivvee aannaallyyssiiss ooff aaccrryyllaammiiddee llaabbeelleedd
sseerruumm pprrootteeiinnss bbyy LLCC MMSS//MMSS
J Proteome Res
2006,
55::
2009-2018.
17. Faca V, Pitteri SJ, Newcomb L, Glukhova V, Phanstiel D, Krasnosel-
sky A, Zhang Q, Struthers J, Wang H, Eng J, Fitzgibbon M, McIntosh
M, Hanash S:
CCoonnttrriibbuuttiioonn ooff pprrootteeiinn ffrraaccttiioonnaattiioonn ttoo ddeepptthh ooff aannaallyy
ssiiss ooff tthhee sseerruumm aanndd ppllaassmmaa pprrootteeoommeess
J Proteome Res
2007,
66::
3558-3565.
18. Faca VM, Song KS, Wang H, Zhang Q, Krasnoselsky AL, Newcomb
LF, Plentz RR, Gurumurthy S, Redston MS, Pitteri SJ, Pereira-Faca SR,
Ireton RC, Katayama H, Glukhova V, Phanstiel D, Brenner DE,
Anderson MA, Misek D, Scholler N, Urban ND, Barnett MJ, Edel-
stein C, Goodman GE, Thornquist MD, McIntosh MW, DePinho RA,
Bardeesy N, Hanash SM:
AA mmoouussee ttoo hhuummaann sseeaarrcchh ffoorr ppllaassmmaa pprroo
tteeoommee cchhaannggeess aassssoocciiaatteedd wwiitthh ppaannccrreeaattiicc ttuummoorr ddeevveellooppmmeenntt
PLoS
Med
2008,
55::
e123.
19. Hanash SM, Pitteri SJ, Faca VM:
MMiinniinngg tthhee ppllaassmmaa pprrootteeoommee ffoorr
ccaanncceerr bbiioommaarrkkeerrss
Nature
2008,
445522::
571-579.
20. Katayama H, Paczesny S, Prentice R, Aragaki A, Faca VM, Pitteri SJ,
Zhang Q, Wang H, Silva M, Kennedy J, Rossouw J, Jackson R, Hsia J,
Chlebowski R, Manson J, Hanash S:
AApppplliiccaattiioonn ooff sseerruumm pprrootteeoommiiccss
ttoo tthhee WWoommeenn’’ss HHeeaalltthh IInniittiiaattiivvee ccoonnjjuuggaatteedd eeqquuiinnee eessttrrooggeennss ttrriiaall
rreevveeaallss aa mmuullttiittuuddee ooff eeffffeeccttss rreelleevvaanntt ttoo cclliinniiccaall ffiinnddiinnggss
Genome
Med
2009,
11::
47.
21. Rauch A, Bellew M, Eng J, Fitzgibbon M, Holzman T, Hussey P, Igra
M, Maclean B, Lin CW, Detter A, :
CCoommppuuttaattiioonnaall PPrrootteeoommiiccss AAnnaallyy
ssiiss SSyysstteemm ((CCPPAASS)):: aann eexxtteennssiibbllee,, ooppeenn ssoouurrccee aannaallyyttiicc ssyysstteemm ffoorr
eevvaalluuaattiinngg aanndd ppuubblliisshhiinngg pprrootteeoommiicc ddaattaa aanndd hhiigghh tthhrroouugghhppuutt bbiioolloogg
iiccaall eexxppeerriimmeennttss
J Proteome Res
2006,
55::
112-121.
22. Keller A, Nesvizhskii AI, Kolker E, Aebersold R:
EEmmppiirriiccaall ssttaattiissttiiccaall
mmooddeell ttoo eessttiimmaattee tthhee aaccccuurraaccyy ooff ppeeppttiiddee iiddeennttiiffiiccaattiioonnss mmaaddee bbyy
MMSS//MMSS aanndd ddaattaabbaassee sseeaarrcchh
Anal Chem
2002,
7744::
5383-5392.
23. Nesvizhskii AI, Keller A, Kolker E, Aebersold R:
AA ssttaattiissttiiccaall mmooddeell
ffoorr iiddeennttiiffyyiinngg pprrootteeiinnss bbyy ttaannddeemm mmaassss ssppeeccttrroommeettrryy
Anal Chem
2003,
7755::
4646-4658.
24. Smyth GK:
LLiinneeaarr mmooddeellss aanndd eemmppiirriiccaall bbaayyeess mmeetthhooddss ffoorr aasssseessssiinngg
ddiiffffeerreennttiiaall eexxpprreessssiioonn iinn mmiiccrrooaarrrraayy eexxppeerriimmeennttss
Stat Appl Genet
Mol Biol
2004,
33::
Article3.
25. Smyth GK:
LLiimmmmaa:: lliinneeaarr mmooddeellss ffoorr mmiiccrrooaarrrraayy ddaattaa
In
Bioinformat-
ics and computational biology solutions using R and bioconductor.
Edited by R Gentleman, V Carey, S Dudoit, R Irizarry, W Huber.
New York: Springer, 2005, pp. 397-420.
26. Benjamini Y, Hochberg Y:
CCoonnttrroolllliinngg tthhee ffaallssee ddiissccoovveerryy rraattee:: aa
pprraaccttiiccaall aanndd ppoowweerrffuull aapppprrooaacchh ttoo mmuullttiippllee tteessttiinngg
J R Stat Soc
Series B (Methodological)
1995,
5577::
289-300.
27. Kanehisa M:
TThhee KKEEGGGG ddaattaabbaassee
Novartis Found Symp
2002,
224477::
91-101; discussion 101-103, 119-128, 144-152.
28. KEGG PATHWAY Database [ />html]
29. Shi W, Harris AL:
NNoottcchh ssiiggnnaalliinngg iinn bbrreeaasstt ccaanncceerr aanndd ttuummoorr aannggiioo
ggeenneessiiss:: ccrroossss ttaallkk aanndd tthheerraappeeuuttiicc ppootteennttiiaallss
J Mammary Gland Biol
Neoplasia
2006,
1111::
41-52.
30. Wu F, Stutzman A, Mo YY:
NNoottcchh ssiiggnnaalliinngg aanndd iittss rroollee iinn bbrreeaasstt
ccaanncceerr
Front Biosci
2007,
1122::
4370-4383.
31. Campagnoli C, Abba C, Ambroggio S, Peris C:
DDiiffffeerreennttiiaall eeffffeeccttss ooff
pprrooggeessttiinnss oonn tthhee cciirrccuullaattiinngg IIGGFF II ssyysstteemm
Maturitas
2003,
4466((ssuuppppll
11))::
S39-S44.
32. Davies M, Gupta S, Goldspink G, Winslet M:
TThhee iinnssuulliinn lliikkee ggrroowwtthh
ffaaccttoorr ssyysstteemm aanndd ccoolloorreeccttaall ccaanncceerr:: cclliinniiccaall aanndd eexxppeerriimmeennttaall eevvii
ddeennccee
Int J Colorectal Dis
2006,
2211::
201-208.
33. Durai R, Yang W, Gupta S, Seifalian AM, Winslet MC:
TThhee rroollee ooff
tthhee iinnssuulliinn lliikkee ggrroowwtthh ffaaccttoorr ssyysstteemm iinn ccoolloorreeccttaall ccaanncceerr:: rreevviieeww ooff
ccuurrrreenntt kknnoowwlleeddggee
Int J Colorectal Dis
2005,
2200::
203-220.
34. Rinaldi S, Cleveland R, Norat T, Biessy C, Rohrmann S, Linseisen J,
Boeing H, Pischon T, Panico S, Agnoli C, Palli D, Tumino R, Vineis P,
Peeters PH, van Gils CH, Bueno-de-Mesquita BH, Vrieling A, Allen
NE, Roddam A, Bingham S, Khaw KT, Manjer J, Borgquist S,
Dumeaux V, Gram IT, Lund E, Trichopoulou A, Makrygiannis G,
Benetou V, Molina E,
et al
:
SSeerruumm lleevveellss ooff IIGGFF II,, IIGGFFBBPP 33 aanndd ccooll
oorreeccttaall ccaanncceerr rriisskk:: rreessuullttss ffrroomm tthhee EEPPIICC ccoohhoorrtt,, pplluuss aa mmeettaa aannaallyy
ssiiss ooff pprroossppeeccttiivvee ssttuuddiieess
Int J Cancer
2009, [Epub ahead of print].
35. Chalbos D, Haagensen D, Parish T, Rochefort H:
IIddeennttiiffiiccaattiioonn aanndd
aannddrrooggeenn rreegguullaattiioonn ooff ttwwoo pprrootteeiinnss rreelleeaasseedd bbyy TT4477DD hhuummaann bbrreeaasstt
ccaanncceerr cceellllss
Cancer Res
1987,
4477::
2787-2792.
36. Lopez-Boado YS, Diez-Itza I, Tolivia J, Lopez-Otin C:
GGlluuccooccoorrttii
ccooiiddss aanndd aannddrrooggeennss uupp rreegguullaattee tthhee ZZnn aallpphhaa 22 ggllyyccoopprrootteeiinn mmeess
sseennggeerr RRNNAA iinn hhuummaann bbrreeaasstt ccaanncceerr cceellllss
Breast Cancer Res Treat
1994,
2299::
247-258.
37. Hassan MI, Waheed A, Yadav S, Singh TP, Ahmad F:
ZZiinncc aallpphhaa 22 ggllyy
ccoopprrootteeiinn:: aa mmuullttiiddiisscciipplliinnaarryy pprrootteeiinn
Mol Cancer Res
2008,
66::
892-
906.
38. Deguchi JO, Aikawa M, Tung CH, Aikawa E, Kim DE, Ntziachristos
V, Weissleder R, Libby P:
IInnffllaammmmaattiioonn iinn aatthheerroosscclleerroossiiss:: vviissuuaalliizziinngg
mmaattrriixx mmeettaalllloopprrootteeiinnaassee aaccttiioonn iinn mmaaccrroopphhaaggeess iinn vviivvoo
Circulation
2006,
111144::
55-62.
39. Rohatgi A, Ayers CR, Khera A, McGuire DK, Das SR, Matulevicius S,
Timaran CH, Rosero EB, de Lemos JA:
TThhee aassssoocciiaattiioonn bbeettwweeeenn
ppeeppttiiddooggllyyccaann rreeccooggnniittiioonn pprrootteeiinn 11 aanndd ccoorroonnaarryy aanndd ppeerriipphheerraall
aatthheerroosscclleerroossiiss:: oobbsseerrvvaattiioonnss ffrroomm tthhee DDaallllaass HHeeaarrtt SSttuuddyy
Athero-
sclerosis
2009,
220033::
569-575.
40. Talusan P, Bedri S, Yang S, Kattapuram T, Silva N, Roughley PJ, Stone
JR:
AAnnaallyyssiiss ooff iinnttiimmaall pprrootteeooggllyyccaannss iinn aatthheerroosscclleerroossiiss pprroonnee aanndd
aatthheerroosscclleerroossiiss rreessiissttaanntt hhuummaann aarrtteerriieess bbyy mmaassss ssppeeccttrroommeettrryy
Mol
Cell Proteomics
2005,
44::
1350-1357.
41. Jeimy SB, Fuller N, Tasneem S, Segers K, Stafford AR, Weitz JI,
Camire RM, Nicolaes GA, Hayward CP:
MMuullttiimmeerriinn 11 bbiinnddss ffaaccttoorr VV
aanndd aaccttiivvaatteedd ffaaccttoorr VV wwiitthh hhiigghh aaffffiinniittyy aanndd iinnhhiibbiittss tthhrroommbbiinn ggeenneerraa
ttiioonn
Thromb Haemost
2008,
110000::
1058-1067.
42. Hsiao LL, Dangond F, Yoshida T, Hong R, Jensen RV, Misra J, Dillon
W, Lee KF, Clark KE, Haverty P, Haverty P, Weng Z, Mutter GL,
Frosch MP, Macdonald ME, Milford EL, Crum CP, Bueno R, Pratt RE,
Mahadevappa M, Warrington JA, Stephanopoulos G, Stephanopoulos
G, Gullans SR:
AA ccoommppeennddiiuumm ooff ggeennee eexxpprreessssiioonn iinn nnoorrmmaall hhuummaann
ttiissssuueess
Physiol Genomics
2001,
77::
97-104.
/>Genome Medicine
2009, Volume 1, Issue 12, Article 121 Pitteri
et al.
121.14
Genome Medicine
2009,
11::
121