báo cáo khoa học: "Predictive genetic testing for the identification of high-risk groups: a simulation study on the impact of predictive ability" pot
Bạn đang xem bản rút gọn của tài liệu. Xem và tải ngay bản đầy đủ của tài liệu tại đây (354.05 KB, 8 trang )
RESEA R C H Open Access
Predictive genetic testing for the identification of
high-risk groups: a simulation study on the
impact of predictive ability
Raluca Mihaescu
1
, Ramal Moonesinghe
2
, Muin J Khoury
3
and A Cecile JW Janssens
1*
Abstract
Background: Genetic risk models could potentially be useful in identifying high-risk groups for the prevention of
complex diseases. We investigated the performance of this risk stratification strategy by examining epidemiological
parameters that impact the predictive ability of risk models.
Methods: We assessed sensitivity, specificity, and positive and negative pre dictive value for all possible risk
thresholds that can define high-risk groups and investigated how these measures depend on the frequency of
disease in the population, the frequency of the high-risk group, and the discriminative accuracy of the risk model,
as assessed by the area under the receiver-operating characteristic curve (AUC). In a simulation study, we modeled
genetic risk scores of 50 genes with equal odds ratios and genotype frequencies, and varied the odds ratios and
the disease frequency across scenarios. We also performed a simulation of age-related macular degeneration risk
prediction based on published odds ratios and frequencies for six genetic risk variants.
Results: We show that when the frequency of the high-risk group was lower than the disease frequency, positive
predictive value increased with the AUC but sensitivity remained low. When the frequency of the high-risk group
was higher than the disease frequency, sensitivity was high but positive predictive value remained low. When both
frequencies were equal, both positive predictive value and sensitivity increased with increasing AUC, but higher
AUC was needed to maximize both measures.
Conclusions: The performance of risk stratification is strongly determined by the frequency of the high-risk group
relative to the frequency of disease in the population. The identification of high-risk groups with appreciable
combinations of sensitivity and positive predictive value requires higher AUC.
Background
There is increasing interest in the potential use of test-
ing multiple genetic variants for the prediction of co m-
mon complex diseases such as type 2 diabetes,
osteoporosis and cardiovascular disease, particularly
because this could help targeting preventive and thera-
peutic interventions to individu als and groups with high
geneticrisk.Whiletodatemostgeneticriskmodels
show only modest predictive performance [1-7],
improved prediction is expected when many new
genetic risk factors are discovered in the coming years,
both common and rare variants with intermediate to
largeeffectsondiseaserisk. Notwithstanding these
anticipated discoveries, the predictive ability of genetic
risk models for complex diseases is likely to remain
modest because non-genetic risk factors have a substan-
tial impact on disease risk as well [8,9].
Despite the modest predic tive ability, some argue
that genetic risk models can still be useful in health
care and disease prevention to identify individuals at
very high risk [10]. Preventive s trategies can be tar-
geted to individuals at very high risk even though this
may only be a small s ubgroup [11,12]. The feasibility
of this strategy will depe nd not solely on the predictive
ability of the risk model, but also on the threshold
level that is chosen. For certain diseases, well defined
clinical cut-off values exist, such as the Framingham
risk score f or cardiovascular disease [13,14], but in
* Correspondence:
1
Department of Epidemiology, Erasmus University Medical Center, PO Box
2040, 3000 CA Rotterdam, The Netherlands
Full list of author information is available at the end of the article
Mihaescu et al. Genome Medicine 2011, 3:51
/>© 2011 Mihaescu et al.; licensee BioMed Central Lt d This is an open access article dis tributed under the terms of the Creative
Commons Attribution License nses/by/2.0, which permits unrestricted use, distribution, and
reproduction in any medium, provided the original work is properly c ited.
most instances the relevant t hresholds have not been
determined. Risk thresholds are chosen on a cost-bene-
fit analysis of false negative and false positive findings
across all thresholds, and generally are a trade-off.
High threshold values are needed to identify indivi-
duals with a high probability to develop future disease,
but this may identi fy only a fraction o f the patients,
whereas lower thresholds will identify most individuals
who will deve lop the disease but also classify many
individuals wrongly at increased risk. Therefore, apart
from the discriminative accuracy of the r isk model, the
threshold chosen has a major impact on the sensitivity,
specificity, positive predictive value (PPV) and negative
predictive value (NPV) when the risk model is used as
a dichoto mous test.
For single genetic tests, the relationship between the
epidemiological assessment of the genetic association
(for example, genotype frequency and odds ratio (OR))
and the predictive accuracy of the test (for example,
sensitivityandPPV)havebeendescribedbysimple
arithmetic formulas [15]. These formulas show that
the frequency of the risk variant relative to the fre-
quency of disease determines whether the test will
have high sensitivity or high PPV, and that both can
be maximized only when genotype and disease fre-
quencies are approximately equal. For instance,
screening for a common disease using rare variants
can detect only a few individuals at very high risk.
Conversely, screening for a rare disease using common
variants detects most individuals that will ultimately
develop the disease at the cost of many false positive
findings. It would be of interest to make use of the
genomic era developments in this analysis by includ-
ing m ultiple risk v ariants.
In this study, w e examined the perf ormance of risk
stratification based on genetic risk models that include
multiple variants simultaneously. We investi gated sensi-
tivity, specificity, PPV and NPV of genetic risk models
along the range of threshold values that can be chosen
to define high-risk groups. This detailed exploration of
the interrelationships between sensitivity, PPV, preva-
lence of r isk group and disease prevalence using genetic
risk scores instead of single risk variants has not been
reported before. We repeated the analyses for thresholds
that define high-risk groups with a frequency lower,
equal or higher than the disease frequency for increasing
values of the area under the receiver operating charac-
teristic curve (AUC). To address these objectives we
used simulated data across a wide variety of ORs and
frequencies for genetic variants. We also carried out an
additional simulation based on published ORs and fre-
quencies for six genetic polymorphisms predicting age-
related macular degeneration (AMD) risk [16].
Materials and methods
Simulated data
For the construction of simulated data sets, we used a
modeling procedure that has been described in detail
elsewhere[8].Inshort,theprocedure creates a dataset
in such a way that the frequencies and ORs of the risk
genotypes and t he disease risk match prespecified
values. For simplicity, we assumed that each individual
polymorphism had only two genotypes, one of which
was associated with an increased risk of disease and the
other with the referent or baseline risk. We assumed
that genetic variants are inherited independently and
that their joint effects follow a multiplicative risk model.
And finally, we did not include gene-gene and gene-
environment interactions in our analyses, which may
further improve the predictive ability of genetic risk
models. While these assumptions do impact the exact
estimate of the AUC - for example, modeling interaction
effects might give higher AUC - they do not affect the
main aim of our paper, namely impact of a given AUC
on the sensitivity, specificity, PPV and NPV for different
thresholds of the genetic risk model. The pop ulation
size was 10,000 individuals and the population disease
risk was varied across scenarios (that is, 10% and 30%,
respectively). We simulated 50 genetic risk factors, each
havingariskgenotypewithafrequencyof30%andan
OR that varied across scenarios (that is, 1.1, 1.5 and 2.0,
respectively).
Simulation study of age-related macular degeneration
We constructed a dataset using the disease risk from
prevalence estimates in adults 40 years of age or over
[17], and genotypic parameters from a published risk
prediction model for AMD [16]. We used the same
modeling procedure as in our main simulation study
and a sample size of 10,000 individuals. The model
included six genetic risk variants in the following genes
or gene regions: CFH (rs1061170, rs1410996),
LOC387715 (rs10490924), C2 (rs9332739), CFB
(rs641153) and C3 (rs2230199). For each locus we con-
sid ered the effect from the univariate logistic regression
analysis with AMD as outc ome variable and the g enetic
variants as predictor variables. For each locus the three
genotypes were entered independently, with the excep-
tion of C2 and CFB for which the genotypes were
grouped i n two categori es, one conferrin g an increased
risk of disease. Additional file 1 shows genotype ORs
and genotypic frequencies in controls. The prevalence of
disease in the AMD simulation was 9% [17].
Statistical analyses
In the main simulation study, we constructed a genetic
risk score that was a simple count of the number of risk
Mihaescu et al. Genome Medicine 2011, 3:51
/>Page 2 of 8
genotypes. Note that this score has perfect correlation
with predicted risk because all variants have t he same
frequency of the risk genotype and the same OR. The
disease risk increases with the number of risk genotypes
in the genetic risk model. In the AMD simulation, we
derived predicted risks using logistic regression analysis
with genetic risk variants entered as categorical vari-
ables. High-risk groups were defined as all individuals
with risk scores above a chosen threshold.
First, to evaluate the impact of genotype frequencies
and ORs on the overall discriminative accuracy of
genetic risk models, we assessed the AUC [18]. Next, to
assess the predictive performance of genetic risk models
for defining the high-risk group, we calculated the sensi-
tivity, specificity, PPV and NPV for each possible thresh-
old. The sensitivity is the p ercentage of individuals
classified at high-risk among affected individuals and
specificity is t he percentage of individuals classified as
not being at high-risk among unaffected individuals.
PPV is the probability that individuals classified at high-
risk will develop the disease, and NPV is th e probability
that individuals classified as not being at high-risk will
remain free of disease. All measures are presented
against cut-off values and the percentage of individuals
at high-risk to examine the impact of the frequency of
the high-risk group on the relationship between the sen-
sitivity, specificity, PPV and NPV. Note that the fre-
quency of the high-risk group defined by a certain
threshold is different from the frequency of the risk gen-
otype of each single genetic marker. Finally, to replicate
the comparison between epidemiological assessment and
predictive accuracy of the test [15], we assessed sensitiv-
ity, specificity, PPV and NPV for increasing AUC, in
high-risk groups with a frequency lower, equal or higher
than the disease risk. For this purpose, the threshold
values were chosen such that the frequency of the high-
risk groups was 5%, 30% or 50% as the disease risk was
30%. To achieve variation in AUC, we modeled 5 to 600
variants with OR of 1.1 and risk genotype frequency of
30%. Results are presented as means from 100
simulations. All analyses were performed using the R
programming language version 2.8.0 [19].
Results
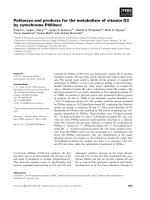
Figure 1 shows the distribution of genetic risk scores in
affected and non-affecte d individuals for different ORs
of the variants included. In our simulation study t hat
included 50 genetic variants, the theoretical range of the
risk score was 0 to 100, but the observed range was 2 to
32withamedianof15riskalleles.TheAUCforthe
risk scor es was 0.62 when the OR of each included var-
iant was 1.1, 0.86 when the OR was 1.5, and 0.94 when
the OR was 2.
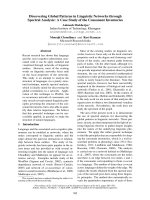
Figure 2 shows the sensitivity and PPV for all possible
thresholds of the genetic risk scores. When a higher
threshold is used, the population at high risk has a
higher risk (higher PPV), but this will identify a smaller
percentage of the affected individuals (lower sensitivity).
Comparison of th e graphs ( Figure 2a-c) shows that for
thresholds within the o bserved range of genetic risk
scores, sensitivity and PPV were higher for higher ORs
of the individual polymorphisms. When, for example, 15
was taken as the threshold risk score, the sensitivity was
67%, 91% and 97% and the PPV w as 36%, 49% and 53%
when the OR of each genetic variant was 1.1, 1.5 and 2,
respectively. Using a higher threshold increased the spe-
cificity but decreased the NPV (Additional file 2).
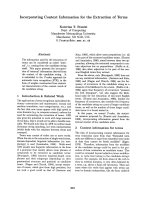
Figure 3 shows the relationship between the frequency
of the high-risk group and the sensitivity, PPV, specifi-
city and NPV. With increasing frequency of the popula-
tion at high risk, sensitivity increased while PPV
decreased; and specificity decreased while NPV
increased. Note that because higher thresholds yield
smal ler high-risk categories, the lines depicting sensitiv -
ity and PPV show opposite trends in Figures 2 and 3.
Figure 3 shows that when, for example, the top 10% of
the risk score distribution was considered the high-risk
group, sensitivity was 14% when the OR of each genetic
variants was 1.1, indicating that most of the affected
individuals were not detected. Sensitivity increased to
0 2 4 6 8 10 12 14 16 18 20 22 24 26 28
Genetic risk score
P
ercentage
0
5
10
15
20
2
5
(a)
OR=1.1
0246810121416182022242628
Affected
Non−affected
Genetic risk score
Percentage
0
5
10
15
20
2
5
(b)
OR=1.5
0246810121416182022242628
Genetic risk score
Percentage
0
5
10
15
20
2
5
(c)
OR=2.0
Figure 1 Distributi on of genetic risk scores in aff ected and non-affected individuals. Genetic risk scores are based on 50 genetic risk
variants. (a-c) Each risk variant has an OR of 1.1 (a), 1.5 (b) and 2 (c). Disease risk is 30%.
Mihaescu et al. Genome Medicine 2011, 3:51
/>Page 3 of 8
25% and 28% when OR was 1.5 and 2, showing that sen-
sitivity did not markedly increase with increasing OR.
The corresponding PPV values were 49%, 89% and 98%,
indicating that PPV increased substantially with incr eas-
ing OR. Figure 3 shows that the lines cross when the
frequency of the high-risk group is equal to 30%, that is,
the frequency of disease in the total population. The
pattern remained the same when we repeated the ana-
lyses for a disease risk of 10% (Additional file 3).
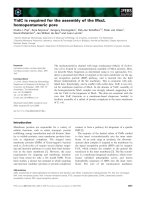
Increasing the OR of all variants included in the
genetic risk score also increases the AUC of the risk
score. Figure 4 shows the impact of increasing AUC on
sensitivity and PPV for high-risk groups that were of
lower, equal or higher frequency than the disease
frequency in the population. The AUC ranged from 0.51
to 0.82. When the frequency of the high-risk group was
lower than disease frequency, PPV markedly increased
with increasing AUC, but sensitivity remained low even
for high AUC because, by definition, the high-risk group
was rarer tha n the disease (Figure 4a). When the fre-
quency of the high-risk group was higher than the dis-
ease risk, sensitivity reached around 80% but PPV
remained below 50% when AUC was 0.82 (Figure 4c).
Only when the siz e of the high-risk group w as equal to
the disease risk in the population were sensitivity and
PPV approximately equal and both increased with the
increase in AUC (Figure 4b). However, when AUC was
0.82 both sensitivity and PPV were only slightly higher
0 5 10 15 20 25 30
0
20
40
60
80
100
Thr
es
h
o
l
d
P
ercentage
OR=1.1
(
a
)
0 5 10 15 20 25 30
0
20
40
60
80
100
Thr
es
h
o
l
d
Percentage
OR=1.5
Sensitivity
PPV
(
b
)
0 5 10 15 20 25 30
0
20
40
60
80
100
Thr
es
h
o
l
d
Percentage
OR=2
(
c
)
Figure 2 Sensitivity and positive predictive value (PPV) for different thresholds. High-risk group is defined as all individuals with a genetic
risk score equal to or higher than the chosen threshold. Genetic risk scores are based on 50 genetic risk variants. (a-c) The OR indicates the
value of the odds ratio for each risk variant: 1.1 (a), 1.5 (b) and 2 (c). Disease risk is 30%.
0 20 40 60 80 100
0
20
40
60
80
100
Cumulative frequency of population at high−risk
Percentage
OR=1.1
0 20406080100
0
20
40
60
80
100
Cumulative frequency of population at high−risk
Percentage
OR=1.5
0 2040608010
0
0
20
40
60
80
100
Cumulative frequency of population at high−risk
Percentage
OR=2
Sensitivity
PPV
0 20 40 60 80 100
0
20
40
60
80
100
Cumulative frequency of population at hi
g
h−risk
Percentage
OR=1.1
0 20406080100
0
20
40
60
80
100
Cumulative frequency of population at hi
g
h−risk
Percentage
OR=1.5
0 2040608010
0
0
20
40
60
80
100
Cumulative frequency of population at hi
g
h−risk
Percentage
OR=2
Specificity
NPV
Figure 3 Sensitivity, specificity, and positive and negative predic tive value (PPV, NPV) for diffe rent frequencies of the population at
high risk. The frequency of the population at high risk is defined as the proportion of individuals with a number of risk alleles equal to or
higher than the chosen threshold. The graphs in the upper row show the sensitivity and PPV for all possible risk thresholds, and the graphs in
the lower row the specificity and NPV. Genetic risk scores are based on 50 genetic risk variants. The OR indicates the value of the odds ratio for
each risk variant. Disease risk is 30%.
Mihaescu et al. Genome Medicine 2011, 3:51
/>Page 4 of 8
than 60%. Similarly, specificity and NPV were equal only
when high-risk grou ps had a frequency equal to disease
risk (data not shown).
Finally, we examined the same asso ciations using
simulated data base d on published ORs and frequencies
for six known AMD genetic risk factors. The range of
predicted risks was 0.2% to 62% (Additional file 4,
which shows the distribution of predicted risks in indivi-
duals with and without AMD) and the AUC was 0.76
(95% confi dence interval 0.74 to 0.78). We observed the
same impact of the relative magnitude of the size of the
high-risk groups and disease risk on the sensitivity, spe-
cificity, PPV and NPV as in our main simulation study
(Figure 5).
Discussion
This study investigated the relationships between sensi-
tivity, PPV, prevalence of risk group and disease
prevalence when genetic risk scores, as opposed to sin-
gle risk variants, are used for risk strat ification. A major
finding from this analysis is that when the frequency of
the high-risk group approximates the disease frequency,
both sensitivity and PPV incre ase with higher AUC. At
all other frequencies of the high-risk group, higher AUC
will increase either sensitivity or PPV. Selecting the opti-
mal cut-off threshold will consequently be a trade-off
between higher sensitivity at the price of lower PPV, or
vice versa.
While the relationship between the number of indivi-
duals carrying a certain genetic risk factor and the risk
of disease in the population was shown to influence the
screening performance for a sin gle marker [15], we have
proven this is also true for a genetic test composed o f
multiple genetic risk factors. Furthermore, we extended
the analyses to the context of the overall model perfor-
mance, and looked at the influence of the discriminatory
0.55 0.60 0.65 0.70 0.75 0.80
0
20
40
60
80
100
A
UC
P
ercentage
(a)
Frequency = 5%
0.55 0.60 0.65 0.70 0.75 0.80
0
20
40
60
80
100
A
UC
Percentage
Sensitivity
PPV
(b)
Frequency = 30%
0.55 0.60 0.65 0.70 0.75 0.80
0
20
40
60
80
100
A
UC
Percentage
(c)
Frequency = 50%
Figure 4 Sensitivity and positive predictive value (PPV) when the frequency of the high-risk group is lower than, equal to or higher
than the disease risk. The frequency of the high-risk group is defined as the proportion of individuals with a number of risk alleles equal to or
higher than the chosen threshold. (a-c) High-risk groups have a frequency of 5% (a), 30% (b) and 50% (c). Five to 600 variants are included in
the genetic risk models to obtain an increase in the AUC. Each risk variant has a frequency of 30% and OR of 1.1. Disease risk is 30%.
0 20406080100
0
20
40
60
80
100
Percentage
Sensitivity
PPV
Cumulative frequency of population at high−risk
0 20406080100
0
20
40
60
80
100
Percentage
Specificity
NPV
Cumulative frequency of population at high−ris
k
Figure 5 Sensitivity, specificity, and positive and negative predictive value (PPV, NPV), for age-related macular degeneration
simulation. Predicted risks of age-related macular degeneration are obtained using logistic regression analysis based on six genetic variants
entered as categorical variables. The frequency of the population at high-risk is defined as the proportion of individuals with predicted risks
equal to or higher than the chosen risk threshold. The genotypic odds ratios and frequencies were obtained from the paper by Seddon et al.
[16]. Disease risk is 9%.
Mihaescu et al. Genome Medicine 2011, 3:51
/>Page 5 of 8
ability of a genetic model on screening parameters for
risk groups with a frequency lower than, equal to or
higher than the disease risk.
Genetic tests are usually assessed in terms of their
ability to distinguish risk groups with large differences
in risk. Nevertheless, it has been shown that large rela-
tive risks are not sufficient to demonstrate the model’s
clinical validity and utility [20-22]. Measures like sensi-
tivity, specificity, PPV and NPV are needed to deter-
mine the clinical utility of the test [22]. While
sensitivity and specificity are not affected by the inci-
dence of disease because they are characteristics of the
test, PPV and NPV strongly depend on disease risk.
However, even for rare diseases, risk groups with a
high PPV may be selected. Kraft et al.[22]usedthe
example of prostate cancer 5-year risk prediction to
illustrate this. They show that 60-year-old men with
nine or more risk alleles and a positive family history
for prostate cancer, which represent 1% of the popula-
tion, have a risk of 30% to develop prostate cancer
over the next 5 years. The incidence of disease in the
population of 60-year-old men is about 2%. Thus, the
size of the group at high risk was smaller than disease
risk. We show that in addition to a smaller size of the
high risk group and high OR for the risk factors, a
high AUC is needed to obtain a high PPV. In a recent
studytheAUCofageneticscoreof33SNPsand
family history of prostate cancer was estimated at 0.64
[23]. A higher AUC is needed to select a risk group
with bigger PPV, especially if the high risk group is
targeted for invasive interventions.
The observation that the sensitivity and PPV are equ al
when the frequency of the high-risk group equals the
frequency of disease in the population holds across dif-
ferent settings. First, this relationship holds irrespective
of whether the disease risk refers to the lifetime risk, a
cumulative incidence over certain time period or the
disease prevalence. Evidently, if we cons ider, for exam-
ple, lifetime risks instead of 10-year risks, the frequency
of the high-risk group for which the sensitivity and PPV
are equal will be larger, because lifetime risks by defini-
tion are higher than 10-year risks. Then for the same
AUC values, these larger high-risk groups will have
higher sensitivity and PPV. However, prediction models
that consider longer time periods generally have lower
AUC, implying that combinations of higher sensitivity
and PPV may not be observed. Put differently, lifetime
risk models with lower AUC may yield the same sensi-
tivity/PPV combination as 10-year risk models with
higher AUC, but the value of using a model with low
AUC may become questionable.
Second, the relationship also holds irrespective of how
the risks are calculated. There are several ways in which
genetic risks can be expressed. One is to use a simple
genetic risk score based on the number of risk alleles
carried. This approach, which we used in our analyses,
assumes that each allele has the same effect on the risk
of disease [24,25]. Another option is to calculate a
weighted risk score, which is a genetic risk score where
the risk alleles are weighted for their effect on disease
risk [14]. Besides constructing risk scores, one can also
directly derive predicted risks from multivariate logistic
regressio n analyses with genetic variants entered as con-
tinuous or categorical variables. Results presented in
this study are applicable to simple count scores and
more complex weighted risk scores, such as predicted
risks, as emphasized by the simulation of AMD risk pre-
diction, since in this study we have evaluated cut-off
values that simply dichotomize the risk. Nevertheless, it
should be pointed out that different approaches will
likely yield different AUC values.
Third, the relationship also holds for risk models in
general, that is, in cluding other non-genetic risk models,
such as the Framingham risk score for prediction of car-
diovascular disease. Basically the relationsh ip is valid for
any continuous variable thatisdichotomizedtocreate
risk groups, such as blood pressure, cholesterol or trigly-
ceride level. This is also true for risk models that
include together novel biomarkers and established risk
factors, a topic that has recently attracted a lot of
research [26,27].
When risk models are used to target interve ntions to
high-risk subgroups, these subgroups are defined by
choosing cut-off values for the predicted risks. The cut-
off correspo nding to a f requency of the high-r isk group
equal to th e disease frequency optimizes both the sensi-
tivity and the PPV, but is not necessarily optimal. Cut-
off values are chosen on the basis of cost-benefit ana-
lyses, balancing the harms and benefits of false positive
and false negative classifications of risk. The cut-off
defining a risk group with a frequency equal to disease
frequency is o ptimal only when the harm and benefit
have equal weights. Selection of optimal cut-off based
on a decision-analytic approach is a complex process
that requires detailed input information of measures like
sensitivity, specificity, PPV, NPV and related costs. For
example, a recent study reported the effect of family his-
tory and 14 SNPs on the cost-effectiveness of chemopre-
vention with finasteride for prostate cancer [28]. The
results show that genetic testing may marginally
improve the cost-effectiveness of chemoprevention in
individuals with more risk alleles, especially in men with
a positive family history. However, no optimal cut-off
number of risk alleles was determined and the cost-
effectiveness varied significantly with small changes of
the model parameters. Our analyses do show, however,
that when AUC is low to moderate, selecting a sub-
group with a substantially increased risk (that is, high
Mihaescu et al. Genome Medicine 2011, 3:51
/>Page 6 of 8
PPV) will include only a small percentage of all people
who will dev elop the disease (that is, low sensitivity).
Obvious ly, the predictive ability is the fundamental pre-
requisite of a test, but what level of predictive ability is
needed varies between applications.
Our observations have implications for health care
applications of genetic testing, but also for the direct-to-
consumer of fer of personal genome tests via the inter-
net. For health care applications that need high PPV,
suc h as targeting invasive interventions to peopl e at the
highest risk, a low AUC means that only a small propor-
tion of this group will be identified. For applications that
need high sensitivity, such as screen ing programs, the
interventions will be given to a very large part of the
population, mostly to people who will not develo p the
disease. And finally, low AUC means for personal gen-
ome testing that most people who will develop the dis-
ease will not be identified as having high risks.
Conclusions
Anticipating the advances in this field, it is essent ial to
develop more rigorous approaches to evaluate the clini-
cal usefulness of risk models [ 29,30]. We have shown
that when a threshold for genetic risk is used for selec-
tion of individuals at high risk to develop disease in the
future, sensitivity, specificity and PPV of the test are
strongly influen ced by the relative magnitude of the size
of the high-risk group and the disease risk in the popu-
lation. In addition, selection of high-risk groups with
clinically useful combinations of sensitivity and PPV is
only possible when the AUC values are higher.
Additional material
Additional file 1: Supplementary tables and supplementary figure
legends. A table listing genotype ORs and genotypic frequencies of the
markers included in the AMD simulation and figure legends for
Additional files 2 to 4.
Additional file 2: Supplementary Figure S1. A figure showing the
change in specificity and NPV for different thresholds.
Additional file 3: Supplementary Figure S2. A figure showing the
sensitivity, specificity, PPV and NPV for different frequencies of the
population at high risk.
Additional file 4: Supplementary Figure S3. A file showing the
distribution of predicted risks in individuals with and without AMD.
Abbreviations
AMD: age-related macular degeneration; AUC: area under the receiver
operating characteristic curve; NPV: negative predictive value; OR: odds ratio;
PPV: positive predictive value; SNP: single-nucleotide polymorphism.
Acknowledgements
This study was supported by the Centre for Medical Systems Biology (CMSB)
in the framework of the Netherlands Genomics Initiative (NGI). Furthermore,
this project was sponsored by the VIDI grant of the Netherlands
Organization for Scientific Research (NWO).
Author details
1
Department of Epidemiology, Erasmus University Medical Center, PO Box
2040, 3000 CA Rotterdam, The Netherlands.
2
Office of Minority Health and
Health Disparities, Centers for Disease Control and Prevention, 1600 Clifton
Road NE, Atlanta, GA 30341, USA.
3
Office of Public Health Genomics, Centers
for Disease Control and Prevention, 1600 Clifton Road NE, Atlanta, GA 30341,
USA.
Authors’ contributions
ACJWJ and RM conceived the study and drafted the manuscript. RM
performed the statistical analysis. RM and MJK participated in the design and
helped to draft the manuscript. All authors read and approved the final
manuscript.
Competing interests
The authors declare that they have no competing interests.
Received: 31 March 2011 Revised: 25 July 2011 Accepted: 28 July 2011
Published: 28 July 2011
References
1. Meigs JB, Shrader P, Sullivan LM, McAteer JB, Fox CS, Dupuis J, Manning AK,
Florez JC, Wilson PW, D’Agostino RB Sr, Cupples LA: Genotype score in
addition to common risk factors for prediction of type 2 diabetes. N Engl
J Med 2008, 359:2208-2219.
2. van Hoek M, Dehghan A, Witteman JC, van Duijn CM, Uitterlinden AG,
Oostra BA, Hofman A, Sijbrands EJ, Janssens AC: Predicting type 2 diabetes
based on polymorphisms from genome-wide association studies: a
population-based study. Diabetes 2008, 57:3122-3128.
3. Nguyen TV, Eisman JA: Pharmacogenomics of osteoporosis: opportunities
and challenges. J Musculoskelet Neuronal Interact 2006, 6:62-72.
4. Kathiresan S, Melander O, Anevski D, Guiducci C, Burtt NP, Roos C,
Hirschhorn JN, Berglund G, Hedblad B, Groop L, Altshuler DM, Newton-
Cheh C, Orho-Melander M: Polymorphisms associated with cholesterol
and risk of cardiovascular events. N Engl J Med 2008, 358:1240-1249.
5. Morrison AC, Bare LA, Chambless LE, Ellis SG, Malloy M, Kane JP, Pankow JS,
Devlin JJ, Willerson JT, Boerwinkle E: Prediction of coronary heart disease
risk using a genetic risk score: the Atherosclerosis Risk in Communities
Study. Am J Epidemiol 2007, 166:28-35.
6. van der Net JB, Janssens AC, Defesche JC, Kastelein JJ, Sijbrands EJ,
Steyerberg EW: Usefulness of genetic polymorphisms and conventional
risk factors to predict coronary heart disease in patients with familial
hypercholesterolemia. Am J Cardiol 2009, 103:375-380.
7. Richards JB, Rivadeneira F, Inouye M, Pastinen TM, Soranzo N, Wilson SG,
Andrew T, Falchi M, Gwilliam R, Ahmadi KR, Valdes AM, Arp P, Whittaker P,
Verlaan DJ, Jhamai M, Kumanduri V, Moorhouse M, van Meurs JB,
Hofman A, Pols HA, Hart D, Zhai G, Kato BS, Mullin BH, Zhang F,
Deloukas P, Uitterlinden AG, Spector TD: Bone mineral density,
osteoporosis, and osteoporotic fractures: a genome-wide association
study. Lancet 2008, 371:1505-1512.
8. Janssens AC, Aulchenko YS, Elefante S, Borsboom GJ, Steyerberg EW, van
Duijn CM: Predictive testing for complex diseases using multiple genes:
fact or fiction? Genet Med 2006, 8:395-400.
9. Wray NR, Yang J, Goddard ME, Visscher PM: The genetic interpretation of
area under the ROC curve in genomic profiling. PLoS Genet 2010, 6:
e1000864.
10. Humphries SE, Yiannakouris N, Talmud PJ: Cardiovascular disease risk
prediction using genetic information (gene scores): is it really
informative? Curr Opin Lipidol 2008, 19:128-132.
11. Jackson R, Lynch J, Harper S: Preventing coronary heart disease. BMJ 2006,
332:617-618.
12. Manuel DG, Lim J, Tanuseputro P, Anderson GM, Alter DA, Laupacis A,
Mustard CA: Revisiting Rose: strategies for reducing coronary heart
disease. BMJ 2006, 332:659-662.
13. Paynter NP, Chasman DI, Pare G, Buring JE, Cook NR, Miletich JP, Ridker PM:
Association between a literature-based genetic risk score and
cardiovascular events in women. JAMA
2010, 303:631-637.
14. Talmud PJ, Hingorani AD, Cooper JA, Marmot MG, Brunner EJ, Kumari M,
Kivimaki M, Humphries SE: Utility of genetic and non-genetic risk factors
in prediction of type 2 diabetes: Whitehall II prospective cohort study.
BMJ 2010, 340:b4838.
Mihaescu et al. Genome Medicine 2011, 3:51
/>Page 7 of 8
15. Khoury MJ, Newill CA, Chase GA: Epidemiologic evaluation of screening
for risk factors: application to genetic screening. Am J Public Health 1985,
75:1204-1208.
16. Seddon JM, Reynolds R, Maller J, Fagerness JA, Daly MJ, Rosner B:
Prediction model for prevalence and incidence of advanced age-related
macular degeneration based on genetic, demographic, and
environmental variables. Invest Ophthalmol Vis Sci 2009, 50:2044-2053.
17. Klein R, Rowland ML, Harris MI: Racial/ethnic differences in age-related
maculopathy. Third National Health and Nutrition Examination Survey.
Ophthalmology 1995, 102:371-381.
18. Hanley JA, McNeil BJ: The meaning and use of the area under a receiver
operating characteristic (ROC) curve. Radiology 1982, 143:29-36.
19. Vienna: R Foundation for Statistical Computing; R Development Core Team:
R: a language and environment for statistical computing.[http://www.R-
project.org], Version 2.8.0.
20. Janssens AC, van Duijn CM: Genome-based prediction of common
diseases: advances and prospects. Hum Mol Genet 2008, 17:R166-173.
21. Pepe MS, Janes H, Longton G, Leisenring W, Newcomb P: Limitations of
the odds ratio in gauging the performance of a diagnostic, prognostic,
or screening marker. Am J Epidemiol 2004, 159:882-890.
22. Kraft P, Wacholder S, Cornelis MC, Hu FB, Hayes RB, Thomas G, Hoover R,
Hunter DJ, Chanock S: Beyond odds ratios–communicating disease risk
based on genetic profiles. Nat Rev Genet 2009, 10:264-269.
23. Aly M, Wiklund F, Xu J, Isaacs WB, Eklund M, D’Amato M, Adolfsson J,
Gronberg H: Polygenic risk score improves prostate cancer risk
prediction: results from the stockholm-1 cohort study. Eur Urol 2011,
60:21-28.
24. Janssens AC, Moonesinghe R, Yang Q, Steyerberg EW, van Duijn CM,
Khoury MJ: The impact of genotype frequencies on the clinical validity
of genomic profiling for predicting common chronic diseases. Genet Med
2007, 9:528-535.
25. Meigs JB: Prediction of type 2 diabetes: the dawn of polygenetic testing
for complex disease. Diabetologia 2009, 52:568-570.
26. Velagaleti RS, Gona P, Larson MG, Wang TJ, Levy D, Benjamin EJ, Selhub J,
Jacques PF, Meigs JB, Tofler GH, Vasan RS: Multimarker approach for the
prediction of heart failure incidence in the community. Circulation 2010,
122:1700-1706.
27. Chao C, Song Y, Cook N, Tseng CH, Manson JE, Eaton C, Margolis KL,
Rodriguez B, Phillips LS, Tinker LF, Liu S: The lack of utility of circulating
biomarkers of inflammation and endothelial dysfunction for type 2
diabetes risk prediction among postmenopausal women: the Women’s
Health Initiative Observational Study. Arch Intern Med 2010,
170:1557-1565.
28. Reed SD, Scales CD Jr, Stewart SB, Sun J, Moul JW, Schulman KA, Xu J:
Effects of family history and genetic polymorphism on the cost-
effectiveness of chemoprevention with finasteride for prostate cancer. J
Urol 2011, 185:841-847.
29. Janssens AC, van Duijn CM: Genome-based prediction of common
diseases: methodological considerations for future research. Genome Med
2009, 1:20.
30. Janssens AC, Gwinn M, Bradley LA, Oostra BA, van Duijn CM, Khoury MJ: A
critical appraisal of the scientific basis of commercial genomic profiles
used to assess health risks and personalize health interventions. Am J
Hum Genet 2008, 82:593-599.
doi:10.1186/gm267
Cite this article as: Mihaescu et al.: Predictive genetic testing for the
identification of high-risk groups: a simulation study on the impact of
predictive ability. Genome Medicine 2011 3:51.
Submit your next manuscript to BioMed Central
and take full advantage of:
• Convenient online submission
• Thorough peer review
• No space constraints or color figure charges
• Immediate publication on acceptance
• Inclusion in PubMed, CAS, Scopus and Google Scholar
• Research which is freely available for redistribution
Submit your manuscript at
www.biomedcentral.com/submit
Mihaescu et al. Genome Medicine 2011, 3:51
/>Page 8 of 8