Geographic Information Management in Local Government - Chapter 4 pps
Bạn đang xem bản rút gọn của tài liệu. Xem và tải ngay bản đầy đủ của tài liệu tại đây (155.25 KB, 18 trang )
CHAPTER
4
Spatial Data
KEY QUESTIONS AND ISSUES
• What are the main characteristics of spatial data?
• What are the main types and sources of spatial data?
• What is a data model and how is spatial data modeled?
• What methods of data capture are available?
• What types of databases are used in GIM and why are they so important?
• Why is data quality important and how do we achieve it?
• What analyses are typically carried out on spatial data?
• How do models of spatial processes help decision making?
• What are the main forms of GIS output?
4.1 WHAT ARE THE MAIN CHARACTERISTICS
OF SPATIAL DATA?
GIS are simplified computer representations of reality. The data they use are
typically observations and measurements made from monitoring and recording the
world around us. However, capturing the appropriate data can be a daunting and
time-consuming task. Although there are many sources, there are basically only two
categories: primary data, collected through first-hand observation, and secondary
data, collected by another individual or organization.
All data typically have three dimensions relating to their location (where they
are), their attributes (what they are), and the date when they were collected. GIM
places the greatest emphasis on using the locational or spatial element for trans-
forming data into information, thereby giving it meaning. As we have seen already,
the traditional way of storing, analyzing, and presenting spatial data is the map.
Cartographic methods are centuries old, and there are many similarities between
their approach and the theoretical framework for GIS. Hence there is a great deal
to learn from the cartographer’s approach, not least that the purpose of the map
©2004 by CRC Press LLC
decides the features to select and defines the amount of generalization, the spatial
referencing system, and the method of representing of the data.
During the mapping process the cartographer must:
• Establish the purpose the map is to serve
• Define the scale at which the map is to be produced
• Select the features (spatial entities) from the real world that must be portrayed on
the map
• Choose a method for the representation of these features
• Generalize these features for representation in two dimensions
• Adopt a map projection for placing these features onto a flat piece of paper
• Apply a spatial referencing system to locate these features relative to one another
• Annotate the map with keys, legends, and text to facilitate use of the map (Hey-
wood et al., 1998, after Robinson et al., 1995).
The scale of the map is determined by the purpose or purposes to be served and
represents the ratio of a distance on the map to the corresponding distance on the
ground. That is, at a scale of 1:2500, a line of 1 cm on the map represents a line of
2500 cm or 25 m on the ground. Local authorities use a wide range of map scales,
but the most common are 1:1250, 12,500, and 1:10,000 for large-scale mapping and
1:50,000 for small-scale mapping.
Fundamentally, maps use three basic symbol types to represent real-world fea-
tures: points, lines, and areas. The same three basic spatial entities are used in any
GIS. Points are used to represent features that are too small to be shown as areas,
e.g., lamp posts, manhole covers, and street furniture on large-scale maps. Lines,
which are simply an ordered set or string of points, are used for linear features such
as roads, pipelines, administrative boundaries, and river networks. Networks are
sometimes treated as a separate data type but are really just an extension of the line
type. Finally, areas are represented by a closed set of lines and are used to define
features such as buildings, fields, and administrative areas. Area entities are frequently
referred to as polygons. As with line features, some of these polygons exist on the
ground, e.g., buildings, and some are imaginary, e.g., census enumeration districts.
Three-dimensional areas are treated as surfaces, which can be used to represent
topography or nontopographic features such as pollution levels and population den-
sities. Sometimes, surfaces as well as networks are considered as separate entity types.
Each spatial entity may have more than one attribute associated with it. Attributes
are the nongraphical characteristics of the entity. For example, they can describe the
type of building defined by a polygon — a house, a school, or an office — or the
class of road represented by two parallel lines. These attributes allow certain GIS
operations to be performed, e.g., “where are all the primary schools within a par-
ticular ward?” or “which is the shortest route from A to B?” However, in order to
answer such questions, the geometric relationships between the spatial entities must
be understood.
In GIM, topology is the term used to describe the geometric characteristics of
spatial entities or objects. In relation to spatial data, topology comprises three
elements: adjacency, containment, and connectivity. Objects can be described as
adjacent when they share a common boundary, whereas containment describes one
©2004 by CRC Press LLC
feature contained within another, e.g., a house within a garden. On the other hand,
connectivity is the geometric property used to describe linkages among line features,
e.g., roads connected to form a bus network (Heywood et al., 1998).
In order to carry out analyses of the basic spatial entities, it is necessary to treat
the spherical Earth as a flat two-dimensional surface (a sheet of paper) by using a
suitable map projection. This transformation is achieved by approximating the true
shape of Earth, thereby introducing errors into the spatial data. These will vary
depending upon the projection method chosen from the wide range available. Some
will distort distances, others direction, while others will preserve shape but distort
areas. Users need to know which map projections are being used, particularly if they
wish to combine data from different sources. Otherwise, features that exist at the
same location on the ground may appear to lie at different geographic positions
when viewed on the map or computer screen. For mapping small areas of the globe,
especially those like the U.K. that have only a small extent of latitude, the Transverse
Mercator projection is often used. It has the advantage of maintaining scale, shape,
area, and bearings over small areas and was chosen as the basis of the OS’s National
Grid system.
Spatial referencing is used to locate a feature on Earth’s surface or on a map.
Several methods of spatial referencing exist, all of which can be grouped into three
categories: geographic coordinate systems (latitude and longitude), rectangular coor-
dinate systems (e.g., the OS’s National Grid system), and noncoordinate systems
(e.g., the U.K. postcode system). Most spatial referencing systems have problems
associated with them. Heywood et al. (1998) list three examples: spatial entities may
be mobile — e.g., animals, cars, and people can be located only at a particular time;
spatial entities may change — e.g., road improvements occur, policy areas are
redefined; and the same object may be referenced in different ways — e.g., a building
may be represented as both a point and a polygon on maps of different scales.
Despite these problems, the ability to link, or “glue” together, disparate datasets
using spatial referencing is vital to the management of geographic information, as
the following section will show.
4.2 WHAT ARE THE MAIN TYPES AND SOURCES OF
SPATIAL DATA?
Data about local authorities’ areas and activities are produced continuously.
Many of their everyday activities produce spatial data automatically, some of which
is stored digitally in databases but much of which still remains in analogue form in
files, ledgers, and photographs. In addition, local authorities use data from various
central government departments as well as aerial photography, satellite imagery, and
field surveys.
Not only are there now an abundance of spatial datasets available both to local
authorities and their citizens, there are a wide variety of sources providing data that
differ widely in content, currency, and role. Writing in the AGI Source Book for
GIS, 1997, Hugh Buchanan usefully categorized this data into three varieties (see
Box 4.1):
©2004 by CRC Press LLC
• Application data that gives information of importance for answering a particular
question
• Parcel data that describes abstract units of area that the world is divided up into
• Topographic data that tells you about the physical surroundings
Buchanan goes on to explain that, for many purposes, some data of each sort is
required:
Users often already have some application data, and wish to relate it to some other
application data, together providing the facts that are of most direct interest. These
facts have to be attached or glued to each other, or alternatively to the real world. This
is done by using some parcel data that relates the spatial content of some application
data to the spatial content of other application data (for example postcodes to census
areas). Additionally, it is usually useful to relate these parcels to the real world in the
form of some topographic data, so that the data can be vizualized or inspected.
Box 4.1 Data Varieties
Application Data (Interest)
The term application data covers many things, such as socio-economic, geological or property
data. A user will often have their own data (such as customer records), and is often also
interested in adding value to their own information by relating it to other sets of data.
One major source of data about population is the (decennial) census carried out by the Office
for National Statistics in England and Wales, the General Register Office in Scotland and the
Census Office for Northern Ireland. In addition to the factual bones of the census, much socio-
economic flesh is added by surveys of population and behavior. For other application areas,
the required data will be different, such as geological, hydrological and land use data.
Parcel Data (Glue)
Socio-economic application data is often spatially described using a street address, a postcode,
an electoral ward or a census enumeration area, but very rarely by a National Grid (map) co-
ordinate. Land-related information is very often described by a National Grid co-ordinate, but
may be described by an administrative area, such as a county. There are a variety of data
products that relate one set of parcels to another and individual parcel sets to the National Grid.
Topographic Data (Real World)
Topographic data corresponds to the traditional published map, but is now available in a variety
of different forms. The first of these is the vector map, where the co-ordinates of each line,
point and piece of text are included.
A common alternative to vector maps are raster maps. The raster consist of a fine grid of cells,
each of which carries a colour value. By displaying the raster, the user can recreate the type
of visual appearance that a paper map would have had.
In recent years, a third form of topographic data has become increasingly common. This consists
of photography and satellite imagery. In computer readable form, these types of data are raster.
They are created from cameras and other sensors carried by aircraft and satellites, and are
very good at retaining the overall visual impression of the surface, since (for example) the
nature of the ground cover can be seen on the image.
The largest supplier of topographic data in the U.K. is the Ordnance Survey, who have a wide
range of data products. Other suppliers of such data are land survey firms who will create
data to order, and other data publishers such as Bartholomews and the AA.
Source: Extracted from Buchanan, H. (1997) Spatial Data: A Guide, in D.R. Green and D. Rix
(Eds.), AGI Source Book for Geographic Information Systems 1997, London: AGI.
©2004 by CRC Press LLC
In local government, the OS’s digital topographic database provides the bedrock
for GIS in the traditional map-using services like planning, highways, and estates.
However, for many users aerial photographs are easier to interpret as they provide
a real picture of the world at a known point in time. Raw photographs are not as
accurate as maps as they contain scale distortions, especially at their edges, and
make buildings appear to fall away from the center. This problem, together with
errors due to changes in ground relief, can be resolved by a process known as
orthorectification.
Increasingly available are off-the-shelf products containing aerial photographs
that have been scanned, orthorectified, and stored as digital databases. The sources
for this data include:
• Geoinformation Group, a U.K. company formed from a management buyout of
Cities Revealed products, providing 25-cm digital databases corrected to OS
mapping focusing on cities or counties in high-demand areas
• Getmapping.com (formerly Millennium Mapping Company) originally formed to
create a millennium archive of the U.K. at 1/10,000 scale
• U.K. Perspective, a joint venture between NRSC and Simmons Aerofilms, pro-
viding another millennium archive with the ability to create digital orthophoto-
graphs on demand
For practical purposes, digital imagery is mainly used in a compressed format
due to large storage requirements. For example, with the normal 25-cm resolution,
a 1-km
2
tile takes approximately 45 MB of disk space. However, commercially
available software such as Mr SID enable images to be reduced to about 2 MB
without significant loss of clarity, making imagery considerably more manageable
(Denniss, 2000).
High-resolution imagery is also available from satellites and new digital airborne
imagers. This is invaluable not only in the construction of an accurate and compre-
hensive GIS database but also in maintaining the database at a reasonable cost. New
sources of satellite information that are more affordable and have much improved
ground resolutions are becoming available. Often the frequencies used to capture
the data are such that they can penetrate cloud cover and the data can be quickly
processed to order.
Land, property, and highways services often describe their data by National Grid
coordinates, but most application data in local government is glued together by an
address or the postcode system. As a result, local authorities have found both the
OS’s ADDRESS-POINT and the Royal Mail Postcode Address File (PAF) invaluable
as a means of linking Great Britain’s 25 million addresses and the unit postcodes
to National Grid references. The Gridlink initiative launched at the GIS 2000 con-
ference by the OS, the Office for National Statistics (ONS), the Royal Mail, and the
General Register Office for Scotland (GROS) has further harmonized and improved
the consistency and compatibility of postcode grid referencing. However, it still does
not provide a single national infrastructure of definitive addresses and related prop-
erty information and mapping. Therefore, in September 2002, four government
©2004 by CRC Press LLC
agencies, the Local Government Information House (LGIH), and the Royal Mail
announced a joint program to achieve this purpose, known as the ACACIA project.
Local government has traditionally used external as well as internal sources for
their application data. Those OS products that local authorities are entitled to under
the terms of the OS/LA Service Level Agreement (SLA) are shown in italics in Box
4.2. This box lists all the products in the OS business portfolio for 2002. Since then,
OS Street View (ideal for detailed, street-level display and analysis), 1:25,000 Scale
Colour Raster (for environmental analysis), and Points of Interest (a database of
location-based information) have been added to the list. In addition to the OS’s
expanding range of products, the main government sources are the ONS or the GROS
for socioeconomic data, the British Geological Survey (BGS) for geological data,
and Her Majesty’s Land Registry or the Registers of Scotland for land-ownership
data. The ONS was formed in April 1966 from the merger of the Central Statistical
Office and the Office of Population Censuses and Surveys to give greater coherence
and compatibility to government statistics. Its responsibilities include:
• The organization of the decennial census of population and housing in England
and Wales
• The registration of vital events such as births, marriages, and deaths to provide
high-quality demographic, social, and medical information and analysis
• The National Online Manpower Information System (NOMIS), which is main-
tained under contract by the University of Durham and provides subscribers with
direct access to official government statistics on population, employment, unem-
ployment, and resources down to the smallest geographical area for which they
are available (Masser, 1998).
The 2001 Censuses, in both England and Wales and in Scotland, are the first to
use the power of computerized mapping, with the OS providing the digital data
underpinning both the operation and the analysis of the results. The data is expected
to be more freely and widely available than in the past with much of the output
distributed over the Web. The 2001 Census results should be incorporated in ONS’s
Neighbourhood Statistics service that was launched in February 2001 to assist not
only the Social Exclusion Unit’s important work on neighborhood renewal but also
those who are seeking local solutions to local issues.
4.3 WHAT IS A DATA MODEL AND HOW IS SPATIAL
DATA MODELED?
The aim of data modeling is to help our understanding of geographical issues.
However, the term data model has different meanings in different contexts. In their
Introduction to Geographical Information Systems, Ian Heywood, Sarah Cornelius,
and Steve Carver helpfully split the consideration of spatial data modeling into two
parts: the model of spatial form and the model of spatial processes. “The model of
spatial form represents the structure and distribution of features in geographical
space,” whereas “in order to model spatial processes, the interaction between these
©2004 by CRC Press LLC
B
OX
4.2 Ordnance Survey Business Portfolio 2002 — Product List
Large-Scale Detailed Mapping
• OS MasterMap
TM
(Topography) is the new definite large-scale digital map of Great Britain.
• Land-Line
®
(1:1,250, 1:2,500, and 1:10,000) is the original highly detailed, large-scale
dataset providing comprehensive coverage of the whole of Great Britain.
• Superplan Data
®
is the most detailed mapping of Great Britain and Ordnance Survey’s most
successful business-to-business mapping.
• Superplan plots
®
are generated from the same source as Superplan Data and have been
designed as valuable on-site tools.
• Siteplan plots
®
/Siteplan Data
TM
have been developed as a cost-effective way of plotting
onto convenient A4 map extracts for presentations, legal documents, or for supply to local
authorities.
• Aerial photgraphy provides high-quality aerial photographs, an integral part of the Ordnance
Survey map revision system.
• Landplan
®
is the map of choice for site location, farm or estate management, and identifying
land use at 1:10,000 scale.
• 1:10,000 Scale Raster provides high-resolution detailed mapping.
Historical Mapping
• Historical mapping provides high-quality copies of maps from Ordnance Survey’s extensive
archive.
• Historical Map Data is an extensive digital archive of Ordnance Survey paper mapping from
the mid-Victorian era onwards.
Small-Scale Mapping
• 1:50,000 Scale Colour Raster is Ordnance Survey’s definite raster product, providing a
complete digital view of the popular Landranger
®
paper map series.
• 1:50,000 Scale Gazetteer contains around 250,000 names taken from the Landranger map
series, providing an excellent reference tool and location finder.
• 1:250,000 Scale Colour Raster product provides entry-level small-scale backdrop mapping
suitable for overlaying with individual business information.
• Strategi
®
provides small-scale digital map data for a variety of backdrop applications.
• Meridian
TM
2 is Ordnance Survey’s mid-scales digital product offering functional and flexible
mapping layers.
Location Mapping
• MiniScale
®
is a small scale product designed for use in desktop graphic applications to
provide uncluttered backdrop mapping covering the whole of Great Britain.
Address Referencing
• ADDRESS-POINT
®
is a detailed dataset that uniquely identifies and locates precisely all the
postal addresses in Great Britain.
• Code-Point
®
/Code-Point with polygons provides Ordnance Survey National Grid
references to a resolution of 1 meter for point locations representing postcode units in Great
Britain, as well as Irish Grid coordinates for postcodes in Northern Ireland. The polygons
provide national boundaries for postcode units in Great Britain.
Boundary Data
• Boundary-Line
TM
is a unique specialist dataset of electoral and administrative boundaries
covering the whole of Great Britain.
• Administrative boundary maps are defining graphic maps outlining all unitary, local
authority, European, and Westminster parliamentary boundaries in Great Britain.
©2004 by CRC Press LLC
features must be considered” (Heywood et al., 1998). In this section we focus on
the modeling of spatial form, while process models will be considered in Section 4.8.
There are two main ways that computers handle and display the basic spatial
entities outlined in Section 4.1. These are the raster and vector approaches. The
raster data model is the simpler of the two and is based on the division of reality
into a regular grid of identically shaped cells called pixels. Each pixel is assigned
a single value that represents the attribute of that cell. The area that each cell
represents varies from a few square centimeters to several square kilometers. This
determines the resolution of the grid. Cells become too big as you zoom in and the
scale gets larger. The other main disadvantages are that the images lack the intelli-
gence needed for vector-based GIS, and compression techniques are required to keep
storage levels to a manageable size.
The vector data model is similar in operation to children’s join-the-dot books.
Each point, line, node, polygon, or area is uniquely identified and the relationships
among them together along with their attributes are stored in the database. This has
the advantage of providing intelligent data, but is costly in both time and manpower.
The main disadvantage of the vector model is that as datasets are combined and
analyzed, a much greater level of processing is required.
The traditional method of representing the geographic space occupied by spatial
data is as a series of data layers. Each layer describes a particular use or a charac-
teristic of the landscape with the geographic space broken down into a series of
units or tiles. An alternative method of representing reality in a computer is to
consider that space as populated by discrete “objects.” For example, a local authority
property department may need to map and manage a vast array of assets — buildings,
school sites, and so on. Each of these can be regarded as discrete objects with empty
space between them. This method, which draws on the methods of object-orientated
• SABE
®
(Seamless Administrative Boundaries of Europe) is the first pan-European boundary
dataset at this level of detail.
• ED-LINE provides census boundary datasets in two levels of detail, digitized from the 1991
Census planning maps.
Roads
• OSCAR Asset-Manager
®
is Ordnance Survey’s definite road dataset of Great Britain for the
management of road networks.
• OSCAR Traffic-Manager
®
is Ordnance Survey’s definite road dataset of Great Britain for
detailed route planning.
Height Data
• Land-Form PROFILE
®
provides a stunning representation of the terrain of Great Britain at
1:10,000.
Note: Products shown in italics are available to local authorities through the Service Level
Agreement.
Source: From Ordnance Survey (2002) Ordnance Survey Business Portfolio 2002. Available
online at (accessed Feb-
ruary 17, 2003).
B
OX
4.2 Ordnance Survey Business Portfolio 2002 — Product List (continued)
©2004 by CRC Press LLC
programming, groups the objects into classes and hierarchies that more accurately
reflect the real world, an approach to modeling that should be easier to understand.
At the root of the reengineering of the National Topographic Database to create
the Digital National Framework (DNF) is this recognition that the real world is made
up of objects rather than the traditional series of points and lines involved in digital
mapping. To reflect this object-orientated view, OS has converted all of its 230,000
detailed mapping tiles to the seamless MasterMap data source containing some 416
million features. These features are labeled with 16-digit topographic identifiers
(TOIDs) that are like digital hooks onto which any associated data can be hung.
They have the potential to link datasets together unambiguously, thereby allowing
public agencies to share information on issues such as crime and social indicators.
Most of the earlier GIS took a two-dimensional perspective of the world at a
particular point in time. Yet, the features we are trying to model have a third
dimension and are often highly dynamic. While the use of computer graphics can
simulate the appearance of the third dimension, this is of little more value than a
good perspective drawing and has become known as the “two-and-a-half” dimen-
sional (2.5-D) approach. Construction of full three-dimensional models of geo-
graphic space is technically much more challenging.
Writing in GIS: A Computing Perspective, Michael Worboys (1995) contested
that the dynamic dimension had always been the poor relation in GIS despite the
fact that both people and objects respond to new circumstances and events by
changing their roles, locations, properties, and behaviors. However, during the sec-
ond half of the 1990s, handling information about time — the temporal dimension
— became a hot topic for research and development, and the rapid growth in both
location-based services and vehicle navigation services has increased the need for
real-time data. Worboys (1995) distinguishes between temporal systems that handle
data relating to events at a given point of time in the past, the present, or the future
and dynamic systems that are required to be responsive to events as they happen in
a rapidly changing and evolving scenario (i.e., real-time systems). For example, a
temporal GIS would be required to handle a set of maps depicting changing land
use patterns in the last 50 years, whereas a dynamic system would be needed to
respond to rapidly changing patterns of traffic in a transportation network.
4.4 WHAT METHODS OF DATA CAPTURE ARE AVAILABLE?
The data-capture requirements are twofold. The first is to provide the physical
devices for capturing data external to the system and inputting to the database. The
second is to provide software for converting data to make them compatible with the
data model of the database and to check the correctness and integrity of data before
entry into the system. As system hardware and software become cheaper and provide
more functionality, the cost of spatial data capture increasingly dominates and can
account for as much as 70% of total GIS costs.
All data collected in analogue form, e.g., paper maps, ledgers, and photographs,
need to be converted to digital form by any one of the following methods:
©2004 by CRC Press LLC
• Keyboard entry, used for attribute data that are available only in paper records
• Manual digitizing, commonly used for capturing features from paper maps
• Scanning, used when raster data are required for producing, for example, back-
ground maps
• Automatic line following, appropriate when transferring distinctive lines from a
map, such as county boundaries, railway lines, and contours
Whatever method is chosen, data capture is a time-consuming process. Therefore,
for collecting up-to-date information on the location of street lights or the boundaries
of playing fields or active mineral workings, the process needs to be automated as
much as possible through the use of total survey stations, global positioning systems
(GPS), and data loggers attached to other scientific monitoring equipment. Of these,
the growing trend is toward using GPS as the most efficient and cost-effective way
to collect new features and maintain existing data. GPS is a positioning technique
using either a constellation of the U.S. Department of Defense satellites or Russia’s
GLONASS limited-life satellites together with a portable receiver to dynamically
determine coordinates. When selective availability — the deliberate degrading of
satellite signal accuracy for security reasons — was discontinued by the U.S. in
2001, GPS users saw an improvement in positional accuracy from the 100 m applying
previously to 10–20 m. An accuracy of better than 1 m can be obtained by Differential
GPS using data from stationary reference receivers in known positions in conjunction
with data from a roving GPS field system.
In February 1999, the European Commission announced that it intended to develop
Galileo, a nonmilitary GPS. By March 2002, the European transport ministers had
agreed on the resources to fund the project’s development phase together with the
European Space Agency. Galileo should be operational by 2008, using 24 satellites.
The increasing use of GPS in conjunction with GIS has brought more people
into contact with the necessary coordinate transformation to relate the GPS coordi-
nates with those of the OS’s National Grid. This transformation, introduced in 1997,
is now known as OSTN02 and has an accuracy of 10 cm.
As well as GPS, satellite imagery and Light Detection and Ranging (LIDAR)
systems are gradually being assimilated into everyday use. LIDAR systems work by
sending a laser pulse from an aircraft to the ground and measuring the time taken for
the signal to be returned. Its precise position is calculated using an integrated GPS,
and it can provide not only surface elevation data accurately, rapidly, and cost effectively
even in poor weather conditions but can also measure the height and density of
vegetation. LIDAR offers distinct advantages over other techniques in applications such
as coastal zone monitoring, flood zone mapping, and the derivation of 3-D city models.
As the World Wide Web expands the range of devices that can tap into databases,
it makes sense to have users find data, crunch numbers, or manage business processes
via powerful Internet tools such as ESRI ArcIMS. Geographic information is stored
at the server side, transferred to users, and displayed at the client side. Fueled by
the e-government initiatives, both service providers and users are increasingly requir-
ing spatial data around-the-clock and in a form that readily integrates with other
information. The growth of Web-based products has produced an increase in Net-
based GIS solutions for the Internet and the corporate intranet. Web mapping, for
©2004 by CRC Press LLC
example, is the concept of displaying, in a Web browser, maps that are generated
dynamically by a map server. OS has recognized the importance of this surprisingly
simple concept (geographic information is stored at the server side and displayed at
the client side) and their vision is to provide an online geo-spatial data warehouse
containing the complete range of its products.
4.5 WHAT TYPES OF DATABASES ARE USED IN GIM AND WHY ARE
THEY SO IMPORTANT?
According to Worboys (1995), “The database is the foundation of a GIS.” It
helps to ease the conversion from raw data to information by ordering, reordering,
summarizing, and combining datasets to provide the desired output. A database holds
not only the basic data but also the connections between that data. In short, a database
is a store of interrelated data that can be shared by several users. These data are
managed and accessed through a database management system (DBMS), but for a
database to be really useful, it must be secure, reliable, correct, and consistent as
well as technology proof (see Box 4.3).
There has been a gradual evolution of database models through time from the
early tabular databases (e.g., a simple spreadsheet), through the hierarchical and
network databases developed in the 1960s, to the relational and object-orientated
database models used at the present time. Most work on databases for GIS has been
based around the use of the relational model and this is still the most common. Here
the data are organized in a series of two-dimensional tables, each of which contains
records for one entity. These tables are linked by common data known as keys.
Querying these databases can be facilitated by menu systems and icons and by the
B
OX
4.3 Databases in a Nutshell — A Review of Database Requirements
In order to act effectively as a data store, a computer system must have the confidence of its
users. Data owners and depositers must have the confidence that the data will not be used
in unauthorised ways (security) and that the system has a fail-safe mechanism in case of
unforeseen events such as power failure (reliability). Both depositers and data users must be
assured that as far as possible the data are correct (integrity).
There should be sufficient flexibility to give different classes of users different types of access
to the store (user views). Not all users will be concerned how the database works and should
not be exposed to low-level database mechanisms (independence). Data retrievers will need
a flexible method for finding out what is in store (metadata support) and for retrieving it
according to their requirements and skills (human–database interaction). The database
interface should be sufficiently flexible to respond differently to both single-time users with
unpredictable and varied requirements and regular users with little variation in their
requirements.
Data should be retrieved as quickly as possible (performance). It should be possible for users
to link pieces of information together in the database to get added value (relational database).
Many users may wish to use the store, maybe at the same data, at the same time (concurrency)
and this needs to be controlled. Data stores may need to communicate with other stores for
access to pieces of information not in their local holding (distributed systems). All this needs
to be managed by a complex piece of software (database management system).
Source: From Worboys, M.F. (1995) GIS: A Computing Perspective, London: Taylor & Francis.
©2004 by CRC Press LLC
use of a standard query language (SQL). However, SQL was not really developed
to handle geographical concepts such as “near to,” “far from,” or “connected to”
(Heywood et al., 1998).
As early as 1995, Worboys indicated that there are problems with the relational
approach to the handling of spatial data. This is because spatial data do not naturally
fit into tabular structures, in addition to the limitations of SQL mentioned above.
The main alternative is the object-oriented approach. This “arises out of a desire to
treat not just the static data-oriented aspect of information, as with the relational
model, but also the dynamic behaviour of the systems” (Worboys, 1995). The static
aspect of an object is expressed by a collection of its attributes (e.g., its name and
size) whereas its dynamic “behavior” is represented by a set of operations (e.g.,
roads used by children to get from home to school).
Whatever the approach adopted, a key element of database philosophy is data
sharing. As the volume of databases held by local authorities expands, the number
of users grows, and the need for joined-up thinking increases, the importance of
database management becomes even more critical.
4.6 WHY IS DATA QUALITY IMPORTANT AND HOW DO
WE ACHIEVE IT?
The AGI (1996) published valuable guidelines on geographic information content
and quality. These stressed the importance of ensuring that any data acquired was
fit for its intended purpose. The guidelines also highlighted five different aspects of
data quality:
• Completeness — the measure of the inclusion or exclusion of items from the
database
• Thematic accuracy — the accuracy of the values of attributes
• Temporal accuracy — the accuracy of values of time-related attributes
• Positional accuracy — the accuracy of the values of geographic position
• Logical consistency — the degree of conformance to any rules that apply to an
object or between objects
“Fitness for purpose” is a well-worn phrase but nevertheless important. All GIS
users should strive for quality products from their systems and aim to produce high-
quality output. The old computer saying of “garbage in, garbage out” recognizes
that if you put poor quality data in, then poor quality output results. Indeed, any
errors in input data are likely to be compounded during GIS analyses, thereby further
misleading end-users. Success in using GIS to aid decision making is inextricably
linked to the quality of the data used.
Heywood et al. (1998) recognize that there are two issues of particular impor-
tance in addressing quality and error issues: (1) the terminology used for describing
problems, and (2) the sources, propagation, and management of errors. As it is
essential to describe the data quality problems before resolving them, the various
terms used are clarified in Box 4.4.
©2004 by CRC Press LLC
While clarifying the terminology is the first step to providing quality GIS, the
next is to examine the possible sources of error. Both spatial and attribute errors can
occur at any stage in a GIS project. These include errors in the source data and errors
in the data modeling, conversion, analysis, and output stages. Despite considerable
research effort, little has been done to incorporate error identification within propri-
etary GIS packages (Heywood et al., 1998). Errors are, however, a GIS fact of life,
but adopting good practice in data capture and analysis by following advice such as
that provided by the AGI (1996) should be sufficient to keep errors to a minimum.
4.7 WHAT ANALYSES ARE TYPICALLY CARRIED OUT ON
SPATIAL DATA?
Data analysis is a key process in transforming data into information, and there
is a wide range of functions available in all GIS packages. Heywood et al. (1998)
provide an excellent introduction to this subject and demonstrate that the methods
used and the results obtained vary in accordance with whether raster or vector data
are used. In this section, we summarize the seven basic functions identified by them
and indicate how they might be practically applied in local government:
• Measuring lengths, perimeters, and areas
• Performing queries on a database
• Buffering and neighborhood functions
• Integrating data using overlays
• Interpolating
• Analyzing surfaces
• Analyzing networks
Box 4.4 Describing Data Quality and Error
Problems that affect the quality of individual datasets:
• Error: physical difference between the real world and the GIS facsimile
• Accuracy: the extent to which an estimated data value approaches its true value
• Precision: the recorded level of detail of the data
• Bias: the systematic variation of data from reality
Data quality is also affected by some of the inherent characteristics of the source data and the
data models used to represent data in GIS. These include:
• Resolution: describes the smallest feature in a dataset that can be displayed or mapped
• Generalization: the process of simplifying the complexities of the real world to produce scale
models and maps
Datasets used for analysis need to be:
• Complete: both spatially (cover the entire study area) and temporally (the time period of
interest)
• Compatibility: datasets that can be used together sensibly
• Consistency: datasets developed using similar methods of data capture, storage,
manipulation, and editing
• Applicability: describes the appropriateness or suitability of the data for a set of commands,
operations, or analyses
Source: Adapted from Heywood, I., Cornelius, S., and Carver, S. (1998) An Introduction to
Geographical Information Systems, Harlow, U.K.: Longman.
©2004 by CRC Press LLC
Measuring lengths, perimeters, and areas is probably the most common appli-
cation of GIS in local government. Virtually every service in local government needs
to measure lengths (of roads, footpaths, safe routes to schools, etc.), perimeters (of
boundaries), and areas (of buildings, playing fields, planning application sites, etc.),
which, if done manually, can be a tedious and time-consuming task. By using vector
GIS, not only are these calculations much quicker and usually more accurate but
also the lengths and areas data can be stored as attributes in a database and so need
to be measured only once.
Performing queries on a database is an essential part of GIS analysis — whether
to check the quality of the data input (do all data points representing street lights
appear alongside highway?) or to answer questions after analysis has been under-
taken (how many primary schools have more than a hundred pupils?). This second
example illustrates that queries can be aspatial as well as spatial. Aspatial queries
are questions about the attributes of features, in this case the type and size of school,
rather than their location. Individual queries are often combined to identify entities
in a database that satisfy two or more criteria, for example, “How many residential
units have been allowed in the green belt in the last 10 years?” Reclassification of
cell values can be used in place of the query function in raster GIS to identify areas
of particular importance to the user, e.g., areas liable to flooding.
Buffering is used to identify a zone of interest around an entity. Creating a
circular buffer zone around a point to answer the question “How many houses are
within 400 m of a proposed incinerator outlet and what are their addresses?” is the
easiest of the buffering operations in vector GIS. Creating buffer zones around line
and area features is computationally more complex, but essential when analyzing
road networks or the impact of large waste disposal sites on the surrounding area.
“The ability to integrate data from two sources using map overlay is perhaps the
key GIS analysis function. Using GIS it is possible to take two different thematic
map layers of the same area and overlay them one on top of the other to form a new
layer. The techniques of GIS map overlay may be likened to sieve mapping, the
overlaying of tracing paper maps on a light table” (Heywood et al., 1998). At its
most basic, a map overlay can be used for the visual comparison of data layers, e.g.,
overlaying vector traffic information on a raster map background. On the other hand,
overlays can produce new spatial datasets from the merging of two or more layers.
For example, selecting the site of a new library will involve investigating a whole
range of criteria relating to land use, accessibility, deliveries, and others.
The role of interpolation in GIS is to fill in the gaps between observed data
points. A common example is the construction of height contours on topographic
maps. GIS packages contain a number of techniques, of which Thiessen polygons,
triangulated irregular networks (TINs), and spatial moving averages are the most
common. Thiessen polygons assume that the values of unsampled locations are equal
to the value of the nearest sampled point. Their most common use is to establish
area territories for a set of points, e.g., the construction of areas of interest around
population centers. A TIN is a method of constructing a surface from a set of
irregularly spaced data points. It is often used to generate digital terrain models
(DTMs). The spatial moving average “involves calculating a value for a location
based on the range of values attached to neighbouring points that fall within a user-
©2004 by CRC Press LLC
defined range” (Heywood et al., 1998). Examples of suitable applications include
the interpolation of census data, questionnaires, and field survey measurements.
DTMs create surfaces for analysis, including the calculation of slopes and
aspects. Some GIS packages allow you to “walk” or “fly” through a terrain model
to visualize what the view would be like at various points on or above the DTM.
This can be enhanced by draping other data onto the surface of a DTM (such as an
aerial photograph) to add realism to the view. Digital elevation models (DEMs) are
similar to DTMs but include surface features such as buildings and vegetation. This
detail is provided by laser scanning and is invaluable when used in applications such
as line-of-sight modeling, flood risk analysis, and woodland management.
Finally, network analysis can be used to address classic problems such as iden-
tifying the shortest routes for waste collection vehicles and the safest route to the
nearest primary school.
Data analysis is an area of continuing development as vendors and academics
provide solutions to the growing demands of users. Some software products focus
on just one of the functions described above, e.g., network analysis, while others
combine several of the methods to improve GIS functionality.
4.8 HOW DO MODELS OF SPATIAL PROCESSES HELP
DECISION MAKING?
By simulating the real world, a process model helps us to understand the often
complex behavior of physical and human spatial systems. Although these models
do not provide answers, they do help us to improve our understanding of a problem
and to communicate our ideas to others.
In GIS, three different approaches are used — scale analogue models, conceptual
models, and mathematical models. Scale analogue models are scaled down and
generalized replicas of reality (Heywood et al., 1998) such as topographical maps
and aerial photographs. Conceptual process models express verbally and graphically
the interactions between real-world features. The most common conceptual model
in GIS is the systems diagram that uses symbols to describe its main components
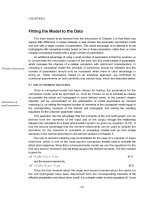
and their linkages, and frequently indicates both inputs and outputs. Figure 4.1 is
an example of a conceptual model designed to specify the portfolio of a council’s
property and those relationships that are important to them in dealing with that
property. Mathematical models use a range of techniques to help us understand
trends and make predictions or forecasts about the future.
In GIS, the three approaches can be used in isolation or combined into a complex
model. Whatever the approach, their aim is to help the user make decisions by
providing clear and easily understandable information. For example, they can be
used to predict the changes to traffic flows if a new business park were to be given
planning permission or if a new section of road were to be built. They can also
indicate how the siting of a new supermarket could influence the shopping patterns
of both local residents and visitors to the area. In cases like this where both distance
and attractiveness are examined, gravity models are often used to compute the
relative attractiveness of the related shopping centers.
©2004 by CRC Press LLC
4.9 WHAT ARE THE MAIN FORMS OF GIS OUTPUT?
After capturing data of the right quality, storing it in a database, and analyzing
it, the final step in the process of converting raw data into information is to present
it to those who are going to use it for decision making and problem solving.
Figure 4.1 Proposed detailed data model for council property. (From Peter Thorpe Consulting,
“Council Owned Property Information Project,” Report Study to London Borough of
Enfield, April 1998. Reproduced with permission from London Borough of Enfield.)
Verge
Footway
is a
Tenanted Unit
Council
Property
Portfolio
Terrier
Property
Transaction
contains
Current
Property
Interest
Historical
Property
Interest
Site
(Level 1)
highest level
Sub-Site
(Level 2)
Unit
(Level 3)
Sub-Unit
(Level 4)
lowest level
is likely to be a
Building
or Building
Complex
Terrier
Reference
Flat
Room
Leaseholder
Estate
(Housing)
alias
alias
alias
alias
Commercial Estate
Commercial
Building
Property
Asset
Valuation
uses
has a
Highway
(in which
Council has
an interest)
Borough
Road
(Public
Highway)
Private
Street
(Council -
Owned)
Private Road
(Council -
Owned)
Leaseholder Block
House
Field
Ground
Park
Farm
Hostel Block
School
School Block
School Floor
Stall
Classroom
Communal Area
Lift Shaft
Social Services Institution
Social Services Building
Council
Basic Land
and Property
Unit
(BLPU)
KEY:
one to one
one to many
optional
many to many
either or
is a
may
be a
may
be a
Usage
(Land-Use)
has a
may have
Carriageway
Postal
Address
(Right-of-Way)
is a
Higher level
'Parent'
Property
is also a
Establish-
ment
incurs costs
Cost-Centre
Service
Package
delivers
pays asset charge
Element
(e.g. wall)
is a is likely to have a
containscontainscontains
contains
©2004 by CRC Press LLC
Maps are still the most common form of GIS output and have long been used
to support decision making. Most people are fascinated by maps and, as an estab-
lished part of our culture, they are difficult to beat as a means of visualizing
information generated by GIS. What better way is there of identifying the hotspots
of crime in a district than a background map overlaid with precisely located points
of recorded incidents?
Microsoft’s MapPoint and AutoRoute Express products demonstrate the popu-
larity of map-based systems for both analyzing and communicating information.
AutoRoute Express is an example of a consumer product that has evolved into a
powerful, easy-to-use mapping application bundled with an extraordinary amount
of data for very little money. MapPoint combines a rich base map with core spatial
functionality such as map rendering, i.e., detailed and easy-to-read maps, enhanced
demographic data, proximity searches, tracking, and routing.
As the name implies, the OS’s popular Interactive Atlas of Great Britain also
enables the user to interact with the information stored on the disk and choose
between a range of scales and a selection of layers. It also illustrates that GIS
packages can provide facilities for the display and playback of multimedia — in
this case, some examples of video clips and photographs — to supplement the
traditional map.
Aerial photographic images provide much more than a pretty picture. When
orthorectified and combined with OS map data, they provide a powerful geograph-
ically accurate base from which one can derive new information or update existing
databases. These digital orthophoto maps are becoming more popular for a variety
of applications from land management to civil engineering design and environmen-
tal assessment.
Despite the popularity of maps and photographs, some attribute information is
still best presented in tables and charts. Area or ward profiles are a good example
of this. Nevertheless, much of the output of the 2001 Census will be provided as
high-quality thematic maps to aid the presentation of the data.
Although many users still feel most comfortable with output in the form of paper
maps, tables, diagrams, or photographs, an increasing proportion of geographic
information is transmitted electronically through e-mail, intranets, and the Internet.
Many local authorities are meeting the challenge of the growing demand for
online information. Wandsworth, for example, has been using the Internet for output
ever since the council launched its online planning register in 1996. Later, the council
commissioned the development of an online planning and building control Web
enquiry system. Here the general public can query applications on the database,
monitor progress, see the planning constraints affecting the application, examine the
listings of all the statutory consultees and neighbors consulted, and link into the
drawings on the register. The Website was an immediate success with over 18,000
hits per month recorded in 2001 (Rix, Markham, and Howell, 2001).
Using digital mapping in tandem with automatic vehicle location systems and
route tracking data, it is possible not only to monitor traffic flows but also to convey
up-to-the minute information about local traffic and available parking spaces to
travelers. This is achieved via road traffic broadcasts, roadside messages signs, and
bus information displays as well as the World Wide Web. ROMANSE (Road
©2004 by CRC Press LLC
MANagement System for Europe), first developed in Southampton in 1992, is the
best-known example of this, and it is now being extended to Winchester and other
parts of Hampshire.
While this section has illustrated some of the main forms of GIS output, there
are many others too numerous to mention here. Some other examples are given
within the case studies described in Part 3 of this book, and new forms of output
are constantly arising from advances in technology. Recent developments in wireless
technology, virtual reality, and 3-D visualization have widened the scope for dis-
seminating GIS output. Keeping up-to-date with these latest technology trends is
just one of the topics discussed in the next chapter, which focuses on the third and
final element or leg of GIS, the technology.
©2004 by CRC Press LLC