GIS for Coastal Zone Management - Chapter 4 ppt
Bạn đang xem bản rút gọn của tài liệu. Xem và tải ngay bản đầy đủ của tài liệu tại đây (521.46 KB, 15 trang )
CHAPTER FOUR
Monitoring Coastal Environments Using
Remote Sensing and GIS
Paul S.Y. Pan
4.1 INTRODUCTION
This paper concerns the monitoring of the marine and coastal environment in
South Wales using state-of-the-art survey techniques and a geographic information
system (GIS). One of the most important natural resources in South Wales is its
marine aggregate. This resource is vital to the regional economy in that it provides
the building industry with that most essential of raw materials, sand and gravel.
However there are growing concerns as to the possible effects of the commercial
extraction of aggregate on the coastal and marine environment, and a number of
environmental monitoring procedures are in place to detect changes. These range
from traditional beach profile surveys to state-of-the-art airborne remote sensing
techniques. The National Assembly for Wales has pioneered the use of airborne
LiDAR (Light Detection and Ranging) for the acquisition of highly detailed
topographical data on beaches, and CASI (Compact Airborne Spectrographic
Imager), for the determination of the state of the vegetation along part of the
coastline. LiDAR is capable of accurately detecting changes in beach levels. The
procedure began in 1998 and will continue until at least 2003, giving an
unprecedented insight into coastal changes over time.
Another remote sensing technique has also been deployed. Close-range
photogrammetry has been used to determine the degree of retreat of unstable sea-
cliffs. All the data collected is used to populate a GIS. Data acquired in this way is
compared with that from various monitoring procedures carried out previously
(aerial photography and beach profiles). A number of advanced techniques have
been developed in parallel to the GIS for the interpretation, analysis and
visualization of the data. A number of invaluable lessons have been learned.
Apart from the site-specific monitoring procedures, other strategic data sets
such as the macro-fauna community distribution, modelled parameters, etc., have
also been acquired from a number of sources. Amongst these parameters, the most
important of all is the sediment environment. It defines the fuzzy geographical
boundaries in which distinctive hydrodynamic regimes operate. A summary on the
resources and constraints is generated for each of the sediment environments.
These resources and constraints summaries together with the GIS form the basis of
a decision-support system for assisting the formation of policy for the management
© 2005 by CRC Press LLC
of the marine resource. The findings will shape future decisions about the
sustainable use of the marine resource in South Wales.
4.2 BACKGROUND
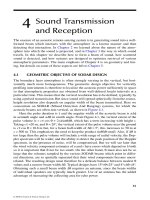
The marine and coastal environment is important to Wales. About 75% of the
length of the country is coastal, allowing the waters of the Irish Sea and the Bristol
Channel to lap its shores (Figure 4.1 and the colour insert following page 164).
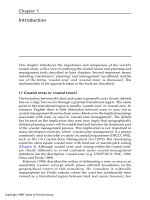
South Wales lies adjacent to the Bristol Channel, a body of water largely unaltered
in its current dimensions since its beginnings as a marine transgression in the early
Holocene. (The Holocene, or post-glacial epoch, covers the period for the end of
the Pleistocene about 10,000 years ago to the present day). Here the coastal areas
are not only characterized by a number of urban and industrial centres, such as
Newport, the capital city Cardiff, Bridgend, Port Talbot and Swansea, but also by
many cherished areas of special landscape and nature conservation interest, such
as: the Gwent Levels; the Kenfig National Nature Reserve and candidate Special
Area of Conservation (cSAC) designated under the European Habitats Directive;
the Gower Area of Outstanding Natural Beauty (AONB) – the first to be
designated in the United Kingdom; and the Glamorgan Heritage Coast (Figure 4.2
and colour insert). Together, and for different reasons, these coastal areas attract
thousands of visitors every year, providing employment opportunities for some of
the local population. One of the unseen resources of the Bristol Channel, however,
contributes to the local economy in a different way – by yielding high quality
building sand for local industry, an essential prerequisite for many forms of
economic activity.
Whilst this economic activity brings undoubted prosperity to South Wales
and neighbouring regions in mid Wales and South-West England, many people
perceive changes to their familiar coastlines, and in particular, to the sandy
beaches. There are growing concerns as to the possible effects of the extraction of
marine sand from the Bristol Channel, and not everyone thinks the removal of this
resource is acceptable or sustainable.
Generally, in Welsh waters, the extraction of sand from the marine
environment by dredging is licensed by the Crown Estate. (The Crown Estate
Commission is the representative of the Crown, which, in the UK, constitutes the
owner of the seabed out to a 12-mile territorial limit). However, the decision on
whether a production license should be granted essentially rests with the
Environment Minister at the National Assembly for Wales – a devolved and
autonomous arm of central Government that came into being in 1999. With its
inception has come a desire to increase outside involvement in policy-making and
administration, and to increase transparency and accountability in deciding major
issues. The challenge for the Assembly’s civil servants is to continue to provide
objective advice to Ministers in an ever-evolving social, economic, environmental,
cultural and political context. This advice must be based on facts and scientific
evidence, together with the specialist and professional judgement of the officers
involved. All of the dredging licenses granted in recent years have stringent
environmental monitoring conditions attached. It is the scientific data from these
monitoring procedures that form the basis of sound advice.
© 2005 by CRC Press LLC
This paper discusses the introduction of a Geographic Information System
(GIS) into part of the National Assembly for Wales for the analyses of the
monitoring data. It highlights the technique’s influence on the monitoring
procedures and the way it has helped reshape the environmental monitoring
requirements in relation to dredging licenses. By way of illustration, a number of
the state-of-the-art procedures currently deployed are examined.
Figure 4.1 Wales and its surrounding areas.
4.3 DATA ANALYSES USING GEOGRAPHIC INFORMATION SYSTEMS
The benefits of modern computerized GIS have been well documented by others,
for example, Clark et al., 1991 and Maguire, 1991. GIS was first introduced to the
former Welsh Office (now the National Assembly for Wales) in early 1997 for
analysis of the monitoring data acquired in respect of the dredging license at Nash
Bank. A prototype was developed using ESRI’s (Environmental Systems Research
Institute Inc.) ArcView GIS. The benefits of the technique over the traditional
paper-based reporting were immediately apparent. It:
x provided a stable platform for the integration of disparate data from
different sources;
x allowed a large quantity of data to be stored and processed;
x provided a seamless geographical database overcoming the restrictions of
traditional map/chart boundaries;
© 2005 by CRC Press LLC
x provided facilities for sophisticated analysis and cross-examination of
data; and
x provided advanced facilities for the display and visualization of data to a
wider audience.
After a period of evaluation, the technology was adopted for operational use.
It would play a key role in re-shaping the environmental monitoring procedures.
GIS highlighted the weaknesses of some of the established procedures in terms of
both the quality and coverage of the data. The capability of GIS in handling spatial
data, in particular, has also presented new opportunities for the introduction and
subsequent adaptation of more efficient and cost-effective procedures. The
following sections discuss some of these new and innovative environmental
monitoring techniques. They are: the assessment of cliff instability using close-
range photogrammetry; repeated topographical surveys using Light Detection and
Ranging (LiDAR); and habitat mapping of sensitive sites of nature conservation
interest using Compact Airborne Spectrographic Imager (CASI).
Figure 4.2 South Wales and the Bristol Channel
4.3.1 Assessment of Cliff Instability Using Close-Range Photogrammetry
The Nash Bank lies in the Bristol Channel very close to part of the Glamorgan
Heritage Coast. The sandbank contains about 200 million tonnes of material and is
a relic feature of the last (or “Devensian”) glaciation. The bank is formed
ostensibly from pre-existing glacial and glacio-fluvial deposits subsequently
© 2005 by CRC Press LLC
moulded by advancing seas. At low water its eastern end is often exposed above
the surface of the sea, and it resides, at its nearest point, only 300 metres from the
shore. Its physical orientation and proximity to this area of sensitive coastline
means that it acts as a “barrier” to incoming waves, and is therefore an important
structure in terms of coast protection. Physical processes such as the movement of
sediment in, on and around the feature, as well as human activities, are altering the
shape of this sandbank. One way of measuring the “vulnerability” of the nearby
coastline to such changes is by careful scientific examination of instability in the
highly unstable Blue Lias cliffs that predominate. Extremely accurate
measurements of the geometry of a representative 800-metre section of this
geologically special part of the Glamorgan Heritage Coast, and including part of
the Southerndown Coast Site of Special Scientific Interest (SSSI), have been
undertaken since 1997 using close-range photogrammetry. Its application in this
context is unique in the United Kingdom.
Annual surveys have been undertaken in August of each year between 1997
and 2000. A further one took place in February 2001.
4.3.1.1 Close-Range Photogrammetry: The Technique
Close-range photogrammetry operates on the same principle as aerial photography.
It produces highly detailed geometric data of three-dimensional structures. Data
capture involves the use of a specialist metric camera oriented horizontally on a
tripod, and usually mounted on top of a theodolite. The lenses are calibrated and
their distortion characteristics considered for subsequent data processing. The
technique is also known as terrestrial photogrammetry. Both aerial and close-range
photogrammetry have been described in detail in Wolf (1985).
Close-range photogrammetry involves photographing the features or
structures being surveyed using the metric camera in a known orientation from two
positions. The camera positions and their orientation can be established by
“traditional” surveying methods, such as using visual intersection combined with
theodolite measured distances from known control points. Alternatively, a number
of control points can be set up in the area being surveyed and subsequently
included in the photogrammetric survey. These control points are used to compute
the position and orientation of the two camera positions.
Data is derived from the photographic images by simulating the relative
orientation of the two camera positions, and processing involves the generation of
a three-dimensional stereo model representing the geometry of the structure. It is
relatively labour-intensive because the orientation of the two camera positions is
not always parallel, and this means additional computational requirements.
However, the generation of the 3D geometric model has been helped by advances
in automatic image matching techniques in the past decade.
Close-range photogrammetry has been used widely for surveying
architectural structures worldwide. Its main advantage is that it can survey the
physical dimension of any structure that does not lend itself readily to traditional
surveying techniques. It has also been used extensively by traffic accident
investigators for collecting data from the scenes of accidents where a very limited
period is available for data capture. It is therefore a technique which is
characterized by a short set up time, data capture by relatively straightforward
© 2005 by CRC Press LLC
photographic means and an ability to survey structures and features which are
difficult to examine by any other means.
The intention was twofold: to (a), “test” the technique in the “real-world” of
unpredictable environmental change, and (b), establish accurate rates of retreat
which could be looked at against historical records. The technique is well suited to
the task for several reasons. First, it allows data capture by photographic means
without the need to get too close to the area being surveyed – an important
consideration given the inherent instability of the Blue Lias cliffs! Also, because
the Bristol Channel has the second highest tidal range in the world, only limited
periods of time are available for data capture. The technique allows surveyors to
record data very quickly around mean low water. Finally, the photographic
images captured can be manipulated and rectified to provide a geometrically-
correct picture called an orthoimage. An orthoimage is a distortion-free map-like
image of an original photographic record. It is produced by rectifying the original
photographic image using geometric data derived subsequently. It provides a
definitive visual record of the conditions of the cliff at the time of the survey.
Figure 4.3 (see colour insert following page 164) is illustrative.
Figure 4.3 The rectified image of the study area for the year 2000.
In addition, the distortion-free orthoimages of the study area can be displayed
in the GIS environment where they can be used to help make accurate quantitative
measurements, while the map-like orthoimages can be used in conjunction with the
3D geometry derived earlier in the process to produce a realistic representation of
the cliffs using advanced computer visualisation techniques such as Virtual
Reality.
The combined use of orthoimages and 3D geometric models in a GIS
environment has provided a robust platform for analysis of changes to the cliffs.
Quantitative contours are interpolated at 0.5 metre and 1-metre intervals using
information derived from the geometric data sets. These contours, representing the
degrees of change, are displayed on the rectified orthoimage. This innovative
visualisation technique allows quantitative measurements of yearly change to be
related directly to the cliff face and its geology. This may be vital in guiding
interpretative analysis of why change occurs and in attempting to understand
whether or not rates of recession are increasing.
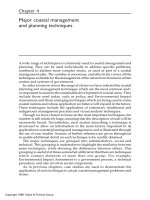
An example will help illustrate the techniques. A large rock fall occurred in
the winter of 2000-01. Figure 4.4 illustrates the extent and magnitude of the event
(in the middle right of the picture) from an oblique angle.
© 2005 by CRC Press LLC
A geometric representation of this event can be displayed and visualised in a
couple of interesting ways. Firstly, the interpolated surface can be colour-coded in
relation to distance between the viewer and the cliffs. Figure 4.5 shows the data for
a 200-metre wide area centred on the fall. Darker shades represent features further
away from the observer.
Figure 4.4 The Large rock-fall of winter 2000-01. The cliffs are comprised of Blue Lias rocks and are
about 65 metres high. In the foreground is part of a wave-cut platform in the same formation that has
been developing for about 7,000 years.
Figure 4.5 Data for a 200-metre stretch of coastline
north-west of Cwm Bach
Secondly, the changes brought about by the fall between surveys can be
colour-coded to illustrate the changes to the cliffs, and interpolated surfaces may
produced using the GIS. Changes at the sampling positions are shaded in reds and
blues, depending on the nature of the change recorded. Data collected in February
2001 was compared with that for the summer of 2000. Colour Plate 4.1 (following
page 164) shows the results.
© 2005 by CRC Press LLC
The fairly large area of the cliffs represented by deeper reds “failed,” causing
materials to be deposited as a “classic” debris fan at the base (in deeper blues). The
thin area in blue towards the right of the failure represents an “advance.” This is, in
reality, a rock column which has become detached from the main body of the cliff,
and which has been left as a freestanding pillar with a considerable void behind
(see Figure 4.4). Future movements will be interesting to monitor!
4.3.2 Topographical Survey Using Light Detection and Ranging
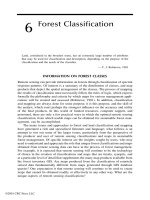
Light Detection and Ranging (LiDAR) is a modern airborne remote sensing
technique for surveying topography. It operates on the same basic principle as
traditional Radio Detection and Ranging (RADAR), but uses laser as the detection
medium. It accurately measures the distance between the instrument and its
surrounding environment, and consists of three components: a laser-scanning
device, an on-board Differential Global Positioning System (DGPS), and an
Inertial Reference System (IRS).
Figure 4.6 A systematic diagram of the three components of airborne LiDAR.
The laser-scanning device is used for the measurement of the distance
between the instrument and the topography being surveyed. It emits laser pulses in
perpendicular directions to the flight path. By measuring the time required for the
laser pulse to return, the distance between the instrument and the topography can
be accurately determined. At the same time, an on-board DGPS communicates
© 2005 by CRC Press LLC
with navigation satellites and a stationary ground reference station. It gives the
positions of the airborne platform, usually a fixed-wing aircraft, in relation to the
earth’s surface. The last component of the system is the IRS. This is essentially a
motion sensor, and detects minute movements of the aircraft in terms of its yaw,
pitch and roll (i.e. movements about its three axes). It corrects the orientation of
the laser pulses that can become distorted because of aircraft movement. When the
three components work in unison, the surveyed topography is recorded very
accurately. Routine field validations of the technique by the Environment Agency
have indicated an accuracy of better than 15 cm generally. Ground resolution of
data is directly dependent on flying height and speed of the surveying aircraft, as
well as the scanning rate of the laser pulses. For example, when flying at 70 knots
at an altitude of 3,000 feet LiDAR, with a 5,000 Hz scanning rate, can acquire
topographical data with a ground resolution of about 2.5 to 3.5 metres. At the time
of writing, the Environment Agency has plans to operate a newer version of
LiDAR with a scanning rate of 33,000 Hz. The new instrument should produce
topographical data with a 0.5 metre ground resolution! Figure 4.6 shows the three
main components of airborne LiDAR.
In South Wales, the coastline is diverse, characterized as it is by bays, inlets,
estuaries, beaches, rocky-shores, high cliffs, sand dunes, near-shore sand banks
and mud flats. Traditional monitoring on some of the beaches using linear profiles
has provided some limited data. In addition, accurate identification of ground
features from aerial photographs has been difficult and is relatively expensive.
LiDAR, however, has provided a high-value and cost-effective solution. Its
capability in capturing very detailed topographical data, without the need to
physically visit most of the locations being surveyed, makes it well suited for
environmental monitoring purposes, especially for inter-tidal zones where it can
survey a large area within a short space of time. One of the few restrictions for the
deployment of LiDAR is the tidal window.
LiDAR was first available in the UK in early 1998. The National Assembly
for Wales has long realized the potential of the technique and has pioneered its use
in Wales. As early as March 1998, in relation to dredging at Helwick Bank, the
National Assembly for Wales decided to include the technique as one of the
environmental monitoring requirements to measure change along the coastline. As
such, the procedure would be deployed annually to monitor levels of key beaches
in South Gower. This will continue until at least June 2003. This requirement is
believed to be the first of its kind in the UK, and highlights the fact that the
analyses of the highly accurate topographical data over time is innovative and
pioneering.
To complement these activities, in early 1999, a collaborative project called
the “Glamorgan Coastal Monitoring Initiative” was launched by the Welsh Office.
This was designed to further embrace the potential of this airborne remote sensing
technique, and to marry the data to high-resolution habitat information derived
from the Compact Airborne Spectrographic Imager (CASI). This is discussed in
the following section.
LiDAR produces extensive data sets. In Kenfig National Nature Reserve
(NNR), for example, over 30 million data points have been collected under the
Glamorgan Coastal Monitoring Initiative. A number of custom-built computer
programs have been written to reduce the data files to more manageable sizes. The
data sets have been transferred to an ArcView GIS for interpolation and further
© 2005 by CRC Press LLC
analysis. Some important derivatives, such as slope and aspect, have also been
computed. Plates 4.2 to 4.4 show examples of the interpolated elevation surface,
and subsequent derivations of slope and aspect from LiDAR data of the same area
in the Kenfig NNR.
4.3.3 Habitat Mapping Using Compact Airborne Spectrographic Imager
(CASI)
Compact Airborne Spectrographic Imager (CASI) is a state-of-the-art remote
sensing instrument for measuring radiation reflectances in the electro-magnetic
spectrum. The classification of CASI data can produce a “map” by positively
identifying the radiation reflectances of different “objects.” In the case of habitat
mapping, CASI can “see” a clear boundary between different types of vegetation
as long as they emit different levels of radiation – the so-called spectral signature.
Habitat mapping using CASI involves three components: an airborne survey using
CASI; a simultaneous ground-truthing exercise; and image classification to
produce the habitat map (Plate 4.5).
Table 4.1 The classified values, the classifications and their corresponding display colours in plate 4.6,
the classified habitat map of Kenfig NNR.
Category Classification Colour
1 water dirty green
2 bare sand yellow
3 scrub dark green
4 Phragmites red
5 Calluna light green
6 Pteridium pale blue
7 successionally-young grassland blue
8 orchid-rich slack purple
9 successionally-young slack light brown
10 tall rank grassland light blue
11 embryo dune slack pale blue
The data acquisition stage is characterized by an airborne survey using CASI.
The ideal timing for the airborne survey is around midday. This is the time when
the sun’s angle is at its highest, casting minimum shadow and giving the most
accurate representation of radiation reflectance. While the CASI survey is being
carried out, a team of specialists undertakes a ground-truthing exercise to
determine the ecology of selected locations within the study area. The ecological
parameters are measured using traditional methods such as 1m x 1m quadrats with
the aid of modern DGPS for accurate determination of position. The exercise
provides important information to allow the airborne CASI data to be cross-
referenced with known vegetation types. The last stage is the classification of
CASI data in conjunction with the ground-truthing information to generate a map
of the vegetation types. This classified map is subsequently interpreted to form the
basis for a habitat map.
© 2005 by CRC Press LLC
CASI has been used as an integral part of the “Glamorgan Coastal
Monitoring Initiative.” The main objective has been to provide a benchmark
survey for Kenfig NNR which together with Merthyr Mawr Warren makes up the
European Union’s candidate Special Area of Conservation (cSAC). Both sites are
of national and international importance. For example, Kenfig NNR holds over
40% of UK’s population of the rare fen orchid (Liparis loeselii), whilst Merthyr-
Mawr Warren is the second highest mobile sand dune system in Europe.
Kenfig has many other features of conservation interest. The successionally-
young stages of dune development, in particular, are species-rich, with more than
40 plant species usually found in a 1m x 1m quadrat. These habitats have been
prioritised for management and monitoring purposes under the current European
Habitat Directive. However, there are growing concerns that the over-stabilization
of the mobile sand dunes at Kenfig NNR is threatening the biodiversity of the
cSAC.
For discussion purpose, Kenfig NNR has been divided into two broad areas:
a southern and northern section (Figure 4.7). The southern section is mostly
dominated by mature dune vegetation, whereas successionally-young seral stages
are more prominent in the north of the site. The boundary is situated where one
starts to grade into the other.
Figure 4.7 Kenfig NNR divided. The section in darker grey represents the ecologically older and more
mature southern region of the Reserve. The northern area is depicted in pale grey.
The area Figure for the successionally-young grassland has been calculated
by carrying out a pixel count for the habitat type based on a pixel size of 2 x 2m
(Table 4.2). The area measurement for the whole site has been calculated in the
same way.
© 2005 by CRC Press LLC
Table 4.2 Area measurements for successionally-young grassland at Kenfig NNR, taken from the
classified CASI images.
Section Area of
Section (m
2)
Area of successionally-young
grassland (m
2
)
%
Southern 1,771,276 201,248 11.3
Northern 2,706,684 782,120 28.8
Whole site 4,477,960 983,368 21.9
Preliminary results show that successionally-young grassland not only covers
a much greater area in the Northern Section (which might have been expected
because it is considerably larger than the Southern Section), but also occupies a
much larger percentage of the area than in the South. This evidence confirms
observations that the dunes in the southern part of Kenfig are generally in an
advanced state of stabilisation, while this is less so in the northern part of the site
where successionally-young grassland is relatively well distributed.
Figure 4.8a Areas classified as successionally-
young grassland in the southern section
Figure 4.8b Areas with a south-facing aspect
Figure 4.8c Areas classified as successionally-
young grassland in the south-western part of the
southern section
Figure 4.8d Areas with a south-facing aspect
© 2005 by CRC Press LLC
Evidence from the joint analysis of topography and habitat classification in
the southern section provides interesting comparison. A high proportion of the
areas classified as successionally-young grassland occur close to the top of south-
facing slopes. Figures 4.8a and b show the areas classified as successionally-young
grassland in the Southern Section, juxtaposed with those showing a south-facing
slope. There is also some correlation between the successionally-young grassland
and aspect, and this is particularly evident in the south-western part of the section.
Figures 4.8c and d are illustrative.
4.4 THE NEXT FRONTIER – MARINE AGGREGATE RESOURCE
MANAGEMENT AND PLANNING SYSTEM (MARMPS)
Data collected from these innovative monitoring procedures helps to shed light on
some of the plethora of natural processes causing change to the coastal
environment. It also helps to expose the implications of some human activities.
The data sets are used to populate a GIS. This provides a technical tool to underpin
an embryonic decision-support system which will be used for the management and
planning of the marine aggregate resource in South Wales to ensure it is only
extracted in a sustainable way.
This system, entitled the “Marine Aggregate Resource Management and
Planning System (MARMPS),” will operate using data and information on three
layers: the site-specific monitoring data sets acquired in relation to the dredging
licences, including those relating to bathymetry, 3D cliff analysis and
topographical beach data; the regional data from the Glamorgan Coastal
Monitoring Initiative, including data from both the LiDAR topographical survey
and CASI habitat mapping survey; and the broad-scale and comprehensive
strategic data sets derived from the “Bristol Channel Marine Aggregates:
Resources and Constraints” project. This research, completed in August 2000,
examined the available marine aggregate resources, and the technical, economic,
environmental and cultural constraints operating to deter extraction. Two of the
many significant outcomes of this work were, firstly, the delivery of an abstractive
GIS database with about 100 data themes for the Bristol Channel and, secondly,
the derivation of sediment environments representing sub-areas of the physical
system that are considered to exhibit similarities across various components of the
sediment regime. Together, these will help form the basis for future strategic
policy and decision-making.
MARMPS will adopt a multi-criteria approach to aid decision-making at a
more local level. In the Bristol Channel, a complicated number of conflicting
objectives co-exist, for example, the economic demand for marine aggregate and
possible environment impact. MARMPS will define the relationship between these
by quantifying them in commensurate terms. In doing so, the conflicting objectives
will be summarized and “optimised.” The decision-makers will also take part by
defining, in their own way, the relative importance of these conflicting objectives,
and a weighting mechanism will be applied to take account of these views.
Clearly, the weighting may change over time. MARMPS, when completed, will be
the first system of its kind in the United Kingdom. It will be operational, designed
to tackle real world issues. It will assist decision-makers in reconciling the
conflicting interests of different users in the coastal zone.
© 2005 by CRC Press LLC
It is not within the scope of this paper to discuss MARMPS in extended
detail. However, the availability of good quality data sets is essential to the success
of the development of the system. The National Assembly for Wales will continue
to strive to acquire data sets that are robust and meaningful. Continual monitoring
of the coastal and marine environment is key to an understanding of the
mechanisms of coastal change.
But MARMPS is not just about data collection. There are, for example, a
number of identifiable interfaces: the relationship between the coastal and the
marine environment; the interaction between various bodies and organizations who
have a common interest in the coastal zone; and the need to find lines of
communication between science and the general public. The most important
interface is, however, the one that brings about an understanding of the strengths
and limitations of the natural environment and the formulation of a complementary
sustainable policy to ensure wise use of its resources. The outcomes from this
interface will, of course, have socio-economic implications.
The development of MARMPS is the latest in an ever-increasing list of new
ways of collecting, analysing and using data and information by the newly
devolved National Assembly for Wales ʊ the introduction of GIS; routine
deployment of LiDAR to monitor coastal change; habitat mapping using CASI;
and 3D geometric monitoring of cliff instability. MARMPS will no doubt assist
decision-makers at the National Assembly for Wales in making better informed
and evidence-based decisions on the future sustainable use of our coastal heritage
for many generations to come.
4.5 EPILOGUE
A dissemination seminar for the “Glamorgan Coastal Monitoring Initiative” took
place in Porthcawl, South Wales, United Kingdom, on 11 July 2001. (Further
details are available at: The main objective
was to report the results of the Initiative to participating partners, as well as to
communicate knowledge about these advanced scientific techniques to the general
public.
4.6 ACKNOWLEDGEMENTS
The authors would like to thank the National Assembly for Wales and the
University of Wales for their support in the production of this joint work. They
would also like to thank Clive Hurford of the Countryside Council for Wales and
Graham Thackrah of the University of Wales, Swansea (now at University College
London) for their assistance in the habitat mapping of Kenfig cSAC.
The authors are responsible for the contents of this paper, and none are
attributable to either the National Assembly for Wales or the University of Wales.
© 2005 by CRC Press LLC
4.7 REFERENCES
Clark, D.M., Hastings, D.A., and Kineman, J.J., 1991, Global databases and their
implications for GIS. In Geographical Information Systems: principles and
application, vol. 2 edited by Maguire, D.J., Goodchild, M.F., Rhild, D.W.
(London: Longman) pp. 217-231.
Countryside Council for Wales, 2000, Conservation Report on Kenfig NNR.
Countryside Council for Wales, 2001, Habitat Monitoring for Conservation
Management and Reporting Volume 1: Case Studies.
Dargie, T.C.D., 1995, Sand Dune Vegetation Survey of Great Britain: Part 3 –
Wales. JNCC. Peterborough.
Hurford, C., 1997, Year 1 Report on the Fen Orchid Liparis loeselii Species
Recovery Programme at Kenfig NNR, Glamorgan. Countryside Council for
Wales. Unpublished contract report.
Jones, P.S., 1996, Kenfig National Nature Reserve: A Profile of a British West
Coast Dune System, in Studies in European Coastal Management (Tresaith,
Cardigan: Samara Publishing Ltd.) pp. 292.
Maguire, D.J., 1991, An overview and definition of GIS. In Geographical
Information Systems: principles and applications, vol. 1 edited by Maguire D.J.,
Goodchild M.F., Rhild, D. W. (London: Longman) pp. 9-20.
Pan, P.S.Y. and Morgan, C.G., 1998, Monitoring of the Welsh Coastal
Environment, in Wavelength, Department of the Environment, Transport and the
Regions, Issue 2.
Pan, P.S.Y. and Morgan, C.G., 1999, Glamorgan Coastal Monitoring Initiative
1999, in The Proceedings of the 25
th
Annual Technical Conference of the Remote
Sensing Society, Cardiff, September 1999, ISBN 0 946226 27 X.
Pan, P.S.Y., Morgan, C.G., Hurford, C. and Thackrah, G., 2001, Remote Sensing,
GIS and the Coastal Environment in South Wales, in The Proceedings of the GIS
Research UK 9
th
Annual Conference GISRUK 2001, pp 14-15.
Posford Duvivier & ABP Research & Consultancy, 2000, Bristol Channel Marine
Aggregates: Resources and Constraints, National Assembly for Wales.
Sanjeevi Shanmugam and M.J. Barnsley, 1996. Monitoring vegetation succession
in coastal dunes using remote sensing: a case study from the Kenfig NNR, South
Wales, in The Proceedings of the 22
nd
Annual Technical Conference of the
Remote Sensing Society, Nottingham, pp 236-243.
© 2005 by CRC Press LLC