Atmospheric Acoustic Remote Sensing - Chapter 4 ppt
Bạn đang xem bản rút gọn của tài liệu. Xem và tải ngay bản đầy đủ của tài liệu tại đây (1.24 MB, 50 trang )
55
4
Sound Transmission
and Reception
The essence of an acoustic remote-sensing system is in generating sound into a well-
formed beam which interacts with the atmosphere in a known manner and then
detecting that interaction. In Chapter 2 we learned about the nature of the atmo-
sphere into which the sound is projected, and in Chapter 3 the way in which sound
travels. In this chapter we describe how to form a beam of sound, how scattered
sound is detected, and how systems are designed to optimize retrieval of various
atmospheric parameters. The main emphasis of Chapter 4 is on geometry and tim-
ing, but details on some of these aspects are left to Chapter 5.
4.1 GEOMETRIC OBJECTIVE OF SODAR DESIGN
The boundary layer atmosphere is often strongly varying in the vertical, but hori-
zontally much more homogeneous. The geometric design objective for vertically
proling instruments is therefore to localize the acoustic power sufciently in space
so that atmospheric properties are obtained from well-dened height intervals at a
particular time. This means that the vertical resolution has to be dened, typically by
using a pulsed transmission. But since sound will spread spherically from the source,
height resolution also depends on angular width of the beam transmitted. Here we
concentrate on SODAR (SOund Detection And Ranging) systems, for which the
acoustic beams are often non-vertical, as shown in Figure 4.1.
Here the pulse duration is U and the angular width of the acoustic beam is ±∆G
in azimuth angle and ±∆R in zenith angle. From Figure 4.1, the vertical extent of the
pulse volume is ≈ cUcos R + 2z∆sinR∆R, which has a term increasing with height z.
Taking cU =20 m, and R = 20°, the vertical extent of the pulse volume near the ground
is cU cos R = 18.8 m but, for a beam half-width of ∆R = 5°, this increases to 50 m at
z = 500 m. This emphasizes the need to keep the product sinR∆R small. Also, if ∆R is
too large then the pulse volume will include a wide range of radial velocity, the Dop-
pler spectrum will be wider, and the ability to detect the peak position of the Doppler
spectrum, in the presence of noise, will be compromised. But we will see later that
the wind velocity component estimates of u and v have errors which depend on 1/sinR,
so it is important that R not be too small. On the other hand, R must also not be so
large that the volumes sampled by the various SODAR beams which point in differ-
ent directions, are so spatially separated that their wind components become uncor-
related. The resulting design must therefore be a delicate balance between modest R
values and a narrow beam width ∆R. Typical designs have 15°<R<25° and 4°<∆R <8°.
Obtaining such a small beam width ∆R requires an antenna, since the beam widths
of individual speakers are typically much greater. Use of an antenna has the added
advantage of increasing the collecting area for echo power.
3588_C004.indd 55 11/20/07 4:56:46 PM
© 2008 by Taylor & Francis Group, LLC
56 Atmospheric Acoustic Remote Sensing
4.2 SPEAKERS, HORNS, AND ANTENNAS
4.2.1 S
PEAKER POLAR RESPONSE
Figure 4.2 shows several typical speakers. The TOA SC630 is a double re-entrant
horn 30-W speaker producing a sound pressure level (SPL) of 113 dB at 1 m and
at 1.5 kHz. The FourJay 440-8 “Thundering Mini” is a compact 40-W re-entrant
horn speaker with an SPL = 110 dB peaking at 2 kHz. The Motorola KSN1005A
is a small piezo-electric horn speaker producing an SPL of 94 dB at 5 kHz. Horn
speakers consist of a driver, which includes a diaphragm, and a horn-shaped cone
of plastic or metal to efciently couple energy from the small driver into the atmo-
sphere. Re-entrant horn speakers have the cone split into a backward-facing part
connected to the driver and a forward-facing part exiting into the atmosphere; they
have the advantage of being more weatherproof and can in many cases be mounted
facing upward.
Figure 4.3 shows polar plots of the sound intensity produced by these speakers
at selected frequencies. It is clear from these polar plots that a typical half-power, or
−3 dB, beam width is 30° rather than the desired 5°.
There are two ways in which a narrow beam is generally achieved, while still
using such speakers. One is to re-shape the beam pattern by using a parabolic reec-
tor, in much the same way as car headlights re-shape the broad beam from a light
bulb into a narrow forward beam. The other method is to use multiple speakers,
driven synchronously. The sound waves from multiple speakers reinforce in one
direction and gradually cancel at angles further away from this direction. This is the
principle of the phased array antenna.
q
q
c
z
x
y
FIGURE 4.1 The pulse volume for a tilted acoustic beam.
3588_C004.indd 56 11/20/07 4:56:47 PM
© 2008 by Taylor & Francis Group, LLC
Sound Transmission and Reception 57
4.2.2 DISH ANTENNAS
A parabolic dish antenna consists of a speaker situated at the focus of a parabolic
reector and facing downward toward the center of the reector. An example is
shown in Figure 4.4 and the geometry is shown in Figure 4.5.
It can be shown that if sound from the speaker is projected downward at an
angle R to the vertical, then its angle to the perpendicular from the dish surface is [
= R/2. The law of reection gives [ = R/2 between the perpendicular and the verti-
140 mm
285 mm
85 mm
FIGURE 4.2 TOA SC630 (left), FourJay 440-8 (center), and Motorola KSN1005A (right).
10°
0°
20°
30°
40°
50°
60°
70°
80°
90°
130°
120°
110°
100°
170°
160°
150°
140°
190°
180°
210°
240°
230°
220°
200°
300°
290°
280°
270°
260°
250°
310°
330°
320°
340°
350°
0dB
–5–10–15–20
–25
FIGURE 4.3 Polar response of some typical horn speakers, normalized to 0 dB in the for-
ward direction. Heavy line (FourJay 440-8 at 3 kHz) and light line (TOA SC630 at 2 kHz).
3588_C004.indd 57 11/20/07 4:56:49 PM
© 2008 by Taylor & Francis Group, LLC
58 Atmospheric Acoustic Remote Sensing
cal. This means that all sound from the
focal point is reected directly upward
and, regardless of the speaker’s polar
response, the upward beam is perfectly
collimated. There are a number of rea-
sons why this “perfect” situation is not
observed in practice. The rst is that
the speaker cone has nite diameter d.
The effect of this can be estimated using
Figure 4.6.
In this gure we know that a down-
ward ray from the center of the speaker
(at the focus) will be reected verti-
cally upward. So, using the fact that
sound propagation is reversible, a ver-
tically downward ray from the edge of
the speaker (at x = d/2) will be reected
back through the focus, and on past the
speaker at an angle Z to the vertical. If
the sound intensity is uniform across
the dish, then the beam will now have a
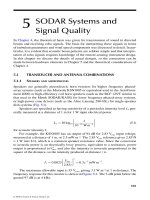
width of approximately ± Zqd/2b rad.
For example, a dish having b = 570 mm and a speaker of diameter d = 100 mm would
produce a beam nominally of width ±5°. In practice, the actual half-angle width of
the beam (measured out to where the sound intensity is at half the intensity at the
center of the beam) will depend on the angular or polar response of the speaker, and
will generally be less than oda/2 , where a is the dish radius. Very approximately,
the speaker polar response within angles
tan ( / )
1
ba to tan ( / )
1
ba, will be com-
pressed into angles
tan ( / )
1
2db to tan ( / )
1
2db.
A second cause for non-perfect collimation is whether some of the sound from
the speaker reaches the edges of the dish. This creates diffraction (discussed in
Chapter 3) with the upward traveling sound being equivalent to coming through a
x
z x
b
b
FIGURE 4.5 Geometry for a SODAR using a dish antenna. The downward-facing speaker
is at the focal point of the parabolic dish.
FIGURE 4.4 A SODAR dish antenna
used in an early AV2000 AeroVironment
SODAR.
3588_C004.indd 58 11/20/07 4:56:57 PM
© 2008 by Taylor & Francis Group, LLC
Sound Transmission and Reception 59
hole with the same diameter as the dish. If the dish is uniformly covered by sound
energy from the speaker, the upward intensity pattern is proportional to
2
1
2
Jka
ka
(sin)
sin
Y
Y
§
©
¨
¨
·
¹
¸
¸
where J
1
is the Bessel function of order 1, k the wavenumber of the sound, and a the
dish radius. This gives a beam pattern which has an angular half-power width of
about
o2/ka
rad, but which also has subsidiary peaks at greater angles (known as
side lobes), as shown in Figure 4.7. For example, if ka = 33, then Figure 4.8 shows
that the polar response of the diffraction pattern from the dish has a side lobe peak
about 17 dB below the main lobe intensity and at an angle to the vertical of about
Z = 9°.
b
x d
FIGURE 4.6 7KHHIIHFWRIÀQLWHVSHDNHUGLDPHWHURQGLVKDQWHQQDEHDPZLGWK
ka
J
ka ka
FIGURE 4.7 The polar intensity pattern from a uniformly radiated dish of radius a.
3588_C004.indd 59 11/20/07 4:57:00 PM
© 2008 by Taylor & Francis Group, LLC
60 Atmospheric Acoustic Remote Sensing
Again, the off-axis intensity will generally be lower than this because the sound
power from the speaker will be concentrated more in the center of the dish.
Figure 4.4 shows a dish of
a ≈ 0.6 m radius and a speaker driver (the magnetic
coil and diaphragm in this case) and horn at a focal distance b ≈ 0.4 m. The throat of
the horn has a diameter of d ≈ 70 mm. The purpose of the horn attached to the driver
is generally to efciently couple the acoustic energy into the atmosphere. However,
in this case the horn is designed to also ensure that the outer edges of the dish are
subjected to minimal acoustic power so that diffraction is negligible. In other words,
the driver/horn combination has a directivity with power conned well within the
angle sin ( / )
1
ba (≈40° in this case, as shown in Fig. 4.4). If such a horn design is
achieved, this SODAR should have a beam width narrower than oodb/2 5
C
.
The acoustically absorbing bafes which surround the dish help to further reduce
sensitivity to sound from the side. For the rather broad polar pattern of the FourJay
440-8 at 3 kHz shown in Figure 4.3, diffraction is signicant with a 1.2-m diameter,
580-mm focal length dish. A polar pattern for this dish plus speaker combination
measured in an anechoic chamber is shown in Figure 4.9. The beam width is wider
than predicted from Figure 4.8 because of nite speaker diameter and diffraction.
One advantage of the downward-facing horn speaker and dish arrangement is its
inherently weatherproof nature. The speaker is quite well protected from rain. Rain
noise, due to splashing on the dish, will still in general be a problem.
10°
0°
350°
340°
330°
320°
310°
300°
290°
280°
270°
260°
250°
240°
230°
220°
210°
200°
190°
180°
170°
160°
150°
140°
130°
120°
110°
100°
20°
30°
40°
50°
60°
70°
80°
90°
0dB–5–10–15–20–25
FIGURE 4.8 The polar pattern from a uniformly radiated dish of radius a = 1.2 m at a
frequency of f = 3 kHz.
3588_C004.indd 60 11/20/07 4:57:03 PM
© 2008 by Taylor & Francis Group, LLC
Sound Transmission and Reception 61
Two manufacturers, AQS and Atmospheric Research, market small dish-antenna
SODARs. Both argue that the antenna gives smaller side lobes than the alterna-
tive phased array. As we shall see later, smaller side lobes are desirable to reduce
echoes from solid objects (such as masts, tress, or buildings). These systems use
three speakers: each with its own dish. By mounting a speaker at the focal distance
b but distance x = −s to one side, the beam is tilted at angle tan ( / )
1
sbrad in the
+x-direction. This provides the three measurements of Doppler shift needed at each
height to nd the three unknown wind velocity components u, v, and w.
4.2.3 PHASED ARRAY ANTENNAS
Most SODAR designs use multiple speakers in a phased array. There are two basic
types: a horizontal array (with speakers facing upward) and a reector-array (with
speakers facing approximately horizontally toward a 45° reector). In the rst case,
speakers must be protected from rain by being a folded or re-entrant horn design
(Figure 4.10). In the second case, any speaker may be used, and the array is recessed
into a rain shield. This design is perhaps a little less susceptible to rain impact noise,
but is generally bulkier. The beam geometry is essentially the same for the two
cases, however.
10°
0°
350°
340°
330°
320°
310°
300°
290°
280°
270°
260°
250°
240°
230°
220°
210°
200°
190°
180°
170°
160°
150°
140°
130°
120°
110°
100°
20°
30°
40°
50°
60°
70°
80°
90°
0dB–5–10–15–20–25
FIGURE 4.9 Measured polar pattern for the FourJay 440-8 speaker at 3 kHz with a 1.2-m
diameter dish having a focal length of 580 mm.
3588_C004.indd 61 11/20/07 4:57:05 PM
© 2008 by Taylor & Francis Group, LLC
62 Atmospheric Acoustic Remote Sensing
Apart from the extra transmitted power and receiver area provided by an array
of speaker/microphones, there are beam-forming advantages. Consider the case of
evenly spaced speakers, as shown in Figure 4.11.
The distance to some point r from a speaker at the origin is just r. The distance to
r from a second speaker is r – Swhere S is the position of the second speaker. Now
| |()()rrrr
r
r
r
r
¤
¦
¥
¥
¥
¥
´
¶
µ
µ
µ
µ
RRR R
R
1
2
2
22
.
For r S the extra distance from the second speaker is y (/)rr R. This extra
distance is ()/rrRL wavelengths, or, compared to sound transmitted from the
origin, a phase angle of kr r(/)R, where k is the wavenumber. If the position of
the second speaker is (x, y), then the phase of sound from this speaker, compared to
sound transmitted from the origin, is
GFQFQ
JJ
t
t
t
t
kx y x
x
y
y
( cos sin sin sin ) .
(4.1)
FIGURE 4.10 ([DPSOHVRIDDKRUL]RQWDODUUD\DQGEDUHÁHFWRUDUUD\
z
x
y
r
r
r
FIGURE 4.11 The geometry of an array of speakers, some of which are shown as gray
dots, transmitting in a direction r.
3588_C004.indd 62 11/20/07 4:57:11 PM
© 2008 by Taylor & Francis Group, LLC
Sound Transmission and Reception 63
Allowance has been made in (4.1) for an extra phase shift K(x, y) to be applied
electronically to the sound transmitted from a speaker at (x, y). It is also assumed that
K increases or decreases by uniform steps from speaker to speaker across the array.
We shall see below that this progressive change of applied phase across the array
allows the acoustic beam to be “steered” in space.
Let (x, y) = (md, nd), where d is the inter-speaker spacing in both x and y direc-
tions, and write
GFQ
J
F
t
t
¤
¦
¥
¥
¥
¥
´
¶
µ
µ
µ
µ
mkd d
x
nkdcos sin sin si
nn.Q
J
JJ
t
t
¤
¦
¥
¥
¥
¥
´
¶
µ
µ
µ
µ
d
y
mn
xy
Assume that the signal transmitted from the speaker at the origin is a(RG sin
Xt. The direction-dependent amplitude a(RG allows for the speaker polar pattern.
Assume also, for the moment, that ttJ / y 0 . Then in the plane G = 0, the incre-
mental phase K
y
= 0. The contribution to the sound signal at a distant point from the
two rows –m and +m in this plane is therefore
atmtm
xx
nN
m
(,) [sin( ) sin( )]
()/
(
QWJWJ0
12
NN
mx
m
aN m t
£
12
2
)/
[ ( , ) cos( )]sin ,QF J W
assuming there are N
m
speakers in these rows. If there are a total of M rows, then the
total amplitude is
AaNa Nm
mx
m
M
(,) (,) (,) cos( )
()/
QQ Q J0020
0
1
12
££
.
Assume that the speaker polar response a(RG changes only slowly with angle
and so
t
t
y
a(,)
.
Q
Q
0
0
The amplitude therefore peaks when
t
t
£
A
akd Nmm
mx
m
M
Q
QQ J20 0
1
12
(,) cos sin( ) .
()/
This is true when
JQ
J
PP
x
kd d
x
t
t
o o zsin , , ,02 4 (4.2)
or
kd d
x
d
x
sin , , .Q
JJ
P
t
t
t
t
oz2
(4.3)
3588_C004.indd 63 11/20/07 4:57:20 PM
© 2008 by Taylor & Francis Group, LLC
64 Atmospheric Acoustic Remote Sensing
For example, if the incremental applied phase step is
dx(/) /ttJP2
rad, then
peaks occur at
sin , , , , .Q
LL L
z
3
44
5
4ddd
(4.4)
The choice of a speaker–speaker phase increment of π/2 is an important one,
since it is very easy to electronically generate signals sin Xt,
cos sin( / )WWPtt2
,
sin sin( / )WWPtt22, and cos sin( / )WWPtt32. This phasing is shown in
Figure 4.12.
The above analysis shows that it is relatively easy to tilt a phased array beam
electronically. This beam steering is useful for obtaining Doppler shift from wind
components projected onto the beam direction.
Figure 4.13 shows an example of angle for peak intensity versus frequency for
one speaker type. Since the maximum SPL from a speaker generally occurs at a
wavelength related to the speaker diameter, the optimum frequency of operation for
the phased array, if using 90° phase steps, generally gives a tilt angle in the range
15–25°. Note, however, that a common feature of phased array beam steering is
the appearance of multiple peaks, as predicted by (4.3). In Figure 4.13, three peaks
occur at high frequencies. At 6 kHz, peaks occur at −30°, 9.6°, and 56°. The natural
speaker response a(RG will tend to suppress the 56° peak, but the −30° peak could
be troublesome as a source for spurious echoes off xed objects such as trees, build-
ings, and masts. Such signals are called “xed echoes” and are a signicant design
limitation of many SODARs. Because of this appearance of multiple lobes, it is
common to phase the array to tilt the beam diagonally, thus giving a speaker row
spacing of d /2. As shown in Figure 4.13, this causes the side lobes to be at lower
elevation angles and therefore to be more suppressed by the speakers directional
response a(RG.
The above analysis assumes that there is a central speaker and symmetrically
placed speakers on either side. If instead (,) ( / , / )xy md d nd d 22 then
–sin sin –sin sin –cos cos –cos
cos
FIGURE 4.12 Snapshot of pressure waves transmitted from a row of speakers with incre-
mentally increasing phase of /2 to the right. Dashed lines show wavefronts and the solid
arrow shows the propagation direction.
3588_C004.indd 64 11/20/07 4:57:29 PM
© 2008 by Taylor & Francis Group, LLC
Sound Transmission and Reception 65
Aa Nm
mx
(,) (,) cosQQ J020
1
2
Đ
â
ă
ă
ã
ạ
á
á
Ô
Ư
Ơ
Ơ
Ơ
Ơ
ả
à
à
àà
à
à
Ê
m
M
1
2/
and (4.3) still holds.
Equation (4.3) gives the angular position of the beam maximum, and this is
independent of the number of speakers (although there must be at least two speakers
in a row). The number of speakers affects the width of the acoustic beam and also the
nature of subsidiary maxima. Consider the case where there is no central speaker.
Then following a similar analysis to that above, the total amplitude is
Aa m
x
(, ) (, ) cosQF QF J
ê
ô
ơ
ằ
ẳ
Ô
Ư
Ơ
Ơ
Ơ
Ơ
8
1
2
ả
à
à
à
à
à
ê
ô
ơ
ằ
ẳ
Ô
Ư
Ơ
Ơ
Ơ
Ê
m
M
y
n
1
2
1
2
/
cos J
ƠƠ
ả
à
à
à
à
à
Ê
n
N
1
2/
providing there are equal numbers N of speakers in each row. Now using the identi-
ties
sin ( ) /Q
ee
jj
2 j
and
cos ( ) /Q
ee
jj
2
gives
cos
/
m
x
m
M
ê
ô
ơ
ằ
ẳ
Ô
Ư
Ơ
Ơ
Ơ
Ơ
ả
à
à
à
à
à
Ê
1
2
1
2
J
Ê
1
2
1
2
12
1
2
12
1
2
ee
jj(/)
/
(/)
/
m
m
M
m
m
M
xx
JJ
ÊÊ
Ê
1
2
1
2
12
1
2
12
eeee
i( / )
/
(/ )
() (
JJ J
xx x
m
m
M
jj
Ê
jJ
x
m
m
M
).
/
1
2
The sums can be evaluated as geometric series, giving
cos
/
m
x
m
M
ê
ô
ơ
ằ
ẳ
Ô
Ư
Ơ
Ơ
Ơ
Ơ
ả
à
à
à
à
à
Ê
1
2
1
2
J
1
4
2
2
sin( / )
sin( / )
,
M
x
x
J
J
90
75
60
45
30
15
0
15
30
45
60
75
90
24536
Frequency (kHz)
Beam Tilt Angle (deg)
84
86
88
90
92
94
96
98
100
Speaker SPL (dB)
FIGURE 4.13 The angle for peak intensity when 90 phase steps are used with KSN1005A
speakers as a function of frequency. Solid lines: row spacing d; dots: row spacing
d /2
.
Also shown is the SPL versus frequency for these speakers (dashed line).
3588_C004.indd 65 11/20/07 4:57:37 PM
â 2008 by Taylor & Francis Group, LLC
66 Atmospheric Acoustic Remote Sensing
Aa
M
N
x
x
(, ) (, )
sin( / )
sin( / )
sin( / )
QF QF
J
J
J
1
2
2
2
2
yy
y
sin( / )
.
J 2
(4.5)
Aside from the main peaks at JJ PP
xy
ooz02,, ,, there are M−1 nulls at
M
M
x
2
21JPP Po o z o ,,,( )
for any particular K
y
and therefore subsidiary peaks at the M−2 intermediate
positions
J
PP P
x
MM
M
M
yo o z o
35 23
,,,
()
. (4.6)
There are therefore side lobes having relative intensities of
I
IMm MN
mn
0
1
212
1
ª
«
¬
º
»
¼
sin(( ) / ) sin(P (()/)
,
,
212
12
2
nN
m
ª
«
¬
º
»
¼
§
©
¨
¨
¨
·
¹
¸
¸
¸
P
,, , , , , ,z zMn N212 2
(4.7)
compared to the main lobe, plus the fall off with increasing angle due to the indi-
vidual speaker response a(RG. The width of the main lobe to the rst null is
$Q
P
y
2
Mkd
. (4.8)
Figures 4.14 and 4.15 show beam patterns for
kd = 5. The second “main” lobe
problem is very evident in Figure 4.15.
4.2.4 ANTENNA SHADING
The beam patterns derived above for phased arrays are multiplied by the individual
speaker response a(RG as shown, for example, by (4.5). For a square array, the basic
sin( / )
sin( / )
M
x
x
2
2
J
J
dependence is really just the square aperture version of the circular antenna diffrac-
tion dependence discussed earlier in this chapter for dish antennas. Using the array
symbols, this would be
22
12
1
JM kd
kd
(( / ) sin )
sin(( / ) sin )
,
Q
Q
3588_C004.indd 66 11/20/07 4:57:46 PM
© 2008 by Taylor & Francis Group, LLC
Sound Transmission and Reception 67
which closely resembles the square array beam shape. The array pattern can there-
fore be thought of as being due to the output of an innite array of speakers limited
by a square hole with a resulting diffraction pattern.
Now if a square aperture were radiated by sound which had intensity reduced
near the edges of the hole, then the diffraction effect would also be reduced. This
leads to the idea of antenna “shading” in which the gain of speakers is reduced
toward the outside of the array. Then
30
25
20
15
dB
10
5
0
10
10
20
30
0
0
–10
–10
FIGURE 4.15 (See color insert following page 10). The beam pattern from an 8 × 8 square
array with an applied phase increment of π/2 per speaker and with kd = 5.
–20
–20
–10
–10
0
0
10
10
20
20
0
10
20
30
dB
FIGURE 4.14 (See color insert following page 10). The beam pattern from an 8 × 8 square
array without an applied phase gradient and with kd = 5.
3588_C004.indd 67 11/20/07 4:57:48 PM
© 2008 by Taylor & Francis Group, LLC
68 Atmospheric Acoustic Remote Sensing
AaNwm
mx
(,) (,) cosQQ J02 0
1
2
Đ
â
ă
ă
ã
ạ
á
á
Ô
Ư
Ơ
Ơ
Ơ
Ơ
ả
à
àà
à
à
à
Ê
m
M
1
2/
.
One common weighting is
w
m
M
m
Ô
Ư
Ơ
Ơ
Ơ
ả
à
à
à
à
cos
[/]
.
P 12
(4.9)
The response A can be found using Fourier transform methods, but also using
the method leading to (4.5). This gives
wm
mx
m
M
cos
/
ê
ô
ơ
ằ
ẳ
Ô
Ư
Ơ
Ơ
Ơ
Ơ
ả
à
à
à
à
à
1
2
1
J
22
1
8
2
12
1
8
Ê
sin( / )( / )
sin( / )( / )
siMM
M
x
x
JP
JP
nn( / )( / )
sin( / )( / )
cos( / )
MM
M
M
x
x
x
2
12
2
JP
JP
J
ccos( / )sin( / )
sin( / / )sin( /
JP
JP J
x
xx
M
M
22
422 2PP/)
.
2M
(4.10)
Figures 4.16 and 4.17 show the shaded responses corresponding to the unshaded
responses shown in Figures 4.14 and 4.15. Minor side lobes are strongly suppressed,
but the shading does not remove the multiple main beams.
There are two penalties associated with this improved side lobe structure. The
rst is that less power is transmitted, since the gain of speakers is reduced. Put-
ting K
x
= 0 in (4.10) shows that the peak
intensity value is about (/ )16
422
P MN
compared with MN
22
for the unshaded
case. This is about 8 dB loss in peak
intensity for M = N = 8. The second pen-
alty is that the main lobe is wider. The
rst null now occurs at QPy 3/Mkd
instead of at QPy 2/Mkd . However,
as shown in Figure 4.18, the shaded
array has nearly 80% of its power in the
main beam, compared to only 50% for
the unshaded array.
Shading can be accomplished via
1. a passive attenuator at each
speaker,
2. feeding signals of differing ampli-
tude individually to each speaker,
or
3. applying incremental phase shifts
of P / M and P / M in the x-
direction and P / N and P / N
in the y-direction.
25
20
15
10
5
0
4
4
2
2
0
0
2
2
4
4
FIGURE 4.16 (See color insert following
page 10). The beam pattern from an 8 ì 8
square array without an applied phase gra-
dient and with kd = 5 and a cosine-shaded
speaker gain pattern.
3588_C004.indd 68 11/20/07 4:58:00 PM
â 2008 by Taylor & Francis Group, LLC
Sound Transmission and Reception 69
Both the second and third methods require separate signals to each speaker.
4.2.5 RECEIVE PHASING
Beam steering for reception of an echo signal with a phased array requires a pro-
gressive phase shift in the opposite sense to that used for transmission. So, for
example, increasing the phase to each speaker in the +x-direction by π/2 during
transmission requires delaying successively in the +x-direction by π/2, as shown in
Figure 4.19.
25
20
20
15
10
10
dB
5
0
0
2
0
–2
–10
FIGURE 4.17 (See color insert following page 10). The beam pattern from an 8 × 8 square
array with an applied phase increment of /2 per speaker and with kd = 5 and a cosine-shaded
speaker gain pattern.
!
FIGURE 4.18 The normalized cumulative intensity outward from the vertical for an 8 × 8
square array with no applied phase increment, and with kd = 5. Solid line: unshaded; dashed
line: cosine shaded; triangle: position of null for unshaded array; circle: position of null for
shaded array.
3588_C004.indd 69 11/20/07 4:58:02 PM
© 2008 by Taylor & Francis Group, LLC
70 Atmospheric Acoustic Remote Sensing
4.2.6 REFLECTORS
Phased array SODARs using weather-sensitive speakers can have the speaker array
mounted facing horizontally and use a reector to aim the beam vertically.
If the array is tilted downward from the horizontal by angle B then the reector
must be tilted from vertical by angle QQ P
rs
//24 so that the un-phased main
lobe is directed vertically. The length Z of the reector must be sufciently large so
that the phased beam is fully reected. From the geometry in Figure 4.20,
Z
Md D
[ tan( ) tan( )] tan( )
[cos(
12QQ Q Q
Q
r
r
s
$$
QQQQQ
s
s
) sin( )tan( )]
.
r
$
For example, with R
s
= 0, Md = 0.68 m, D = 1.5 m, and ∆R = 20°, Z = 1.42 m.
Strictly speaking, the reector is in the near-eld of the array and a little more length
FIGURE 4.19 Delays required for beam steering on receive.
r
s
D
Md
Z
FIGURE 4.20 7KHJHRPHWU\RIDSKDVHGDUUD\DQGUHÁHFWRU
3588_C004.indd 70 11/20/07 4:58:05 PM
© 2008 by Taylor & Francis Group, LLC
Sound Transmission and Reception 71
should be allowed. Any reected sound must also clear the array and weather shield-
ing around the array: this determines the length D.
The reector must be a good acoustic reector but not be resonant or be noisy
when rain splashes on it. Reectors are generally constructed from marine plywood
or from berglass and, since sound might penetrate the reector and cause problems
with spurious xed echoes, the reector will normally be backed with acoustic paint,
lead, and/or acoustic foam.
4.3 MONOSTATIC AND BISTATIC SODAR SYSTEMS
All commercial SODARs are monostatic, which means that the transmitter
antenna and the receiver antenna are in the same position. This arrangement has
advantages of compactness, simple geometry and interpretation, simpler deploy-
ment, and generally lower cost due to use of the same transducers as speakers and
microphones.
Bistatic congurations use spatially separated transmitters and receivers. This
is common for the microwave transmitter and receiver on a radio acoustic sounding
system. The general geometry is shown in Figure 4.21.
The scattering geometry is determined by the baseline distance D, the transmit-
ter and receiver tilt angles R
T
and R
R
, and the orientation of the transmit plane K
T
and
of the receive plane K
R
with respect to the baseline. From the geometry shown in
Figure 4.21,
z
D
r
z
r
z
tan cos tan cos
,
cos
,
cos
QF QF
Q
Q
RR
T
R
TT
T
RR
R
R
,
cos cos sin cos
cos
BQ QF
Q
¤
¦
¥
¥
¥
¥
´
¶
µ
µ
µ
D
z
T
1
T
µµ
.
(4.11)
The scattering angle is C. For the monostatic case, R
T
= R
R
and D=0, giving cos
C = –1 or C= π.
One of the difculties with a bistatic system is aiming the beams so that adequate
intersection occurs. Generally it is simpler to have the transmitter beam vertical and
several receiver beams tilted. Then BPQ
R
and zD /tanQ
R
.
For monostatic SODARs, the vertical proling is achieved by taking the time
record of the echo as being a distance record. For bistatic SODARs, the range is set
by the intersection of the transmitted and received main lobes. So it is necessary to
scan the tilted receiver beam using phasing. This is best done by mechanically tilt-
ing the receiver so that its un-phased beam points to the middle of the height range
3588_C004.indd 71 11/20/07 4:58:09 PM
© 2008 by Taylor & Francis Group, LLC
72 Atmospheric Acoustic Remote Sensing
of interest. Then the effect of secondary main lobes appearing is minimized. This
geometry is shown in Figure 4.22.
In this case
Q
Q
R
T
tan
tan
tan
11
0
z
Dz
z
D
(4.12)
for the 2D situation shown. Using the same parameters as in Figures 14–17, the
product of the transmitted and received intensities gives a measure of system
sensitivity. This quantity is plotted in Color Figure 4.23 for the unshaded case,
and in Color Figure 4.24 for the shaded case, with z
0
= 50 and 100 m. There are
two very signicant features of these plots. The rst is that the side lobes in the
unshaded case will give echoes from a wide range of locations, both horizontally
and vertically. Since there is no guarantee of any degree of homogeneity in the
turbulence intensity which determines the echo strength, this can mean that the
echoes come from an unexpected height or even from an unexpected angle (which
is important for wind measurements, as will be seen later). The second feature
to note is that, even in the shaded case, the height resolution is very coarse as
z
0
increases. The net result is that, for bistatic systems to work effectively, it is
essential that the beams be well dened and have minimal side lobes and also
that the systems be pulsed rather than continuous. For example, a bistatic system
having a pulse which is 10-m long would have the positional sensitivity shown in
Figure 4.25.
z
D
r
T
r
R
T
R
R
T
T
R
FIGURE 4.21 The geometry of bistatic systems.
3588_C004.indd 72 11/20/07 4:58:12 PM
© 2008 by Taylor & Francis Group, LLC
Sound Transmission and Reception 73
4.4 DOPPLER SHIFT FROM MONOSTATIC
AND BISTATIC SODARS
In the presence of air ow, the frequency of the echo signal changes (i.e., is Dop-
pler shifted), allowing the wind speed to be estimated. This is the most used fea-
ture of SODARs. There are many textbook derivations of Doppler shift, but it is
very nearly impossible to nd a general treatment of reection from a target moving
with the medium. Treatments which have appeared in journal papers are generally
incorrect. A treatment for the bistatic case (Georges and Clifford, 1972) was then
extended with examples for the monostatic situation (Georges and Clifford, 1974).
Unfortunately their formula for Doppler shift does not reduce to the simple 1D text-
book case when the transmitter, receiver, and wind are in line. This also means that
numerical simulations based on the Georges and Clifford formulae by Phillips et
al. (1977) and Schomburg and Englich (1998) are suspect. More recently, Ostashev
(1997) has treated the 2D (x, z) case and has found that the error in wind speed is
$VVc(/)sin
2
Q . This is in contrast to Georges and Clifford, who nd that there
is no refractive correction (to second order) when the wind is entirely horizontal.
Given the confusion in these various treatments, and the need for a 3D correction
formula, we now give a basic derivation of “beam drift” effects.
We will explain what happens through a simple description of the time taken for
two successive wavefronts to travel from the transmitter via reection off turbulence
to the receiver. The time difference between the arrival times of the two wavefronts
at the receiver gives the period of the Doppler-shifted echo signal. Figure 4.26 shows
this concept with a tilted transmitter and a vertical receiver. Although the transmit-
ted beam is aimed to intersect directly above the receiver, it is blown downwind
during its upward journey. Similarly, it is not the reected sound aimed directly at
the receiver which reaches it, but rather sound which is initially directed somewhat
z
Transmitter
Receiver
D
r
R
z
0
r
T
θ
T
θ
R
FIGURE 4.22 7KHJHRPHWU\IRUDVLPSOLÀHGELVWDWLFFRQÀJXUDWLRQ
3588_C004.indd 73 11/20/07 4:58:14 PM
© 2008 by Taylor & Francis Group, LLC
74 Atmospheric Acoustic Remote Sensing
200
180
160
140
120
100
80
60
40
20
0
–100 –80 –60 –40 –20 20 40 60 80 1000
x(m)
Height (m)
70
dB
60
50
40
30
20
10
70
dB
60
50
40
30
20
10
200
180
160
140
120
100
80
60
40
20
0
–100 –80 –60 –40 –20 20 40 60 80 1000
x(m)
Height (m)
FIGURE 4.23 (See color insert following page 10). Unshaded bistatic system sensitivity for
baseline D = 50 m, and with preset intersection height z
0
= 50 m and 100 m.
3588_C004.indd 74 11/20/07 4:58:17 PM
© 2008 by Taylor & Francis Group, LLC
Sound Transmission and Reception 75
dB
60
50
40
30
20
10
0
200
180
160
140
120
100
80
60
40
20
0
–100 –80 –60 –40 –20 20 40 60 80 1000
x(m)
Height (m)
dB
60
50
40
30
20
10
0
200
180
160
140
120
100
80
60
40
20
0
–100 –80 –60 –40 –20 20 40 60 80 1000
x(m)
Height (m)
FIGURE 4.24 (See color insert following page 10). Shaded bistatic system sensitivity for
baseline D = 50 m, and with preset intersection height z
0
= 50 m and 100 m.
3588_C004.indd 75 11/20/07 4:58:19 PM
© 2008 by Taylor & Francis Group, LLC
76 Atmospheric Acoustic Remote Sensing
upstream of the receiver. The net result is that the “round trip” distance and time are
different from the no-wind case. By the time a second wavefront leaves the transmit-
ter, the turbulent patch will have moved further downstream and so the path to it is
different from that of the rst wavefront. Because of these changing paths, the time
between arrivals of the two wavefronts at the receiver is in general different from the
time between departures of the wavefronts from the transmitter. This means that the
period and the frequency of the detected signal are different from the transmitted
signal.
To illustrate this, consider the tilted beam in a monostatic SODAR. The situation
is shown in Figure 4.27.
Sound is transmitted upward at an angle R to the vertical, aimed toward a turbu-
lent patch. This sound takes a time t
s
to reach height z. During this time, the patch
of turbulence has moved horizontally a distance Vt
s
as shown, where V is the wind
speed. When the sound meets the turbulence at height z, but distance Vt
s
downstream
from the original position of the turbulence, sound is scattered in all directions. Some
of this scattered sound, initially aimed downward but upstream of the SODAR, will
reach the SODAR after a further time t
r
, as shown in the left-hand plot of Figure 4.27
(c is the sound speed, assumed to be uniform in this example).
Sound emitted one period T later is also initially aimed at the turbulent patch,
which at this time is a distance VT downstream from the original position. The
sound paths are shown in the right-hand plot of Figure 4.27, in which the times for
upward and downward propagation are slightly different from the left-hand diagram,
FIGURE 4.25 Positional sensitivity of a gated bistatic shaded phased array system having
a pulse length of 10 m.
3588_C004.indd 76 11/20/07 4:58:21 PM
© 2008 by Taylor & Francis Group, LLC
dB
60
50
40
30
20
10
0
–100 –80 –60 –40 –20 20 40 60 80 1000
x (m)
200
180
160
140
120
100
80
60
40
20
0
Height (m)
Sound Transmission and Reception 77
as indicated by the primes on the times. The geometry is a little clearer if the tri-
angles are redrawn as in Figure 4.28.
In these gures, the horizontal movement due to the wind has been grossly exag-
gerated, since V << c. In this case, sin %R≈ %R and cos %R≈ 1, so
ct ct V t t ct V t t
rs rs s rs
$ $ycos ( )sin( ) ( )QQQ ssin $Q
giving
ct
V
c
ct
V
c
rs
11
¤
¦
¥
¥
¥
¥
´
¶
µ
µ
µ
µ
y
¤
¦
¥
¥
¥
¥
´
¶
sin sinQQ
µµ
µ
µ
µ
or
Receiver
Transmitter
Direct path
of transmit
signal
Direct path
of reflected
signal
Actual path
of transmit
signal
Actual path
of transmit
signal
Horizontal wind
FIGURE 4.26 The basic concept of extra path when there is a wind.
ct
s
ct
r
Vt
r
Vt
s
ztan
z
ct
*
s
ct
*
r
Vt
*
s
ztan + VT
Vt
*
r
e
e
e
FIGURE 4.27 Sound path in the simple monostatic, tilted beam case, at two times sepa-
rated by one period of the transmitted sound.
3588_C004.indd 77 11/20/07 4:58:26 PM
© 2008 by Taylor & Francis Group, LLC
78 Atmospheric Acoustic Remote Sensing
ct ct
V
c
rs
y
Ô
Ư
Ơ
Ơ
Ơ
Ơ
ả
à
à
à
à
12 sin.Q
Similarly
ct ct
V
c
rs
** *
sin ,y
Ô
Ư
Ơ
Ơ
Ơ
Ơ
ả
à
à
à
à
12 Q
but
ct
z
s
cosQ
and
ct
z
s
*
*
cos
.
Q
Also
tan
tan
tan ,
*
Q
Q
Q
zVT
z
VT
z
so
1
1
2
12
cos
tan
*
/
Q
Q
Ô
Ư
Ơ
Ơ
Ơ
Ơ
ả
à
à
à
à
Đ
â
ă
ă
ă
ã
ạ
á
á
á
VT
z
yy
Ô
Ư
Ơ
Ơ
Ơ
Ơ
ả
à
à
à
à
à
Đ
1
1
2
22
2
2
cos
tan cos
Q
VT
z
VT
z
ââ
ă
ă
ă
ã
ạ
á
á
á
.
Finally, the time between round trips for two parts of the signal transmitted
one cycle apart is the period T
*
of the echo signal at the receiver
Ttt tt t
V
c
*** * *
()() sin
Ô
Ư
Ơ
Ơ
Ơ
Ơ
ả
à
rs rs s
21 Q
àà
à
à
Ô
Ư
Ơ
Ơ
Ơ
Ơ
ả
à
à
à
à
y
Ô
21 2 2
2
2
t
V
c
V
c
V
c
s
sin sinQQ
ƯƯ
Ơ
Ơ
Ơ
Ơ
ả
à
à
à
à
à
T.
The shift in frequency is
$f
f
T
T
T
V
c
V
c
T
Ô
Ư
Ơ
Ơ
Ơ
Ơ
ả
à
à
à
à
11
22
2
2*
sin .Q (4.13)
The rst term on the right, 2(V/c) sin R, is the usual Doppler shift term used to
calculate the wind speed component V from the measured shift %f in the position of
the peak in the frequency spectrum, given the known beam tilt angle R. For typical
SODAR systems, R = 15 to 25, so the last term on the right is never greater than
about a third of the magnitude of the rst term on the right.
3588_C004.indd 78 11/20/07 4:58:35 PM
â 2008 by Taylor & Francis Group, LLC
Sound Transmission and Reception 79
For example, with R = 18°, and V = 14ms
–1
, $ff/.
T
0 0216 and the esti-
mated velocity would be
ˆ
(/ sin)( / ) Vc ff
212
1
Q$
T
ms
, a 20% error. With
V = −14 m s
–1
, a −20% error occurs. Note that this beam drift effect gives a bias in
derived winds at higher wind speeds, causing the estimated wind speed to be lower
if the wind is away from the SODAR and to be higher if the wind is towards the
SODAR. The direction of reception also changes a little due to the second-order
V
2
term. For example, if R = 18°, u = 2 m s
–1
, and v = 10ms
–1
, V = 10.2ms
–1
, wind
direction Z = 11° and ∆Z = 4°.
If a 3-beam monostatic SODAR is aligned with its beams in the u and v directions
HQQQQ
H
1
22 2
2
ˆ
sin
ˆ
cos sin cos ,
ˆ
uw uw
uvw
c
vvw vw
uvw
c
ww
sin
ˆ
cos sin cos ,
ˆ
QQQQ
H
22 2
3
uvw
c
22 2
,
from which
ˆ
cos
sin
,
ˆ
cos
sin
,
ˆ
.
u
v
w
HH Q
Q
HH Q
Q
H
13
23
3
The set of equations can be solved for u, v, and w, but a simpler approximate solution
is found by putting uvwuvw
22 222 2
ˆˆˆ
in the correction term. Then
ct
r
V(t
s
+ t
s
)
ztan
ct
*
s
ct
s
zz
ct
*
r
*
*
Vt
*
s
Vt
*
r
z
tan +
VT
e
e
e6e
6e
e
e
6e
FIGURE 4.28 Redrawn geometry from Figure 4.27.
3588_C004.indd 79 11/20/07 4:58:42 PM
© 2008 by Taylor & Francis Group, LLC