GIS for Coastal Zone Management - Chapter 17 doc
Bạn đang xem bản rút gọn của tài liệu. Xem và tải ngay bản đầy đủ của tài liệu tại đây (295.14 KB, 10 trang )
CHAPTER SEVENTEEN
GIS for Assessing Land-Based Activities
that Pollute Coastal Environments
J.I. Euán-Avila, M.A. Liceaga-Correa, and H. Rodríguez-Sánchez
17.1 INTRODUCTION
According to Heathcote (1998), the development of workable management options
(structural and non-structural actions) in a watershed requires the identification of
all point and non-point sources of pollution. Discharge of effluents from
industrial, urban and sewage treatment plants where a pipe or diffuser outfalls into
a water body are called “point sources” of contamination. Another type of source,
called a “non-point source” (NPS), is described as the diffuse drainage of
rainwater from urban, industrial and agricultural lands that can introduce nutrients,
pesticides, and metals to water bodies. Non-point sources are some of the more
serious forms of pollution and the effects are often less obvious than those of point
sources (Abel, 1998). Clapman
et al. (1998) indicated that agricultural impacts on
ground and surface water quality are more significant than other land use impacts
because of their large aerial extent compared to other human land uses. Lack of
information related to agricultural practices may lead to overuse of fertilizers and
herbicides, and deforestation with serious impacts on soil erosion and water
quality.
The Yucatan Peninsula is blessed with large freshwater reserves, bays and
coastal lagoons and an exclusive economic zone of 200,000 km
2
. However, the
maintenance of the water quality seems to be an enormous challenge for the State
and other interested groups considering the unfulfilled basic needs of a large part
of the population, rates of population growth, immigration, and lack of an
integrated approach to the management of the resources and coastal areas. In June
1996 a massive kill of 20,000 fish of the species
Arius felis was reported in the
Bay of Chetumal, State of Quintana Roo (SEMARNAP, 1996). Studies reported
harm to their organs and accumulation of PCBs, organochlorine insecticides and
polyaromatic hydrocarbon (Noreña-Barroso, 1998). Concerns exist that increasing
loss of water quality may have adverse effects on mangroves and coral reefs in an
area where the second most important barrier reef, the Mesoamerican reef, and the
sanctuary of the manatee
Trichechus manatus are drawing international attention.
© 2005 by CRC Press LLC
Agricultural activities introduce diffuse pollution to watercourses, aquifers,
lagoons and estuaries in the form of sediments, nutrients, pesticides, viruses, salt
and other toxins which affect aquatic organisms. Pollution cause-and-effect
relationships are complex and the need to find practical tools to generate useful
information for decision-making may be addressed with models that introduce
expert knowledge. Within this framework, this exercise attempts to rank the
agricultural lands according to several factors that may contribute to water
contamination on the Mexican side of the Rio Hondo watershed near the Othon P.
Blanco municipality border with Belize.
17.2 GEOGRAPHICAL SETTING
17.2.1 The Yucatan Peninsula
The Yucatan Peninsula in México has mainly sub-surficial water dynamics driven
by its geological and topographic nature: there are few rivers or lakes in the area.
Exceptions are the Candelaria and Champotón rivers in the zone of the Términos
Lagoon in Campeche, and the Hondo River in the State of Quintana Roo near the
border with Belize. Yucatán has no rivers; however underground discharge in the
coastal zone has been estimated at 9.7 million m
3
per year (CNA, 1998). The main
features of the coastal areas are bays and lagoons, which are distributed throughout
the three states: Términos Lagoon in Campeche; Celestún, Dzilam and Rio
Lagartos in Yucatán; and Chetumal, Ascensión and Spiritu Santo bays in Quintana
Roo. Surrounding these water bodies, other wetlands cover an area of
approximately 8000 km², thus forming an important part of the coastal ecosystem
(CNA-UNU/RIAMAS, 2000).
Due to its geographical location between the Caribbean Sea and the Gulf of
Mexico, the region is influenced by severe hydrometeorological phenomena. The
climate of the region is semi-arid in the coastal zone of the north part of the
Peninsula and warm with variation of dry to humid in the rest of the peninsula.
The mean annual temperature is 26ºC. There are two main seasons in the regional
climate: the “rainy season,” including extreme phenomena such as hurricanes and
tropical storms from May to October; and the "winds of the north” season, from
November to April. The region receives abundant but uneven rainfall with mean
annual precipitation ranging from 1600 mm in the southeast to 500 mm in the
north. Mean annual evaporation is around 1.78 mm (CNA-NU/RIAMAS, 2000).
Human activities in the Yucatán Peninsula are related to agriculture,
livestock production, tourism, fishing, oil production, and transportation, and
recently to a large number of
maquiladoras. Fertilizers, pesticides and metal
residues have been found in coastal waters and the aquifer. These negative effects
on the environment have been reported in several locations (Pacheco and Cabrera,
1996, Benitez and Bárcenas, 1996, Ortiz and Sáenz, 1997, Noreña-Barroso
et al.,
1998, CAN, 1998, Herrera-Silveira
et al., 1998). Coastal resources in the Yucatan
Peninsula provide increasing opportunities for economic development in a large
number of traditional fishing communities. Lack of awareness of the deleterious
effects of land-based activities on water quality may lead to a reduction in
© 2005 by CRC Press LLC
biodiversity and esthetical quality of the landscape, thus putting at risk the
continuity of fishing, tourism, and recreational activities.
17.2.2 The Municipality of Othon P. Blanco
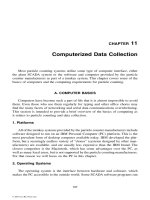
Othon P. Blanco is a municipality located in the State of Quintana Roo in the
southeast part of the Yucatan Peninsula (Figure 17.1). It has an area of 619,799
hectares, 161,226 (26%) of which are occupied by agricultural use, 129,396
(20.9%) by natural and cultivated grass, 325,155 (52.5%) by forest and 4,021
(0.6%) by other uses.
Figure 17.1 Study area in the Yucatan peninsula, Mexico. Municipality of Othon P. Blanco in the state
of Quintana Roo. Main hydrological features are the Hondo River and the Bay of Chetumal.
The population in 1990 was 172,563 with 53.5% less than 19 years of age. The
municipality has 437 rural and urban centers with 45% of the population living in
436 towns with less than 5,000 inhabitants. Close to 50% of the population are
immigrants. Of the population 15 years or older, 17.4% completed elementary
school (INEGI, 1991a). Main crops by cultivated area include: corn (19,196
hectares), sugar cane (16,000), chili (5,151), and beans (1, 391) (INEGI, 1993).
Production in 1991 was estimated at 12,000 tonnes for corn, 785,000 for sugar
© 2005 by CRC Press LLC
cane, 26,000 for chili, and 84 for beans. Other crops cultivated in the area are
orange, coconut, and banana (INEGI, 1994).
Some of these agricultural lands can be found in the watershed of Chetumal
Bay. The Bay is 67 km in length and 20 km wide, and receives freshwater from
the Hondo River and Guerrero Lagoon, causing it to exhibit estuarine
characteristics. Man-made channels and other tributaries close to agricultural lands
are linked to the Hondo River. The most dominant soil types, Rendzinas and
Litosoles, cover 70% of the Peninsula and 85% the study area (INEGI, 1985).
17.3 MODEL AND DATA LAYERS
17.3.1 Model
The selected model attempts to rank agricultural lands according to the potential
menace they represent to water quality. The model is a multi-criteria evaluation
method provided by the IDRISI software, which combines several layers as the
criteria to form an index of evaluation (Eastman, 1999). Relevant factors in the
process of NPS pollution assessment (being those for which an estimate was
available) were: amount of agrochemical inputs, slope, proximity to surface water,
and distance to aquifer. Given the natural continuity in factors, ratio layers and a
weighted linear combination of them can provide an index for ranking. Their
mathematical representation is as follows:
where
s= NPS index, w
i
= weighting factor i, x
i
= factor i, c
j
= constraint j
Factors must be normalized according to the accuracy of our knowledge of
their respective ranges of impact, as well as the ways in which they behave at
different scales. The procedure used, which is based on fuzzy sets, is also provided
by the IDRISI program. Finally, the model allows a weight to be assigned for the
relative contribution of each factor. Criteria called Analytical Hierarchy Process
(AHP), based on a pair-wise comparison of factors along a continuous rating scale,
can derive weighs by calculating the principal eigenvector of the created matrix
(Eastman, 1999).
17.3.2 Data layers
17.3.2.1 Geographic location of agricultural lands
A good estimation of the location of agricultural land is a basic prerequisite for
assessing NPS pollution. A two-band WIFS image with 180 x 180 m spatial
resolution acquired in 1999 was used to estimate the location and extent of the
S = ( 6 w
i
*
x
i
) * 3 c
j
(17.1)
© 2005 by CRC Press LLC
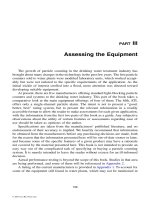
agricultural lands in the Othon P. Blanco municipality (Figure 17.2a). A
supervised classification was conducted to estimate the total cultivated land in the
area. Census data from the AGROS system elaborated by the INEGI provided
crop information for areas called Basic Geo-statistical Area (AGEB in Spanish)
(INEGI, 1996). Each AGEB is a well defined polygonal (vector) area with a link
to a data base (Figure 17.2b). These two layers were used to estimate the location
of cultivated areas by AGEB.
17.3.2.2 Agrochemical practices
The quantification of chemicals used per unit area and frequency of use was
another factor in the analysis. A survey was conducted in September 1999 for the
purpose of estimating the quantities of fertilizer and pesticides used per crop each
year. A total of 97 farmers were interviewed in five agricultural towns: 1) Nicolás
Bravo, 2) Palmar, 3) Pucté, 4) Sergio Butron, and 5) Morocoy. The questionnaire
was divided into three sections to learn about fertilizer, insecticide, and herbicide
practices per crop. Each section focuses on names, dosage, and frequency of
applications of agrochemicals by crop per hectare per year. Substances were
normalized according to thresholds determined through consultation with experts
in the field.
17.3.2.3 Digital elevation model and slope
Slope is a well known factor that favours the movement of the substances on the
terrain surface. Slope and aspect are the main factors that determine velocity and
direction of the overland flow during storms. In areas with long slopes, the
capacity of vegetation to reduce erosion is diminished. Slope was computed from
a DEM of the area using the TNT software (Figure 17.2c). The DEM was
produced by INEGI in a scale of 1: 250,000. Two archives, E1604 and E1607,
were mosaiced to cover the studied area.
17.3.2.4 Proximity to surface water
Distance from agricultural activities to water bodies is also a factor that may
facilitate contaminants reaching water courses, ponds, or estuaries. Proximity
maps were constructed based on water features identified on band 2 of the WIFS
image as well as those features found on topographic maps E16-4-7 at a scale of
1:250,000 produced by INEGI. These two layers were combined to generate a
reference object for computing proximity to surface water (Figure 17.2d).
17.3.2.5 Proximity to groundwater
In karst formations (carbonated rocks) such as the Yucatan Peninsula in Mexico,
precipitation tends to infiltrate rapidly because of the high number of fractures and
solution cavities in the massif. Depth to the aquifer was estimated from a
regression model using 15 well depths provided by the Regional Office of the
Comision Nacional del Agua (CNA) and their corresponding elevation in the DEM
(Figure 17.2e).
© 2005 by CRC Press LLC
17.4 RESULTS
17.4.1 Agricultural lands
Agricultural areas detected from the satellite image were defined based upon the
1991 census. These areas were mainly devoted to growing sugar cane, corn, beans
and
jalapeño chili. The statistical data from AGEBS was proportionally assigned
to current agricultural lands for a better spatial location of the cultivated areas
(Figure 17.2b). As an example, Figure 17.2b shows, by AGEBS, the percentage of
the total cultivated surface with sugar cane in 1991. The percentage for corn, beans
and
jalapeño chili was related to the area in a similar fashion.
17.4.2 Agricultural practices
Data from the five sampled regions indicated that farmers are working those lands
for 11 years on the average (the interval is from 1 to 30 years with a standard
deviation of 7 years, out of 93 valid cases). The mean value of the farmers’ age
was 42 (the interval was from 18 to 74, and the standard deviation was 12). The
number of years each farmer had spent at school had a mean value of 4 (from 0
and 14, with a standard deviation of 3). These farmers reported applying
agrochemicals to their primary crops (sugar cane, corn,
jalapeño chili, and beans)
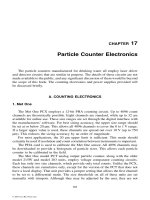
during cultivation. Sugar cane is one of the main crops in the area and it received a
large number of agrochemicals (more than 25 commercial products were
identified). Given the large number of products, only those with a high frequency
of use in each category (fertilizers, insecticides and herbicides) were selected for
analysis. From these selected products, active substances were estimated giving
the total applied quantity per hectare per year (an example is provided in table 17.1
for sugar cane). A layer with total phosphorous used in one year in kg/ha was
calculated from four top selected crops with values of 70.25 kg/ha for sugar cane,
18.8 kg/ha corn, 40.19 kg/ha
jalapeño chili, and 15.21 kg/ha beans each year.
Similar computations were used to estimate nitrogen in the fertilizer category. In
the case of herbicides substances such as 2,4D, paraquat, and ametryne were
estimated. Finally, estimated substances in the insecticides category were
metamidophos, chloropiriphos, and monocrotophos.
© 2005 by CRC Press LLC
Figure 17.2 (a) WIFS image band 2, (b) cultivated areas for sugar cane and AGEBs, (c) slope from
DEM, (d) proximity to surface water, (e) distance to aquifer, and (f) rank of nutrients (P and N).
17.4.3 Slope
Figure 17.2c shows the magnitude in percentage of slopes calculated from the
DEM. Slopes in the area range from 0% to 48% with a mean value of 1.3% and a
standard deviation of 2.5%. Elevation in the area ranges from 0 to 300 m. Slopes
© 2005 by CRC Press LLC
on agricultural lands had a mean value of 1.84% and a standard deviation of
2.98%. These data were standardized from 2 to 10% increasing.
Table 17.1 Agrochemical substances used in sugar cane cultivation.
Substance
% of
users
Mean annual
number of
applications
and std. dev.
Mean
quantity and
std. dev. per
application Unit
Total amount of
active
substance
PK al 17%
PK al 15%
N al 17 %
N al 15 %
N al 46 %
44/60
14/60
44/60
14/60
34/60
1.40 - 0.92
1.30 - 0.61
1.40 - 0.92
1.30 - 0.61
1.20 - 0.6
317 - 089
332 - 130
317 - 089
332 - 130
153 - 071
Kg/ha
Kg/ha
Kg/ha
Kg/ha
Kg/ha
55.25
15.00
70.25
55.25
15.00
47.84
118.1
Ametryne
39.2%
Ametryne
25%
14/60
24/60
1.10 - 0.28
1.50 - 0.77
2.8 - 0.86
3.9 - 1.2
l/ha
l/ha
0.29
0.387
0.677
2,4-D
49.4% 31/60 1.20 - 0.66 2.3 - 1.1 l/ha 0.73
Monocrotop-
hos 44.24%
17/60 1.90 - 1.00 1.9 - 2.6 l/ha 0.45
17.4.4 Proximity to surface and ground water
Proximity to surface water is shown in Figure 17.2d. Features included in the
surface water category were rivers, ponds and channels. Results indicated a mean
distance of 3.6 km, standard deviation of 3.2 km and mode of 0.9 km. The largest
distance was 17 km. These data were standardized from .5 to 5 km decreasing.
Finally, the result of the regression model for distance to the aquifer is shown in
Figure 17.2e. Regressed elevation and depth measurements resulted in the
following equation: aquifer depth = 0.0029h
2
+0.2891h + 3.8161 (h = elevation in
the DEM), r
2
= 0.97 for n = 15. Depths ranged from 3.8 m to 211 m with a mean
value of 42.5 m, standard deviation of 37.9 m and mode 3 m. Data was
standardized from 1 to 15 decreasing.
17.4.5 Model results
Distribution of the S index for fertilizers, herbicides, and insecticides was
calculated as a potential threat to water quality. An example, based upon nutrient
load, is illustrated in Figure 17.2f. Parameters to compute the S index for
standardized factors were selected from the observed data range of factors in the
area. Equal weights were assigned to factors. With these parameters, the NPS
index for fertilizers (phosphorous and nitrogen) had values from 1 to 204, a mean
© 2005 by CRC Press LLC
value of 82 and a standard deviation of 44. Higher values of the index were found
in the areas of Pucté and Palmar where sugar cane is the main crop. In the vicinity
of Morocoy and Sergio Butron medium values were recorded, and the smallest
values could be found in the area of Nicolas Bravo. The NPS index for herbicides
(2-4D, paraquat, and ametrine) had values from 1 to 155, with a mean of 50 and a
standard deviation of 32. Large tracts of Pucté and Palmar displayed higher
values, while Sergio Butron displayed medium values and Morocoy and Nicolas
Bravo the smallest. Finally, for insecticides (monocrotofos, chloropyrifos, and
metamidofos) the NPS index ranged from 1 to 124, with a mean value of 40 and a
standard deviation of 23. In this case, large areas of Pucté and Palmar displayed
higher values, Sergio Butron and Morocoy displayed medium values, and Nicolas
Bravo showed the smallest. The analysis suggest that Pucte and Palmar are major
potential areas of threat to water quality as a result of nutrient, herbicide and
insecticide inputs, while the importance of Morocoy, Sergio Butron and Nicolas
Bravo in this respect changes according to the type of agrochemical under
analysis.
17.5 CONCLUSIONS
An exercise in the use of GIS tools was conducted to characterize agricultural NPS
pollution in the Yucatan Peninsula. Standard GIS processes and digital data from
satellite, maps, and other digital products available in Mexico allowed ranking of
agricultural lands in the Hondo river watershed according to the threat posed to
water quality by the use of agrochemicals on these lands. Standard procedures
available in the TNTmaps and IDRISI software packages were used to feed and
run a multi-criteria model for decision-making. Three indices suggested that two
out of the five agricultural study areas, where sugar cane is the main crop, have a
large potential and non-homogeneous threat to water quality as indicated by the
NPS index. The potential contribution of the other agricultural areas varies when
examined by category (nutrients, herbicides, and insecticides). Increasing water
contamination and limited resources in developing countries can be better
allocated when knowledge of the co-occurrence of practices and terrain features is
integrated into models for the assessment of the potential effects of human
activities on water resources. As new knowledge is integrated these scenarios can
be fine-tuned with more precise data and expert knowledge, providing improved
spatial information to assist decision makers in the selection of appropriated
management actions in the arena of NPS pollution.
17.6 ACKNOWLEDGMENTS
We thank the following people for their many contributions: J. Acosta, H.
Hernández, G. Mexicano, Ricardo Rodríguez, Dr. Jorge Alvarado, P. I. Caballero,
and students from the Centro de Estudios Tecnológicos del Mar (CETMAR). This
research has been supported in part by Secretaría del Medio Ambiente Recursos
Naturales y Pesca (SEMARNAP).
© 2005 by CRC Press LLC
17.7 REFERENCES
Abel, P.D., 1998,
Water Pollution Biology. (London: Taylor & Francis).
Benites, J.A. and Bárcenas, C., 1996, Sistemas fluvio-lagunares de la Laguana de
Términos: hábitats críticos susceptibles a los efectos adversos de los plaguicidas.
In
Golfo de México, contaminación e impacto ambiental: diagnóstico y
tendencias
, edited by Botello, A.V., Rojas Galaviz, J.L., Benítes, J.A. and Zárate
Lomeli, D.
EPOMEX Serie Científica No. 5.
CNA, 1998,
Diagnóstico para la región XII, Península de Yucatán, edited by
Gerencia Regional de la Península de Yucatán de la Comisión Nacional del
Agua.
CNA-UNU/RIAMAS, 2000,
El Proceso Final para el Cuidado y Manejo
Responsable del Recurso Agua en la Península de Yucatán
. Reporte final,
Comisión Nacional del Agua, pp. 2–6.
Eastman, J.R., 1999,
Guide to GIS and Image Processing, Vol. 2. (Massachusetts:
Clark Labs).
Heathcote, I.W., 1998,
Integrated Watershed Management: Principles and
Practice.
(New York, Toronto: Wiley).
Herrera-Silveira, J.A., Ramírez, R.J., and Zaldivar, J.A., 1998, Overview and
characterization of the hydrology and primary producer communities of selected
coastal lagoons of Yucatán, México.
Aquatic Ecosystem Health and
Management,
1(3–4), pp. 353–372.
INEGI, 1985,
Carta Edafológica 1:250 000.
INEGI, 1991, Quintana Roo. Resultados Definitivos. Tabulados Básicos.
XI censo
General de Población y Vivienda de 1990
, pp. 1–37.
INEGI, 1993, Othón Pompeyo Blanco, Estado de Quintana Roo. Cuaderno
Municipal, Gobierno del Estado de Quintana Roo, edited by INEGI and H.
Ayuntamiento Constitucional del Estado.
INEGI, 1994, Quintana Roo. Panorama Agropecuario.
VII censo agropecuario
1991
, pp. 23–33.
INEGI, 1996, AGROS, Información Censal Agropecuaria.
Noreña-Barroso, E., 1998, Contaminantes orgánicos y sus efectos a nivel
histológico en bagres
Ariopsis assimilis de la Bahía de Chetumal, Quintana Roo,
México, Tesis de Maestría, CINVESTAV, Unidad Mérida, Yucatán, México.
Noreña-Barroso, E., Zapata-Perez, O., Ceja-Moreno, V., and Gold-Bouchot, G.,
1998, Hydrocarbon and organochlorine residue concentrations in sediments from
Bay of Chetumal, Mexico,
Bull. Environ. Contam. Toxicol. 61, pp. 80–87.
Ortiz, M.C. and Sáenz, J.R., 1997, Detergents and orthophosphates inputs from
urban discharges to Chetumal Bay, Quintana Roo, México.
Bull. Environ.
Contam. Toxicol.
59 (03), pp. 486–491.
Pacheco, J. and Cabrera, A., 1996, Efecto del uso de fertilizantes en la calidad del
agua subterránea en el Estado de Yucatán.
Ingeniería Hidráulica en México.
11(1), pp. 53–60, enero-abril.
SEMARNAP, 1996, Contaminación química en la Bahía de Chetumal,
Boletín
Caribe
, edición de julio, Secretaría de Medio Ambiente y Recursos Naturales.
© 2005 by CRC Press LLC