INTERFACIAL APPLICATIONS IN ENVIRONMENTAL ENGINEERING - CHAPTER 16 pptx
Bạn đang xem bản rút gọn của tài liệu. Xem và tải ngay bản đầy đủ của tài liệu tại đây (800.07 KB, 34 trang )
16
Polymer Waste Recycling over “Used”
Catalysts
SALMIATON ALI and ARTHUR GARFORTH University of Manchester
Institute of Science and Technology, Manchester, United Kingdom
DAVID H. HARRIS Engelhard Corporation, Iselin, New Jersey, U.S.A.
RON A. SHIGEISHI Carleton University, Ottawa, Ontario, Canada
Polymer waste can be regarded as a potentially cheap source of chemicals and
energy, although its recycling varies widely across Europe [1,2]. Most polymer
waste is difficult to decompose naturally, but most polymers are still discarded
by open dumping. The destruction of wastes by incineration is widespread, but
it is expensive and often aggravates atmospheric pollution. Open dumping brings
rat infestation and related diseases, but sanitary landfill remains one of the most
commonly used methods to control the waste. Unfortunately, disposing of the
waste to landfill is becoming undesirable due to rising disposal costs, the genera-
tion of explosive greenhouse gases (such as methane, which is formed from the
decomposition of organic material in landfill), and the poor biodegradability of
plastic. Legislation effective on 16 July 2001 states that all wastes sent to the
landfill must be reduced by 35% over the period from 1995 to 2020 [3].
I. REVIEW ON POLYMER RECYCLING OVER
CATALYSTS
A. Background
Plastic materials are among the best modern products of the chemical process
industry and offer a unique range of benefits that make an improved standard of
living more accessible for everyone. Involving continuous innovation related to
new products, systems, manufacturing technologies, and markets, the plastics
industry itself is one of the great industrial successes of the 20th century. The
consumption of plastics is predicted to show an annual growth rate of approxi-
TM
Copyright n 2003 by Marcel Dekker, Inc. All Rights Reserved.
296 Ali et al.
mately 4% (from 25.9 million tons in 1996 to 36.9 million tons in 2006) [1].
However, consumption in 1999 increased by 5.4% over 1998 figures [2], showing
that the consumption of plastics might exceed this prediction for 2006. This may
be due to the fact that plastics are resource efficient and affordable and are in-
creasingly replacing traditional materials.
However, with growing consumption, the main challenge is to keep pace in
waste recovery [1,2,4–6]. Every year, the UK produces 29 million tons of munici-
pal waste, which is equivalent to half a ton per person [7]; the total amount is
between 170 million and 210 million tons when waste from households, com-
merce, and industry is included. From this total waste figure, about 60% is dis-
posed of to landfill sites [8], in 1999, about 6 million tons of plastic wastes
were landfilled [9]. As well as landfill, there are two main alternatives in treating
municipal and industrial plastic wastes: energy recycling, in which plastics are
incinerated, with some energy recovery, and mechanical recycling, in which plas-
tics are regranulated and reused. However, these methods are less desirable due
to the need for the collection and sorting of waste, which is one of the most
serious problems for the plastic recycling industry [10]. Table 1 shows the total
plastics consumption and total plastics waste recovery in Western Europe [8].
In the UK itself, total plastic waste collectable was 3.6 million tons in 1999.
However, of that amount only 12.1%, or about 438 thousand tons, of wastes were
recovered by mechanical recycling (6.2%) and energy recovery (5.9%) [2].
Even though these common methods are practical in handling wastes, they
have their own drawbacks. Besides poor biodegradability, landfill treatment is
also less desirable because of the European Union Landfill Directive to the United
Kingdom on 16 July 2001, which states that all waste sent to the landfill must
be reduced by 35% over the period from 1995 to 202 [3]. Incineration of plastic
waste meets strong societal opposition due to possible atmospheric contamination
[11–13]. In addition, under the legally binding Kyoto Protocol, the UK must
reduce its gas emissions by 12.5% by 2008–2010 and move toward the domestic
TABLE 1 Total Plastics Consumption and Waste Recovery, Western Europe (ϫ
1000 tons)
1991 1993 1995 1997 1999
Total plastics consumption 24,600 24,600 26,100 29,000 33,600
Total plastics waste 13,594 15,651 17,505 16,975 19,166
Total plastics waste recovered 3,218 3,340 4,019 4,364 6,113
Mechanical Recycling 1,080 915 1,222 1,455 1,800
Feedstock Recycling 0 0 99 344 364
Energy Recovery 2,138 2,425 2,698 2,575 3,949
% total plastics waste recovered 22 21 26 26 32
TM
Copyright n 2003 by Marcel Dekker, Inc. All Rights Reserved.
Polymer Waste Recycling over “Used” Catalysts 297
goal of reducing carbon dioxide emissions by 20% by 2010 [3]. Mechanical re-
cycling (the conversion of scrap polymer into new products) is a popular recovery
path and most preferred by manufacturers, but the recycled plastic products often
cost more than virgin plastic [14]. Also, this method can be performed only on
single-polymer plastics waste, since a market for recycled products can be found
only if the quality is close to that of the original [15].
B. Feedstock Recycling: Current State of the Art
The latest Association of Plastics Manufacturers in Europe (APME) report claims
that feedstock recycling, sometimes known as chemical recycling or tertiary re-
cycling, has great potential to enhance plastics waste recovery levels. In addition,
this method does not have the negative public impact of incineration, and the
recovered materials may have broader applications than mechanically recovered
plastics [16–17]. In 1999, however, only 364,000 tons of wastes were treated by
this method. This has not changed significantly since 1997, as shown in Table
1 [2]. Mixed plastics waste can also be recovered by this new approach, as long
as its halogen organic compound content does not exceed 2–6 wt % [18].
In the past few years, feedstock recycling, which has appeared as a reliable
option and alternative strategy, has attracted the attention of many scientists [19–
62] whose aim is to convert waste polymer materials into original monomers or
into other valuable chemicals. These products are useful as feedstock for a variety
of downstream industrial processes or as transportation fuels. Two main chemical
recycling routes are the thermal and catalytic degradation of waste plastics. In
thermal degradation, the process produces a broad product range and requires
high operating temperatures, typically more than 500°C and even up to 900°C
[40–44]. On the other hand, catalytic degradation might provide a solution to
these problems by controlling the product distribution and reducing the reaction
temperature [40,41,45–48].
Plastics are divided into two groups: (1) condensation polymers and (2) addi-
tion polymers. Condensation polymers, which include materials such as polyam-
ides, polyesters, nylon, and polyethylene terephthalate (PET), can be depolymer-
ized via reversible synthesis reactions to initial diacids and diols or diamines.
Typical depolymerization reactions such as alcoholysis, glycolysis, and hydroly-
sis yield high conversion to their raw monomers [63]. In contrast, the second
group of materials, addition polymers, which include materials such as poly-
olefins, are not generally reversible, and therefore they cannot easily be depoly-
merized into the original monomers. However, they can be transformed into
hydrocarbon mixtures via thermal and catalytic cracking processes [22,26,29–
33,46,47,56,63,64].
Plastic wastes treated by catalytic degradation processes are limited mainly
to waste polyolefins and polystyrene (PS). Waste polyvinyl chloride (PVC),
TM
Copyright n 2003 by Marcel Dekker, Inc. All Rights Reserved.
298 Ali et al.
which is probably the most heat sensitive, with initial thermal degradation tem-
peratures between 100 and 150°C, has been excluded because of the emission
of hazardous gases such as hydrogen chloride, which is the main volatile product
[4,65,66]. A few researchers, however, have tried to investigate the effect of PVC
waste on the recycling of PET and PE [47,49,50]. One study on the dechlorination
and chloro-organic compounds from PVC-containing mixed plastic-derived oil
has given an encouraging result using an iron–carbon composite catalyst in the
presence of helium [51]. A number of authors have reported promising results
on the cracking of PS at operating temperatures from 350 to 500°C over acid
catalysts such as HMCM-41, HZSM-5, amorphous SiO
2
-Al
2
O
3
, BaO powder,
mordenite (HMOR), zeolite-Y, and a sulfur-promoted zirconia [25,52–54]. The
results have been compared with those from thermal degradation processes,
which require higher operating temperatures.
The largest plastic constituent in municipal waste stream consists of poly-
olefins, mostly derived from high-density polyethylene (HDPE), low-density
polyethylene (LDPE), linear low-density polyethylene (LLDPE), and polypropyl-
ene (PP). These are among the most abundant polymeric waste materials, typi-
cally making up 60–70% of municipal solid waste plastics [2,13,15,55]. Reports
on the degradation of polyolefin derivatives under various operating conditions
and cracking methods also give promising results. An example is given in a report
on HDPE being pyrolyzed in the temperature range 290–430°C in a fluidized-
bed reactor using HZSM-5, HMOR, Silicalite, HUS-Y, and SAHA. The yield of
volatile hydrocarbon products was in the order HZSM-5 Ͼ HUS-Y Ϸ HMOR
Ͼ SAHA ϾϾ Silicalite [40]. Another report [56] describes a two-stage catalytic
degradation process consisting of amorphous silica alumina and HZSM-5 in se-
ries to convert PE into high-quality gasoline-range fuels. The author found that
a silica alumina :HZSM-5 weight ratio of 9:1 gave improved gasoline yield with
a high octane number in spite of low aromatic content.
Aguado et al. obtained a high conversion of 40–60% and good selectivity to
C
5
–C
12
hydrocarbons of 60–70% [57] when PP and PE were catalyzed by zeolite
beta at 400°C and atmospheric pressure in a batch reactor under N
2
flow. Tertiary
recycling of HDPE and PP over catalysts amorphous silica-alumina and F9 (a
silica-alumina catalyst with sodium oxide) using a powder-particle fluidized-bed
reactor gave liquid fuels, gas products, and solid residue [58]. In a further exam-
ple, PE and PS were degraded in a two-stage process, first over the catalyst and
then hydrogenated over platinum catalysts. This gave more than a 90% yield of
gas and liquid fractions with boiling point less than 360°C [59]. Volatile-product
distributions of PE and PP were also investigated with respect to the effect of
catalyst activity and pore size of HZSM-5, HY, and MCM-41 using a fixed-
bed microreactor. This concluded that HZSM-5 and MCM-41 gave higher-olefin
products in the range C
3
–C
5
and HY gave higher-paraffin products in the range
C
3
–C
8
[60,61].
TM
Copyright n 2003 by Marcel Dekker, Inc. All Rights Reserved.
Polymer Waste Recycling over “Used” Catalysts 299
Most of the polymer degradation studies using solid catalysts involve pure
zeolites, a crystalline, porous aluminosilicate made up of a linked framework of
[SiO
4
]
4Ϫ
and [AlO
4
]
5
edge-sharing tetrahedra, or amorphous silica alumina [67–
69]. Figure 1 shows typical zeolites of different structure used in polymer crack-
ing [70]. Different zeolites have different channels and pore sizes, which control
product distribution. For example, zeolite ZSM-5 has smaller channels 5.3 ϫ 5.5
A
˚
, with unique three-distributional pore structures that consist of straight chan-
nels and interconnecting sinusoidal channels that increase shape selectivity in
petrochemical reactions. Zeolite Y has larger pore openings of 7.4-A
˚
diameter
with three-dimensional connecting cavities of about 13-A
˚
diameter, thus permit-
ting diffusion of hydrocarbon molecules into the interior of the crystals and ac-
counting for the high effective surface area of these material [71–82].
FIG. 1 Typical zeolites used in polymer cracking: (a) H-ZSM-5, (b) H-MOR (Morde-
nite), (c) H-Y or HUS-Y, and (d) H-Beta. (From Ref. 70.)
TM
Copyright n 2003 by Marcel Dekker, Inc. All Rights Reserved.
300 Ali et al.
In previous studies, catalytic cracking of polymers was carried out over fresh
catalysts. There is only one report where one spent fluid catalytic cracking (FCC)
catalyst was used, and the results compared with those on pure zeolites and silica
alumina [62]. Polypropylene was catalytically degraded in a semibatch stirred
reactor at 380°C. The authors found that the spent catalyst they used generated
very low product yield and that the yield and selectivity were similar to those
of silica alumina; however, the amount used could be increased due to its very
low cost.
In this work, we evaluate fresh and also “used” FCC catalysts with different
rare earth oxides and heavy metal loadings [3–91], for the recycling of polymer
wastes, and compare with pure catalysts. This study will help in refining our
initial economic model of the polymer recycling process, which as been published
elsewhere [92], and will enable a comparison with current process technology
[42]. Previously, almost all studies dealt with pure catalysts as cracking catalysts
in the degradation of polymers. Even though pure catalysts generate good product
distributions and selectivity, their costs are much higher. This makes polymer
waste recycling unrealistic [18]. However, as presented in this chapter, using zero-
cost “used” catalysts, which give sufficient cracking products and reliable selec-
tivity, will make catalytic polymer waste recycling more economically viable.
II. THERMAL VISUAL ANALYSIS TO STUDY THE
MOLTEN POLYMER/ZEOLITE CATALYST
INTERFACE
A. Introduction
Before design predictions can be made for a pyrolysis process on an industrial
scale, an understanding of the interface between the polymer and the catalyst
might be developed in order to study the reaction of the mixture. The mechanism
of interaction is highly complex, with three phases (liquid polymer, solid catalyst,
and gaseous products), mass transfer by diffusion, convection, and bulk flow, as
well as cracking-type reactions with a large number of products.
In this section, the degradation of high-density polyethylene (HDPE) over
zeolite ZSM-5 has been investigated using a heated stage microscope and scan-
ning electron microscopy to examine partially and fully reacted polymer and
zeolite mixtures. The aim of the study was to elucidate the physical behavior of
the system: how the polymer melts at the interface and how the molten polymer
wets the catalyst.
B. Experiments
The polymer used was HDPE in a powder form with an average molecular weight
of 75,000 (Grade HMLJ200MJ8, BASF), while the zeolite was ZSM-5 with a
TM
Copyright n 2003 by Marcel Dekker, Inc. All Rights Reserved.
Polymer Waste Recycling over “Used” Catalysts 301
Si/Al ratio of 17.5 and average particle size of 1 µm (BP, Sunbury-on-Thames,
London). Equal amounts of polymer and zeolite (pelletized and sieved) were
blended together by grinding, and samples of this blend were mounted between
glass plates. Each mount was then placed on the heated stage (Linkam model
THMS 600 with controller TMS 91) of a microscope (Olympus model BH2).
The stage was then programmed to heat at 300°Cat20°Cmin
Ϫ1
, followed by a
hold at 300°C for various times to a maximum of 120 min.
During the heating process, mounts were removed from the heating stage and
allowed to cool to room temperature. After cooling, the upper glass plate was
removed gently so that the bulk of the heated mixture remained on the lower
glass. The lower glass was then attached to an aluminum sample stub of a stan-
dard scanning electron microscope (SEM) and coated with gold (Polaron Equip-
ment Ltd., Watford, England, model E 5000). In addition, samples of fresh ZSM-
5 and HDPE were prepared for the SEM (Hitachi Ltd., Tokyo, 9, model S-520
SEM) and micrographs were taken at 200ϫ magnification.
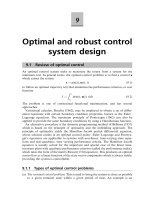
FIG. 2 HDPE at 200ϫ magnification.
TM
Copyright n 2003 by Marcel Dekker, Inc. All Rights Reserved.
302 Ali et al.
C. Results and Discussion
In viewing the micrographs, it is important to remember that all the samples were
cooled to room temperature prior to examination under SEM. Since the sample
could not be reheated under the microscope after SEM examination, Figures 4–
7 show different sample mixtures heated to different temperatures or held at
300°C for various times.
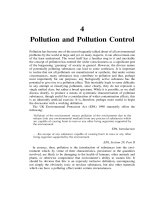
Figure 2 shows fresh HDPE particles with an average particle size estimated
to be in the range of 25–125 µm. Figure 3 shows fresh zeolite ZSM-5 after being
pelleted and sieved at 125–180 µm.
Figures 4–7 show SEM micrographs of a series of samples taken at four differ-
ent stages in the pyrolysis of the polymer over ZSM-5. Figure 4 portrays the
mixture of HDPE/ZSM-5 after heating from room temperature to 205°C The
polymer particles could be seen to have melted partially, with a tendency to stick
together. The individual particles were still noticeable, but the polymer surface
FIG. 3 Fresh zeolite ZSM-5 at 200ϫ magnification.
TM
Copyright n 2003 by Marcel Dekker, Inc. All Rights Reserved.
Polymer Waste Recycling over “Used” Catalysts 303
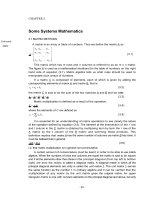
FIG. 4 Mixture of HDPE/ZSM-5 at 205°C, 200ϫ magnification.
was smooth compared to fresh HDPE (Fig. 2). Figure 5 shows that the 300°C,
as the polymer melted, the zeolite particles moved under the microscope slide,
eventually, all the zeolite particles were well “wetted” with liquid polymer.
It is known that the reaction of HDPE begins at less than 300°C [93]. As the
heating time at 300°C increased to 40 minutes (Fig. 6), it appeared that the poly-
mer was being drawn into the zeolite so that more zeolite became visible. As the
reaction progressed and more polymer diffused into the zeolite, holes or bubbles
appeared on the polymer surface. Gaseous products could escape from the interior
of the sample through these holes or bubbles. After 120 minutes at 300°C, the
amount of unreacted polymer had decreased significantly and was hardly visible
on the surface, as shown in Figure 7.
Therefore, in the degradation of HDPE’s over ZSM-5, the molten polymer
wetted the surface of the zeolite particles and was then pulled into the interior
of the catalyst particles, where the reaction took place. Two simple models have
been suggested [94] for fluid–solid reactions.
TM
Copyright n 2003 by Marcel Dekker, Inc. All Rights Reserved.
304 Ali et al.
FIG. 5 Mixture of HDPE/ZSM-5 at 300°C, 200ϫ magnification.
1. Progressive-conversion model: The reactants are imagined to enter and react
with the particle at all positions at once.
2. Unreacted-core model: The reactant is imagined to enter the outer layer of
the particle and then move toward the middle, leaving behind converted ma-
terial and inert solid (ash), Therefore, at any time, there exists an unreacted
core of material that shrinks in size during the reaction.
Though the two models were not developed for catalytic reactions, the experi-
mental results suggest that the unreacted-core model applies to this case. As the
polymer diffused into the aggregate of zeolite particles, a reaction took place and
products were produced. Pyrolysis of the polymer gave both solid products (coke)
and gaseous products. Gaseous products escaped and coke was deposited on the
zeolite, at which point the zeolite began to deactivate. Figures 6 and 7 show that
the polymer was being pulled into the aggregate of zeolite particles while the
particle size remained unchanged. This process is consistent with the unreacted-
core model. The deactivation of zeolite as the reaction proceeded could be related
TM
Copyright n 2003 by Marcel Dekker, Inc. All Rights Reserved.
Polymer Waste Recycling over “Used” Catalysts 305
FIG. 6 Mixture of HDPE/ZSM-5 at 300°C, isothermal for 40 minutes, at 200ϫ mag-
nification.
to the amount of converted material that was left behind, as the front of the
polymer core was moving toward the middle of the zeolite particles.
III. HDPE DEGRADATION OVER CATALYSTS
A. Introduction
Polymers can be pyrolyzed to lower-molecular weight hydrocarbons either cata-
lytically, using a variety of reactor types, including batch [22,26–28, 32] and
fixed bed [20,21,23,29,34–36,47,56,58], or noncatalytically, using thermal degra-
dation in a fluidized-bed reactor or kiln [42,66,95–98]. However, using batch
reactors leads to predominantly secondary reactions, which have a broad range
of products, including heavy aromatics and coke as well as saturated hydrocar-
bons. Fixed-bed reactors are prone to blocking due to the viscous nature of melted
polymer. These create problems in scaling up to industrial dimensions [99]. Non-
TM
Copyright n 2003 by Marcel Dekker, Inc. All Rights Reserved.
306 Ali et al.
FIG. 7 Mixture of HDPE/ZSM-5 at 300°C, isothermal for 120 minutes, 200ϫ mag-
nification.
catalytic thermal cracking using a fluidized-bed reactor, with sand as a fluidizing
agent, or kiln requires a higher operating temperature and produces products in
a very broad range.
On the other hand, the use of a fluidized-bed reactor has advantages in terms
of heat and mass transfer, as well as constant temperatures throughout the reactor
[40,41,55,92,99,100]. Therefore, to minimize the operating temperature and to
maximize the product selectivity and yield, compared to thermal cracking, HDPE
degradation has been investigated in this work using a laboratory-scale catalytic
fluidized-bed reactor [99]. A few pure catalysts were used initially, and then the
work was extended to real commercial fluid catalytic cracking catalysts. Results
will be compared to simple thermal cracking experiments.
B. Experiments
1. Materials and Reaction Preparation
Pure HDPE (ex. BASF) with an average weight of 75,000, as determined by gel
permeation chromatography, and a density of 960 kg m
Ϫ3
was used in this study.
TM
Copyright n 2003 by Marcel Dekker, Inc. All Rights Reserved.
Polymer Waste Recycling over “Used” Catalysts 307
TABLE 2 Catalysts Used
Catalyst Commercial name Supplier
ZSM-5 ZSM-5 zeolite BP Chemicals, Sunbury-on-
Thames, UK
US-Y Ultrastabilized Y zeolite Crosfield Chemicals, Warrington,
UK
SAHA Amorphous silica alumina Crosfield Chemicals, Warrington,
(high alumina) UK
CAT-A, B, C, D Fresh commercial FCC catalyst Engelhard Corp., NJ
E-Cat 1, 2, 3 Equilibrium catalysts Engelhard Corp., NJ
The catalysts employed in this study are described in Table 2, with relevant char-
acterization details shown in Table 3. Prior to use, all the catalysts were pelleted
using a press (compression pressure ϭ 160 MPa), crushed, and sieved to give
particles ranging from 125 to 190 µm. The catalysts (0.25–0.30 g) were then
activated by heating in the reactor in flowing nitrogen (50 mL min
Ϫ1
) to 120°C
at 60°Ch
Ϫ1
. After 2 h, the temperature was increased to 500°C at a rate of 120°C
h
Ϫ1
. After 5 h at 500 °C, the reactor was cooled to the desired reaction tempera-
ture. The particle size of both catalysts (125–180 µm) and polymer (75–250 µm)
were chosen to be large enough to avoid entrainment and small enough to be
accurately fluidized in a flow of high-purity nitrogen at 450–500 mL min
Ϫ1
.
Two types of polymer cracking experiments were carried out:
1. 360°C with a catalyst/polymer (C/P) ratio of 2:1 (typical laboratory condi-
tions)
2. 450°C with a C/P ratio of 6: 1 (more closely resembling FCC conditions).
2. Product Analysis
A schematic diagram of the fluidized bed reactor is shown in Figure 8. A detailed
operation procedure has been reported previously [40,55]. Volatile products leav-
ing the reactor were passed through a glass-fibre filter to capture catalyst fines.
A three-way valve was used to route products either into a sample gas bag or to
an automated sample valve system with 16 loops. Tedlar bags, 15 liters in capac-
ity, were used to collect time-averaged gaseous samples. The bags were replaced
at intervals of 5 and 10 minutes throughout the course of the reaction. The
multiport sampling valve allowed frequent, rapid sampling of the product stream
at 0.5- and 1-minute intervals. Gaseous products were analyzed using a gas chro-
matograph (VARIAN 3400) equipped with (1) a thermal conductivity detector
(TD) fitted with a molecular sieve 13ϫ packed column (1.5-m ϫ 0.2-mm i.d.)
and (2) a flame ionization detector (FID) fitted with a PLOT Al
2
O
3
/KCl capillary
column (50-m ϫ 0.32-mm i.d.). A calibration cylinder containing 1% C
1
–C
5
TM
Copyright n 2003 by Marcel Dekker, Inc. All Rights Reserved.
308 Ali et al.
TABLE 3 Summary of Catalyst Details
wt% m
2
/g ppm µmol/g catalyst
Particle size
Catalyst Si/Al Al
2
O
3
REO TSA MSA ZSA Ni V Bronsted Lewis (microns)
ZSM-5 17.5 — — 391 — 391 — — 182.5 65.0 Hexagonal
US-Y 6.2 — — 603 — 603 — — 254.9 185.8 Tetragonal
SAHA 2.6 25 — 274 274 — — — 12.3 134.9 15–160
Catalyst A 0.6 32.5 1.2 384 118 266 nd nd 216.1 146.7 30–100
Catalyst B 0.6 30.7 4.8 437 112 325 nd nd 168.5 114.3 6–60
Catalyst C 0.2 53.1 1.9 335 172 163 nd nd 248.9 109.4 15–60
Catalyst D 0.5 35.5 3.1 198 54 144 nd nd 136.3 40.1 15–70
E-Cat 1 nd 42.5 1.3 175 76 99 171 217 10.1 18.1 30–100
E-Cat 2 nd 29.4 1.6 127 32 95 5400 6580 8.1 8.4 25–210
E-Cat 3 nd 37.4 2.8 155 56 99 1520 3920 9.9 16.3 25–90
nd—not detected; REO—rare earth oxide; TSA—total surface area; MSA—matrix surface area; ZSA—zeolite surface area; Ni—nickel; V—vanadium;
Bronsted and Lewis acidity—FTIR measurement.
TM
Copyright n 2003 by Marcel Dekker, Inc. All Rights Reserved.
TM
Copyright n 2003 by Marcel Dekker, Inc. All Rights Reserved.
Polymer Waste Recycling over “Used” Catalysts 309
FIG. 8 Schematic diagram of the fluidized-bed reactor. ℵ polymer feeder; ᑣ 3-zone
furnace; ᑬ sintered distributor; ℘ fluidizing catalyst; fluidized-bed reactor; flow-
meter; ∅ 16-loop automated sample box; ʝ gas bag; ʜ gas chromatograph; ⊃ 3-zone
digital controller.
hydrocarbons (Linde Gas, UK) was employed to help identify and quantify the
gaseous products.
The remaining solids deposited on the catalyst after the catalytic degradation
of the polymer were considered “residues” that contained involatile products and
coke. The amount and nature of the residues were determined by thermogravime-
tric analysis (TA Instruments, DST 2960 Simultaneous DTA-TGA), as described
elsewhere [55,99].
C. Results and Discussions
1. Overall Analysis
Catalytic pyrolysis products (P) are grouped together as hydrocarbon gases
(ϽC
5
), gasoline (C
5
–C
9
), coke, and residues to simplify the description of the
overall pyrolysis processes. The term yield as used here is defined by this relation:
yield (wt%) ϭ
P(g)
polymer feed (g)
ϫ 100
TM
Copyright n 2003 by Marcel Dekker, Inc. All Rights Reserved.
310 Ali et al.
At the reaction temperatures used in this study, the products from polymer crack-
ing were mostly gases in the region C
1
–C
9
. Product characterization by gas chro-
matography included amount, carbon chain length, and degree of unsaturation.
This, combined with TGA analysis of coke and unreacted polymer in the catalysts
after the cracking reaction, led to mass balances of 90 Ϯ 5% for most of the
experiments.
2. Thermal Cracking in Polymer Degradation
Thermal cracking of polymer waste as carried out at the BP pilot plant in
Grangemouth [42,66] was investigated in comparison with catalytic cracking at
450°C with a C/P ratio of 6:1. However, instead of using sand, as in the BP
process, silica (SiO
2
) with no activity was used as a fluidizing agent in the process.
The SiO
2
was derived from a commercial 40% aqueous solution of Ludox by
evaporation at 70–100°C. Ludox AS40 is commonly used as a source of silica
in the synthesis of zeolites. In this section, the thermal cracking process using
SiO
2
was compared with catalytic cracking over catalysts SAHA, E-Cat 1, and
E-Cat 2. The overall results are tabulated in Table 4. Figure 9a shows the yields
of gas, liquid, wax, and coke; Figure 9b shows selected olefin product distribu-
tions for both catalytic and thermal cracking.
TABLE 4 Wt% of Product Distributions for Catalytic Compared to Thermal
Cracking at T ϭ 450°C; C/P ϭ 6:1
Catalytic Thermal
E-Cat 1 E-Cat 2
SAHA SiO
2
Gaseous 79.2 83.3 83.8 15.1
Liquid 0.0 1.8 1.7 5.9
Coke 5.0 1.9 1.3 0.0
Wax 0.0 0.0 0.0 50.8
Involatile 15.8 13.0 13.2 28.3
Total 100.0 100.0 100.0 100.0
Gaseous product distribution
H
2
0.0010 0.0008 0.0012 0.0000
C
1
–C
4
41.5 35.2 34.4 44.2
C
5
–C
9
58.0 63.4 64.3 55.7
BTX
a
0.5 1.4 1.3 0.0
Total 100.0 100.0 100.0 100.0
Total gaseous product
Paraffins 15.8 23.6 23.7 6.7
Olefins 83.7 74.9 75.0 93.3
a
BTX—benzene, toluene, and xylene.
TM
Copyright n 2003 by Marcel Dekker, Inc. All Rights Reserved.
Polymer Waste Recycling over “Used” Catalysts 311
FIG. 9 Catalytic versus thermal cracking at T ϭ 450°C; C/P ϭ 6 :1 (based on 0.1 g
polymer feed): (a) total product and (b) alkene product distribution.
For all reactions, the 30 wt% of unreacted polymer was taken into account
for mass balances. At 450°C, thermal cracking gave yields of 50 wt% wax prod-
uct with a hydrocarbon range of C
14
–C
30
, at 360°C, no products were detected.
It will be shown later that catalytic cracking of polymer was better than thermal
cracking even when using less reactive catalysts, such as E-Cats.
3. Catalytic Cracking: Two Operating Conditions
Two operating conditions were investigated in this study: (1) temperature 360°C
and catalyst-to-polymer (C/P) ratio 2:1, and (2) temperature 450°C and C/P ratio
6:1. The overall results are presented in Tables 5 and 6, respectively.
TM
Copyright n 2003 by Marcel Dekker, Inc. All Rights Reserved.
312 Ali et al.
TABLE 5 Wt% of Product Distributions at T ϭ 360°C; C/P ϭ 2:1
ZSM-5 US-Y SAHA Cat-A Cat-B Cat-C Cat-D E-Cat1 E-Cat2 E-Cat3
Gaseous 81.1 70.4 86.9 79.8 76.4 77.3 78.3 53.6 42.4 48.9
Liquid 0.0 0.0 0.0 0.0 0.0 0.0 0.0 3.1 4.1 3.7
Coke 1.5 7.3 2.2 9.1 9.8 8.4 7.9 0.6 0.4 0.8
Involatile 11.4 22.2 10.8 11.1 13.9 14.3 13.8 42.7 53.0 46.7
Total 100.0 100.0 100.0 100.0 100.0 100.0 100.0 100.0 100.0 100.0
Gaseous product distribution
C
1
–C
4
72.6 38.1 45.7 42.6 40.2 43.4 41.8 28.67 21.4 26.4
C
5
–C
8
24.6 59.4 54.3 54.6 57.0 54.7 56.1 71.0 74.2 72.8
BTX
a
2.7 2.5 0.0 2.8 2.8 1.8 2.2 0.3 4.5 0.8
Total 100.0 100.0 100.0 100.0 100.0 100.0 100.0 100.0 100.0 100.0
Total gaseous product
Paraffins 16.1 48.7 6.8 48.7 49.1 38.5 42.7 19.5 20.2 26.4
Olefins 81.2 48.8 93.2 48.4 48.1 59.7 55.2 80.2 75.4 72.8
a
BTX—benzene, toluene, and xylene.
TM
Copyright n 2003 by Marcel Dekker, Inc. All Rights Reserved.
TM
Copyright n 2003 by Marcel Dekker, Inc. All Rights Reserved.
Polymer Waste Recycling over “Used” Catalysts 313
TABLE 6 Wt% of Product Distributions at T ϭ 450°C; C/P ϭ 6:1
ZSM-5 US-Y SAHA Cat-A Cat-B Cat-C Cat-D E-Cat1 E-Cat2 E-Cat3
Gaseous 83.7 69.6 79.2 75.8 66.0 71.4 75.0 83.3 83.8 82.6
Liquid 2.0 0.6 0.0 0.7 0.3 0.7 0.8 1.8 1.7 1.8
Coke 2.4 5.6 5.0 13.3 13.3 11.7 11.0 1.9 1.3 1.5
Involatile 11.9 24.2 15.8 10.2 20.4 16.2 13.1 13.0 13.2 14.2
Total 100.0 100.0 100.0 100.0 100.0 100.0 100.0 100.0 100.0 100.0
Gaseous product distribution
H
2
0.0070 0.000 0.0010 0.0012 0.0015 0.0008 0.0007 0.0008 0.0012 0.0019
C
1
–C
4
68.6 36.6 41.5 55.4 53.2 51.4 50.8 35.2 34.4 32.7
C
5
–C
9
23.1 60.2 58.0 40.5 42.7 45.0 45.6 63.4 64.3 66.4
BTX
a
8.3 3.2 0.5 4.1 4.1 3.7 3.6 1.4 1.3 0.9
Total 100.0 100.0 100.0 100.0 100.0 100.0 100.0 100.0 100.0 100.0
Total gaseous product
Paraffins 27.0 48.8 15.8 63.8 63.4 53.7 54.7 23.6 23.7 25.8
Olefins 64.7 47.8 83.7 31.5 32.5 42.7 41.6 74.9 75.0 73.3
a
BTX—benzene, toluene, and xylene.
TM
Copyright n 2003 by Marcel Dekker, Inc. All Rights Reserved.
TM
Copyright n 2003 by Marcel Dekker, Inc. All Rights Reserved.
314 Ali et al.
FIG. 10 Product distribution for model catalysts at (a) T ϭ 360°C (C/P ϭ 2:1) and (b)
T ϭ 450°C (C/P ϭ 6:1).
(a) Model Catalysts. The products from polymer cracking shown in Figures
10a and 10b reflect the different natures of both the zeolitic pore structure and
the predominant type of acidity found in the catalysts. At temperature 360°C,
ZSM-5 yielded predominantly olefinic materials (ϳ83 wt%) in the very narrow
range of carbon number C
3
–C
5
due to its restricted channels and smaller pore
openings. The less reactive amorphous silica-alumina, high alumina (SAHA),
which contains largely Lewis acid sites, yielded almost 95 wt% unsaturated olefin
products over the C
3
–C
7
carbon range. US-Y, with its large pore openings and
internal supercages, allowed bulky bimolecular reactions to occur and, conse-
TM
Copyright n 2003 by Marcel Dekker, Inc. All Rights Reserved.
Polymer Waste Recycling over “Used” Catalysts 315
quently, gave a C
3
–C
8
carbon number distribution with a 50:50 balance of paraf-
fins and olefins. These results were comparable to those of previous studies
[40,41,99].
At 450°C and higher catalyst-to-polymer ratio, the results were similar but
with increased paraffin yields. Higher temperature increases the reactivity of the
catalysts, and hence more primary products (olefins) were converted to secondary
products (paraffins). However, zeolite US-Y at higher temperature showed rapid
deactivation and high coke yield at very short reaction times, consequently, the
product yield of US-Y looked similar at both temperatures.
(b) US-Y and FCC Catalysts (Cat-A, -B, -C, -D). FCC commercial catalysts
(Figs. 11a and 12a) produced a balanced paraffinic and olefinic product stream
(mainly C
3
–C
8
) similar to that of US-Y. This is expected, since the major catalytic
component in FCC catalysts is zeolite Y, with approximately 10 wt% ZSM-5
[101]. All catalysts had high levels of coke, due to catalyst deactivation. However,
when laboratory conditions more closely resembled FCC process conditions,
which are at temperature 450°C and catalyst-to-polymer ratio of 6:1, all FCC
catalysts produced significantly larger amounts of paraffins (54–64 wt%, Figs.
11b and 12b). This increased activity in FCC catalysts compared to US-Y may
be explained by the presence of rare earth oxides and matrix material, which are
present in FCC catalysts. Their role is to moderate the activity loss, to maximize
the cracking activity, and to reduce the effect of containment metals and coke
formation, respectively [83,84,90,101]. Also, US-Y deactivated very rapidly at
the high temperature.
(c) Equilibrium Catalysts (E-Cats). Equilibrium catalysts are “used” FCC cat-
alysts with different levels of metal poisoning, which came from previous FCC
processes, as presented in Table 3. The metal poisoning, namely, nickel (Ni) and
vanadium (V), originate from porphyrins present in the heavy oils (crude oil)
converted to lighter products in the FCC process. Nickel causes unwanted dehy-
drogenation reactions, which produce byproducts, namely, coke and hydrogen;
and vanadium destroys the zeolite component, which decreases the zeolite surface
area and activity [88,89]. Typically, all E-Cats yielded a predominantly olefin
product (Ն80%) in the range of C
3
–C
8
(Tables 5 and 6, Figs. 13a and 13b) and
compared very favorably with SAHA (similar to a previous batch reactor study
[62]). Since a used catalyst is deactivated, predominantly primary products,
namely, olefins, are produced. More hydrogen transfer was observed when E-Cats
were used, with approximately double the amount of paraffins being generated at
360°C than with SAHA. While increased temperature generated more paraffins
with SAHA, an even greater yield was observed when HDPE was degraded over
E-Cats. Most importantly, the level of nickel and vanadium contamination
trapped in the “used” catalysts did not greatly affect the product stream generated.
The results are very encouraging and have significant impact on the economics
TM
Copyright n 2003 by Marcel Dekker, Inc. All Rights Reserved.
316 Ali et al.
FIG. 11 Product distribution for US-Y and FCC catalysts (Cat-A and -B) at (a) T ϭ
360°C (C/P ϭ 2:1) and (b) T ϭ 450°C (C/P ϭ 6:1).
of a catalytic polymer degradation process employing catalysts of zero market
value.
Figures 14a and 14b present total product yields at 360 and 450°C for zeolite
US-Y compared with one of the FCC catalysts, Cat-A, and SAHA compared
with one of the E-Cats, E-Cat 2, respectively. It is evident from these figures
that the cracking of HDPE over the various catalysts at a set temperature is very
similar. At 360°C, the cracking time required is of the order of 10 minutes,
whereas at the higher temperatures, cracking is complete within 2.5 minutes.
TM
Copyright n 2003 by Marcel Dekker, Inc. All Rights Reserved.
Polymer Waste Recycling over “Used” Catalysts 317
FIG. 12 Product distribution for US-Y and FCC catalysts (Cat-C and -D) at (a) T ϭ
360°C(C/Pϭ 2:1) and (b) T ϭ 450°C (C/P ϭ 6 :1).
4. A Study on Catalyst Regeneration
In this section, some of the catalysts from the previous experiment were reused
to compare to the industrial FCC process. Clearly, polymer waste recycling would
be more economical if catalysts can be reused.
After the previous cracking process, catalyst residues were regenerated in air,
to remove all the coke, and reactivated in nitrogen gas by a similar activation
process. Four regenerated catalyst residues (zeolite US-Y, FCC Cat-A, E-Cat 1,
TM
Copyright n 2003 by Marcel Dekker, Inc. All Rights Reserved.
318 Ali et al.
FIG. 13 Product distribution for SAHA and E-Cats at (a) T ϭ 360°C (C/P ϭ 2 :1) and
(b) T ϭ 450°C (C/P ϭ 6:1).
and E-Cat 2) were studied to crack HDPE at 450°C and C/P ratio of 6:1. The
overall results for the four regenerated catalysts were compared with those using
fresh catalysts and are presented in Table 7. These show that the product distribu-
tions for the fresh and used catalysts are similar. This is very encouraging.
Figure 15 illustrates a few selected product distributions on fresh and regener-
ated catalysts CAT-A, E-Cat 1, and E-Cat 2. Regenerated E-Cat 1 catalyst gave
slightly higher olefin products, possibly indicating a slight lowering of activity
when reused. As expected, a more significant difference between the fresh and
TM
Copyright n 2003 by Marcel Dekker, Inc. All Rights Reserved.
Polymer Waste Recycling over “Used” Catalysts 319
FIG. 14 Total product yields at both temperatures for (a) US-Y and FCC Cat-A and
(b) SAHA and E-Cat 2.
regenerated catalysts (Cat-A) was observed with a marked drop in iso-butane
and a rise in olefin products. This irreversible drop in activity from fresh catalyst
to reused catalyst would result in less conversion of primary olefin products to
secondary paraffin products via hydrogen transfer.
5. A Study on Catalyst Deactivation in Multiple Addition
Series
In order to achieve better and more economic polymer waste recycling, multiple-
step additions of polymer were made throughout the cracking process. It was
noted that even after five additions, the catalyst was still active, although less
TM
Copyright n 2003 by Marcel Dekker, Inc. All Rights Reserved.