PESTICIDES IN AGRICULTURE AND THE ENVIRONMENT - CHAPTER 3 ppsx
Bạn đang xem bản rút gọn của tài liệu. Xem và tải ngay bản đầy đủ của tài liệu tại đây (576.05 KB, 37 trang )
3
Economic Issues of Agricultural Pesticide
Use and Policy in the United States
Craig D. Osteen and Merritt Padgitt*
Economic Research Service
U.S. Department of Agriculture
Washington, D.C., U.S.A.
1 INTRODUCTION
The development and growing use of synthetic organic pesticides have been an
integral part of a technological revolution in U.S. agriculture that increased pro-
ductivity by 2.5-fold between 1948 and 1994 [1]. Synthetic organic pesticide use
grew dramatically from the late 1940s to the early 1980s before stabilizing and
increased at a much slower rate through the 1990s.† Major factors affecting the
trend since 1980 have been the development and use of new pesticides with
reduced application rates and of genetically modified crops that reduce or modify
the use of conventional pesticides.
Growth in pesticide use has created many controversies about potential
effects of pesticide use on food safety, water quality, worker safety, wildlife
* The authors are agricultural economists with the Resource Economics Division, Economic Research
Service, U.S. Department of Agriculture. The views presented are those of the authors and do not
represent the official views of any agency or organization.
† The discussion of pesticide use trends is based on data collected through 1997, which were available
when this chapter was written.
mortality, and pest control. These controversies reflect two major themes that
have influenced the evolution of pesticide and pest management policy [2,3]:
1. Increasing pesticide use may be counterproductive for pest control,
resulting in higher pest damages or control costs.
2. Undesirable health or environmental effects of the use of some pesti-
cides may outweigh production benefits.
Increased public concern about the dietary risks of pesticides during the 1980s
and 1990s led to a major change in pesticide law. New public concerns about
the potential effects of genetically modified crops on pest control, human health,
and the environment are emerging. The current focus of pesticide policy is on
reducing dietary and other pesticide risks to meet safety standards rather than
weighing risks and benefits and on mitigating adverse impacts by finding “safer”
alternatives. Integrated pest management (IPM) has become a policy tool for
reducing the risks of pesticide use as well as an approach for improving the
effectiveness of pest control. This chapter discusses major pesticide use trends
in the United States; the effects of such factors as pesticide productivity, farm
programs, and pesticide regulations on use; and changing law and policy.
2 PESTICIDE USE TRENDS
Effective chemical control of agricultural pests became prevalent in the 1800s
[4]. Paris green (copper acetoarsenite) was developed in the United States in the
1870s to combat the potato beetle, and Bordeaux mixture (quicklime and copper
sulfate) was developed in France in the 1880s to control disease in grape culture.
Prior to World War II, arsenicals, sulfur compounds, and oils were commonly
used. However, the development of synthetic organic materials, such as 2,4-D
and DDT, during World War II heralded the modern age of chemical pesticides.
Pesticide expenses as a portion of farm production expenses (excluding operator
dwellings) rose from 0.2% in 1920 to 4.8% in 1997 [5].
2.1 Aggregate Trends
Synthetic organic pesticide use grew rapidly from the late 1940s to the early
1980s as the percentage of crop acreage treated with pesticides increased. By the
late 1970s, growth of pesticide use had slowed, because high proportions of crop
acreages were being treated annually. Trends in pesticide use since 1980 have
been heavily influenced by changes in crop acreage and the replacement of older
compounds with new ones applied at lower per-acre rates. Synthetic organic pes-
ticide use increased during the 1990s, but more slowly than before 1980. The U.S.
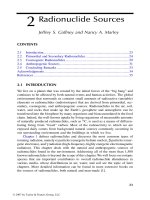
Environmental Protection Agency (USEPA) published estimates that agricultural
pesticide use grew from 366 million lb of active ingredient (a.i.) in 1964 to 843
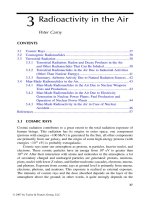
F
IGURE
1 Quantity of agricultural pesticides used in the United States. (Data
from Ref. 6.)
million lb in 1979, fell to 658 million lb in 1987, but rose to 770 million lb in
1997 (Fig. 1) [6]. (Estimates exclude sulfur, petroleum oil, wood preservatives,
biocides, and other nonconventional chemicals.)
Some economists developed quality-adjusted indices that show larger long-
term increases in pesticide use than the USEPA quantity estimates, because the
materials used and their properties, such as toxicity and persistence, have changed
over time. In particular, pesticides applied at rates of a fraction of a pound per
acre have replaced pesticides applied at rates of several pounds per acre to control
the same pests. Ball et al. [1] and Fernandez-Cornejo and Jans [7] developed
quality-adjusted indices that showed that use increased by about threefold from
1968 to 1992, while unadjusted USEPA quantity estimates increased by 1.6 times.
Padgitt and others [8,9] developed aggregate use estimates for major crops
from 1964 to 1997 from U.S. Department of Agriculture (USDA) pesticide sur-
veys.* Use on these crops grew from 215 million lb a.i. in 1964 to 572 million
* Estimates in Table 1 and Figure 2 were constructed for corn, soybeans, wheat, cotton, potatoes,
other vegetables, citrus fruit, apples, and other fruits and berries from USDA surveys conducted
between 1964 and 1997. In years when the surveys did not include all states producing the crop, the
estimates assume use rates similar to those of surveyed states. These estimates account for 52–56%
of cropland acres for the 1964, 1966, and 1971 estimates and 67–70% of cropland acres for the
1982–1997 estimates. These estimates exclude use on such major crops as peanuts, rice, sorghum,
barley, oats, rye, other grains, tobacco, alfalfa, hay, pasture, and nuts, because they were not surveyed
or were surveyed only in a few years after 1982, making estimation of use after that date difficult. The
excluded crop uses contribute to the differences between these estimates and the USEPA estimates [6].
These estimates also exclude sulfur, oils, and other nonconventional pesticides as well as postharvest
pesticide use.
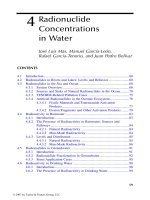
F
IGURE
2 Pesticide use on major crops. (Data from Refs. 8 and 9.)
lb in 1982, fell to 478 million lb in 1991, and rose to a high of 588 million lb
in 1997 (Fig. 2 and Table 1). Major components in that trend were:
1. An increase in pesticide use on corn and soybeans from 50 million lb
a.i. in 1964 to 421 million lb a.i. in 1982, and then a decline to 312
million lb a.i. in 1997.
2. An increase in pesticide use on potatoes and other vegetables from 27
million lb a.i. in 1964 to 139 million lb in 1997.
3. An increase in pesticide use on cotton from 95 million lb a.i. in 1964
to 112 million lb a.i. in 1971 and then a decline to 68 million lb a.i. in
1997—a trend heavily influenced by changes in insecticide ingredients
applied.
4. An increase in herbicide use on major crops from 48 million lb a.i. in
1964 to 430 million lb a.i. in 1982 and then a decline to 366 million
lb a.i. in 1997.
5. An increase in insecticide use from 123 million lb a.i. in 1964 to 132
million lb a.i. in 1976, a dramatic fall to 83 million lb a.i. in 1982, and
a continuing decline to 50–60 million lb in the 1990s.
6. An increase in fungicide use from 22 million lb a.i. in 1964 to 51
million lb a.i. in 1997.
7. An increase in use of “other pesticides” from 21 million lb a.i. in 1964
to 110 million lb a.i. in 1997.
8. A change in the mix of pesticides used over time, which reduced aver-
age application rates per acre, especially for herbicides and insecti-
cides. Also, during the 1990s, the number of pesticide treatments and
ingredients applied per acre increased and an increasing proportion of
treatments were made after planting rather than before or at planting.
2.2 Insecticides
In the 1950s, insecticides were widely used on a variety of high value crops
including cotton, tobacco, fruits, potatoes, and other vegetables (Table 2) [10–
15]. Somewhat later, insecticide use on other major field crops, particularly corn,
increased rapidly. Insecticides were applied to less than 10% of corn acreage
during the mid-1950s but to 35–40% by 1976. Since the mid-1980s, the propor-
tion of corn acres treated fell from 45% to 25–30% in the 1990s. The proportion
of cotton, potatoes, and many fruit and vegetable acres treated with insecticides
remained high in the 1990s (Tables 2–4) [16,17].
The quantity of insecticide applied to major crops increased from 1964 to
1976 but in 1997 declined to less than 50% of that in 1976 (Table 1). Cotton
and corn accounted for most of that decline. Cotton insecticide quantity fell from
73 million lb a.i. in 1971 to 64 million lb in 1976 and to 19 million lb in 1982,
and varied between 10 and 30 million lb from 1982 to the late 1990s. Corn
insecticide quantity declined from 30 million lb a.i. in 1982 to less than 21 million
lb a.i. in the 1990s.
The decline in insecticide use reflects the changes in the compounds used,
with reduced per-acre application rates. In the 1960s and 1970s, organophos-
phates and carbamates replaced organochlorines (Table 5) [12,18–21].* (See
footnotes to Table 5 for examples of pesticides in the major classes.) Synthetic
pyrethroids were rapidly adopted after their introduction in the late 1970s and
accounted for over 20% of insecticide acre-treatments by 1982.† However, insec-
ticide groups used in the 1960s—the organochlorines, organophosphates, and
carbamates—still accounted for over 90% of insecticide quantity, and many ac-
tive ingredients used in the 1960s continued to be widely used in the 1990s.
The use of other new, low-rate insecticides, including abamectin (an antibiotic),
diflubenzuron (a benzoylphenyl urea), and imidacloprid (a chloronicotinyl), in-
creased during the 1990s. Synthetic pyrethroids and newer insecticide groups
accounted for less than 5% of insecticide quantity in 1997 but because of their low
rates of application, accounted for about one-third of insecticide acre-treatments.
The adoption of genetically modified crops may influence future insecticide
use trends, but emerging concerns about their pest control, environmental, and
* The estimates for insecticide and herbicide families are restricted to use on corn, cotton, soybeans,
wheat, and potatoes, which were surveyed in more years than the other major crops.
† Acre-treatments are the number of acres treated with a pesticide multiplied by the average number
of treatments per acre.
T
ABLE
1 Estimated Quantity (Millions of Pounds) of Pesticide Active Ingredients Applied to Selected U.S. Crops,
1964–1997
a
Commodity 1964 1966 1971 1976 1982 1990 1991 1992 1993 1994 1995 1996 1997
Herbicides
Corn 25.5 46.0 101.1 207.1 243.4 217.5 210.2 224.4 202.0 215.6 186.3 211.6 211.8
Cotton 4.6 6.5 19.6 18.3 20.7 21.1 26.0 25.8 23.6 28.6 32.9 27.7 29.2
Wheat 9.2 8.2 11.6 21.9 19.5 16.6 13.6 17.4 18.3 20.7 20.0 30.5 24.3
Soybeans 4.2 10.4 36.5 81.1 133.2 74.4 69.9 67.4 64.1 69.3 68.1 77.8 83.7
Vegetables 3.5 5.7 5.6 7.2 5.9 7.3 7.2 8.0 8.2 9.1 10.1 10.6 9.9
Fruit 1.2 2.6 1.3 6.0 7.4 7.8 8.2 7.6 7.3 7.4 7.5 7.5 7.5
Total 48.2 79.4 175.7 341.6 430.1 344.7 335.1 350.6 323.5 350.7 324.9 365.7 366.4
Insecticides
Corn 15.7 23.6 25.5 32.0 30.1 23.2 23.0 20.9 18.5 17.3 15.0 16.1 17.5
Cotton 78.0 64.9 73.4 64.1 19.2 13.6 8.2 15.3 15.4 23.9 30.0 18.7 19.3
Wheat 0.9 0.9 1.7 7.2 2.9 1.0 0.2 1.2 0.2 2.0 0.9 2.3 1.2
Soybeans 5.0 3.2 5.6 7.9 11.6 0.0 0.4 0.4 0.3 0.2 0.5 0.4 0.8
Vegetables 9.8 11.2 11.1 9.0 8.3 8.3 8.1 9.0 9.2 10.1 8.8 7.9 8.6
Fruit 13.9 15.5 10.4 11.6 10.6 11.3 12.9 13.3 14.4 14.5 14.7 13.9 13.2
Total 123.3 119.3 127.7 131.8 82.7 57.4 52.8 60.1 58.0 68.0 69.9 59.3 60.6
Fungicides
Corn 0.0 0.0 0.0 0.0 0.1 0.0 0.0 0.0 0.0 0.0 0.0 0.0 0.0
Cotton 0.2 0.4 0.2 0.0 0.2 1.0 0.7 0.8 0.7 1.1 1.0 0.5 0.9
Wheat 0.0 0.0 0.0 0.9 1.1 0.2 0.1 1.2 0.7 1.0 0.5 0.2 0.1
Soybeans 0.0 0.0 0.0 0.2 0.1 0.0 0.0 0.1 0.0 0.0 0.0 0.0 0.0
Vegetables 7.7 7.6 9.8 9.3 10.7 15.7 16.3 20.9 23.1 29.6 32.4 32.2 35.2
Fruit 14.3 15.3 19.3 16.3 13.1 10.9 12.3 12.0 12.1 12.9 13.5 13.9 14.4
Total 22.2 23.3 29.3 26.7 25.3 27.8 29.4 35.0 36.6 44.6 47.4 46.8 50.6
Other pesticides
Corn 0.1 0.5 0.4 0.5 0.1 0.0 0.0 0.0 0.0 0.0 0.0 0.0 0.0
Cotton 12.4 14.2 18.7 12.7 9.3 15.2 15.5 15.8 12.7 15.6 19.7 18.7 18.5
Wheat 0.0 0.0 0.2 0.0 0.0 0.0 0.0 0.0 0.0 0.0 0.0 0.0 0.0
Soybeans 0.0 0.0 0.1 2.0 2.4 0.0 0.0 0.0 0.0 0.0 0.0 0.0 0.0
Vegetables 5.9 0.6 9.8 13.7 21.4 52.4 44.2 56.5 67.2 84.6 79.7 81.6 85.5
Fruit 2.9 3.4 2.4 1.9 0.9 0.4 0.4 0.4 0.1 0.9 1.6 3.8 6.2
Total 21.3 18.7 31.6 30.8 34.1 68.0 60.1 72.7 80.0 101.1 101.0 104.1 110.2
All pesticides
Corn 41.2 70.1 127.0 239.5 273.7 240.7 233.2 245.2 220.5 233.0 201.3 227.7 229.3
Cotton 95.3 86.0 111.9 95.2 49.5 50.9 50.3 57.6 52.3 69.1 83.7 65.6 68.0
Wheat 10.1 9.2 13.6 30.0 23.5 17.8 13.8 19.7 19.1 23.8 21.5 32.9 25.7
Soybeans 9.2 13.7 42.2 91.1 147.4 74.4 70.4 67.8 64.4 69.5 68.7 78.1 84.5
Vegetables 26.9 25.0 36.2 39.0 46.3 83.6 75.9 94.4 107.8 132.4 131.1 132.3 139.2
Fruit 32.4 36.6 33.4 35.8 32.0 30.2 33.9 33.4 34.0 35.6 37.1 39.1 41.2
Total 215.1 240.6 364.3 530.6 572.4 497.6 477.5 518.1 498.1 563.4 543.4 575.7 587.9
a
Estimates include preharvest use of synthetic organic pesticides on corn, soybeans, wheat, cotton, potatoes, other vegetables, citrus
fruit, apples, and other fruits and berries. They cover 52–56% of cropland for 1964, 1966, and 1971 and 67–70% for the 1982–1997
estimates. In years when the surveys did not include all states producing the crop, the estimates assume similar use rates for those
states. Estimates exclude sulfur, oils, and other nonconventional pesticides. See footnote in Section 2.1 for more details.
Source: Refs. 8 and 9.
T
ABLE
2 Share of Crop Acres (Percent) Treated with Insecticides
Other Other Other
Year Corn Cotton Soybeans Wheat Sorghum Apple Citrus deciduous fruits/nuts Potatoes vegetables Tobacco Peanuts Rice
1952 1 48 NA NA NA —
a
—
a
—
a
1756147NA
1958 6 66 NA NA NA NA NA NA NA 80 74 58 NA NA
1966 33 54 4 2 2 92 97 72 59 89 56 81 70 10
1971 35 61 8 7 39 91 88 87 71 77 56 77 87 35
1976 38 60 7 14 27 NA NA NA NA NA NA 76 55 11
1979 NA 48 NA NA NA NA NA NA NA 94 74 NA NA NA
1980 43 NA 11 NA 4 NA NA NA NA NA NA NA NA NA
1982 37 36 12 3 26 NA NA NA NA NA NA 85 48 16
1984 42 63 8 NA NA NA NA NA NA NA NA NA NA NA
1985 45 65 7 5 NA NA NA NA NA NA NA NA NA NA
1986 41 NA 4 7 NA NA NA NA NA NA NA NA NA NA
1987 41 61 3 7 17 NA NA NA NA NA NA NA NA NA
1988 35 61 8 4 NA NA NA NA NA 89 NA NA NA 18
1989 32 68 3 11 NA NA NA NA NA 91 NA NA NA 22
1990 31 NA NA 4 NA NA NA NA NA 88 NA NA NA 10
1991 31 66 2 8 16 NA NA NA NA 92 NA NA 56 16
1992 29 65 1 6 NA NA NA NA NA 88 —
c
NA NA 11
1993 28 65 2 3 NA 99 —
b
—
b
—
b
86 NA NA NA NA
1994 27 71 1 13 NA NA NA NA NA 83 —
c
NA NA NA
1995 26 75 2 7 NA 98 —
b
—
b
—
b
85 NA NA NA NA
1996 29 79 1 13 NA NA NA NA NA 92 —
c
96 NA NA
1997 30 74 2 7 NA 96 —
b
—
b
—
b
91 NA NA NA NA
NA ϭ Not available.
a
Individual crop estimates not available; but Eichers et al. [12] presented estimates of the percent of total fruit and nut acres treated
with insecticides: 82% in 1952, 81% in 1958, 87% in 1966, and 90% in 1971.
b
See Table 3 for more detailed fruit information.
c
See Table 4 for more detailed vegetable information.
Source: Refs. 10–15.
T
ABLE
3 Fruit-Bearing Acreage Treated with Pesticides, Major Producing States, 1993–1997
Percent of planted area receiving applications
Planted No. of
Herbicide Insecticide Fungicide Other
acres states
Fruit (1000s) surveyed
a
1993 1995 1997 1993 1995 1997 1993 1995 1997 1993 1995 1997
Grapes, all types 894 6 64 74 75 64 67 60 75 90 87 21 27 22
Oranges 833 2 94 97 91 90 94 88 57 69 65 14 13 14
Apples 351 10 43 63 60 99 98 96 88 93 90 56 59 56
Grapefruit 159 2 93 92 91 93 89 91 85 86 71 5 3 4
Peaches 136 9 49 66 54 99 97 82 98 97 84 3 4 6
Prunes 101 1 40 46 48 93 73 71 84 84 58 —
b
44
Avocados 64 2 50 29 44 12 15 33 10 9 12 20 —
b
20
Pears 68 4 44 65 57 98 96 90 92 90 85 59 44 52
Lemons 48 1 45 83 78 94 73 73 87 64 66 39 42 56
Cherries, sweet 48 4 71 61 61 88 92 84 14 93 80 34 48 45
Plums 44 1 49 48 74 98 75 85 99 71 69 —
b
—
b
8
Olives 37 1 70 54 53 89 14 16 79 30 30 —
b
—
b
—
b
Cherries, tart 32 4 67 67 78 27 94 98 33 98 99 59 68 75
Nectarines 38 1 84 82 73 98 97 82 95 96 79 —
b
—
b
—
b
Tangerines 39 1 84 83 80 87 90 79 59 73 56 4 21 3
Blueberries 34 4 75 73 67 91 86 83 81 87 88 2 8 14
Apricots 20 1 48 34 30 94 83 62 98 92 52 —
b
—
b
1
Figs 17 1 89 54 48 17 —
b
1—
b
—
b
—
b
—
b
—
b
—
b
Raspberries 13 2 83 92 90 80 83 90 92 90 95 —
b
—
b
5
Tangelos 13 1 95 99 96 97 96 97 89 82 91 6 8 27
Temples 7 1 99 99 96 98 98 98 92 97 94 2 —
b
—
b
Kiwi 6 1 63 65 41 11 13 20 —
b
—
b
15 —
b
—
b
—
b
Dates 5 1 39 29 —
b
75 12 4 40 54 18 —
b
—
b
—
b
a
Surveys were conducted in major producing states; the set of minor producing states surveyed was modified slightly between years.
b
Insufficient reports to estimate.
Source: Ref. 16.
T
ABLE
4 Vegetable Acreage Treated with Pesticides, Major Producing States, 1992–1996
Percent of planted area receiving applications
Planted Number Herbicide Insecticide Fungicide Other
acres of states
Vegetable (1000s) surveyed
a
1992 1994 1996 1992 1994 1996 1992 1994 1996 1992 1994 1996
Percent of acres
Sweet corn, proc. 417 5 92 94 90 75 66 74 19 9 11 2 3 2
Tomatoes, proc. 318 1 90 76 78 81 71 71 92 86 90 27 41 48
Green peas, proc. 222 5 91 93 89 49 50 35 1 —
b
2—
b
—
b
—
b
Lettuce, head 195 2 68 60 52 97 100 98 76 77 76 1 —
b
1
Watermelon 164 6 37 41 43 53 45 41 71 64 65 4 4 6
Sweet corn, fresh 146 8 75 79 79 84 81 89 41 36 42 —
b
—
b
—
b
Snap beans, proc. 134 4 95 91 90 68 58 72 55 41 49 —
b
—
b
—
b
Onion 127 8 86 88 88 79 76 83 83 89 89 13 21 20
Cantaloupe 113 3 44 41 36
c
78 82 85
c
73 41 47
c
5101
c
Honeydews —
c
—
c
29 21 NA 84 88 NA 51 40 NA 10 12 NA
Carrots 108 6 67 72 89 37 34 40 79 71 78 13 12 21
Broccoli 106 1 58 67 64 95 96 96 31 36 37 1 2 1
Tomatoes, fresh 89 6 75 52 54 95 94 93 86 91 90 NA 58 56
Lettuce, other 74 2 59 46 52 92 89 86 72 60 73 —
b
—
b
1
Cucumbers, proc. 72 6 74 77 76 34 48 36 32 30 34 2 4 11
Asparagus 72 3 86 91 88 64 70 56 28 23 33 —
b
—
b
—
b
Snap beans, fresh 67 7 52 60 49 77 79 75 62 63 73 3 —
b
—
b
Peppers, bell 65 5 65 57 67 85 92 88 66 73 75 34 36 43
Cabbage, fresh 64 7 49 55 62 96 97 94 53 60 57 1 2 3
Cucumbers, fresh 49 8 54 45 60 75 74 68 66 81 77 13 8 17
Strawberries 45 7 39 41 37 86 88 85 87 89 86 56 69 72
Cauliflower 44 2 44 62 31 94 99 97 21 51 18 2 2 1
Lima beans, proc. 31 5 NA 55 49 NA 84 60 NA 24 18 NA —
b
—
b
Celery 26 2 82 64 68 100 100 97 98 99 86 12 3 —
b
Spinach, fresh 12 3 57 52 56 73 75 72 63 46 49 5 —
b
3
a
Surveys were conducted in major producing states; the set of minor producing states surveyed was modified slightly between years.
b
Insufficient reports to estimate.
c
Cantaloupes and honeydew melons included with other melons in 1996.
Source: Ref. 17.
T
ABLE
5 Shares (Percent) of Insecticide Use by Class
a
Insecticide class 1964 1966 1971 1976 1982 1991 1997
Quantity
Carbamates
b
7 4 10 16 15 11 14
Organochlorines
c
73 73 51 31 9 2 2
Organophosphates
d
20 23 39 49 71 80 79
Pyrethroids
e
0000 433
Others 0 0 0 4 Ͻ15 1
Acre-treatments
f
Carbamates NA NA NA NA 14 11 13
Organochlorines NA NA NA NA 5 2 2
Organophosphates NA NA NA NA 60 57 56
Pyrethroids NA NA NA NA 21 27 25
Others NA NA NA NA Ͻ13 4
NA ϭ Not available.
a
Estimated for corn, cotton, potatoes, soybeans, and wheat; excludes oils, sulfur, and
other inorganics.
b
Examples include aldicarb, carbaryl, carbofuran, formetanate, methomyl, and ox-
amyl.
c
Examples include dicofol, endosulfan, methoxychlor, and many materials no longer
registered: aldrin, chlordane, deldrin, DDT, and toxaphene.
d
Examples include azinphos-methyl, chlorpyrifos, fonofos, malathion, methyl para-
thion, mevinphos, parathion, phorate, and terbufos.
e
Examples include permethrin, cypermethrin, tralomethrin, deltamethrin, cyhalothrin,
cyfluthrin, and esfenvalerate.
f
Total acreage treated with a pesticide multiplied by average number of applications
per acre.
Source: Refs. 12, 18–21.
health effects could limit further adoption. Crops that include a gene that produces
the Bacillus thuringiensis (Bt) toxin to control Lepidopteran pests were intro-
duced in the mid-1990s. This technology helps to control the European corn
borer, a target for insecticides on a small portion of corn acreage, and bollworm,
tobacco budworm, and pink bollworm, major targets for cotton insecticide use.
USDA surveys showed that Bt-treated seed was planted on 19% of corn acreage
and 17% of cotton acreage in the surveyed states in 1998 [22]. Bt-treated seed
was planted on 35% of cotton acreage in the Mississippi Delta states, where a
major portion of insecticide treatments is for bollworms and budworms.
2.3 Herbicides
Herbicide quantity increased rapidly from the late 1950s before stabilizing in the
1980s. Approximately 10% of corn and wheat and 5% of cotton acres were treated
with herbicides in 1952 (Table 6). Herbicide use on corn, cotton, and soybeans
(for which there are no data before 1966) stabilized at 90–97% of acres planted
since 1980. Winter wheat herbicide use has varied in the range of 30–60% of
planted acreage since 1986, while spring wheat use has varied between 80% and
95%. Limited data show similar increases for potatoes, peanuts, rice, and sor-
ghum as well as for other fruits and vegetables (Tables 3, 4, and 6).
Herbicide quantity on the major crops increased dramatically between 1964
and 1982 (by 8.9-fold), but in the 1990s was 15–20% lower than estimated for
1982 (Table 1). The quantity applied to corn and soybeans, which account for
the major portion of herbicide use, grew from 30 million lb a.i. in 1964 (62%
of use on the major crops) to 377 million lb a.i. in 1982 (88%), before falling
to 296 million lb (81%) in 1997. The quantity of herbicides used on cotton, wheat,
vegetables, and fruit generally increased between 1964 and 1997, but these crops
accounted for a declining share of herbicide use.
Much of the decline in quantity since 1982 was due to reduced crop acreage,
particularly during the 1980s because the proportion of acreage treated with herbi-
cides remained high, and to lower application rates for commonly used herbicides
such as atrazine. But the change in the herbicide compounds used, which also
reduced average application rates per acre, contributed (Table 7) [12,18–21].
Shares of total herbicide quantity declined for phenoxys, phenyl ureas, and benzo-
ics between 1964 and 1997 and for carbamates since 1982. (See footnotes for
Table 7 for examples of herbicides in each class.) During this time, shares grew
significantly for amides and anilines. The share for triazines increased until 1976,
then declined, but still exceeded 20% in the 1990s. New families of herbicides
introduced since the 1970s account for increasing shares of use and include phos-
phinic acids, bipyridyls, benzothiadiazoles, benzoxazoles, oximes, pyridazinones,
pyridines, sulfonyl ureas, and imidazolinones. Herbicide groups reported in the
1960s accounted for over 80% of herbicide applied in 1997, but families not
reported before 1976 accounted for about 40% of acre-treatments. In particular,
the shares for phosphinic acids and sulfonyl ureas have grown dramatically since
1982.
The adoption of genetically modified, herbicide-tolerant crops may influ-
ence future herbicide use trends by encouraging the application of specific herbi-
cides, which might otherwise kill the crop, to control weeds. Emerging concerns
about environmental and health effects and the development of herbicide-resistant
weed species could limit further adoption. Currently, herbicide-tolerant corn, cot-
ton, soybeans, and canola have been developed. The most commonly planted are
glyphosate-tolerant, but glufosinate ammonium–tolerant corn and bromoxynil-
tolerant cotton are also available. USDA surveys showed that herbicide-tolerant
seed was planted on 18% of corn, 44% of soybean, and 26% of cotton acreage
in surveyed states in 1998 [22]. These are large increases from 3% of corn, 7%
of soybeans, and less than 1% of cotton acreage in 1996. The increased acreage
T
ABLE
6 Share (Percent) of Crop Acres Treated with Herbicides
Winter Spring Other Other
Year Corn Cotton Soybeans wheat wheat Sorghum Apples Citrus deciduous fruit/nuts Potatoes Vegetables Tobacco Peanuts Rice
1952 11 5 NA 12 —
a
NA NA NA NA NA NA NA NA NA NA
1958 27 7 NA 20 —
a
NA NA NA NA NA NA NA NA NA NA
1966 57 52 27 28 —
a
30 16 29 13 18 59 28 2 63 52
1971 79 82 68 41 —
a
46 35 22 19 34 51 40 7 92 95
1976 90 84 88 38 —
a
51 NA NA NA NA NA NA 55 93 83
1979 NA 91 NA NA NA NA NA NA NA NA 73 NA NA NA NA
1980 93 NA 92 NA NA 61 NA NA NA NA NA NA NA NA NA
1982 95 97 93 42 —
a
59 NA NA NA NA NA NA 71 93 98
1984 95 93 94 NA NA NA NA NA NA NA NA NA NA NA NA
1985 96 94 95 44 —
a
NA NA NA NA NA NA NA NA NA NA
1986 96 NA 96 53 86 NA NA NA NA NA NA NA NA NA NA
1987 96 94 95 61 89 82 NA NA NA NA NA NA NA NA NA
1988 96 95 96 53 83 NA NA NA NA NA NA NA NA NA 98
1989 97 93 96 61 91 NA NA NA NA NA 77 NA NA NA 97
1990 95 95 95 34 89 NA NA NA NA NA 79 NA NA NA 98
1991 96 92 97 30 94 78 NA NA NA NA 91 NA NA 97 95
1992 97 91 98 35 91 NA NA NA NA NA 93 —
c
NA NA 97
1993 98 92 98 45 95 NA 43 —
b
—
b
—
b
91 NA NA NA NA
1994 98 94 98 50 96 NA NA NA NA NA 92 —
c
NA NA NA
1995 97 97 98 59 95 NA 63 —
b
—
b
—
b
94 NA NA NA NA
1996 93 93 97 55 83 NA NA NA NA NA 91 —
c
75 NA NA
1997 97 96 98 47 82 NA 60 —
b
—
b
—
b
88 NA NA NA NA
NA ϭ Not available.
a
Spring wheat information combined with winter wheat information.
b
See Table 3 for more detailed fruit information.
c
See Table 4 for more detailed vegetable information.
Source: Refs. 10–15.
T
ABLE
7 Shares (Percent) of Herbicide Use by Class
a
Herbicide class 1964 1966 1971 1976 1982 1991 1997
Quantity
Arsenicals
b
224 1121
Phenoxys
c
43 32 12 8 4 4 6
Phenyl ureas
d
434 4221
Amides
e
0 4 24 30 31 35 35
Triazines
f
23 30 32 32 26 29 26
Dintro group
g
413 1100
Carbamates
h
10 9 5 11 17 9 3
Anilines
i
278 9111213
Benzoics
j
6106 2223
Phosphinic acids
k
000Ͻ1126
Sulfonyl ureas
l
000 0Ͻ1 Ͻ1 Ͻ1
Other new families
m
000 2336
Others 6 2 2 Ͻ1 Ͻ1 Ͻ1 Ͻ1
Acre-treatments
n
Arsenicals NA NA NA NA 1 1 1
Phenoxys NA NA NA NA 13 10 11
Phenyl ureas NA NA NA NA 4 2 1
Amides NA NA NA NA 20 16 12
Triazines NA NA NA NA 26 24 17
Dinitro group NA NA NA NA 2 0 0
Carbamates NA NA NA NA 6 2 1
Anilines NA NA NA NA 15 13 10
Benzoics NA NA NA NA 5 6 7
Phosphinic acids NA NA NA NA 1 2 8
Sulfonyl ureas NA NA NA NA Ͻ1914
Other new families NA NA NA NA 7 15 18
Others NA NA NA NA Ͻ1 Ͻ1 Ͻ1
NA ϭ Not available.
a
Estimated for corn, cotton, potatoes, soybeans, and wheat.
b
DMSA, MSMA.
c
2,4-D, 2,4-DB, MCPA, MCPB.
d
Diuron, linuron, fluometuron, terbacil.
e
Alachlor, acetochlor, metolachlor, propachlor.
f
Atrazine, cyanazine, propazine, simazine, metribuzin, ametryne.
g
Dinoseb, DNBP.
h
Butylate, EPTC, pebulate.
i
Oryzalin, pendimethalin, ethalfluralin, trifluralin.
j
Chloramben, dicamba, naptalam.
k
Glyphosate, glufosinate-ammonium.
l
Chlorsulfuron, halosulfuron, metsulfuron, nicosulfuron, primisulfuron.
m
Includes bipyridyls (paraquat), benzothiadiazoles (bentazon), benoxazoles (fenaxa-
prop), imidizolinones (imazaquin, imazethapyr), diphenyl ethers (acifluorfen, diclofop,
lactofen, oxyfluorfen), oximes (clethodim, clomazone, sethoxydim), pyridines (clorpyr-
alid, fluazifop), pyridazinones (norfluorazon), and others that first appeared in pesticide
use surveys since 1976.
n
Sum of acreage treated with a pesticide multiplied by average number of applications
per acre.
Source: Refs. 12, 18–21.
of herbicide-tolerant crops may be a factor in the dramatic increase of glyphosate
(the primary phosphinic acid) use in the 1990s.
2.4 Fungicides
The estimated quantity of fungicides used on the major crops increased by about
2.3 times between 1964 and 1997 (Table 1). Fruits and vegetables, including
potatoes, accounted for over 94% of fungicide use over that time period. Most
of the increase occurred on potatoes and vegetables—more than 4.5-fold between
1964 and 1997. Potato acreage treated with fungicides increased steadily from
24% in 1966 to 85–98% in the 1990s (Table 8). An estimated 20% of the acres
of “other vegetables” were treated with fungicides in 1966 and 1971, and by the
1990s much higher proportions of the acreage of many vegetables, such as celery,
tomatoes, lettuce, melons, strawberries, and green peas, were treated (Table 4).
By the early 1970s, a high proportion of fruit acreage was treated with fungicides,
including about 70% of apple acreage and over 50% of citrus acreage. During
the 1990s, somewhat higher proportions of apple, citrus, and other fruit crop
acres were treated (Table 3).
As is the case for herbicides and insecticides, the change in fungicide com-
pounds used over time contributed to lower per-acre application rates (Table 9)
[12,18–21]. (See footnotes to Table 9 for more widely used fungicides in each
class.) Shares of quantity declined for inorganics (primarily copper compounds)
and dithiocarbamates since the 1960s but increased for phthalimides.* However,
pthalimides, inorganic materials, and dithiocarbamates together accounted for
over 90% of fungicide quantity in the 1960s and still accounted for almost 90%
in 1997. The shares of newer groups, such as benzimidazoles, azoles, dicarboxi-
mides, metal organics, and acyclalanines accounted for about 10% of quantity
but 35% of acre-treatments in 1997.
2.5 Other Pesticides
The estimated quantity of “other pesticides” used on the major crops increased
by over fivefold between 1964 and 1997 (Table 1). This category includes soil
fumigants, desiccants, harvest aids, and growth regulators. For the crops included,
cotton, fruits, and vegetables accounted for virtually all of the quantity in the
late 1990s.† Growth in the use of fumigants on potatoes and other vegetables
and of sulfuric acid (a harvest aid) on potatoes accounts for much of the increased
* Estimates of shares of fungicide families include use on fruits and vegetables as well as corn,
soybeans, cotton, wheat, and potatoes.
† Tobacco is a major use of “other pesticides” not included in these totals, but the proportional growth
in use has not been large. Estimated use on tobacco was 18 million lb in 1964, 19 million lb in 1976,
and 25 million lb in 1996.
T
ABLE
8 Share (Percent) of Crop Acres Treated with Fungicides (Excluding Seed Treatments)
Winter Spring Other Other Other
Year Corn Cotton Soybeans wheat wheat Apples Citrus deciduous fruits/nuts Potatoes vegetables Tobacco Peanuts Rice
1966 Ͻ12 Ͻ1 Ͻ1—
a
72 73 58 39 24 20 7 35 Ͻ1
1971 1 4 2 Ͻ1—
a
67 58 54 46 49 18 7 85 Ͻ1
1976 1 8 3 Ͻ1—
a
NA NA NA NA NA NA 30 76 Ͻ1
1979 NA NA NA NA NA NA NA NA NA 64 37 NA NA NA
1982 Ͻ12 1 1—
a
NA NA NA NA NA NA 60 79 3
1988 NA NA NA NA NA NA NA NA NA 62 NA NA NA 14
1989 NA NA NA NA NA NA NA NA NA 69 NA NA NA 22
1990 NA NA NA 3 NA NA NA NA NA 67 NA NA NA 12
1991 Ͻ16 Ͻ113NANANANA69NANA89
1992 Ͻ17 Ͻ124NANANANA72—
c
NA NA 21
1993 Ͻ16 Ͻ12388—
b
—
b
—
b
76 NA NA NA NA
1994 Ͻ110 Ͻ112NANANANA92—
c
NA NA NA
1995 Ͻ18 Ͻ11393—
b
—
b
—
b
85 NA NA NA NA
1996 Ͻ16 Ͻ11Ͻ1NANA NA NA 89 —
c
49 NA NA
1997 Ͻ17 Ͻ11Ͻ190—
b
—
b
—
b
98 NA NA NA NA
NA ϭ Not available.
a
Spring wheat information combined with winter wheat information.
b
See Table 3 for more detailed fruit information.
c
See Table 4 for more detailed vegetable information.
Source: Refs. 10–15.
T
ABLE
9 Share (Percent) of Fungicide Use by Class
a
Fungicide class 1964 1966 1971 1997
Quantity
Phthalimides
b
23 29 21 31
Dithiocarbamates
c
40 42 32 34
Inorganics
d
28 23 40 24
Dinocap, dodine, quinones 4540
Acyclalanines
e
0001
Azoles
f
0001
Benzimidazoles
g
0001
Dicarboximides
h
0002
Metal organics
i
0002
Other 5244
Acre-treatments
j
Phthalimides NA NA NA 27
Dithiocarbamates NA NA NA 22
Inorganics NA NA NA 15
Dinocap, dodine, quinones NA NA NA 0
Acyclalanines NA NA NA 5
Azoles NA NA NA 4
Benzimidazoles NA NA NA 13
Dicarboximides NA NA NA 3
Metal organics NA NA NA 11
Other NA NA NA 10
a
Includes use on fruit and vegetables as well as on corn, soybeans, cotton, wheat, and
potatoes; excludes sulfur use.
b
Includes captan, chlorothalonil.
c
Includes maneb, mancozeb, metiram, thiram.
d
Primarily copper compounds; excludes sulfur.
e
Metalaxyl.
f
Includes fenbuconazole, propiconazole, myclobutanil, triadimefon, and others.
g
Includes benomyl, thiophanate-methyl, and thiabendazole.
h
Includes iprodione, vinclozolin.
i
Includes fosetyl-aluminum and triphenlytin hydroxide.
j
Total acreage treated with a pesticide multiplied by average number of applications
per acre.
Source: Refs. 12, 18–21.
quantity. These materials are used at very high per-acre rates and accounted for
85% of the quantity of other pesticides but less than 5% of the acres treated in
1997. In 1997, about 30 million lb of sulfuric acid, which was not reported in
the early USDA surveys, was used on only 14% of potato acreage. The quantity
of fumigants (methyl bromide, 1,3-D, chloropicrin, and metam-sodium) on the
T
ABLE
10 Share (Percent) of Crop Acres Treated with Other Pesticides
Other Other Other
Year Corn Cotton Soybeans Wheat
a
Sorghum Apples Citrus deciduous fruits/nuts Potatoes vegetables Tobacco Peanuts Rice
1966 Ͻ126 Ͻ1 Ͻ1 Ͻ12838 5 1 9 Ͻ169Ͻ1 Ͻ1
1971 Ͻ136 Ͻ1 Ͻ1 Ͻ12666 5 3 17 24 85Ͻ1 Ͻ1
1976 1 34 1 Ͻ1 Ͻ1NANANA NA NA NA 86 6
1979 NA NA NA NA NA NA NA NA NA 51 NA NA NA NA
1982 Ͻ130 1 Ͻ1 Ͻ1NANANA NA NA NA 93 13Ͻ1
1989 NA 50 NA NA NA NA NA NA NA NA NA NA NA NA
1991 Ͻ158 Ͻ1 Ͻ1 Ͻ1NANANA NA 45 NA NA 5
1992 Ͻ148 Ͻ1 Ͻ1NANANANA NA 43 —
c
NA NA 1
1993 Ͻ163 Ͻ1 Ͻ1NA56—
b
—
b
—
b
53 NA NA NA NA
1994 Ͻ166 Ͻ1 Ͻ1NANANANA NA 60 —
c
NA NA NA
1995 Ͻ156 Ͻ1 Ͻ1NA59—
b
—
b
—
b
57 NA NA NA NA
1996 Ͻ160 Ͻ1 Ͻ1NANANANA NA 56 —
c
98 NA NA
1997 Ͻ173 Ͻ1 Ͻ1NA56—
b
—
b
—
b
65 NA NA NA NA
NA ϭ Not available.
a
Spring wheat information combined with winter wheat information.
b
See Table 3 for more detailed fruit information.
c
See Table 4 for more detailed vegetable information.
Source: Refs. 10–15.
included crops increased from about 10 million lb during the 1964–1971 period
to over 60 million lb in the 1990s. The use of growth regulators, desiccants, and
harvest aids on cotton and other crops account for most of the acreage treated
with “other pesticides.”
Potatoes and vegetables have accounted for most of the increase in the
quantity of “other pesticides” used (by almost 15 times). The proportion of potato
acreage treated with such materials increased from 9% in 1966 to 55–60% in
the late 1990s (Table 10). Limited information indicates that the acreage of other
vegetable crops treated with these materials has also increased. The 1971 survey
estimated that 24% of other vegetables were treated with such materials. Cur-
rently, a large proportion of tomato, strawberry, and pepper acres are treated
with “other pesticides,” including methyl bromide and other fumigants (Table
4). Cotton remains a major site for growth regulators and harvesting aids, but
the quantity used increased only 50% from 1964 to 1997. The percent of cotton
acreage treated increased from 26% in 1966 to over 60% in the late 1990s (Table
10). The increase in percent of acreage treated has been offset by changes from
older materials, such as arsenic acid, sodium chlorate, and tribufos, to new ones
applied at lower per-acre rates, such as ethephon, mepiquat chloride, thidiazuron,
paraquat, and dimethepin. Growth regulators are also used on various fruit crops,
including apples, pears, lemons, and tart cherries (Table 3).
3 ECONOMIC FACTORS AFFECTING PESTICIDE USE
Various economic factors affect farmers’ choices of pest control practices and
how intensively they use them. According to economic efficiency criteria, pro-
ducers should choose the combination of pest control methods that maximizes
the difference between the value of pest damage reductions and control costs.
They should increase the use of pest control inputs until the marginal value of
damage reduction (the value of the last unit used) equals the marginal cost. As
a result, the prices of crops, pesticides, and other practices should influence the
use of pesticides and other pest control practices. Fruits and vegetables for fresh
markets often bring higher prices than those for processing markets, and market-
driven quality standards can encourage pesticide use to prevent rots, surface
blemishes, or other quality defects to increase returns. There can also be price
incentives for postharvest pesticide use to protect the quality of stored grains,
fresh fruits, dried fruits, and nuts.
Financial risk (variability of returns) and uncertainty (incomplete informa-
tion about outcomes) are also important considerations in farmers’ pest control
decisions. Risk results from variations in yields and returns that are affected by
changes in market conditions and natural variations in weather, pest infestations,
and other factors affecting output. Uncertainty, which increases perceived risk,
results from imperfect information about how these factors vary. Farmers do not
know the precise value of pest damage without control or the reductions in dam-
age from using control practices. They must develop expectations of crop value
and potential yield savings from control. Rational decisions will subsequently
appear suboptimal if pest infestations or crop values were different than expected.
Because reducing the risk of large financial losses is important to many producers,
some may find it rational to apply pesticides or other inputs in excess of profit-
maximizing levels. Crop insurance for pest damage has been suggested as an
alternative way to reduce risk without increasing pesticide use, but some research
indicates that crop insurance encourages pesticide use [23]. Uncertainty about
pest damage can be reduced by information about pest infestation levels from
scouting or monitoring; models predicting yield losses from pests, weather, and
other factors; and information about the effectiveness of pest control practices.
Pest mobility may create externalities, which are costs and damages not
considered by the grower because another grower bears some of the impact of
the decision. The more mobile a pest species is, the greater the externalities can
be. Mobile pests can reinfest a treated area from an untreated area. From the
viewpoint of a group of farmers, the most effective strategy might be for all to
treat. However, a single farmer might underestimate potential pest damage, be-
cause some of it occurs elsewhere, and decide not to treat or to treat less than
is desirable. Mobile pests can also spread resistance to pesticides and reduce their
effectiveness. The response of a grower in that case might be to increase pesticide
use to increase control. But, from the viewpoint of the group, the most effective
strategy might be for the grower to help manage resistance by reducing applica-
tion rates, eliminating treatments, or using nonchemical practices. Large area
control programs can coordinate grower actions and more effectively control
more mobile and damaging pests and manage resistance [24]. They may also
create economies of scale for monitoring or controlling pests. Government pest
eradication programs for such pests as the boll weevil may require grower partici-
pation and/or provide subsidies for participation to improve effectiveness of the
program and to prevent nonparticipating growers from benefiting [25].
3.1 Pesticide Cost Efficiency
One argument for the increase in synthetic pesticide use from the end of World
War II through 1980 is that pesticides often cost less and contributed to higher,
less variable yields than previously used methods. Fernandez-Cornejo et al. [26]
reviewed pesticide productivity studies that account for the yield-increasing ef-
fects of pesticides as well as the effects of pesticide and crop prices. They said
that many of the studies, but not all, showed pesticides to be cost-efficient inputs
from the farmer’s perspective because marginal return to pesticide use exceeded
cost [27–37]. They also said that some studies indicate that the marginal return
of pesticide use is declining over time, which is to be expected as pesticide use
increases.
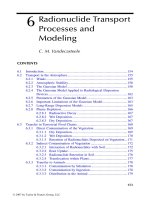
Relative price trends may have influenced the cost effectiveness of pesti-
cides and the amount used. Ball et al. [1] estimated that pesticide prices generally
rose relative to crop and fuel prices between 1948 and 1997, which would tend
to discourage pesticide use, but that pesticide prices fell relative to wages, which
would tend to encourage more pesticide use to reduce labor use (Fig. 3). However,
pesticide prices fell relative to wages, fuel prices, and crop prices from the late
1960s to 1980, a period of rapid growth in pesticide use. Price trends during that
period would have reduced the costs of pesticides relative to other control meth-
ods and encouraged the substitution of pesticides for labor, fuel, and machinery
used in pest control [38]. The increase in crop prices relative to pesticide prices
would have increased the returns to pesticides and other yield-increasing inputs
and encouraged greater use. These trends also may have induced technological
change to take advantage of relatively cheap pesticides [39]. However, pesticide
price trends since 1980 have returned to the longer trend, with pesticide prices
rising relative to crop prices and fuel prices but continuing to fall relative to
wages. Rising relative pesticide prices may have contributed to the stabilizing
F
IGURE
3 Relative price of pesticides compared to fuels, labor, and crops.
(Data from Ref. 1.)
of pesticide use since 1980 and also may have resulted from a high level of
demand for pesticide use in crop production.
3.2 Effect of Farm Programs
Many economists argue that commodity programs encouraged more pesticide
use than would have been optimal under free markets [36,40]. The combination
of target prices, loan rates, acreage restrictions, and inflexible base acreage en-
couraged greater per-acre use of pesticides and other yield-increasing inputs and
more continuous cropping instead of rotation. Ribaudo and Shoemaker [41] found
that participants in federal commodity programs used higher nitrogen fertilizer
and herbicide application rates than did nonparticipants. By increasing returns
and reducing financial risk for program crops, the programs may have encouraged
more program crop acreage and greater pesticide use. However, acreage restric-
tions reduced total pesticide use in comparison to previous years by reducing
acreage planted to program crops.
Pesticide use grew rapidly during the 1960s when farm programs restricted
crop acreage. From the mid-1970s to the early 1980s, when pesticide use grew
to market saturation, acreage restrictions were relaxed, export demand for U.S.
commodities was high, and crop prices and acres increased. During the 1980s,
low crop prices, acreage diversion, and land retirement contributed to reductions
in pesticide use. During the 1990s, pesticide use increased, and increased acreage
of planted crops, relaxation of acreage restrictions, greater planting flexibility
within the programs, and higher crop prices may have contributed.
Farm program incentives for pesticides or other yield-enhancing inputs
were steadily decreased through changes in farm legislation in 1977, 1985, 1990,
and 1996. These changes steadily reduced restrictions on farmers’ planting deci-
sions and the relation between current production and program payments. Under
the Federal Agriculture Improvement and Reform Act of 1996, producers were
permitted to plant 100% of their total base acreage plus additional acreage to
any crop (with some exceptions for fruits and vegetables) without loss of federal
subsidy. However, producers’ greater planting flexibility could lead to increased
pesticide use when idled land returns to production.
4 COUNTERPRODUCTIVE PESTICIDE APPLICATIONS
Despite the apparent contribution to production efficiency, increased pesticide
use is not a panacea for all pest problems. Scheduled or prophylactic treatments
when pest infestations are low may have little effect on yield, and the value of
damage reduction might not exceed cost. Some applications destroy beneficial
organisms and natural enemies to pests. As a result, secondary outbreaks could
require additional treatments, while species that were adequately controlled by
natural enemies become pests. Continued exposure of pest populations to a chem-
ical often leaves the most resistant individuals, which reduces the effectiveness
of the chemical, creates the potential for pest outbreaks, and encourages further
counterproductive pesticide use. Continuous plantings of some crops can encour-
age pest population growth and greater use of pesticides than the rotation of
several crops would. A monoculture of genetically uniform, high-yielding varie-
ties and high use of pesticides without regard for beneficial species or pest resis-
tance can create the potential for damaging pest outbreaks. As a result, reducing
pesticide use could lower pest damage and control costs in some circumstances.
Stern et al. [42] discussed the economic threshold and integrated control concepts
as ways to address the problems of counterproductive pesticide applications.
These concepts have had a significant influence on the science and economics
of pest management.
4.1 Economic Thresholds
The concept of the economic threshold is based on the notion that pests should
be controlled only when the value of damage reduction exceeds the cost of control
[42–44]. Treatments are economically justified when infestations exceed the
threshold or pest population level where damage reduction equals control cost.
Pest monitoring information and damage projections, which incur costs, are
needed to implement thresholds. If they eliminate uneconomic applications and
reduce pesticide use, thresholds can reduce pest control costs, the destruction of
beneficial species and natural enemies to pests, the development of pest resis-
tance, and adverse health, safety, and environmental effects.
According to economic theory, thresholds and pesticide application rates
will respond to economic factors. Higher crop prices or lower control costs in-
crease optimal rates or lower thresholds. With some exceptions, economists gen-
erally argue that risk and uncertainty encourage more pesticide use through higher
rates or lower thresholds [45–48]. In contrast, some studies indicate that growers
may use nonpesticide practices to reduce risk from pest damage [49–51]. Im-
proved monitoring information about pest damage can reduce uncertainty and
thus reduce dosages or increase thresholds [52]. However, the benefits of moni-
toring must be compared to the costs. One study showed that premature insecti-
cide applications on soybeans in Georgia had little effect on net returns compared
with strict threshold compliance, allowing farmers to maintain a high level of
crop protection without incurring the costs of a scouting program [53]. Econo-
mists also examined the impacts of dynamics on economic thresholds with opti-
mal control models [54,55].
4.2 Integrated Pest Management
Integrated pest management (IPM) is an approach that can reduce counterproduc-
tive pesticide applications. Stern et al. [42] originally defined integrated control
as “applied pest control which combines and integrates biological and chemical
control.” IPM focuses on optimizing the use of chemical, biological, and cultural
controls, including varietal resistance to pests, trap crops, augmentation of natural
enemies, and crop rotation, to manage pest problems rather than relying solely
on chemical use [56]. IPM programs often include pest monitoring and economic
thresholds. Methods of biological control that can be included in an IPM program
include the use of pest predators, parasites, and other beneficial organisms and can
also include pheromones or microbial organisms that are regulated as pesticides.
Organic production and sustainable agriculture are approaches to crop production
that can incorporate various pest management techniques to reduce or eliminate
pesticide use. Certification of organic production often excludes the use of syn-
thetic organic pesticides.
Integrated pest management was originally developed as an approach to
control pests more cost effectively over time, and it has influenced the science
and practice of pest control. More recently, IPM has become a policy tool to
reduce the use and risks of pesticides. In the late 1980s, there was an emerging
interest by some groups in the United States in restricting or reducing the total
amount of pesticides used, and one goal was to reduce the adverse environmental
and health effects. Many proponents argued that some pesticides were overused
and that more efficient application technology, nonchemical practices, pest moni-
toring, and economic thresholds or crop rotations can reduce pesticide use with
relatively small economic losses, while adverse environmental and health effects
would be reduced significantly [57]. Some European countries, including Den-
mark and Sweden, instituted programs to reduce pesticide use by 50%. Pettersson
[58] said that the quantity of active ingredient used in Sweden was reduced by
50% between 1985 and 1990 with little effect on acreage treated, which was
attributed to the reduction of application rates, the use of more efficient applica-
tion technology, and a change to new, lower application rate pesticides. More
recently, some groups have argued that the practice of IPM has become overly
oriented to using pesticides to control pests rather than reducing pesticide use
[59]. In response, the concepts of bio-intensive IPM and ecologically based IPM
have been developed [60,61]. These concepts focus on reducing the use of syn-
thetic organic pesticides, increasing the emphasis on reduced risk pesticides and
nonchemical practices, and understanding crop and pest ecology.
The United States has instituted a policy of implementing IPM to help
reduce health and environmental risks from pesticides but has not adopted a goal
of reducing pesticide use by a specified percentage. In September 1993, the Clin-
ton Administration called for reducing the use of high-risk pesticides, particularly
through increased use of IPM techniques, and set a goal that by 2000 75% of
all farms would use IPM techniques that reduce pesticide use. In August 1994,
the USDA and the USEPA signed a Memorandum of Understanding for an IPM
Initiative to develop IPM techniques and pursue this goal. The Food Quality
Protection Act of 1996, which is discussed in more detail in Section 5.2, also
requires the USDA, in cooperation with the USEPA, to conduct research and
education programs to support the adoption of IPM.
5 PESTICIDE REGULATORY POLICY
Pesticide use has increased within the context of regulatory law and policy, which
have been shaped by changing public attitudes and political pressure. One impor-
tant issue has been the balance of production benefits against the health and envi-
ronmental hazards of pesticide use [62]. There have been major public reactions
to the alleged health and environmental hazards of increased pesticide use since
the 1960s. Important issues include farm worker safety, cancer risks, birth de-
fects, wildlife mortality, water quality, endangered species, and food safety. Un-
less they directly affect returns, adverse health and environmental effects might
not affect the grower’s decision to apply a pesticide. One major idea that changed
regulatory policy is that the hazards of using some pesticides might outweigh
their benefits. In recent years, some interest groups have argued that benefits
should have no role in regulatory decision-making.
The regulatory process defines what pesticides and use practices are legal.
Under the Federal Insecticide, Fungicide, and Rodenticide Act (FIFRA) and the
Federal Food, Drug, and Cosmetic Act (FFDCA), the USEPA decides whether
or not to register new uses of previously registered or unregistered pesticides,
modify existing pesticide registrations, and cancel some or all registered uses of
pesticides on the market.* The Clean Air Act, Clean Water Act, Endangered
Species Act, and the Occupational Safety and Health Act also affect the use of
pesticides.
Current pesticide regulatory policy recognizes a role for pesticides in crop
production but emphasizes protection from hazards of use. The regulatory ap-
proach is to mitigate the risks of using pesticides by modifying use rates and
practices, cancel uses of pesticides that do not meet safety standards, and register
* Before a pesticide can be used in the United States, it must be registered under FIFRA, currently
administered by the USEPA. Registrations specify sites (such as specific crops or livestock) where
pesticides can be applied, application rate, methods of use, or locations of use for pesticide products.
For a pesticide to be registered for use on a food crop, FFDCA requires residue tolerances or exemp-
tions from tolerance for the raw commodity and all processed foods and feeds, rotational crops, and
livestock where residues can be found. The USEPA establishes residue tolerances; the FDA monitors
residues and enforces the tolerances.