PESTICIDES IN AGRICULTURE AND THE ENVIRONMENT - CHAPTER 10 (end) pptx
Bạn đang xem bản rút gọn của tài liệu. Xem và tải ngay bản đầy đủ của tài liệu tại đây (653.33 KB, 32 trang )
10
Evolution of the Crop Protection Industry
Robert E. Holm and Jerry J. Baron
IR-4 Project
Technology Centre of New Jersey
Rutgers University
North Brunswick, New Jersey, U.S.A.
1 A CENTURY OF PROGRESS
As we enter the twenty-first century, we have a great opportunity to look back
over the tremendous progress that agriculture made in the twentieth century.
Modern agriculture came into being, and the crop protection industry combined
with the fertilizer, hybrid seed, and equipment industries to provide an abundance
in agricultural production that few would have believed possible when the century
began. Table 1 indicates the dramatic yield increases for corn, soybeans, wheat,
and cotton from 1920 to 1990, which ranged from 2.5-fold for soybeans to sixfold
for wheat. The increased productivity was even more striking when measured
by output per farmer, which increased 13-fold from an average of 9.8 people
being fed per farmer in 1930 to 129 people per farmer in 1990.
When the significant cultural practices are overlaid on the yield and produc-
tivity increases, it is clear that the most dramatic improvements were made in
the last half of the century and coincided with the maximized use of hybrid seed,
better and more efficient mechanization of equipment, more available and cheaper
fertilizer inputs (especially nitrogen), and the development of modern crop pro-
tection tools such as the ethylenebisdithiocarbamate (EBDC) fungicides, herbi-
cides like the phenoxies and triazines, and effective insecticides like the organo-
T
ABLE
1 Impact of Crop Protection Developments on Row Crop Yield and Productivity
Row crop
(yield parameter) 1920 1930 1940 1950 1960 1970 1980 1990
Corn (bu/acre) 29.9 20.5 28.9 38.2 54.7 72.4 91.0 118.5
Soybean (bu/acre) N/A
b
13.0 16.2 21.7 23.5 26.7 26.5 34.2
Wheat (bu/acre) 13.5 14.2 15.3 16.5 26.1 31.0 33.5 39.5
Cotton (lb/acre) 187 157 253 269 446 438 404 634
Output per farmer
a
— 9.8 10.7 15.5 25.8 75.8 115 129
Significant changes Increased mechanization → Boll weevil eradication program →
in cultural prac-
tices
→Hybrid corn 95% of corn
acreage
Use of NH
3
as cheap
→
nitrogen source
Modern crop protection chemicals
→
EBDC fungicides Phenoxy herbicides Pyrethroids Glyphosate Plant biotech
Triazines
Organophosphates
a
Number of people fed.
b
N/A, not available.
Source: Farm Chemicals WOW 2000 America.
phosphates, carbamates, and pyrethroids. In crops like cotton, where yields had
plateaued for 20 years, area-wide government programs such as boll weevil eradi-
cation had an impact on a serious pest and reopened large areas of the Southeast
and South to economical cotton production.
The last decade of the century brought about the advent of plant biotechnol-
ogy, which was one of the most rapidly adapted new technologies ever utilized
by farmers. It has been estimated that it took 7 years for 50% of U.S. corn farmers
to accept hybrid corn but only 4 years for 50% of U.S. soybean growers to accept
Roundup Ready soybeans [1]. We delve into the current and projected status of
the plant biotechnology revolution in a later section but begin by focusing on
the crop protection industry, recognizing again that it is just one important com-
ponent in an overall production management system that includes fertilizers,
mechanization, and improved seeds.
2 THE CROP PROTECTION INDUSTRY—HAS IT COME
FULL CIRCLE?
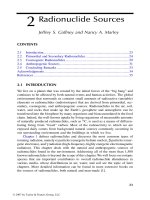
The modern crop protection chemical industry evolved from European and U.S.
chemical companies that were formed from the 1700s to the early part of the
1900s (Fig. 1). These companies dedicated resources to separate agricultural
chemical operations during the first half of the last century as stand-alone units
or as part of fertilizer operations. Several of these companies—for example, Eli
Lilly and Bayer—also had growing pharmaceutical businesses that were not inte-
grated with agrichemicals but often shared compounds synthesized by their chem-
ists between biological evaluation groups. At one time, many of the major oil
companies had agrichemical operations. However, one by one (Esso in 1969,
Gulf in 1975, Mobil in 1981, Shell in 1988 and 1994, and Chevron in 1991 and
1993), the oil companies sold their agrichemical businesses and products to focus
on their core businesses with their shorter term investment returns. Many corpo-
rate oil company boards of directors found it difficult to reconcile the 8–10 year
period needed to develop and market a new agrichemical product at a cost of
$30–50 million or more with the short-term investment turnaround of drilling
new wells for oil or natural gas. It was this attitude that drove companies to
develop life science business units comprising pharmaceuticals, agricultural
chemicals, and sometimes animal health products. From an investment viewpoint,
all of these high technology, heavily research-driven enterprises have similar long
product development lead times with high investment commitments. With indi-
vidual agrichemical product profit margin potentials of 50% or more, the corpo-
rate investment strategies and support to link these technology-driven business
units together made good business logic. In addition, many of the discovery tools
discussed later could be linked or shared, resulting in potential synergies and cost
savings.
F
IGURE
1 Evolution of the crop protection industry. Have we come full circle?
In the 1990s some other complicating factors came into play that had an
impact on the industry. Many products patented in the 1950s–1980s came off
patent and were the source of market opportunities for generic producers who had
developed cost-effective manufacturing processes for many of the high-volume
products. The seed industry also became a focus of the crop protection industry
as a component of the plant biotechnology revolution when it became apparent
that seed would be the carrier for the new technology and be a critical part in
certain management systems such as herbicide-tolerant crops, as discussed in
greater detail in Section 9.
What seemed to be a perfect strategy (i.e., life sciences) started to unravel
in the latter part of the 1990s owing to a number of factors, mostly economically
driven. After reaching record years of farm income in the early to mid-1990s,
farm receipts dropped precipitously in the late 1990s and the early part of the
twenty-first century owing to general worldwide feed grain surpluses and tum-
bling commodity prices. This situation, coupled with lower overall gross profit
margins on off-patent products due to generic competition, led several companies
to reconsider their life science strategies. Corporate boards were under increasing
pressure from shareholders who saw lower profit margins (20% for generic agri-
chemicals versus more than 50% for pharmaceuticals) and public concerns with
respect to plant biotechnology. They started to distance their drug and animal
health operations from the agrichemical and plant biotechnology business units.
A new company called Syngenta was formed in 2000 from the crop protection
businesses of Novartis and Astra/Zeneca. Several of the major pharmaceutical
companies (Merck in 1997, American Home Products in 2000, and Abbott in
2000) divested their crop protection business units completely, while other com-
panies, e.g., Pharmacia (which purchased Monsanto in 2000), set up their agricul-
tural business as a separate operating company and sold public stock in it. Many
analysts saw this as a first step in total divestiture of the agricultural business unit.
3 MERGERS AND ACQUISITIONS
The divesture of the agricultural chemical businesses by the oil companies was
only a small part of the turnover in the overall industry, as noted in Table 2.
Although there were a few changes in the 1960s and 1970s, the trend rapidly
accelerated in the 1980s and 1990s as the dynamics of life science strategies,
generic producers, seed businesses, and plant biotechnology drove companies to
evaluate and re-evaluate the role of agrichemicals in their operations. It is clear
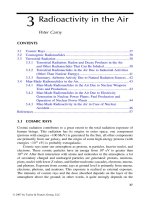
that the trend will continue well into the twenty-first century. Many analysts have
predicted that as few as five and as many as 10 companies will emerge as the
ultimate survivors, as the trend line in Figure 2 verifies. The impact has been
felt not only by the major companies directly involved in the industry but also
by companies manufacturing and formulating agrichemical products as support
industries. Several smaller companies, including FMC, Rohm & Haas (agrichem-
ical business acquired by Dow AgroSciences in 2001), and Uniroyal Chemical
(division of Crompton Corporation), continued to survive and compete by focus-
ing on market niches such as minor crops and the home and garden market. FMC
actually made the top 10 global crop protection companies in 2000, not so much
from increased sales as from consolidation in companies above them in the rank-
ings (Table 3). In 2000 alone, Novartis and Zeneca became Syngenta, and BASF
T
ABLE
2 Mergers and Acquisitions in the Crop Protection Industry
Year 2000 survivor Merged or acquired companies (year)
Aventis AgrEvo (1999), Rho
ˆ
ne-Poulenc (1999), Stefes (1997),
Plant Genetic Systems (1996), Hoechst/Schering/
Nor-Am (1994), Union Carbide (1987), Mobil
(1981), Am-Chem (1970s), Nor-Am (1963), ICC/
American Hoechst (1961), Hoechst (1953), Roussel/
UCLAF (1946). Others include Boots, Hercules, Fi-
sons, Boots Fisons Hercules (BFC), Morton Nor-
wich, May and Baker, Rhodia, Chipman, American
Paint, and Amchem-Rhor.
BASF American Cyanamid (AG business of American
Home Products) (2000), Micro-Flo (1998), Sandoz
(part of product line, 1996), American Home
Products/American Cyanamid (1994), Shell Interna-
tional (1994), Celamerk (1986), Cela plus Merck
(Darmstadt) (1972). Others include BASF Wyan-
dotte, Wyandotte, and BASF Colors and Chemicals.
Bayer Gustafson (50% with C. K. Witco in 1998), Bayer Cor-
poration (AG divisions consolidated in 1995),
Bayer/Miles (1978), Chemagro (1967). Others in-
clude Mobay, Baychem, and Geary Chemical.
Dow AgroSciences Rohm & Haas (agrichemical division in 2001), Myco-
gen (1996, 1998), Sentrachem (1997), Dow Elanco
(Dow Chemical plus Eli Lilly) (1989). Others in-
clude Murphy Chemical and Walker Chemie.
DuPont Pioneer Hybrid (1997, 1999), Griffin Corporation
(50% in 1997), Protein Technologies (1997), Shell
Chemical (U.S. business in 1988).
Monsanto An operating company of Pharmacia Corporation
(2000), Asgrow (1998), DeKalb (1998), Holden
Foundation Seeds (1998), Plant Breeding Interna-
tional Cambridge (1998), Cargill (joint venture,
1998), Calgene (1996/97), Agracetus (1996), Chev-
ron (home products business in 1993).
Sumitomo Chemical Abbott (AG business in 2000), Chevron (ag business
in 1991). Others include California Chemical, Cali-
fornia Spray, and some PPG Industries products.
Syngenta Novartis (2000), Zeneca/Astra (2000), ISK Biotech
(1997), Merck (AG business in 1997), Mogen Inter-
national (1997), Ciba/Sandoz (1996), Northrup King
(1996), ICI Americas (1993), Stauffer Chemical
(1987), Garst Seed (1985), Ciba (1970), Geigy
(1970). Others include Velsicol, Zoecon, Interna-
tional Minerals and Chemicals (AG products),
MAAG, Michigan Company, Atlas, Cannet Corp,
Chipman of Canada, Fermenta ACS/Plant
Protection/AB, SDS Biotech, Diamond Shamrock,
Showa Denko, Ansul AG Products, Diamond Al-
kali, Kolher Chemical.
Source: Farm Chemicals WOW 2000 Special Millennium Issue, herbicide company ge-
nealogy by AP Appleby and information by RE Holm and JJ Baron.
F
IGURE
2 Consolidation trends in the agricultural chemical industry.
(Adapted from Ref. 11.)
purchased the American Cyanamid agricultural business unit from American
Home Products. The shuffling in top 10 rankings over this 5 year period is a true
reflection of the constant turmoil in the industry. Also of interest in Table 3 is
the flat to declining worldwide value of crop protection chemical sales over the
latter part of the 1990s after increases of 2–3% per year due partially to increased
use of generic products (i.e., lower cost) and the impact of herbicide-tolerant and
insect-resistant crops in the United States.
Of major future interest in the merger and acquisition area will be the strat-
egy of the Japanese agrichemical industry. While their U.S. and European coun-
terparts have been very active in various strategies, of the major Japanese com-
panies only Sumitomo Chemical Company has made a direct entry into the
European (through Philagro) and U.S. (through Valent and Valent BioSciences)
markets. The impact Ishihara Sangyo Kaisha (ISK) had in the U.S. market was
greatly diminished by its product and business sale to Zeneca/Syngenta, although
it has retained development rights to new products. Other companies such as
T
ABLE
3 Changes in Global Sales Leadership in Crop Protection (1996–2000)
Global
rank 1996 1997 1998 1999 2000
a
1 Novartis Novartis Novartis Monsanto Syngenta
2 Zeneca Monsanto Monsanto Aventis Aventis
3 Monsanto Zeneca DuPont Novartis Monsanto
4 AgrEvo DuPont Zeneca DuPont BASF
5 DuPont AgrEvo AgrEvo Zeneca DuPont
6 Bayer Bayer Bayer Bayer Bayer
7RP
b
RP
b
RP
b
Dow
c
Dow
c
8 Dow
c
Dow
c
Cyanamid
d
BASF Makhteshim-Agan
9 Cyanamid
d
Cyanamid
d
Dow
c
Cyanamid
d
Sumitomo
10 BASF BASF BASF Makhteshim-Agan FMC
Global 29.4 29.8 31.0 29.8 29.7
sales
e
a
Estimates based on 1999 sales.
b
Rho
ˆ
ne-Poulenc.
c
Dow AgroSciences.
d
American Cyanamid/American Home Products.
e
In billions of dollars.
Source: Agrow (various issues).
Kumiai Chemical, Nihon-Nohyaku, Sankyo, Hokko Chemical, Taketa Chemical,
Nissan Chemical, and Nippon Soda appear to be content to license their new
molecule discoveries to European and U.S based companies for development
and marketing in countries outside Japan and Asia where they lack a major pres-
ence. With the increasing market globalization pressures and the costs of dis-
covering new molecules, it is doubtful whether this independence can continue
for long. Whether the Japanese agrichemical industry will consolidate internally
within Japan, with the major global companies, or both remains to be seen. As
will be noted in Section 8, many of the new chemistries being developed world-
wide have their origin in Japanese laboratories.
4 IMPACT OF GENERIC PRODUCERS
From the perspective of the crop protection industry, the generic products indus-
try has changed dramatically over the past 30 years. Generic producers used to
be viewed as business opportunists by the basic manufacturers, who had invested
large amounts of research dollars and business capital to discover, develop, and
market new products only to see the generic producers quickly gain market entry
once the products went off patent. Early off-patent product market launches by
generic companies met with acrimonious lawsuits on data compensation allowed
under the Federal Insecticide, Fungicide and Rodenticide Act (FIFRA). After
several precedent-setting lawsuits were settled, the two camps settled into an
uneasy truce. Gross profit margins of 20–30% for off-patent products versus
50–60% for patented products dictated different marketing strategies. Generic
products continued to gain a foothold in markets where low-cost production was
important and where farmers could not afford high production input costs such
as in third world countries. It has been estimated that the market share for generic
products exceeds 70% in China, 60% in India, 50% in Korea, and 40% in Taiwan.
In the 1990s, the attitude of the agricultural chemical companies toward
their generic competitors started to change. In 1996, it was estimated that off-
patent products accounted for over $18 billion in sales, or 58% of the global
market [2]. This impact and growth could not be ignored. The Israeli company
Makhteshim-Agan was formed from Makhteshim Chemical Works, Ltd. and
Agan Chemical Manufacturers, Ltd. in 1996 and cracked the top 10 global sales
list in 1999 with over $800 million in sales (Table 3). Makhteshim-Agan is clearly
the global generic leader and remains an independent operating company (Table
4). Fernz/NuFarm (over $450 million sales in 1998) and Cheminova (over $300
million in 1998 sales) also remain independent. However, Griffin ($300 million
in 1998 sales) became a 50% joint venture with DuPont and increased its 1998
sales to over $450 million with the addition of DuPont’s off-patent products.
DuPont gave as reasons for the joint venture (1) Griffin’s knowledge of the ge-
neric business infrastructure and their proven record of managing off-patent prod-
T
ABLE
4 Generic Producers in the Crop Protection
Industry
Companies acquired by or entering into joint ven-
tures with basic manufacturers
Griffin: 50% joint venture with DuPont
Micro-Flo: BASF
Sentrachem: Dow AgroSciences
Stefes: Aventis
Top independent generic producers
Makhteshim-Agan (Israel)
Fernz/NuFarm (Australia)
Griffin (United States)
Cheminova (Denmark)
United Phosphorus (India)
Gharda (India)
CFPI (France)
Source: Generic producer information from Farm Chemicals,
Spring 1998 issue.
ucts and (2) DuPont’s strategy of focusing on basic research and patented prod-
ucts. Dow AgroSciences purchased Sentrachem, a $450 million (1998) generics
manufacturer of glyphosate, triazines, mancozeb, carbofuran, and phenoxies in
1998. Dow indicated that the acquisition was part of their strategy to gain leader-
ship in an industry being driven by biotechnology, consolidation, and generic
competition. Along these same lines, Aventis (AgrEvo) purchased the German
generics company Stefes, and BASF purchased the United States–based generic
producer Micro-Flo. In a variation on the theme, Aventis (Rho
ˆ
ne-Poulenc) cre-
ated a separate operating division named Sedagri to market the company’s ge-
neric product line.
Companies like Monsanto/Pharmacia who have not gone the generic route
in partnerships and acquisitions have developed their own strategies for generic
products. Monsanto’s glyphosate became the crop protection industry’s first pro-
prietary product to exceed $1 billion in annual sales in the 1990s. Although
glyphosate became a generic herbicide in much of the global market in the late
1980s and early 1990s, it did not go off-patent in the United States until 2000.
Prior to that, Monsanto developed the strategy of becoming the lowest cost pro-
ducer and expanding into new markets by lowering the price. According to Beer
[3], the average global end user price for glyphosate technical dropped from $34/
kg in 1991 to $20/kg in 1997—an 8%/yr reduction. However, agricultural uses
of glyphosate increased from 42,000 tons in 1994 to just over 74,000 tons in
1997 (a 20%/yr increase) and were expected to exceed 112,000 tons in 1998.
Monsanto increased production capabilities at a similar rate and was forecast to
exceed 100,000 tons of glyphosate per year in 2000. Monsanto coupled an ag-
gressive licensing program, lowered prices, and increased production with lower
production costs. In the last few years, Monsanto licensed Syngenta (Novartis),
Cheminova, Fernz/NuFarm, Dow AgroSciences, and BASF (Micro-Flo and
Cyanamid) to sell glyphosate in stand-alone and premixed products. In addition,
Monsanto used formulation technology to differentiate its Roundup glyphosate
brand from the glyphosate of generic producers. It developed a formulation sys-
tem termed UltraMAX that contained 25% more glyphosate than the older
Roundup Ultra formulation along with formulation technology called Transorb
that enhanced glyphosate uptake, translocation, and rain-fastness. They also intro-
duced in 2000 a new formulation of glyphosate plus atrazine called ReadyMaster
ATZ for the Roundup Ready corn market. With these innovations and Mon-
santo’s dominant position in the herbicide-tolerant soybean market with its
Roundup Ready program, they are in a position to maintain their glyphosate
leadership position for years to come.
5 THE ROLE OF THE SEED COMPANIES
Until recent years, the association of the crop protection industry with the seed
business was as remote as their relationship with the generic producers. That
business approach did not change until the 1990s, when the heavy investment in
plant biotechnology led to the realization that seed was the delivery system for
newly discovered input traits like herbicide tolerance and insect resistance. The
decade of the 1990s saw a wild scramble for seed businesses by the crop protec-
tion industry (Table 5). DuPont paid nearly $10 billion for Pioneer Hybrid in
T
ABLE
5 Seed Companies in the Crop Protection Industry
Estimated sales Industry ownership
a
Seed company ($ million) (year purchased)
Pioneer Hybrid 1900 DuPont (1997, 1999)
Novartis 1000 Syngenta
Limagrain 600 15% by Aventis
Savia 600 Independent
DeKalb 400 Monsanto (1998)
Asgrow 300 Monsanto (1998)
Advanta/Garst 200 Syngenta
Delta and Pine Land 200 Independent
Mycogen 150 Dow AgroSciences
Cargill 100 Independent
a
Company totals (in millions): DuPont, $1900; Syngenta, $1200; Mon-
santo, $700.
Source: Farm Chemicals (various issues) and RE Holm and JJ Baron.
two steps (20% in 1996 and the remaining 80% in 1999) to gain control of the
leading hybrid seed corn producer, which had over 40% of the U.S. market.
Monsanto followed with acquisitions of DeKalb, the number two U.S. hybrid
seed corn producer, with over 12% market share, and Asgrow, a leading soybean
producer, to become the third largest seed producer. Syngenta, thanks to the seed
business acquisitions of its parent companies (Zeneca with Advanta/Garst, Ciba
with Ciba Seeds, and Sandoz with Northrup King), became the world’s second
largest seed company behind Pioneer/DuPont. Monsanto’s stake in the global
seed market could have been larger if it had held on to the cottonseed operations
it purchased (Stoneville Pedigreed Seeds, acquired as part of the Calgene pur-
chase) or had agreed to buy (Delta and Pine Land). Delta and Pine Land had
over 70% of the U.S. cottonseed market, whereas Stoneville Pedigreed Seed held
about 15% of the domestic cottonseed market. Because of antitrust concerns over
control of such a large share of the cottonseed market, Monsanto sold Stoneville
to Emergent Genetics in 1999. They later decided not to follow through on the
Delta and Pine Land purchase and ended up paying an $81 million termination
fee. Dow AgroSciences is another major player in the seed business with its
T
ABLE
6 Seed as a Multicomponent Delivery System
System Technology Benefits
Germplasm Proprietary germplasm Higher yields
Hybridization systems Stress tolerance (drought,
Marker-assisted breeding salt, cold, etc.)
tools Insect and disease resis-
tance
Qualitative traits
Nutritional value
Transgenes Gene discovery, expres- Insect, virus, and disease
sion, and delivery resistance
Herbicide tolerance
Quality traits
Seed protectants Seed treatment chemicals Soil and plant systemic in-
and technology sect and disease protec-
Safener technology tion
Increased crop tolerance
to selected herbicides
Product variations Processing, coating Easier planting
Pelleting, priming Improved germination
Uniformity of emergence
Soil temperature activa-
tion
purchase of Mycogen. Only Cargill; Delta and Pine Land; Limagrain, a French-
based seed company that is 15% owned by Aventis (Rho
ˆ
ne-Poulenc); and Savia,
which is the largest vegetable seed producer with around 25% of the global mar-
ket and 40% market share in the United States and Europe, remain independent
from the crop protection industry.
The agrichemical industry views seed as a multicomponent delivery system
not only for input and output traits but also for chemicals to be placed on the
seed for protection against plant disease and insects (Table 6). Many of the new
insecticides and fungicides being developed are highly active at low rates, are
taken up by germinating seedlings, and are translocated to emerging and new
foliage for 6–8 weeks or longer to protect systemically against insects and plant
pathogens. Bayer, Syngenta, Aventis, Uniroyal Chemical, and others have devel-
oped strategic business plans to focus on the seed treatment market. Bayer pur-
chased 50% share of Crompton Corporation’s Gustafson seed treatment business,
which is the leader in the United States. We expect the seed treatment chemical
business focus to continue because of its environmental and worker exposure
benefits versus foliar applications after plant emergence to control plant pests.
F
IGURE
3 How crop protection tools reached the farmer in the past.
6 SUPPLYING CROP PROTECTION TOOLS
TO THE FARMER
For many decades, from the 1920s until the early 1990s, farmers received their
chemical, seed, and fertilizer inputs through the traditional chain diagramed in
Figure 3. They then sold their produce to processors or food retailers for consumer
purchase. The only exception was hybrid seed corn, which was sold to dealers
who were usually local farmers and in turn sold to their neighbors. Now only
fertilizer is sold through the traditional route. Crop protection chemicals may be
sold directly to some large farms and farmer cooperatives. With the agrichemical
company’s big investment in the seed industry (see previous section), their
involvement in seed sales has increased dramatically (see Fig. 4). Because input
traits such as herbicide tolerance and insect resistance require a much greater
F
IGURE
4 How crop protection tools reach the farmer—current and future.
level of management and technical skills to grow the treated seed, dealers and
distributors are becoming much more involved in seed sales. The coupling of
chemical treatments for traits such as herbicide tolerance with seed sales has been
a way of maintaining grower contacts for distributors and dealers who supply
both products (i.e., seed and chemicals) and the technical service to use them.
Some companies have gone a step further by becoming involved in food pro-
cessing. Novartis, Syngenta’s parent, owns Gerber, the babyfood producer. Du-
Pont purchased Protein Technologies, which is a global leader in the use of soy-
bean proteins for the food industry. This has led to the term “dirt to dinner table”
for the integration of DuPont’s agricultural businesses ranging from supplying
farmers with seed and chemicals through processing the crop for consumer use.
It is likely that this trend will continue as companies look at ways to extract value
from their technologies throughout the food chain.
7 THE DISCOVERY PROCESS
As with many other aspects of the industry discussed previously, such as the
seed technology business integration, little changed in the processes used to syn-
thesize and biologically evaluate new crop protection chemical candidates for 50
years from the 1940s until the early 1990s. An organic chemist could synthesize
50–100 unique new structures or 100–200 analogs of an active series annually.
Biological evaluations were conducted on entire plants under greenhouse or
growth chamber conditions. The limiting factor became the number of chemists
a company could afford along with the biologists to conduct the empirical screen-
ing approach. By the 1970s, 100 new molecules per week or 5000 per year was
the goal of many companies, and this was raised to 10,000 molecules per year
in the 1980s and early 1990s. That goal changed dramatically by the mid-1990s
when the dual technologies of combinatorial chemistry and high-throughput
screening (HTS) pioneered by the pharmaceutical industry were adapted, espe-
cially in the life science companies that had drug and agrichemical business and
research units [4]. Those discoveries led to new targets of 100,000 compounds
per year by the late 1990s. However, by 1999 Aventis announced it was screening
600,000 compounds per year and would increase that number to 1 million annu-
ally. Bayer also announced at the end of the decade their intent to screen 1 million
substances a year in their new $26.5 million research facility at their Monheim
(Germany) Agricultural Research Center.
One of the consequences of combinational chemistry approaches for com-
pound synthesis is the lack of pure products—i.e., the target substance is accom-
panied by other materials from the reaction plus starting materials. Because puri-
fication was not economically feasible before evaluation because of the high
numbers involved (up to 5000 per day in some cases), the major concern switched
T
ABLE
7 New Approaches to Discovery
Company Partner Technology
Aventis Cerep Molecular modeling and combinatorial chemistry using virtual
screening software for compound optimization
3-Dimensional Pharmaceuti- Compound libraries and technologies to optimize active com-
cals pounds
Molecular Simulations, Inc. Molecular modeling software for lead discovery, optimization,
and combinatorial chemistry approaches
Bio Discovery Screening and inspection of library extracts for crop produc-
tion potential
Bayer Exelixis Use of gene-based technology to discover new insecticides
and nematicides
Paradigm Genetics Use of gene function, bioinformatics, and new assays to de-
velop novel screening targets for new herbicides
ArQule Use of combinatorial chemistry for screening to obtain several
hundred thousand compounds
Dow AgroSciences Biotica Technology New Spinosad analogs obtained by targeting changes in bio-
synthetic pathway
Integrated Genomics DNA sequence of Saccharopolyspora spinosa used to improve
Spinosad production through fermentation
DuPont The Automation Partner High-throughput system using bar-coded vials accessed by
high-speed robots to prepare hundreds of thousands of mol-
ecules per day for screening
3-Dimensional Pharmaceuti- Use of computational and combinatorial chemical techniques
cals to discover new molecules
Combi Chem (acquisition) Use of combinatorial chemistry for new leads
Affymax Research Institute Use of Affymax’s chemical libraries for screening new crop
protection targets using combinatorial chemistry and high-
throughput screening approaches
Curagen Use of proprietary technologies to characterize the genetic
component and metabolic pathways of new products
FMC DevGen New molecule mechanisms and target sites; high-throughput
chemical library screening
Monsanto ArQule Use of combinatorial chemistry approach to discover new mol-
ecules
Dow AgroSciences Cambridge Discovery Use of combinatorial chemistry for new leads
Chemistry
Syngenta Cambridge Discovery R&D collaboration at Zeneca’s Richmond, CA, R&D facility to
Chemistry provide new leads through combinatorial chemical ap-
proaches
Rosetta Inpharmatics Use of bioinformatic approaches to optimize the development
of new lead molecules
Novalon Pharmaceutical Use of BioKey library of Ͼ20 billion unique biopolymers to de-
velop high-throughput screening assays
from product quantity to quality. If biological activity was observed, the source
of the activity had to be sorted out from the mixture to target the active molecule.
The biological evaluation process has always given the agricultural chemi-
cal industry a great advantage over the pharmaceutical industry in that it was
possible to screen directly on the target organisms from the first evaluation. Thus,
in vivo screening has always been preferred over in vitro or target-based screen-
ing. However, HTS forced assays to be miniaturized so they could be run in 96-
or 384-well microtiter plate formats. More recently, the mapping of genomes and
the discovery of genes coding for control of key metabolic pathways in fungi,
plants, insects, and nematodes has stimulated a high level of interest in in vitro
screening. The ability to use such assays within cells or whole organisms creates
the opportunity to test for a specific mode of action while retaining many of the
in vivo screening benefits. Of course, neither combinational chemistry nor HTS
would be possible without the introduction of highly automated robotic systems.
The other driving force is management of information. Information technology
systems are required at all stages of the process, from chemical library design,
molecular synthesis, sample management, and HTS to data capture, storage, and
analysis. By combining biological screening data with genomes, scientists are
gaining additional insights into an understanding of key genes that enables a more
rational means to approach selected screening targets. For promising in vivo
leads, the determination of unknown modes of action can now be facilitated by
profiling gene expression changes brought about by the applied chemical.
The new technological approaches being explored by the crop protection
companies and their technology partners are outlined in Table 7. This is not meant
to be an exhaustive or all-inclusive review of the company approaches, but it is
an indication of the tremendous explosion of new ideas and efforts to more effec-
tively discover new lead molecules. By increasing the screening rate 100-fold
(from 10,000 to 1 million per year) over a period of 10 years, the industry has
set into motion a new discovery approach that when coupled with the emerging
knowledge of genomics will continue to revolutionize the industry for years to
come.
8 NEW CHEMISTRIES
Although the use of chemicals to control plant pests can be traced back many
centuries, the modern era of crop protection tools can be said to have begun in
the 1940s or 1950s [5]. It is a difficult task to look specifically at agrichemicals
and their market introduction dates without spending a lot of effort and duplicat-
ing many previous articles. One way to evaluate the impact of the discovery and
market introduction of new crop protection tools is to look at the U.S. corn and
soybean herbicides over the past five decades (Table 8). The U.S. herbicide mar-
ket usually accounts for over 60% of all agrichemical sales and is a prime discov-
ery target for the industry. The 1990s gave us almost 60% of all the corn herbi-
T
ABLE
8 U.S. Introductions of
Corn and Soybean Herbicides
Decade Corn Soybean
1950s 1 0
1960s 5 5
1970s 4 4
1980s 3 13
1990s 18
a
16
a
Total 31 38
a
Includes transgenic crop herbicide
tolerance.
cides marketed over the five decades 1950–2000, while the soybean herbicides
introduced in the 1990s accounted for almost 40% of all the soybean herbicides
introduced since 1950. This demonstrates the tremendous impact of the discovery
process described in the previous section on the development and marketing of
new crop protection tools. Similar results were seen in the insecticide/miticide
and fungicide areas comparing the 1990s to the 1950s. The major discoveries of
new molecules for crop protection in the 1990s are listed in Table 9 for herbicides
and plant growth regulators, Table 10 for insecticides, miticides, and nematicides,
and Table 11 for fungicides. One new term that has entered the vocabulary of
the industry more recently is reduced risk or safer materials. One overlying factor
in the discovery and development efforts of registrants has been the increasing
influence of regulatory pressures. Dr. Reed (see Chap. 4) gives the background
and details of these regulatory issues. Briefly, FIFRA ’88 made the industry take
a hard look at reregistering products registered prior to 1984. Companies com-
pared the costs of defending older products against the investment required to
discover and develop new ones. Many companies decided to reduce their product
defense expenditures, especially on minor crops, as noted by Guest and Schwartz
in Chapter 7 of this volume. The new focus on molecules that could be used at
lower use rates and with safer mammalian and environmental safety profiles was
validated by the Food Quality Protection Act (FQPA) in 1996. As noted by Reed
in Chapter 4, FQPA brought about new standards for food and environmental
safety including an additional 10ϫ safety factor for children along with aggregate
(food plus water plus environmental) exposure and cumulative risk from products
with the same modes of action. The Reduced Risk status classification enacted
by the U.S. Environmental Protection Agency (USEPA) (PR Notice 97-3, 1997)
spelled out a specific set of standards for new chemistries concerning mammalian,
environmental, aquatic, wildlife, and avian toxicity and other parameters. Mole-
cules passing this strict set of standards received a Reduced Risk classification
and preferred regulatory treatment at the USEPA. Many companies made Re-
T
ABLE
9 New or Recently Registered Crop Protection Chemicals—
Herbicides and Plant Growth Regulators
Compound
a
Company Trade name
Azafenidin (H) DuPont Milestone
Bispyribac-sodium
c
(H) Valent Regiment
Carfentrazone-ethyl
b,c
(H) FMC Aim, Shark, Affinity
Cloransulam
c
(H) Dow AgroSciences Firstrate
Diclosulam
c
(H) Dow AgroSciences Strongarm
Diflufenzopyr
b,c
BASF Distinct
Dimethenamid-p
b,c
(H) BASF Frontier
Flufenacet
c
(H) Bayer Axiom
Flumetsulam
c
(H) Dow AgroSciences Broadstrike
Flumiclorac
b,c
(H) Valent Resource
Flumioxazin
c
(H) Valent Valor
Fluthiacet-methyl
b
(H) Syngenta Action
Halosulfuron
c
(H) Monsanto/Gowan Permit, Sempra
Imazamox
b,c
BASF Raptor
Imazapic
b,c
(H) BASF Cadre
Isoxaflutole
c
(H) Aventis Balance
Mesotrione
b,c
(H) Syngenta Callisto
Oxadiargyl (H) Aventis Topstar
Oxasulfuron (H) Syngenta Expert, Dynam
Prohexadione-Ca
b,c
(PGR) BASF Apogee
Prosulfuron
c
(H) Syngenta Peak
Pyrithiobac sodium
c
(H) DuPont Staple
Quinclorac
c
(H) BASF Facet, Paramount
Rimsulfuron
b,c
(H) DuPont Matrix
Sulfentrazone
c
(H) FMC Authority
Sulfosulfuron
c
(H) Monsanto Maverick
Tepraloxydim
c
(H) BASF Equinox, Aramo
Thiazopyr
b,c
(H) Dow AgroSciences Visor
Triflusulfuron
c
(H) DuPont Upbeet
Tralkoxydim
b,c
(H) Syngenta Achieve
Trinexapec-ethyl
c
(PGR) Syngenta Palisade
a
H ϭ herbicide; PGR ϭ plant growth regulator.
b
In the USEPA Reduced Risk classification.
c
Registered by the USEPA.
Source: Ref. 12.
T
ABLE
10 New or Recently Registered Crop Protection Chemicals—
Insecticides, Miticides, and Nematicides
Compound
a
Company Trade name
Acetamiprid
b,c
(I) Aventis Assail, Adjust, Pristine
Bifenzate
b,c
(M) Uniroyal Floramite, Acramite
Bifenthrin
c
(I) FMC Brigade, Capture
Buprofezin
b,c
(I) Aventis Applaud
Clofentezine
c
(M) Aventis Apollo
Cyfluthrin
c
(I) Bayer Baythroid
Emamectin benzoate
c
(I) Syngenta Proclaim, Strategy
Etoxazole
b,c
(M) Valent Secure
Fenoxycarb
c
Syngenta Comply
Fenpropathrin
c
(I) Valent Danitol
Fipronil
b,c
(I) Aventis Regent
Fosthiazate (N) ISK Nemathorin
Halofenozide/RH-0345
b,c
(I) Dow AgroSciences Mach 2
Hexythiazox
c
(M) Gowan Savey
Imidacloprid
c
(I) Bayer Admire, Gaucho, Provado
Indoxacarb
b,c
(I) DuPont Steward, Avaunt
Lambda-cyhalothrin
c
(I) Syngenta Karate, Warrior
Lufenuron (I) Syngenta Match
Methoxyfenozide
b,c
(I) Dow AgroSciences Intrepid
Milbemectin
b
(M) Gowan/Sankyo Milbeknock
Novaluron
b
(I) Makteshim-Agan Rimon
Pymetrozine
b,c
(I) Syngenta Fulfill
Pyridaben
c
(I,M) BASF Pyramite
Pyriproxyfen
b,c
(I) Valent Knack, Distance, Esteem
Spinosad
b,c
(I) Dow AgroSciences Success, Spintor
Tebufenozide
b,c
(I) Dow AgroSciences Confirm, Mimic
Tebupirimphos
c
(I) Bayer Aztec (w/cyfluthrin)
Tefluthrin
c
(I) Syngenta Force
Thiamethoxam (I) Syngenta Actara, Cruiser, Adage
Triazamate (I) Dow AgroSciences Aphistar
a
I ϭ insecticide; M ϭ miticide; N ϭ nematicide.
b
In the USEPA Reduced Risk classification.
c
Registered by the USEPA.
Source: Ref. 12.
T
ABLE
11 New or Recently Registered Crop Protection
Chemicals—Fungicides
Compound
a
Company Trade name
Acibenzolar
a,b
Syngenta Actigard
Azoxystrobin
a,b
Syngenta Abound, Quadras, Heritage
Cymoxanil
b
DuPont Curzate
Cyproconazole
b
Syngenta Alto
Cyprodinil
a,b
Syngenta Vangard, Switch (w/ fludioxonil)
Difenoconazole
b
Syngenta Dividend
Dimethomorph
b
BASF Acrobat
Famoxadone DuPont Famoxate, Charisma, Equation
Fenamidone Aventis Reason
Fenbuconazole
b
Dow AgroSciences Indar, Enable
Fenhexamid
a,b
Arvesta Elevate
Fluazinam
a,b
Syngenta Omega
Fludioxonil
a,b
Syngenta Maxim, Scholar, Switch
(w/ cyprodinil)
Flutolanil
b
Gowan Moncut
Harpin protein
a,b
Eden Biosciences Messenger
Kresoxim-methyl
a,b
BASF Sovran, Cygnus
Myclobutanil
b
Dow AgroSciences Rally, Nova
Picoxystrobin Syngenta Acanto
Propamocarb-HCl
b
Aventis Tattoo
Propiconazole
b
Syngenta Tilt, Orbit
Pyraclostrobin BASF Headline, Cabrio
Pyrimethanil Aventis Scala
Quinoxyfen Dow AgroSciences Arius, Quintec
Spiroxamine Bayer Proper, Impulse, Hogger
Tebuconazole
b
Bayer Folicur, Elite, Raxil
Trifloxystrobin
a,b
Bayer Flint, Twist
Triflumizole
b
Uniroyal Procure, Terraguard
Trifluzamide Dow AgroSciences RHO753
c
Zoxamide
a,b
Dow AgroSciences Gavel
a
In the USEPA Reduced Risk classification.
b
Registered by the USEPA.
c
Trade name not available.
Source: Ref. 12.
duced Risk chemistries a primary discovery and development goal, as can be
noted by the number of products with this classification in each table. Discovery
and development of many of these chemistries were made possible by many of
the technologies noted in the previous section, especially combinational chemis-
try and high-throughput screening, with more targeted assay systems.
However, not all new discoveries came from the traditional synthesis route.
Two notable exceptions were Spinosad from Dow AgroSciences and the strobi-
lurin fungicides from Syngenta (Zeneca) and BASF. Spinosad is a naturally oc-
curring mixture of two active components, 85% spinosyn A and 15% spinosyn
B, produced by a bacterium originally isolated from a soil sample taken from a
Jamaican rum distillery. These compounds are macrolides with a unique tetracy-
clic ring system with different attached sugars. Spinosad is produced by fermenta-
tion and has been widely adapted in crop protection systems because of its high
efficacy on target insects and safety to beneficial species making it ideal for use
in integrated pest management systems. Its unique mode of action has resulted
in a lack of cross-resistance problems.
The origin of azoxystrobin can be traced back to a family of fungicidal
natural products that are derivatives of β-methoxyacrylic acid—the strobilurins,
audemansins, and myxothiazols [6]. The strobilurins are formed in several genera
of small fungi that typically grow high on beech trees. The fungicidal activity
of these natural products relies on their ability to inhibit fungal mitochondrial
electron transport at a specific cytochrome b binding site. Because no commercial
fungicides had that specific mode of action, the class of strobilurin chemistry
made excellent synthetic targets because, unlike Spinosad, the natural products
were unsatisfactory themselves for agricultural purposes due to unsuitable phys-
ical properties, insufficient activity, and fermentation scale-up costs. Several
companies, noted previously, initiated analog synthesis programs around this
chemistry that resulted in kresoxim-methyl, azoxystrobin, picoxystrobin, and
trifloxystrobin.
These examples are meant to highlight the diversity in the discovery pro-
cess that has led to the explosion of new chemistries with unique modes of action
as outlined in Tables 9–11. With all of the powerful combinational chemistry,
high-throughput screening, genomic, information technology, and robotic tools
available to industry chemists, biologists (traditional and molecular), and bio-
chemists, we expect this new discovery momentum to continue as we enter the
twenty-first century. However, a few factors could slow this trend in new-mole-
cule discovery. The increasing consolidation of companies noted previously is
placing pressures on company management to hold research costs level or de-
crease them slightly. Because the biotechnology programs in many companies
compete for the same research dollars as the traditional chemical discovery pro-
grams, the traditional approaches are being squeezed as the newer approaches
gain momentum. Time will tell whether efficiencies in new compound synthesis
and screening will offset funding decreases. However, if the past is any indicator,
the future holds many exciting new developments that will certainly surprise and
possibly astound us when they occur and when we take a backward look in an-
other 25 years.
9 PLANT BIOTECHNOLOGY
Perhaps no technology in twentieth century agriculture has raised more hopes
and elicited more concern than plant biotechnology. The application of emerging
molecular biological discoveries to agriculture had its humble beginnings at com-
panies like Monsanto in the 1970s. This low-key, long-range research effort inten-
sified in the 1980s, with many skeptics believing that no practical good would
result for the tens and hundreds of millions of dollars invested in this technology.
However, those doubts disappeared rapidly in the 1990s as the input benefits of
herbicide-tolerant and insect-resistant major row crop plants became evident. As
mentioned earlier, the technology adoption rate for Roundup Ready soybeans
(i.e., soybean plants tolerant to the nonselective herbicide glyphosate) was twice
as rapid as the adoption rate for hybrid corn, and the new seed accounted for
over half of the U.S. crop in 1999 (Table 12). By 1999, over one-fourth of the
U.S. corn crop and half the U.S. cotton crop were genetically modified varieties.
Stacked genes (i.e., plants with two traits such as Roundup Ready and Bt insect-
tolerant) were beginning to make significant market inroads, especially in cotton.
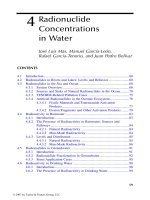
On a global basis, the adoption rate of this technology has been quite vari-
able (Fig. 5). The United States (72%), Argentina (17%), and Canada (10%)
accounted for 99% of all the global acreage planted to genetically modified soy-
beans (54%), corn (28%), cotton (9%), and canola (9%). Herbicide-tolerant crops
accounted for 71% of the planted acres, and insect-resistant plants with the Bt
T
ABLE
12 Impact of Plant Biotechnology on U.S. Crop Acreage
Millions of acres planted
Year
Technology introduced 1996 1997 1998 1999
BXN cotton 1995 0.15 0.17 0.8 1.1
Roundup Ready soybeans 1996 1.4 9 27 35
Bt corn 1996 1.0 6 15 21
Bt cotton 1996 1.8 2.5 2.4 2.4
Roundup Ready cotton 1997 0 0.43 2.3 3.4
Roundup Ready and Bt cotton 1997 0 0.07 0.48 1.6
Liberty Link corn 1997 0 0.7 2 5
Roundup Ready corn 1998 0 0 0.9 2.3
Source: Agrow (various issues) and USDA acreage reports.
F
IGURE
5 Impact of plant biotechnology on global crop acreages. (*) “Oth-
ers” includes China, Australia, South Africa, Mexico, Spain, Portugal, France,
Romania, and Ukraine. (Data from Chemical Engineering News, Nov 1, 1999,
and Agrow, Nov 12, 1999.)
gene accounted for 22%; the remaining 6% were planted to crops with both traits.
However, the technology has not been as warmly received in Europe, where only
10 plant biotechnology products had passed European regulatory review in 1999
compared to over 60 in the United States. Japan appeared to be more positive
and had approved 20 plant biotechnology products.
In Europe, consumer concerns resulted in a backlash against foods derived