Predicting Chemical Toxicity and Fate - Section 4 pdf
Bạn đang xem bản rút gọn của tài liệu. Xem và tải ngay bản đầy đủ của tài liệu tại đây (974.98 KB, 122 trang )
SECTION 4
QSARs for Environmental Toxicity and Fate
© 2004 by CRC Press LLC
C
HAPTER
12
Development and Evaluation of QSARs for Ecotoxic
Endpoints: The Benzene Response-Surface
Model for Tetrahymena Toxicity
T. Wayne Schultz and Tatiana I. Netzeva
CONTENTS
I. Introduction
II. Background
A. Toxicity Data
B. Chemical Descriptor Data
C. Statistical Methods
III. Materials and Methods
A. Test Chemicals
B. Biological Data
C. Molecular Descriptors
D. Statistical Analyses
E. Data Selection
IV. Results
A. Initial Benzene Response-Surface Model
B. Evaluation of the Benzene Response-Surface Model
C. Combined Benzene Response-Surface Model
V. Discussion
References
I. INTRODUCTION
As the uses of toxicological-based quantitative structure-activity relationships (QSARs) move
into the arenas of priority setting, risk assessment, and chemical classification and labeling the
demands for a better understanding of the foundations of these QSARs are increasing. Specifically,
issues of quality, transparency, domain identification, and validation have been recognized as topics
of particular interest (Schultz and Cronin, 2003).
Quality QSAR can only be constructed and validated with quality data, but quality in a QSAR
is more than a high coefficient of determination. Transparency has several different meanings as it
© 2004 by CRC Press LLC
applies to QSARs. First, transparency means that the data, both biological and chemical, that are
used in QSAR development and validation are available for examination. Second, models, which
are developed with descriptors that quantify the pivotal aspects of toxic expression, are considered
to be mechanistic-based, fundamental, and more easily interpreted, and thus transparent. Transpar-
ency can also mean the amount of process information obtainable from the statistical methodology;
it goes from the black boxes of neural networks to interpretable multiple linear regression. Since
the use of a particular QSAR is only valid within its domain (Schultz and Cronin, 2003), identifi-
cation of that domain is critical to QSAR acceptability.
In this present analysis concerns about quality, transparency, and domain identification are
addressed in the validation of a previous developed QSAR. This QSAR examines the prediction
of ectotoxic potency for population growth impairment to the aquatic ciliate Tetrahymena pyriformis
by substituted benzenes.
II. BACKGROUND
The basic concept of QSAR as applied to toxicology has been reviewed several times; the most
recent efforts include that of Walker and Schultz (2002). There are three elements to a QSAR: the
toxicological data, the descriptor data, and the statistical method of linking the two data sets (Schultz
et al., 2002). The function of a toxicological QSAR is to predict toxicity accurately. To meet this
goal knowledge of the toxicological and chemical information on which the model is based is
essential. A number of computer-assisted statistical methods are available for the development of
QSAR models. Each method has advantages, disadvantages, and practical constraints.
Issues of quality, transparency, and domain may apply to each of the three components of a
QSAR and may be multifactoral because of interactions among components. The development of
a toxicity-based QSAR is an integrated process requiring a working knowledge in chemistry,
toxicology, and statistics. Determining the quality of a QSAR is frequently a difficult task. In part,
this is because structure-toxicity relationships are simple approximations of complex processes that
are not comprehended well (Nendza and Russom, 1991). Transparency is a critical issue for
regulatory acceptance and wider use of QSARs (Blaauboer et al., 1999). It is worth noting that the
use of mechanism-based descriptors, while transparent, differs from the QSAR being based on a
mechanism of toxic action. The latter is biochemical based, while the former, at least as it related
to aquatic toxicity, is physicochemical and quantum chemical based.
One approach to developing QSARs has been the use of congeneric series of chemicals. While
it is easy in the case of a congeneric series to identify the chemical domain, the congeneric series-
derived QSAR is of little predictive value precisely because of the narrow structural domain on
which they are based (Kaiser et al., 1999). Even within homologous series, efforts such as selecting
derivatives with markedly different substitutents can be made to optimize molecular diversity and
thus the domain.
A. Toxicity Data
Central to the issues of quality, transparency, and domain identification as they relate to
toxicological QSAR is biological data. High quality toxicity data on a structurally diverse set of
molecules are required to formulate and validate high quality QSARs. Quality toxicity data typically
come from standardized assays measured in a consistent manner, with a clear and unambiguous
endpoint, and low experimental error. In such cases, quality is associated with values, which are
accurate, consistent with other data within the same set, and consistent with data for other similar
endpoints. In the case of comparisons between endpoints, it is as important for data to be consistent
between endpoints as for the inconsistencies to be consistent.
© 2004 by CRC Press LLC
The inhibition of growth of the ciliated protozoan T. pyriformis database (Schultz, 1997) is
considered to be a high quality data set (Bradbury et al., 2003). It has been developed in a single
laboratory over more than two decades. While numerous workers using slight variations in the
static protocol and nominal concentrations have generated the data, the data set still remains an
excellent primary source of information; it is also unique in terms of its size, molecular diversity,
and quality. Moreover, these data have been compiled for the express purpose of QSAR development
and validation.
All toxicity measurements are subject to experimental error. The reality of toxicity testing is
that however standardized the protocol, it is not possible to obtain precise potency data. Therefore,
toxicity values are often reported as the mean from a series of replicates. However, different
toxicological measurements have different amounts of error associated with them. Toxicity assess-
ments made in a single laboratory by a single protocol tend to be the most precise. Even within
such testing, there is varying reproducibility between toxicants. In a study of T. pyriformis toxicity
data, it was observed that the variability in measured values was greater for chemicals considered
to be reactive, than for those thought to act through a narcosis mode of action (Seward et al., 2001).
B. Chemical Descriptor Data
The primary supposition of any toxicological QSAR is that the potency of a compound is
dependent upon its molecular structure, which is typically quantified by chemical properties (Schultz
et al., 2002). Chemical descriptors include a variety of types, including atom, substituent, and
molecular parameters. The most transparent of these are the molecular-based empirical and quantum
chemical descriptors. Empirical descriptors are measured descriptors and include physicochemical
properties such as hydrophobicity (Dearden, 1990). Quantum chemical properties are theoretical
descriptors and include charge and energy values (Karelson et al., 1996). Physicochemical and
quantum chemical descriptors are for the most part easily interpretable with regard to how that
property may be related to toxicity. The classic example of this, the partitioning of a toxicant
between aqueous and lipid phases, has been used as a measure of hydrophobicity for over a century
(Livingstone, 2000).
From the perspective of T. pyriformis population growth inhibition, there are limited controlling
events (e.g., bio-uptake). One is able to develop probabilistic models where the analysis of single
aspects of the system is replaced by the study of time-ensemble averaging of a range of procedures.
Such an approach allows one to development a QSAR without regular knowledge of the living
system under investigation. Historically in the modeling of T. pyriformis toxicity, this ploy has
worked well because it has been possible to identify global actions (e.g., bio-uptake) that appear
to be autonomous from specific molecular events.
Toxicity is a multivariate process based on events that are not well understood. For the purposes
of modeling aquatic toxicity such as fish acute toxicity or Tetrahymena population growth impair-
ment, the limited number of controlling aspects means that not every toxicological process must
be evaluated, or even understood, in order to get useful QSARs. Experiences (Veith et al., 1983)
have pointed toward the use of descriptors, which quantify information on a key process (i.e., bio-
uptake). These experiences have shown that combinations of select descriptors can provide infor-
mation on an integrated group of toxicological processes (Mekenyan and Veith, 1993). These might
include macroscale measurements, such as measures of hydrophobicity and electrophilic reactivity,
and microscale measurements of key processes such as steric hindrance (Karabunarliev et al., 1996a).
The latter turn out to be especially useful for explaining observed variability in reactive-based
ecotoxicity.
Like toxicity assessments, descriptor values used in QSARs are also subject to variability. This
fact is sometimes unnoticed, especially when values for descriptors are produced by software
packages (Benfenati et al., 2001). In a study of the molecular orbital properties of pyridines, Seward
© 2004 by CRC Press LLC
et al. (2001) demonstrated that a mean of nine values was required to obtain consistent values for
the energies of the highest occupied molecular orbital and lowest unoccupied molecular orbital.
Moreover, Benfenati et al. (2001) demonstrated variability of up to 23% in conformationally
dependent descriptors.
C. Statistical Methods
Some type of statistical technique is required to link the toxic potencies of the series of chemicals
to their molecular descriptors. These techniques range from linear least squares regression analyses,
to multivariate techniques including the use of principal component analysis and partial least
squares, and to neural networks and genetic algorithms (see Chapter 7 and Livingstone [1995]).
These statistical techniques vary in their transparency (i.e., the amount of process information
obtainable from the statistical methodology). The automatic self-adapting methodologies of genetic
algorithms and neural networks are largely black boxes, whereas multiple linear regression equa-
tions are, at least from physicochemical and quantum chemical viewpoints, unambiguous.
The best models to predict aquatic toxicity are ones that are simple and interpretable. A
regression-based QSAR established with fundamental descriptors maximizes the interpretability of
the model, while at the same time maintaining simplicity. Such QSARs are easily updated, capable
of mechanistic-based interpretation, portable from one user to another, and allow the user to observe
and comprehend how the prediction of toxic potency is made (Schultz and Cronin, 2003).
III. MATERIALS AND METHODS
A. Test Chemicals
More than 400 substituted benzenes representing several mechanisms of toxic action were
evaluated. The molecules were obtained commercially (Aldrich Chemical Co., Milwaukee, WI;
MTM Research Chemicals or Lancaster Synthesis Inc., Windham, NH). In the large majority of
cases purity was greater than 95%.
B. Biological Data
Population growth impairment testing with the common ciliate, T. pyriformis (strain GL-C),
was conducted following the protocol described by Schultz (1997). This 40-h assay is static in
design and uses population density quantified spectrophotometrically at 540 nm as its endpoint.
The test protocol allows for 8 to 9 cell cycles in controls. Following range finding, each chemical
was tested in three replicate tests (or assays). Two controls were used to provide a measure of the
acceptability of the test by indicating the suitability of the medium and test conditions as well as
a basis for interpreting data from other treatments. The first control had no test substance, but was
inoculated with T. pyriformis. The other, a blank, had neither test substance nor inoculum. Each
test replicate consisted of six to ten different concentrations of each test material with duplicate
flasks of each concentration. Only replicates with control-absorbency values greater than 0.60 but
less than 0.90 were used in the analyses.
C. Molecular Descriptors
Hydrophobicity was quantified by the logarithm of the 1-octanol-water partition coefficient (log
K
ow
) values. The hydrophobicity values were measured or estimated by the ClogP (ver 3.55)
software (BIOBYTE Corp., Claremont, CA, USA). The acceptor superdelocalizabilities were deter-
mined as a sum of the ratios between the squared eigenvectors (coefficients) of the i-th atomic
© 2004 by CRC Press LLC
orbital in the j-th unoccupied molecular orbital and the eigenvalue (energy) of the j-th unoccupied
molecular orbital, multiplied by two. The calculations were performed using the Austin Model 1
(AM1) method implemented in MOPAC 93 (Fujitsu Ltd., Windows 95/98/NT/2k adaptation and
MO indices by J. Kaneti [1988–1994] MO-QC). The maximum acceptor superdelocalizabilities
(A
max
) were extracted by in-house macros in Microsoft Word and Excel.
D.Statistical Analyses
The 50% growth inhibitory concentration (IGC
50
) was determined for each compound tested
by Probit Analysis using the Statistical Analysis System (SAS) software (SAS Institute, 1989). The
y-values were absorbencies normalized as percentage of control. The x-values were the toxicant
concentrations in mg/L. QSARs were developed using the regression procedures of MINITAB
version 13.0 (MINITAB Inc., State College, PA) and Statistical Package for Social Sciences (SPSS
version 10.0.5) software (SPSS Inc., Chicago IL, USA). Log (IGC
50
)
–1
values reported as mM were
used as the dependent variable. Log K
ow
and electrophilicity (A
max
)acted as the independent
variables. Resulting models were measured for fit by the coefficient of determination adjusted to
the degrees of freedom (R
2
adj). The uncertainty in the model was noted as the square root of the
mean square for errors, while the predictivity of the model was noted as the R
2
pred. determined
by the leave-one-out method (see Chapter 7). Outliers were identified as compounds with a
standardized residual greater than three (Lipnick, 1991).
E. Data Selection
For structure-toxicity models data were confined to selected domains. Specifically, substructures
not included in these evaluations were carboxylic acids, catechols, hydroquinones, and benzoquino-
nes. The training set, the response-plane model, consisted of the 215 substituted benzenes for which
measured toxic response data (i.e., IGC
50
) prior to saturation were reported by Schultz (1999). The
distribution of the training set chemicals based on their electrophilicity measured as A
max
is shown
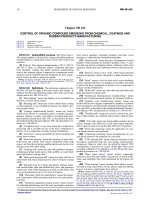
in Figure 12.1(a). The validation set was selected from an initial group of 450 candidates limited
to commercially available substituted benzenes within the descriptor domain of the training set.
Final selection of the validation set was based on attaining a data set that mimicked the A
max
distribution training set. The distribution of the 177 validation set chemicals based on their A
max
values is shown in Figure 12.1(b), which compares very favorably with Figure 12.1(a).
IV. RESULTS
A. Initial Benzene Response-Surface Model
Earlier work by Schultz (1999) examined the toxicity (log (IGC
50
)
–1
) of a heterogeneous series
of 218 substituted benzenes (200 benzenes for training and 18 for external validation). Because of
the use of a different algorithm for the determination of A
max
values, previously reported data on
benzene toxicity were re-evaluated. The data for toxicity along with hydrophobicity and newly
calculated electrophilicity are reported in Table 12.1. Toxicity values varied uniformly over four
orders of magnitude (from –1.13 to 2.82 on a log scale). Hydrophobicity varied over about six
orders of magnitude (from –0.55 to 5.76 on a log scale). Reactivity measured by A
max
varied on a
linear scale from 0.280 to 0.385.
To investigate the influence of the change of the algorithm for A
max
calculation on the coefficients
in the model, only the compounds, considered in Schultz (1999) for training (n = 200) were used
in the analysis (see Table 12.1). The compounds, being not toxic at saturation as well as those
detected as outliers in Schultz (1999), were excluded prior to the modeling. The resulting equation:
© 2004 by CRC Press LLC
Figure 12.1 Histogram charts of (a) compounds used for the initial response-surface (Equation 12.3) and (b) for
external validation (Equation 12.4).
Figure 12.1 (continued).
Amax
Frequency
40
30
20
10
0
.285 .295 .305 .315 .325 .335 .345 .355 .365 .375 .385
22
32
28
34
23 23
17
13
11
8
3
Amax
Frequency
40
30
20
10
0
.285 .295 .305 .315 .325 .335 .345 .355 .365 .375 .385
22
32
28
35
21
23
13
2
© 2004 by CRC Press LLC
Table 12.1 Toxicity to T. pyriformis (Log [IGC
50
]
–1
), Octanol-Water Partition Coefficient (Log K
ow
),
and Maximum Acceptor Superdelocalizability (A
max
) Values for the Compounds
Published by Schultz (1999)
No. CAS Name Log (IGC
50
)
–1
Log K
ow
A
max
1 71-43-2 Benzene –0.12 2.13 0.280
2 106-42-3 4-xylene 0.25 3.15 0.283
3 120055-09-6 1-Phenyl-2-butanol –0.16 2.02 0.284
4 108-88-3 Toluene 0.25 2.73 0.284
5 104-51-8 n-Butylbenzene 1.25 4.26 0.284
6 538-68-1 n-Amylbenzene 1.79 4.90 0.284
7 100-46-9 Benzylamine –0.24 1.09 0.284
8 98-82-8 Isopropylbenzene 0.69 3.66 0.285
9 2430-16-2 6-Phenyl-1-hexanol 0.87 3.30 0.285
10 10521-91-2 5-Phenyl-1-pentanol 0.42 2.77 0.285
11 103-05-9 E,E-Dimethylbenzenepropanol –0.07 2.42 0.285
12 3360-41-6 4-Phenyl-1-butanol 0.12 2.35 0.285
13 122-97-4 3-Phenyl-1-propanol –0.21 1.88 0.285
14 100-51-6 Benzyl alcohol –0.83 1.05 0.285
15 98-85-1 (Sec)phenethyl alcohol –0.66 1.42 0.285
16 768-59-2 4-Ethylbenzyl alcohol 0.07 2.13 0.285
17 2722-36-3 3-Phenyl-1-butanol 0.01 2.11 0.286
18 22144-60-1 (R+-)-1-Phenyl-1-butanol –0.01 2.47 0.286
19 3597-91-9 4-Biphenylmethanol 0.92 2.99 0.287
20 5707-44-8 4-Ethylbiphenyl 1.97 5.06 0.288
21 92-52-4 Biphenyl 1.05 3.98 0.288
22 1565-75-9 (s)-2-Phenyl-2-butanol 0.06 2.34 0.288
23 5342-87-0 (s)-1,2-Diphenyl-2-propanol 0.80 3.23 0.290
24 29338-49-6 1,1-Diphenyl-2-propanol 0.75 2.93 0.290
25 95-64-7 3,4-Dimethylaniline
b
–0.16 1.86 0.293
26 1877-77-6 3-Aminobenzyl alcohol
b
–1.13 –0.55 0.293
27 4344-55-2 4-Butoxyaniline 0.61 2.59 0.293
28 39905-50-5 4-Pentyloxyaniline 0.97 3.12 0.293
29 39905-57-2 4-Hexyloxyaniline 1.38 3.65 0.293
30 106-49-0 4-Methylaniline –0.05 1.39 0.293
31 99-88-7 4-Isopropylaniline
b
0.22 2.47 0.293
32 587-02-0 3-Ethylaniline –0.03 1.94 0.294
33 589-16-2 4-Ethylaniline 0.03 1.96 0.294
34 108-44-1 3-Methylaniline –0.28 1.40 0.294
35 104-13-2 4-Butylaniline 1.07 3.18 0.294
36 103-63-9 (2-Bromoethyl)benzene 0.42 3.09 0.294
37 95-53-4 2-Methylaniline –0.16 1.43 0.294
38 24544-04-5 2,6-Diisopropylaniline 0.76 3.18 0.294
39 62-53-3 Aniline –0.23 0.90 0.295
40 578-54-1 2-Ethylaniline –0.22 1.74 0.295
41 579-66-8 2,6-Diethylaniline 0.31 2.87 0.295
42 100-68-5 Thioanisole 0.18 2.74 0.296
43 150-76-5 4-Methoxyphenol –0.14 1.34 0.298
44 527-54-8 3,4,5-Trimethylphenol 0.93 2.87 0.298
45 100-44-7 Benzyl chloride 0.06 2.30 0.298
46 104-93-8 4-Methylanisole 0.25 2.81 0.299
47 697-82-5 2,3,5-Trimethylphenol 0.36 2.92 0.299
48 527-60-6 2,4,6-Trimethylphenol 0.42 2.73 0.299
49 98-54-4 4-(Te r t )butylphenol 0.91 3.31 0.300
50 80-46-6 4-(Te r t )-pentylphenol 1.23 3.83 0.300
51 2416-94-6 2,3,6-Trimethylphenol 0.28 2.67 0.300
52 103-73-1 Phenetole –0.14 2.51 0.300
53 100-66-3 Anisole –0.10 2.11 0.300
54 105-67-9 2,4-Dimethylphenol 0.14 2.35 0.300
55 127-66-2 2-Phenyl-3-butyn-2-ol –0.18 1.88 0.300
56 106-44-5 p-Cresol (4-methylphenol) –0.16 1.97 0.300
© 2004 by CRC Press LLC
Table 12.1 (continued) Toxicity to T. pyriformis (Log [IGC
50
]
–1
), Octanol-Water Partition Coefficient
(Log K
ow
), and Maximum Acceptor Superdelocalizability (A
max
) Values for the Compounds
Published by Schultz (1999)
No. CAS Name Log (IGC
50
)
–1
Log K
ow
A
max
57 123-07-9 4-Ethylphenol 0.21 2.50 0.300
58 645-56-7 4-Propylphenol 0.64 3.20 0.300
59 620-17-7 3-Ethylphenol 0.29 2.50 0.300
60 104-40-5 Nonylphenol 2.47 5.76 0.300
61 108-39-4 m-Cresol (3-methylphenol) –0.08 1.98 0.300
62 95-48-7 o-Cresol (2-methylphenol) –0.29 1.98 0.301
63 90-00-6 2-Ethylphenol 0.16 2.47 0.301
64 108-95-2 Phenol –0.35 1.50 0.301
65 1745-81-9 2-Allylphenol 0.33 2.55 0.301
66 591-50-4 Iodobenzene 0.36 3.25 0.301
67 106-47-8 4-Chloroaniline 0.05 1.83 0.302
68 529-19-1 2-Tolunitrile –0.24 2.21 0.302
69 501-94-0 4-Hydroxyphenethyl alcohol
b
–0.83 0.52 0.303
70 615-65-6 2-Chloro-4-methylaniline 0.18 2.41 0.303
71 95-51-2 2-Chloroaniline –0.17 1.88 0.304
72 500-66-3 5-Pentylresorcinol 1.31 3.42 0.305
73 150-19-6 3-Methoxyphenol –0.33 1.58 0.305
74 136-77-6 4-Hexylresorcinol
a
1.80 3.45 0.306
75 88-04-0 4-Chloro-3,5-dimethylphenol 1.20 3.48 0.306
76 106-38-7 4-Bromotoluene 0.47 3.50 0.306
77 1585-07-5 1-Bromo-4-ethylbenzene 0.67 4.03 0.306
78 623-12-1 4-Chloroanisole 0.60 2.79 0.307
79 59-50-7 4-Chloro-3-methylphenol 0.80 3.10 0.307
80 108-46-3 1,3-Dihydroxybenzene –0.65 0.80 0.307
81 108-86-1 Bromobenzene 0.08 2.99 0.308
82 106-48-9 4-Chlorophenol 0.54 2.39 0.308
83 540-38-5 4-Iodophenol
b
0.85 2.90 0.311
84 156-41-2 2(4-Chlorophenyl)ethylamine
b
0.14 2.00 0.311
85 104-86-9 4-Chlorobenzylamine 0.16 1.81 0.311
86 554-00-7 2,4-Dichloroaniline 0.56 2.78 0.311
87 108-90-7 Chlorobenzene
a
–0.13 2.84 0.311
88 108-42-9 3-Chloroaniline 0.22 1.88 0.312
89 99-51-4 1,2-Dimethyl-4-nitrobenzene 0.59 2.91 0.314
90 5736-91-4 4-(Pentyloxy)benzaldehyde 1.18 3.89 0.315
91 99-99-0 4-Nitrotoluene 0.65 2.37 0.315
92 122-03-2 4-Isopropylbenzaldehyde 0.67 2.92 0.316
93 83-41-0 1,2-Dimethyl-3-nitrobenzene 0.56 2.83 0.316
94 108-43-0 3-Chlorophenol 0.87 2.50 0.317
95 99-08-1 3-Nitrotoluene 0.42 2.45 0.317
96 88-72-2 2-Nitrotoluene 0.26 2.30 0.317
97 106-37-6 1,4-Dibromobenzene
a
0.68 3.79 0.317
98 100-52-7 Benzaldehyde –0.20 1.48 0.317
99 121-32-4 3-Ethoxy-4-hydroxybenzaldehyde 0.02 1.58 0.317
100 121-33-5 3-Methoxy-4-hydroxybenzaldehyde
b
–0.03 1.21 0.318
101 70-70-2 4d-Hydroxypropiophenone
b
0.12 2.03 0.318
102 120-83-2 2,4-Dichlorophenol 1.04 3.17 0.318
103 1009-14-9 Valerophenone 0.56 3.17 0.318
104 93-55-0 Propiophenone –0.07 2.19 0.318
105 495-40-9 Butyrophenone 0.21 2.77 0.318
106 90-02-8 2-Hydroxybenzaldehyde 0.42 1.81 0.318
107 1671-75-6 Heptanophenone 1.56 4.23 0.318
108 98-86-2 Acetophenone –0.46 1.63 0.318
109 98-95-3 Nitrobenzene 0.14 1.85 0.318
110 1674-37-9 Octanophenone 1.89 4.75 0.318
111 95-82-9 2,5-Dichloroaniline 0.58 2.75 0.318
© 2004 by CRC Press LLC
Table 12.1 (continued) Toxicity to T. pyriformis (Log [IGC
50
]
–1
), Octanol-Water Partition Coefficient
(Log K
ow
), and Maximum Acceptor Superdelocalizability (A
max
) Values for the Compounds
Published by Schultz (1999)
No. CAS Name Log (IGC
50
)
–1
Log K
ow
A
max
112 95-75-0 3,4-Dichlorotoluene 1.07 3.95 0.318
113 99-09-2 3-Nitroaniline 0.03 1.43 0.319
114 626-43-7 3,5-Dichloroaniline 0.71 2.90 0.319
115 7530-27-0 4-Bromo-6-chloro-2-cresol
b
1.28 3.61 0.319
116 95-50-1 1,2-Dichlorobenzene 0.53 3.38 0.319
117 555-03-3 3-Nitroanisole 0.72 2.17 0.321
118 119-61-9 Benzophenone 0.87 3.18 0.321
119 65262-96-6 3-Chloro-5-methoxyphenol 0.76 2.50 0.322
120 100-14-1 4-Nitrobenzyl chloride
b
1.18 2.45 0.323
121 615-58-7 2,4-Dibromophenol
b
1.40 3.25 0.323
122 5922-60-1 2-Amino-5-chlorobenzonitrile 0.44 1.79 0.323
123 552-41-0 2-Hydroxy-4-methoxyacetophenone 0.55 1.98 0.324
124 591-35-5 3,5-Dichlorophenol 1.56 3.61 0.325
125 104-88-1 4-Chlorobenzaldehyde 0.40 2.13 0.325
126 134-85-0 4-Chlorobenzophenone 1.50 3.97 0.325
127 108-70-3 1,3,5-Trichlorobenzene
a
0.87 4.19 0.325
128 636-30-6 2,4,5-Trichloroaniline 1.30 3.69 0.325
129 90-90-4 4-Bromobenzophenone
b
1.26 4.12 0.326
130 120-82-1 1,2,4-Trichlorobenzene 1.08 4.02 0.326
131 88-06-2 2,4,6-Trichlorophenol 1.41 3.69 0.326
132 616-86-4 4-Ethoxy-2-nitroaniline 0.76 2.39 0.326
133 2973-76-4 5-Bromovanillin 0.62 1.92 0.326
134 100-29-8 4-Nitrophenetole 0.83 2.53 0.328
135 89-59-8 4-Chloro-2-nitrotoluene 0.82 3.05 0.328
136 585-79-5 1-Bromo-3-nitrobenzene 1.03 2.64 0.328
137 3217-15-0 4-Bromo-2,6-dichlorophenol
b
1.78 3.52 0.329
138 83-42-1 2-Chloro-6-nitrotoluene 0.68 3.09 0.329
139 3481-20-7 2,3,5,6-Tetrachloroaniline 1.76 4.10 0.330
140 619-24-9 3-Nitrobenzonitrile 0.45 1.17 0.330
141 95-95-4 2,4,5-Trichlorophenol 2.10 3.72 0.330
142 95-94-3 1,2,4,5-Tetrachlorobenzene 2.00 4.63 0.331
143 89-62-3 4-Methyl-2-nitroaniline
b
0.37 1.82 0.331
144 121-73-3 1-Chloro-3-nitrobenzene 0.73 2.47 0.332
145 88-74-4 2-Nitroaniline 0.08 1.85 0.332
146 634-83-3 2,3,4,5-Tetrachloroaniline 1.96 4.27 0.333
147 118-79-6 2,4,6-Bromophenol 1.91 4.08 0.334
148 7149-70-4 2-Bromo-5-nitrotoluene 1.16 3.25 0.334
149 3819-88-3 1-Fluoro-3-iodo-5-nitrobenzene 1.09 3.15 0.335
150 88-75-5 2-Nitrophenol 0.67 1.77 0.335
151 121-87-9 2-Chloro-4-nitroaniline 0.75 2.05 0.336
152 42454-06-8 5-Hydroxy-2-nitrobenzaldehyde 0.33 1.75 0.336
153 576-55-6 3,4,5,6-Tetrabromo-2-cresol 2.57 4.97 0.336
154 58-90-2 2,3,4,6-Tetrachlorophenol 2.18 3.88 0.337
155 350-46-9 1-Fluoro-4-nitrobenzene 0.10 1.89 0.338
156 771-60-8 Pentafluoroaniline 0.26 1.87 0.338
157 577-19-5 1-Bromo-2-nitrobenzene 0.75 2.51 0.338
158 90-59-5 3,5-Dibromosalicylaldehyde 1.65 3.42 0.338
159 618-62-2 3,5-Dichloronitrobenzene 1.13 3.09 0.339
160 610-78-6 4-Chloro-3-nitrophenol 1.27 2.46 0.339
161 4901-51-3 2,3,4,5-Tetrachlorophenol
a
2.72 4.21 0.339
162 2227-79-4 Thiobenzamide 0.09 1.50 0.339
163 100-00-5 1-Chloro-4-nitrobenzene 0.43 2.39 0.340
164 2357-47-3 E,E,E-4-Tetrafluoro-3-toluidine 0.77 2.51 0.341
165 88-73-3 1-Chloro-2-nitrobenzene 0.68 2.52 0.343
166 7147-89-9 4-Chloro-6-nitro-3-cresol
b
1.63 2.93 0.343
© 2004 by CRC Press LLC
Table 12.1 (continued) Toxicity to T. pyriformis (Log [IGC
50
]
–1
), Octanol-Water Partition Coefficient
(Log K
ow
), and Maximum Acceptor Superdelocalizability (A
max
) Values for the Compounds
Published by Schultz (1999)
No. CAS Name Log (IGC
50
)
–1
Log K
ow
A
max
167 87-86-5 Pentachlorophenol 2.07 5.18 0.343
168 99-65-0 1,3-Dinitrobenzene 0.76 1.49 0.345
169 121-14-2 2,4-Dinitrotoluene 0.87 1.98 0.345
170 6641-64-1 4,5-Dichloro-2-nitroaniline 1.66 3.21 0.345
171 771-61-9 Pentafluorophenol
b
1.63 3.23 0.345
172 608-71-9 Pentabromophenol 2.66 4.85 0.346
173 350-30-1 3-Chloro-4-fluoronitrobenzene 0.80 2.74 0.347
174 100-25-4 1,4-Dinitrobenzene 1.30 1.47 0.347
175 99-54-7 3,4-Dichloronitrobenzene 1.16 3.12 0.348
176 89-61-2 2.5-Dichloronitrobenzene 1.13 3.03 0.349
177 2683-43-4 2,4-Dichloro-6-nitroaniline 1.26 3.33 0.349
178 79544-31-3 3,4-Dinitrobenzyl alcohol 1.09 0.59 0.349
179 611-06-3 2,4-Dichloronitrobenzene 0.99 3.09 0.350
180 3209-22-1 2,3-Dichloronitrobenzene 1.07 3.05 0.350
181 528-29-0 1,2-Dinitrobenzene 1.25 1.69 0.351
182 103-72-0 Phenyl isothiocyanate 1.41 3.28 0.352
183 88-30-2 3-Trifluoromethyl-4-nitrophenol 1.65 2.77 0.352
184 305-85-1 2,6-Iodo-4-nitrophenol
b
1.81 3.52 0.353
185 609-89-2 2,4-Chloro-6-nitrophenol
b
1.75 3.07 0.354
186 18708-70-8 1,3,5-Trichloro-2-nitrobenzene 1.43 3.69 0.354
187 89-69-0 1,2,4-Trichloro-5-nitrobenzene 1.53 3.47 0.354
188 17700-09-3 1,2,3-Trichloro-4-nitrobenzene 1.51 3.61 0.357
189 6361-21-3 2-Chloro-5-nitrobenzaldehyde 0.53 2.25 0.357
190 653-37-2 Pentafluorobenzaldehyde 0.82 2.39 0.357
191 709-49-9 2,4-Dinitro-1-iodobenzene 2.12 2.50 0.359
192 117-18-0 2,3,5,6-Tetrachloronitrobenzene
a
1.82 4.38 0.360
193 329-71-5 2,5-Dinitrophenol 1.04 1.86 0.361
194 97-02-9 2,4-Dinitroaniline 0.72 1.72 0.361
195 879-39-0 2,3,4,5-Tetrachloronitrobenzene 1.78 3.93 0.361
196 771-69-7 1,2,3-Trifluoro-4-nitrobenzene 1.89 2.01 0.362
197 6306-39-4 1,2-Dichloro-4,5-dinitrobenzene 2.21 2.93 0.365
198 606-22-4 2,6-Dinitroaniline 0.84 1.79 0.366
199 534-52-1 4,6-Dinitro-2-methylphenol 1.73 2.12 0.366
200 4097-49-8 4-(Te rt )butyl-2,6-dinitrophenol 1.80 3.61 0.367
201 584-48-5 1-Bromo-2,4-dinitrobenzene 2.31 2.29 0.368
202 51-28-5 2,4-Dinitrophenol (nonneutralized) 1.06 1.54 0.368
203 28689-08-9 1,5-Dichloro-2,3-dinitrobenzene 2.42 2.85 0.369
204 3531-19-9 6-Chloro-2,4-dinitroaniline 1.12 2.46 0.370
205 1817-73-8 2-Bromo-4,6-dinitroaniline 1.24 2.61 0.372
206 314-41-0 2,3,4,6-Tetrafluoronitrobenzene 1.87 1.86 0.372
207 573-56-8 2,6-Dinitrophenol 0.83 1.33 0.372
208 97-00-7 1-Chloro-2,4-dinitrobenzene 2.16 2.14 0.374
209 70-34-8 2,4-Dinitro-1-fluorobenzene 1.71 1.47 0.375
210 880-78-4 Pentafluoronitrobenzene
a
2.43 2.00 0.378
211 20098-38-8 1,4-Dinitrotetrachlorobenzene 2.82 3.44 0.380
212 327-92-4 1,5-Difluoro-2,4-dinitrobenzene
a
2.08 1.31 0.384
213 2678-21-9 1,3-Dinitro-2,4,5-trichlorobenzene 2.60 3.05 0.385
214 6284-83-9 1,3,5-Trichloro-2,4-dinitrobenzene hemihydrate 2.19 2.97 0.385
215 1930-72-9 4-Chloro-3,5-dinitrobenzonitrile
a
2.66 1.37 0.393
216 82-68-8 Pentachloronitrobenzene NTAS
c
4.64 0.364
217 608-93-5 Pentachlorobenzene NTAS 5.17 0.339
218 1825-21-4 Pentachloroanisole NTAS 5.45 0.339
a
Outliers to Equation 12.2 reported by Schultz (1999).
b
Compounds used for external validation in Schultz (1999).
c
Not toxic at saturation.
© 2004 by CRC Press LLC
Table 12.2 Toxicity to T. pyriformis (Log [IGC
50
]
–1
), Octanol-Water Partition Coefficient
(Log K
ow
) and maximum Acceptor Superdelocalizability (A
max
) Values
for the Compounds Used for External Validation
No. CAS Name Log (IGC
50
)
–1
Log K
ow
A
max
1 14898-87-4 1-Phenyl-2-propanol –0.62 1.97 0.283
2 589-18-4 4-Methylbenzyl alcohol –0.49 1.58 0.284
3 705-73-7 (s)-1-Phenyl-2-pentanol 0.16 2.55 0.284
4 536-60-7 4-Isopropylbenzyl alcohol 0.18 2.53 0.284
5 3261-62-9 2-(4-tolyl)ethylamine –0.04 1.78 0.284
6 104-84-7 4-Methyl benzylamine –0.01 2.81 0.284
7 587-03-1 3-Methylbenzyl alcohol –0.24 1.60 0.285
8 104-54-1 3-Phenyl-2-propen-1-ol –0.08 1.95 0.285
9 877-65-6 4-(Te rt )butylbenzyl alcohol 0.48 2.93 0.285
10 699-02-5 4-Methylphenethyl alcohol –0.26 1.68 0.285
11 618-36-0 1-Phenylethylamine –0.18 1.40 0.285
12 89-95-2 2-Methylbenzyl alcohol –0.43 1.55 0.285
13 100-86-7 2-Methyl-1-phenyl-2-propanol –0.41 1.86 0.285
14 589-08-2 n-Methylphenethylamine –0.41 1.43 0.285
15 582-22-9 F-Methylphenethylamine –0.28 1.68 0.285
16 22135-49-5 (Ss)-1-Phenyl-1-butanol –0.09 2.47 0.286
17 93-54-9 (s)1-Phenyl-1-propanol –0.43 1.94 0.286
18 60-12-8 Phenethyl alcohol –0.59 1.36 0.286
19 1123-85-9 2-Phenyl-1-propanol –0.40 1.58 0.286
20 617-94-7 2-Phenyl-2-propanol –0.57 1.81 0.288
21 89104-46-1 2-Phenyl-1-butanol –0.11 2.11 0.288
22 91-01-0 Benzhydrol 0.50 2.67 0.289
23 622-32-2 Benzaldoxime –0.11 1.75 0.291
24 108-69-0 3,5-Dimethylaniline –0.36 1.91 0.293
25 769-92-6 4-(Te rt )butylaniline 0.36 2.70 0.293
26 95-68-1 2,4-Dimethylaniline –0.29 1.68 0.293
27 2046-18-6 4-Phenylbutyronitrile 0.15 2.21 0.293
28 88-05-1 2,4,6-Trimethylaniline –0.05 2.31 0.293
29 645-59-0 3-Phenylpropionitrile –0.16 1.72 0.294
30 30273-11-1 4-(Sec)-butylaniline 0.61 2.87 0.294
31 87-59-2 2,3-Dimethylaniline –0.43 1.81 0.294
32 140-29-4 Benzyl cyanide –0.36 1.56 0.294
33 95-78-3 2,5-Dimethylaniline –0.33 1.83 0.294
34 1823-91-2 E-Methylbenzyl cyanide 0.01 1.87 0.294
35 643-28-7 2-Isopropylaniline 0.12 2.12 0.294
36 87-62-7 2,6-Dimethylaniline –0.43 1.84 0.294
37 103-69-5 n-Ethylaniline 0.07 2.16 0.295
38 1821-39-2 2-Propylaniline 0.08 2.42 0.295
39 100-61-8 n-Methylaniline 0.06 1.66 0.295
40 1199-46-8 2-Amino-4-(tert)butylphenol 0.37 2.44 0.295
41 90-04-0 2-Methoxyaniline –0.69 1.18 0.295
42 1008-88-4 3-Phenylpyridine 0.47 2.53 0.296
43 5344-90-1 2-Aminobenzyl alcohol –1.07 –0.17 0.296
44 101-82-6 2-Benzylpyridine 0.38 2.71 0.296
45 1138-52-9 3,5-Di-tert-butylphenol 1.64 5.13 0.298
46 5651-88-7 Phenyl propargyl sulfide 0.54 3.30 0.298
47 622-62-8 4-Ethoxyphenol 0.01 1.81 0.298
48 122-94-1 4-Butoxyphenol 0.70 2.90 0.298
49 2116-65-6 4-Benzylpyridine 0.63 2.62 0.298
50 1008-89-5 2-Phenylpyridine 0.27 2.63 0.299
51 95-65-8 3,4-Dimethylphenol 0.12 2.23 0.299
52 585-34-2 3-(Te rt )butylphenol 0.74 3.30 0.300
53 108-68-9 3,5-Dimethylphenol 0.11 2.35 0.300
54 1879-09-0 6-(Ter t )butyl-2,4-dimethylphenol 1.16 4.30 0.300
55 99-89-8 4-Isopropylphenol 0.47 2.90 0.300
56 618-45-1 3-Isopropylphenol 0.61 2.90 0.300
© 2004 by CRC Press LLC
Table 12.2 (continued) Toxicity to T. pyriformis (Log [IGC
50
]
–1
), Octanol-Water Partition
Coefficient (Log K
ow
) and Maximum Acceptor Superdelocalizability (A
max
) Values
for the Compounds Used for External Validation
No. CAS Name Log (IGC
50
)
–1
Log K
ow
A
max
57 526-75-0 2,3-Dimethylphenol 0.12 2.42 0.300
58 95-87-4 2,5-Dimethylphenol 0.14 2.34 0.300
59 498-00-0 4-Hydroxy-3-methoxybenzyl alcohol –0.70 0.29 0.300
60 88-69-7 2-Isopropylphenol 0.61 2.88 0.301
61 53222-92-7 3-Amino-2-cresol –0.55 0.70 0.301
62 95-69-2 4-Chloro-2-methylaniline 0.35 2.36 0.301
63 97-54-1 2-Methoxy-4-propenylphenol 0.75 3.31 0.302
64 90-72-2 2,4,6-Tris(dimethylaminomethyl)phenol –0.52 0.92 0.302
65 348-54-9 2-Fluoroaniline –0.37 1.26 0.302
66 3544-25-0 4-Aminobenzyl cyanide –0.76 0.34 0.302
67 626-01-7 3-Iodoaniline 0.65 2.90 0.302
68 4360-47-8 Cinnamonitrile 0.16 1.95 0.303
69 456-47-3 3-Fluorobenzyl alcohol –0.39 1.25 0.305
70 2237-30-1 3-Cyanoaniline –0.47 1.07 0.306
71 371-41-5 4-Fluorophenol 0.02 1.77 0.307
72 615-43-0 2-Iodoaniline 0.35 2.32 0.307
73 372-19-0 3-Fluoroaniline –0.10 1.30 0.307
74 1570-64-5 4-Chloro-2-methylphenol 0.70 2.78 0.307
75 14143-32-9 4-Chloro-3-ethylphenol 1.08 3.51 0.308
76 1124-04-5 2-Chloro-4,5-dimethylphenol 0.69 3.10 0.309
77 500-99-2 3,5-Dimethoxyphenol –0.09 1.64 0.309
78 14191-95-8 4-Hydroxybenzyl cyanide –0.38 0.90 0.309
79 2374-05-2 4-Bromo-2,6-dimethylphenol 1.16 3.63 0.309
80 18982-54-2 2-Bromobenzyl alcohol 0.10 1.97 0.309
81 615-74-7 2-Chloro-5-methylphenol 0.54 2.65 0.309
82 367-12-4 2-Fluorophenol 0.19 1.67 0.309
83 100-10-7 4-(Dimethylamino)benzaldehyde 0.23 1.81 0.310
84 106-41-2 4-Bromophenol 0.68 2.59 0.311
85 95-79-4 5-Chloro-2-methylaniline 0.50 2.36 0.311
86 95-74-9 3-Chloro-4-methylaniline 0.39 2.41 0.311
87 87-60-5 3-Chloro-2-methylaniline 0.38 2.36 0.312
88 1875-88-3 4-Chlorophenethyl alcohol 0.32 1.90 0.312
89 873-76-7 4-Chlorobenzyl alcohol 0.25 1.96 0.312
90 6627-55-0 2-Bromo-4-methylphenol 0.60 2.85 0.312
91 603-71-4 1,3,5-Trimethyl-2-nitrobenzene 0.86 3.22 0.313
92 873-63-2 3-Chlorobenzyl alcohol 0.15 1.94 0.314
93 95-56-7 2-Bromophenol 0.33 2.33 0.314
94 4421-08-3 4-Hydroxy-3-methoxybenzonitrile –0.03 1.42 0.315
95 619-25-0 3-Nitrobenzyl alcohol –0.22 1.21 0.315
96 16532-79-9 4-Bromophenyl acetonitrile 0.60 2.43 0.315
97 874-90-8 4-Methoxybenzonitrile 0.10 1.70 0.315
98 36436-65-4 2-Hydroxy-4,5-dimethylacetophenone 0.71 2.86 0.316
99 135-02-4 2-Anisaldehyde 0.15 1.72 0.316
100 95-88-5 4-Chlororesorcinol 0.13 1.80 0.316
101 18358-63-9 Methyl-4-methylaminobenzoate 0.31 2.16 0.316
102 67-36-7 4-Phenoxybenzaldehyde 1.26 3.96 0.317
103 621-59-0 3-Hydroxy-4-methoxybenzaldehyde –0.14 0.97 0.317
104 3218-36-8 4-Biphenylcarboxaldehyde 1.12 3.38 0.317
105 4460-86-0 2,4,5-Trimethoxybenzaldehyde –0.10 1.19 0.317
106 1137-41-3 4-Benzoylaniline 0.68 2.46 0.317
107 5991-31-1 3-Anisaldehyde 0.23 1.71 0.317
108 7778-83-8 n-Propyl cinnamate 1.23 3.52 0.318
109 103-36-6 (Trans)ethyl cinnamate 0.99 2.99 0.318
110 942-92-7 Hexanophenone 1.19 3.70 0.318
111 538-65-8 n-Butyl cinnamate 1.53 4.05 0.318
112 140-53-4 4-Chlorobenzyl cyanide 0.66 2.47 0.319
© 2004 by CRC Press LLC
Table 12.2 (continued) Toxicity to T. pyriformis (Log [IGC
50
]
–1
), Octanol-Water Partition
Coefficient (Log K
ow
) and Maximum Acceptor Superdelocalizability (A
max
) Values
for the Compounds Used for External Validation
No. CAS Name Log (IGC
50
)
–1
Log K
ow
A
max
113 103-26-4 (Trans)methyl cinnamate 0.58 2.62 0.319
114 94-30-4 Ethyl-4-methoxybenzoate 0.77 2.81 0.319
115 937-39-3 Phenylacetic acid hydrazide –0.48 0.14 0.319
116 100-83-4 3-Hydroxybenzaldehyde 0.08 1.38 0.320
117 87-65-0 2,6-Dichlorophenol 0.73 2.64 0.320
118 2495-37-6 Benzyl methacrylate 0.65 2.53 0.320
119 6521-30-8 Isoamyl-4-hydroxybenzoate 1.48 3.97 0.320
120 2491-32-9 Benzyl-4-hydroxyphenyl ketone 1.07 3.22 0.321
121 120-51-4 Benzyl benzoate 1.45 3.97 0.321
122 1137-42-4 4-Benzoylphenol 1.02 3.07 0.321
123 5428-54-6 2-Methyl-5-nitrophenol 0.66 2.35 0.321
124 621-42-1 3-Acetamidophenol –0.16 0.73 0.322
125 3034-34-2 4-Cyanobenzamide –0.38 0.48 0.322
126 86-00-0 2-Nitrobiphenyl 1.30 3.77 0.322
127 7120-43-6 5-Chloro-2-hydroxybenzamide 0.59 2.13 0.323
128 554-84-7 3-Nitrophenol 0.51 2.00 0.324
129 626-19-7 Phenyl-1,3-dialdehyde 0.18 1.36 0.324
130 5798-75-4 Ethyl-4-bromobenzoate 1.33 3.50 0.325
131 89-84-9 2,4-Dihydroxyacetophenone 0.25 1.41 0.325
132 1016-78-0 3-Chlorobenzophenone 1.55 3.97 0.325
133 17696-62-7 Phenyl-4-hydroxybenzoate 1.37 3.49 0.327
134 93-99-2 Phenyl benzoate 1.35 3.59 0.327
135 131-57-7 2-Hydroxy-4-methoxybenzophenone 1.42 3.58 0.327
136 2700-22-3 Benzylidene malononitrile 0.64 2.15 0.328
137 620-88-2 4-Nitrophenyl phenyl ether 1.58 3.83 0.330
138 136-36-7 Resorcinol monobenzoate 1.11 3.13 0.330
139 14548-45-9 4-Bromophenyl-3-pyridyl ketone 0.82 2.96 0.331
140 121-89-1 3d-Nitroacetophenone 0.32 1.42 0.332
141 99-61-6 3-Nitrobenzaldehyde 0.11 1.47 0.332
142 4553-07-5 Ethyl phenylcyanoacetate –0.02 1.63 0.332
143 91-23-6 2-Nitroanisole –0.07 1.73 0.332
144 4920-77-8 3-Methyl-2-nitrophenol 0.61 2.29 0.332
145 844-51-9 2,5-Diphenyl-1,4-benzoquinone 1.48 3.16 0.332
146 610-15-1 2-Nitrobenzamide –0.72 –0.12 0.332
147 2905-69-3 Methyl-2,5-dichlorobenzoate 0.81 3.16 0.332
148 552-89-6 2-Nitrobenzaldehyde 0.17 1.74 0.333
149 119-33-5 4-Methyl-2-nitrophenol 0.57 2.15 0.333
150 131-55-5 2,2d,4,4d-Tetrahydroxybenzophenone 0.96 2.92 0.333
151 555-16-8 4-Nitrobenzaldehyde 0.20 1.56 0.333
152 700-38-9 5-Methyl-2-nitrophenol 0.59 2.31 0.333
153 90-60-8 3,5-Dichlorosalicylaldehyde 1.55 3.07 0.334
154 69212-31-3 2-(Benzylthio)-3-nitropyridine 1.72 3.42 0.335
155 99-77-4 Ethyl-4-nitrobenzoate 0.71 2.33 0.335
156 874-42-0 2,4-Dichlorobenzaldehyde 1.04 3.08 0.335
157 13608-87-2 2d,3d,4d-Trichloroacetophenone 1.34 3.21 0.336
158 835-11-0 2,2d-Dihydroxybenzophenone 1.16 3.47 0.336
159 619-50-1 Methyl-4-nitrobenzoate 0.39 1.94 0.336
160 2973-19-5 2-Chloromethyl-4-nitrophenol 0.75 2.42 0.338
161 402-45-9 E,E,E-Trifluoro-4-cresol 0.62 2.82 0.340
162 5292-45-5 Dimethylnitroterephthalate 0.43 1.66 0.340
163 637-53-6 Thioacetanilide –0.01 1.71 0.341
164 601-89-8 2-Nitroresorcinol 0.66 1.56 0.341
165 1689-84-5 3,5-Dibromo-4-hydroxybenzonitrile 1.16 2.88 0.341
166 440-60-8 Pentafluorobenzyl alcohol –0.20 1.82 0.342
167 42087-80-9 Methyl-4-chloro-2-nitrobenzoate 0.82 2.41 0.342
168 1493-27-2 1-Fluoro-2-nitrobenzene 0.23 1.69 0.343
© 2004 by CRC Press LLC
log (IGC
50
)
–1
= 0.529 (0.027) log K
ow
+ 17.6 (0.93) A
max
– 6.30 (0.31) (12.1)
n = 188, R
2
(adj) = 0.800, R
2
(pred) = 0.795, s = 0.338, F = 376, Pr > F = 0.0001
was not significantly different in terms of the coefficient of log K
ow
and the constant in the equation
than the result, reported by Schultz (1999):
log (IGC
50
)
–1
= 0.50 log K
ow
+ 9.85 A
max
– 3.47 (12.2)
n = 197; R
2
= 0.816, s = 0.34; F = 429
However, the value of the regression coefficient of A
max
, in the new model (Equation 12.1) is almost
eight units greater than in the earlier study (Equation 12.2).
Evaluation of all 215 compounds with measurable toxicity, reported by Schultz (1999), with
the newly calculated A
max
showed that only one compound (4-chloro-3,5-dinitrobenzonitrile, Res. =
1.16, St. res. = 3.24) is a statistically significant outlier and this was excluded from the data set.
The resulting model is shown below:
log (IGC
50
)
–1
= 0.513 (0.026) (log K
ow
) + 18.40 (0.94) (A
max
) – 6.50 (0.31) (12.3)
n = 214, R
2
(adj) = 0.793, R
2
(pred) = 0.787, s = 0.359, F = 408, Pr > F = 0.0001
A plot of observed vs. predicted toxicity is presented in Figure 12.2.
B. Evaluation of the Benzene Response-Surface Model
Toxicity, along with hydrophobicity and electrophilicity data, for an additional set of 177
substituted benzenes is provided in Table 12.2. Toxicity values varied uniformly over about three
orders of magnitude (from –1.07 to 1.72 on a log scale). Hydrophobicity varied over five orders
of magnitude (from –0.17 to 5.13 on a log scale). Reactivity measured by A
max
varied on a linear
scale from 0.283 to 0.364.
Least-squares regression analysis of these data yields the equation:
log (IGC
50
)
–1
= 0.550 (0.014) log K
ow
+ 13.5 (0.68) A
max
– 5.10 (0.21) (12.4)
n = 174, R
2
(adj) = 0.930, R
2
(pred) = 0.928, s = 0.159, F = 1150, Pr > F = 0.0001.
A plot of observed vs. predicted toxicity is presented in Figure 12.3.
Table 12.2 (continued) Toxicity to T. pyriformis (Log [IGC
50
]
–1
), Octanol-Water Partition
Coefficient (Log K
ow
) and Maximum Acceptor Superdelocalizability (A
max
) Values
for the Compounds Used for External Validation
No. CAS Name Log (IGC
50
)
–1
Log K
ow
A
max
169 393-39-5 E,E,E-4-Tetrafluoro-o-toluidine –0.02 2.51 0.343
170 704-13-2 3-Hydroxy-4-nitrobenzaldehyde 0.27 1.47 0.345
171 3460-18-2 2,5-Dibromonitrobenzene 1.37 3.41 0.346
172 613-90-1 Benzoyl cyanide 0.31 1.91 0.347
173 78056-39-0 4,5-Difluoro-2-nitroaniline 0.75 2.19 0.348
174 364-74-9 2,5-Difluoronitrobenzene 0.33 1.86 0.349
175 827-23-6 2,4-Dibromo-6-nitroaniline 1.62 3.63 0.352
176 3011-34-5 4-Hydroxy-3-nitrobenzaldehyde 0.61 1.48 0.352
177 532-55-8 Benzoyl isothiocyanate 0.10 1.91 0.364
© 2004 by CRC Press LLC
Three of the 177 derivatives (pentafluorobenzyl alcohol, Res = –0.67, St. res = –3.61; E,E,E-
4-tetrafluoro-2-toluidine, Res = –0.88, St. res = –4.74; and benzoyl isothiocyanate, Res = –0.68,
St. res. = –3.73) were observed to be statistical outliers to Equation 12.4 and were not included in
the model above.
The comparison of the coefficients and statistics of Equation 12.3 and Equation 12.4 reveals
them to be very similar with the exception of the regression coefficient of A
max
, which differs with
almost 5 units between the models.
Figure 12.2 Plot of observed vs. predicted by Equation 12.3 log (IGC
50
)
–1
values.
Figure 12.3 Plot of observed vs. predicted by Equation 12.4 log (IGC
50
)
–1
values.
Predicted log (IGC50-1)
Observed log (IGC50-1)
3
2
1
0
–1
–1.5 –1.0 –0.5 0.0 0.5 1.0 1.5 2.0 2.5
Observed log (IGC50-1)
2
1
0
–1
–1 0 1 2
Predicted log (IGC50-1)
© 2004 by CRC Press LLC
C. Combined Benzene Response-Surface Model
Least-squares regression analysis of the combined data from Equation 12.3 and Equation 12.4
yields the equation:
log (IGC
50
)
–1
= 0.545 (0.015) log K
ow
+ 16.2 (0.62) A
max
– 5.91 (0.20) (12.5)
n = 384, R
2
(adj) = 0.859, R
2
(pred) = 0.856, s = 0.275, F = 1163, Pr > F = 0.0001.
A plot of observed vs. predicted toxicity is presented in Figure 12.4.
Four of the 388 derivatives (3,4-dinitrobenzyl alcohol, Res = 0.95, St. res. = 3.28; 1,5-difluoro-
2,4-dinitrobenzene, Res = 0.93, St. res. = 3.26; 1-bromo-2,4-dinitrobenzene, Res. = 0.93, St. res. =
3.23; and pentafluoronitrobenzene, Res = 1.04, St. res. = 3.60) were observed to be statistical
outliers to Equation 12.5 and were not included in the analysis.
V. DISCUSSION
All toxicity-related QSARs require validation to ensure they are capable of making accurate
predictions of toxicity for compounds not included in the training set. The best means of validation
is by way of an external data set. This is the most demanding method because it requires additional
testing and attention to the selection of compounds for validation. Efforts should be made to have
chemical diversity within the training set and the chemicals in the validation set similar to those
in the training set (Golbraikh and Tropsha, 2002). The training chemicals should represent the
depth and breadth of all existing chemicals within the domain. The validating chemicals should
also represent the distribution of existing chemicals within the training domain. In this exercise
reactivity quantified by A
max
was used to assess both diversity for training and representation for
validation.
Figure 12.4 Plot of observed vs. predicted by Equation 12.5 log (IGC
50
)
–1
values.
Predicted log (IGC50-1)
Observed log (IGC50-1)
3
2
1
0
–1
–1.5 –1.0 –0.5 0.0 0.5 1.0 1.5 2.0 2.5
© 2004 by CRC Press LLC
It is important to note that validation should not be confused with the statistical fit of a QSAR.
The latter can be assessed by many easily available statistical terms (e.g., R
2
(adj), s, F, etc.), which
reflect the ability of the QSAR to mimic the data. While a poor statistical fit to a QSAR results in
a model with little or no predictive value, a significantly good statistical fit does not necessarily
imply that the QSAR will predict toxic potency accurately for an untested compound.
There are two general types of validation of QSARs: horizontal and vertical. Horizontal vali-
dation is performed within a data set by using a distinct training set for model development and a
separate validation, or test set, for assessing the predictive capability of the QSAR. Examples of
such validation can be found in the literature. Schultz et al. (1987) limited the number of compounds
tested to 29 para-substituted phenols, but was at the same time able to maximize the physiochemical
space of the data set (i.e., the domain). The result was a high statistical fitted QSAR (R
2
= 0.911),
which revealed hydrophobicity, electrophilicity, and hydrogen bonding to be the important prop-
erties in T. pyriformis population growth impairment by phenols (Schultz et al., 1987). Cronin et al.
(2002) validated the model and domain when experimental toxicity values for the majority of more
than 200 phenols could be predicted accurately by a multiple regression-based QSAR developed
using descriptors of molecular hydrophobicity, electrophilicity, and ionization.
Also important to the validation process of QSARs is vertical validation. In this instance,
quantitatively similar QSARs are developed with similar descriptors but using data for a different
toxic endpoint. For example, the investigation of Karabunarliev et al. (1996b) modeled acute aquatic
toxicity data for the fathead minnow Pimephales promelas. The compounds considered in the
analysis were confined to substituted benzenes, and descriptors limited to log K
ow
and A
max
. The
fish toxicity QSAR (log [LC
50
]
–1
= 0.62 log K
ow
+ 9.17 A
max
– 3.21; n = 122; R
2
= 0.83; s = 0.16;
F = 292) of Karabunarliev et al. (1996b) was very similar in terms of slope, intercept, and statistical
fit to the QSAR presented in Equation 12.2. The fact that different endpoints provide very similar
QSARs indicates that the QSAR is valid across protocols. This shows the universality of the model.
The first goal of the horizontal validation is to prove the robustness of the model. This means
to determine where can others use the model (i.e., within what boundaries) to yield reliable results.
Bearing in mind that the external validation is the only way to establish the real predictivity of the
model (Golbraikh and Tropsha, 2002), an external set of 177 commercially available chemicals
was collected. The compounds, included in Equation 12.4, were used for validation of the initial
response-surface model presented with Equation 12.3. Ideally, the correlation between the observed
activity and that predicted by the model should have a high correlation coefficient, an intercept of
zero and a slope of one. To be able to compare the predictivity of different models, regression fit
through the origin was performed. For 174 compounds this yielded a model with R
2
= 0.936, s =
0.179, and a slope of 0.938 (s0.019). For regression through the origin (the no-intercept model),
R
2
measures the proportion of the variability in the dependent variable about the origin explained
by regression and cannot be compared to R
2
for models that include an intercept.
To validate the model presented by Equation 12.4, the 214 compounds included in equation
(12.3) were used. For this second validation the model between observed and predicted toxicity
showed r
2
= 0.886, s = 0.379, and a slope of 1.091 (s0.027). Because both the intercepts were very
close to one, it may be assumed that both the models are capable of predicting correctly the toxicity
of new compounds with descriptors within the defined ranges. It can be noted that Equation 12.3
performs a little better than Equation 12.4 because of the higher R
2
, lower s, and slope that is closer
to 1 in the statistical fit between the observed and predicted toxicity. To take advantage of the
availability of data for larger number of compounds, the model presented by Equation 12.5 was
developed. The slopes of the regression line between the observed toxicity values and those
calculated by Equation 12.5 for both the subsets (n = 174 and n = 214) were 0.959 (s0.017) and
1.036 (s0.024), respectively. Because this is not a real validation with external data sets, the validity
of the latter model needs to be additionally demonstrated.
The horizontal validation aims not only to assess the robustness of the model, but also to identify
the crucial aspects that are susceptible to change and can affect the result. They include all the
© 2004 by CRC Press LLC
three components of a QSAR, but only the influence of the descriptor variability, and particularly
the changes in the electronic term in the response-surface analysis was the focus of the validation
in this study. As was shown from the comparison between Equations 12.1 and 12.2, the change of
the algorithm for calculation of the electronic descriptors hides potential risk for miss-prediction
of toxicity using quantum mechanical descriptors from different sources. In this study the observed
difference in the coefficient of A
max
is produced by the fact that in the 1999 paper the algorithm
for the calculation of the acceptor superdelocalizabilities (Karabunarliev et al., 1996b) includes a
shift in the summed energies of the unoccupied molecular orbitals in order to avoid a problem with
energy levels with opposite sign. Comparison of the coefficients and statistical values of Equation
12.3 with those of Equation 12.4 revealed stronger similarities for all values. These similarities
were without doubt due in large part to the great care taken to mimic the descriptor domain of the
training set, especially A
max
. The difference of almost five in the coefficient of A
max
can be explained
by the fact that there are fewer compounds with high A
max
(A
max
> 0.34) values in the external
validation set, as well as the presence of a large number of narcotics, for which the quantum
mechanical term is less significant than for the more reactive chemicals.
Toxicity, and hence the modeling of toxic potency, is intrinsically a non-linear phenomenon.
To expect to be able to model all compounds or even all compounds within a chemical class (e.g.,
benzenes), even for a single endpoint like Tetrahymena population growth impairment, with a single
relationship is naive. In narcosis, a clear boundary is observed between whether a compound exerts
aquatic toxicity and its hydrophobicity. Highly hydrophobic, liquids or ones that are solid with
high melting points have no noticeable toxicity mainly because the compounds exhibit insufficient
water soluble to elicit toxicity. Other boundaries, while less easily explained are often noted.
Indications of a potential boundary are typically first observed in the form of outliers. Outliers are
often explained by physicochemical or protocol limitation (e.g., volatility in a static system) or a
change in mechanism of toxic action (e.g., narcotic vs. electrophiles) (Schultz et al., 1998).
Outliers are useful in QSAR development as they assist in establishing the chemical domain
of the model. As noted by Egan and Morgan, (1998) outliers from a statistical relationship are data
that do not fit the model, or are poorly predicted by it. There are several potential reasons for a
chemical being an outlier from a QSAR. Customarily, such compounds have been recognized as
acting by a different mechanism of action from the other chemicals, which are well modeled by
the QSAR. For instance, the domain of the phenol model was established by Cronin et al. (2002)
who noted clear outliers to the model, including phenols capable of redox cycling or being
metabolized. Moreover, Cronin and co-workers (2002) also noted that carboxyl-derivatives whose
toxicity was unduly impacted by ionization (Muccini et al., 1999) were outliers to the general
phenol model. These two groups of benzenes carboxylic acids and tautomerizing quinones and
semiquinones are also outside the domain of the present QSARs.
Outliers also may be the result of variability in the experimental measurement of toxicity. Seward
et al. (2001) noted that there was less likelihood of reproducing the experimental toxicity of reactive
electrophilic chemicals as compared to compounds acting via a narcosis mechanism of toxicity. Even
within a chemical domain there may be different levels of confidence in the predicted activity. For
example, the predictivity can be sensitive to the distribution of A
max
values. In examining the distri-
bution within the 214 derivatives used in the training set, it is observed that there are 54 derivatives
with A
max
values between 0.28 and 0.30, 62 chemicals with A
max
values between 0.30 and 0.32, and
46 compounds with A
max
values between 0.32 and 0.34. However, only 30 derivatives were included
with A
max
values between 0.34 and 0.36 and even less, 22 compounds, were included with A
max
values
greater than 0.36. Even fewer benzenes with A
max
values in these higher ranges were available for
inclusion in the validation set. It may be proposed that the predicted toxic potency of benzene
derivatives with A
max
values between 0.28 and 0.34 can be taken with a greater level of confidence
than compounds with A
max
values greater than 0.34. The latter is supported by the fact that the
4 statistical outliers to Equation 12.5 (i.e., 3,4-dinitrobenzyl alcohol, 1,5-difluoro-2,4-dinitrobenzene,
1-bromo-2,4-dinitrobenzene, and pentafluoronitrobenzene) all have A
max
values greater than 0.34.
© 2004 by CRC Press LLC
In summary, external validation of a transparent and fully interpretable two-descriptor (one for
bio-uptake and one for electro[nucleo]philic reactivity) regression-based model for benzene potency,
derived from quality data has been presented. Both the training and the test set were carefully
selected to span a large array of reactivity. Both exhibited similar variability in toxicity, hydropho-
bicity, and electro(nucleo)philicity. The robustness of the models was demonstrated by the similarity
of the coefficients and the statistical criteria between models derived on same mechanistic descrip-
tors with different sets of compounds. The closeness to unity of the slopes in the regression through
the origin between observed and calculated toxicity for an external validation set provided additional
evidence for the good predictivity of the models. The impact of the algorithm for calculation of
quantum mechanical descriptors, and particularly acceptor superdelocalizabilities for the weighting
of this descriptor was demonstrated. The boundaries and the level of confidence within a certain
domain were also discussed.
REFERENCES
Benfenati, E., Piclin, N., Roncaglioni, A., and Vari, M.R., Factors influencing predictive models for toxicology,
SAR QSAR Environ. Res., 12, 593-603, 2001.
Blaauboer, B.J., Barratt, M.D., and Houston, J.B., The integrated use of alternative methods in toxicological
risk evaluation — ECVAM Integrated Testing Strategies task force report 1, Alt. Lab. Anim. (ATLA),
27, 229–237, 1999.
Bradbury, S.P., Russom, C.L., Ankley, G.T., Schultz, T.W., and Walker, J.D., Overview of data and conceptual
approaches for derivation of quantitative structure-activity relationships for ecotoxicological effects
of organic chemicals, Environ. Toxicol. Chem., 22, 1789–1798, 2003.
Cronin, M.T.D., Aptula, A.O., Duffy, J.C., Netzeva, T.I., Rowe, P.H., Valkova, I.V., and Schultz, T.W.,
Comparative assessment of methods to develop QSARs for the prediction of the toxicity of phenols
to Tetrahymena pyriformis, Chemosphere, 49, 1201–1221, 2002.
Dearden, J.C., Physico-chemical descriptors, in Practical Applications of Quantitative Structure-Activity
Relationships (QSAR) in Environmental Chemistry and Toxicology, Karcher, W. and Devillers, J., Eds.,
Kluwer Academic, Dordrecht, Netherlands, 1990, pp. 25–59.
Egan, W.J. and Morgan, S.L., Outlier detection in multivariate analytical chemical data, Anal. Chem., 70,
2372–2379, 1998.
Golbraikh, A. and Tropsha, A., Beware of q
2
!, J. Mol. Graphics Modeling, 20, 269–276, 2002.
Kaiser, K.L.E., Dearden, J.C., Klein, W., and Schultz, T.W., A note of caution to users of ECOSAR, Water
Qual. Res. J. Can., 34, 179–182, 1999.
Karabunarliev, S., Mekenyan, O.G., Karcher, W., Russom, C.L., and Bradbury, S.P., Quantum-chemical
descriptors for estimating the acute toxicity of electrophiles to the fathead minnow (Pimephales
promelas): an analysis based on molecular mechanisms, Quant. Struct Act. Relat., 15, 302–310, 1996a.
Karabunarliev, S., Mekenyan, O.G., Karcher, W., Russom, C.L., and Bradbury, S.P., Quantum-chemical
descriptors for estimating acute toxicity of substituted benzenes to the guppy (Poecilia reticulata) and
fathead minnow (Pimephales promelas), Quant. Struct Act. Relat., 15, 311–320, 1996b.
Karelson, M., Lobanov, V.S., and Katritzky, A.R., Quantum-chemical descriptors in QSAR/QSPR studies,
Chem. Rev., 96, 1027–1043, 1996.
Lipnick, R.L., Outliers, their origin and use in the classification of molecular mechanisms of toxicity, Sci.
Total Environ., 109/110, 131–154, 1991.
Livingstone, D.J., Data Analysis for Chemists: Applications to QSAR and Chemical Product Design, Oxford
University Press, Oxford, 1995.
Livingstone, D.J., The characterization of chemical structures using molecular properties: a survey, J. Chem.
Inf. Comput. Sci., 40, 195–209, 2000.
Mekenyan, O.G. and Veith, G.D., Relationships between descriptors for hydrophobicity and soft electrophi-
licity in predicting toxicity, SAR QSAR Environ. Res., 2, 335–344, 1993.
Muccini, M., Layton, A.C., Sayler, G.S., and Schultz, T.W., Aquatic toxicities of halogenated benzoic acids
to Tetrahymena pyriformis, Bull. Environ. Contamination Toxicol., 62, 616–622, 1999.
© 2004 by CRC Press LLC
Nendza, M. and Russom, C.L., QSAR modeling of the ERL-D fathead minnow acute toxicity database,
Xenobiotica, 21, 147–170, 1991.
SAS Institute Inc., SAS/STAT User’s Guide, Version 6, 4th ed., Vol. 2, North Carolina, 1989.
Schultz, T.W., TETRATOX: Tetrahymena pyriformis population growth impairment endpoint — A surrogate
for fish lethality, Toxicol. Methods, 7, 289–309, 1997.
Schultz, T.W., Structure-toxicity relationships for benzenes evaluated with Tetrahymena pyriformis, Chem.
Res. Toxicol., 12, 1262–1267, 1999.
Schultz, T.W. and Cronin, M.T.D., Essential and desirable characteristics of ecotoxicity QSARs, Environ.
Toxicol. Chem., 22, 599–607, 2003.
Schultz, T.W., Cronin, M.T.D., Walker, J.D., and Aptula, A.O., Quantitative structure-activity relationships in
(QSARs) in toxicology: a historical perspective, J. Mol. Struct. (Theochem), 622, 1–22, 2002.
Schultz, T.W., Riggin, G.W., and Wesley, S.K., Structure-activity relationships for para-substituted phenols,
in QSAR in Environmental Toxicology-II, Kaiser, K.L.E., Ed., D. Reidel Publishing, Dordrecht, 1987,
pp. 333–345.
Schultz, T.W., Sinks, G.D., and Bearden, A.P., QSARs in aquatic toxicology: a mechanism of action approach
comparing toxic potency to Pimephales promelas, Tetrahymena pyriformis, and Vibrio fischeri, in
Comparative QSAR, Devillers, J., Ed., Taylor and Francis, London, 1998, pp. 52–109.
Seward, J.R., Sinks, G.D., and Schultz, T.W., Reproducibility of toxicity across mode of toxic action in the
Tetrahymena population growth impairment assay, Aquatic Toxicol., 53, 33–47, 2001.
Veith, G.D., Call, D.J., and Brooke, L.T., Structure-toxicity relationships for the fathead minnow, Pimephales
promelas: Narcotic industrial chemicals, Can. J. Fishery Aquatic Sci., 40: 473-748, 1983.
Walker, J.D. and Schultz, T.W., Structure activity relationships for predicting ecological effects of chemicals,
in Handbook of Ecotoxicology, 2nd ed., Hoffman, D.J., Rattner, B.A., Burton, G.A., Jr., and Cairns,
J., Jr., Eds., CRC Press, Boca Raton, FL, 2002, pp. 893–910.
© 2004 by CRC Press LLC
C
HAPTER
13
Receptor-Mediated Toxicity: QSARs for Estrogen
Receptor Binding and Priority Setting of Potential
Estrogenic Endocrine Disruptors
Weida Tong, Hong Fang, Huixiao Hong, Qian Xie, Roger Perkins, and Daniel M. Sheehan
CONTENTS
I. Introduction
II. NCTR ER Data Set: A Robust Training Set for QSARs
III. Systematic Procedure for Preprocessing Molecular Structures
IV. QSAR Models for ER Binding
A. Rejection Filters
B. Structural Alerts
C. Pharmacophore Queries
D. Classification Models
E. 3D-QSAR/CoMFA Model
V. Model Validation
A. Cross-Validation
B. External Validation
C. Validation and Living Model
VI. QSAR as a Priority-Setting Tool for Regulatory Application.
A. Endocrine Disrupting Chemicals: Issues
B. QSAR and Priority Setting
C. NCTR Four-Phase System
1. Phase I: Filtering
2. Phase II: Active/Inactive Assignment
3. Phase III: Quantitative Predictions
4. Phase IV: Rule-Based Decision-Making System
D. Regulatory Application
VII. QSAR Application in Perspective
Acknowledgment
References
© 2004 by CRC Press LLC
I. INTRODUCTION
Nuclear receptors (NRs) are a superfamily of ligand-dependent transcription factors that mediate
the effects of hormones and other endogenous ligands to regulate the expression of specific genes.
Members of the NR superfamily, which may number in the hundreds, include receptors for various
steroid hormones (estrogen, androgen, progesterone, and several corticosteroids), retinoic acid (the
retinoic acid receptor E, F, and K isoforms, and the retinoid X receptor EF and K isoforms), thyroid
hormones, vitamin D, and dietary lipids (the peroxisome proliferator activated receptor [PPAR] E
F and K isoforms). A large number of orphan NRs have also been identified whose cognate ligands
are still unknown (Giguere, 1999). Diminished or excessive production of a particular hormone or
target-cell insensitivity to a hormone are among the major problems related to human endocrine
dysfunction diseases (Zubay et al., 1995).
Receptor-mediated effects are stimulated and inhibited not only by endogenous cognate ligands
for each NR, but also by exogenous substances including natural products and synthetic chemicals.
There are a large number of ligands, diverse in both structure and source, which act through the
NRs to produce receptor-mediated effects. The NRs and their ligands have thus attracted broad
scientific interest, particularly in the pharmaceutical industry for drug discovery and in toxicology
and environmental science for risk assessment as, for example, pertaining to endocrine disrupting
chemicals (EDCs).
Among numerous NRs, the estrogen receptor (normally abbreviated to ER) and its ligands are
probably most studied. This is because the ER plays a vital role in a wide variety of essential
physiological processes (Duax et al., 1996). Estrogens elicit many cellular responses in target tissues
and can exert both positive and negative effects on health and reproductive function. For example,
estrogens are used beneficially for fertility control (oral contraception) and for relief of menopausal
symptoms (estrogen replacement therapy). The adverse developmental effects of diethylstilbestrol
(DES) are demonstrated by human fetal sensitivity to estrogenic chemicals.
Estrogens regulate the expression of specific genes and the secretion of certain hormones. They
coordinate diverse and complex processes such as cell proliferation, cell differentiation, and tissue
organization through pleiotropic actions. Once estrogens reach the bloodstream, they may remain
free or bind to serum estrogen-binding proteins such as E-fetoprotein (AFP) in rodents (Baker
et al., 1998; Sheehan and Young, 1979) or sex hormone binding globulin (SHBG) in humans
(Sheehan and Young 1979). Only the free (unbound) hormone is able to diffuse into the target cells,
where it binds to the ER to form a hormone-receptor complex. The prevailing model suggests that
this complex then interacts with an estrogen response element (ERE) of target genes and activates
the transcriptional machinery (Gillesby and Zacharewski, 1998; Norris et al., 1997).
Quantitative structure-activity relationship (QSAR) models have proven their utility, from both
the pharmaceutical and toxicological perspectives, for the identification of chemicals that might
interact with ER. While their primary function in the pharmaceutical enterprise is lead discovery
and optimization for high-affinity ER ligands, QSAR models can play an essential role in toxicology
as a priority-setting tool for risk assessment.
QSAR modeling employs statistical approaches to correlate or rationalize variations in the
biological activity of a series of chemicals with variations in their molecular structures. The first
step in developing a traditional QSAR model is the acquisition of a training set of chemicals that
have known activities. Second, descriptors representing the molecular structure of individual chem-
icals (i.e., hydrophobicity, structural fragments, charged surface area, the number of hydrogen
bonds, solubility, etc.) are calculated. Then, a correlation between descriptors and activity for the
training set is evaluated by employing various statistical approaches to determine the most statis-
tically significant relationship (the QSAR model). A proper validation is required to ensure the
model’s predictivity for the chemicals not used in the training set. With adequately validated
performance, such models can be used to predict activities of untested chemicals.
© 2004 by CRC Press LLC
Obtaining a good quality QSAR model depends heavily on many factors in the approach,
particularly on the quality of biological data, descriptor selection, and statistical methods (see
Chapter 19 for more details). Given the fact that any QSAR approach has strengths and weaknesses,
the careful selection of a specific model, or a combination of models, also needs to be emphasized,
and is often specific to the particular application in question.
In this chapter, we first summarize our motives and effort to develop a robust training set (the
National Center for Toxicological Research [NCTR] data set) for QSARs, which covers a broad
range of ER binding affinity and structural diversity. We will then propose a systematic procedure
to pre-process molecular structure that is particularly important for QSAR studies utilizing toxico-
logical data. Next, we will present several QSAR approaches currently used in our labs. The
strengths and weaknesses of these methods will be also discussed. We will then focus on a strategy
for the validation of the QSAR models, a topic that has received sparse attention in computational
toxicology despite its critical importance. The review concludes by integrating these models into
an integrated Four-Phase approach that could be useful for priority setting of large number of
chemicals according to their potential estrogenic endocrine disruption.
For the sake of clarification, the term QSAR is used broadly in this review to include method-
ologies that predict activity on an ordinal or categorical scale rather than on only a quantitative
scale (Perkins et al., 2003; Tong et al., 2003).
II. NCTR ER DATA SET: A ROBUST TRAINING SET FOR QSARS
Although a predictive QSAR model is dependent on a number of factors, a training set with
high-quality biological data is the first step in developing a useful QSAR model. It is desirable that
the biological data come from the same assay protocol. Data error adds noise to the correlation of
structure with activity. The rules of thumb for a good biological data for the training set are (1) a
smooth dose-response relationship, (2) a reproducible potency (or affinity), (3) an activity range
that spans two or more orders of magnitude from the least active to the most active chemical in
the series, and (4) data values that are evenly distributed across the range of activity. It is important
to note that most toxicity data do not meet all these criteria because of the nature of toxicological
research, in which case care should be taken in interpreting QSAR results.
A robust QSAR model to predict the activity of a wide variety of chemical structures must start
with a training set that contains a sufficiently large number of chemicals with diverse structure that
reflects, to some degree, the data set to be evaluated. Despite decades of studies of estrogens, we
found that the existing data are inadequate to construct robust QSAR models. For example, in the
past few years, a number of QSAR models have been developed for ligand binding to the ER
(Bradbury et al., 1996; Waller et al., 1996; Wiese et al., 1997; Sadler et al., 1998; Zheng and
Tropsha 2000), including some of our early work (Tong et al., 1997a;1997b; 1998; Xing et al.,
1999). Unfortunately, most of these QSAR models were developed based on data sets available in
the literature; these data sets were both too small and lacked structural diversity (Sadler et al., 1998;
Wiese et al., 1997; Tong et al., 1997a). Although these models yield good statistical results in the
training and cross-validation steps and explain some structural determinants for ER binding, they
have limited applicability in predicting the ER-ligand binding affinity of chemicals that cover a
wide range of structural diversity.
In order to obtain an adequate training set to develop a more robust QSAR model, we developed
a rat ER binding assay (Blair et al., 2000; Branham et al., 2002). For many years the ER competitive
binding assay was considered the gold standard. Many variants have since been developed, leading
to some significant differences in results. Our ER binding assay was rigorously validated, and
provides high-quality data for model development. Each experimental value is replicated at least
twice. We assayed 232 chemicals to obtain a training set for model development (Table 13.1). The
© 2004 by CRC Press LLC
Table 13.1 The NCTR Data Set, Containing ER Binding Data (RBA)
for 232 Diverse Chemicals
Name CAS Log RBA
Diethylstilbestrol (DES) 56-53-1 2.60
Hexestrol 84-16-2 2.48
Ethynylestradiol 57-63-6 2.28
4-OH-Tamoxifen 68047-06-3 2.24
17F-Estradiol (E
2
) 50-28-2 2.00
4-OH-Estradiol 5976-61-4 1.82
Zearalenol 71030-11-0 1.63
ICI 182780 129453-61-8 1.57
Dienestrol 84-17-3 1.57
E-Zearalanol 55331-29-8 1.48
2-OH-Estradiol 362-05-0 1.47
Monomethyl ether diethylstilbestrol 1.31
3,3d-Dihydroxyhexestrol 79199-51-2 1.19
Droloxifene 82413-20-5 1.18
ICI 164384 1.16
Dimethylstilbestrol 552-80-7 1.16
Moxestrol 34816-55-2 1.14
17-Deoxyestradiol 53-63-4 1.14
Estriol 50-27-1 0.99
Monomethyl ether hexestrol 13026-26-1 0.97
2,6-Dimethyl hexestrol 0.95
Estrone 53-16-7 0.86
3-(p-Phenol)-4-(p-tolyl)-hexane 0.60
17E-Estradiol 57-91-0 0.49
Dihydroxymethoxychlor olefin 14868-03-2 0.42
Mestranol 72-33-3 0.35
Zearalanone 5975-78-0 0.32
Tamoxifen 10540-29-1 0.21
Toremifene 89778-26-7 0.14
EE-Dimethyl-F-ethyl allenolic acid 65118-81-2 –0.02
Coumestrol 479-13-0 –0.05
4-Ethyl-7-OH-3-(4-methoxyphenyl)coumarin 5219-17-0 –0.05
Nafoxidine 1845-11-0 –0.14
Clomiphene 911-45-5 –0.14
6E-OH-Estradiol 1229-24-9 –0.15
F-Zearalanol 42422-68-4 –0.19
3-Hydroxy-estra-1,3,5(10)-trien-16-one 3601-97-6 –0.29
3-Deoxyestradiol 2529-64-8 –0.30
3,6,4d-Trihydroxyflavone –0.35
Genistein 446-72-0 –0.36
4,4d-Dihydroxystilbene 659-22-3 –0.55
HPTE 2971-36-0 –0.60
Monohydroxymethoxychlor olefin 75938-34-0 –0.63
2,3,4,5-Tetrachloro-4d-biphenylol –0.64
Norethynodrel 68-23-5 –0.67
2,2d,4,4d-Tetrahydroxybenzil 5394-98-9 –0.68
F-Zearalenol –0.69
Equol 531-95-3 –0.82
4d,6-Dihydroxyflavone 63046-09-3 –0.82
Monohydroxymethoxychlor 28463-03-8 –0.89
3-F-Androstanediol 571-20-0 –0.92
Bisphenol B 77-40-7 –1.07
Phloretin 60-82-2 –1.16
Diethylstilbestrol dimethyl ether 7773-34-4 –1.25
2d,4,4d-Trihydroxychalcone 961-29-5 –1.26
4,4d-(1,2-Ethanediyl)bisphenol 6052-84-2 –1.44
2,5-Dichloro-4d-biphenylol 53905-28-5 –1.44
© 2004 by CRC Press LLC