Environmental Toxicology : Biological and Health Effects of Pollutants - Chapter 8 pot
Bạn đang xem bản rút gọn của tài liệu. Xem và tải ngay bản đầy đủ của tài liệu tại đây (952.98 KB, 24 trang )
Chapter 8
Air Pollution – Inorganic Gases
8.1 INTRODUCTION
This chapter considers four of the major gaseous air pollutants: sulfur dioxide
(SO
2
), nitrogen dioxide (NO
2
), ozone (O
3
), and carbon monoxide (CO). The
importance of these gaseous air pollutants is emphasized by the fact that they
are four of the six ‘‘Criteria Air Pollutants’’ regulated by the U.S.
Environmental Protection Agency (EPA). The other two criteria air pollutants
are volatile organic compounds (VOCs) and lead (Pb). VOCs are discussed in
Chapter 11, while Pb is included in Chapter 12.
8.2 SULFUR DIOXIDE
SO
2
and sulfur trioxide (SO
3
) are the two sulfur oxides (SO
x
) that are
important air pollutants. This chapter focuses on SO
2
because it is far more
important than SO
3
as an air pollutant. In fact, based on the quantities emitted
into the atmosphere, SO
2
is considered the most dangerous of all gaseous
pollutants.
8.2.1 S
OURCES OF SO
2
Atmospheric SO
2
arises from both natural and anthropogenic sources. Sulfur
compounds are emitted naturally through volcanic action, sea salt over the
oceans, and decomposition of organic matter (mostly as hydrogen sulfide,
H
2
S). Most anthropogenic emissions of sulfur (S) to the atmos phere (about
95%) are in the form of SO
2
. The main human activities that cause SO
2
emission include combustion of coal and petroleum products, petroleum
refining, and nonferrous smelti ng. In the U.S., about 95% of the total emission
is from industry and stationary sources.
The S content of coal ranges from 0.3 to 7%, and it is present in both
organic and inorganic forms, whereas in oil the content ranges from 0.2 to
1.7%, and the S is in organic form. The most important S-containing
compound in coal is iron disulfide or pyrite (FeS
2
). When heated to high
temperatures, pyrite is oxidized through the reactions shown below:
FeS
2
þ 3O
2
! FeSO
4
þ SO
2
ð8:1Þ
4FeS
2
þ 11O
2
! 2Fe
2
O
3
þ 8SO
2
ð8:2Þ
[16:53 26/8/04 P:/CRC PRESS/4365 MING-HO.751 (1670)/4365-008.3d] Ref: 4365 MING-HO YU Chap-008 Page: 111 111-134
# 2005byCRCPressLLC
In the smelting process, sulfide ores of copper (Cu), Pb, and zinc (Zn) are
oxidized (roasted), forming metallic oxides. For example, zinc sulfide (ZnS) is
converted in a smelter to zinc oxide (ZnO), releasing SO
2
:
2ZnS þ 3O
2
! 2ZnO þ 2SO
2
ð8:3Þ
8.2.2 C
HARACTERISTICS OF SO
2
SO
2
is highly soluble in water (solubility: 11.3 g per 100 ml). When SO
2
is
emitted into the atmosphere, it can dissolve in fog or cloud droplets, forming
sulfurous acid (H
2
SO
3
), which is readily oxidized by molecular oxygen (O
2
)to
sulphuric acid (H
2
SO
4
). The formation of H
2
SO
4
by this process is greatly
facilitated by some metal salts, which are also dissolved in the droplets. Any
ammonia (NH
3
) present in the atmosphere will rapidly react with the H
2
SO
3
or
H
2
SO
4
droplets to form ammonium sulfate or ammonium bisulfate.
1
Atmospheric SO
2
may be removed by several competing processes: direct
removal by deposition as bisulfate in precipitation, incorporation into fog and
cloud droplets (where it is oxidized catalytically and photochemically to
sulfate), or diffu sion to plant surfaces where it is adsorbed and reacts
chemically. According to Fox,
2
both dry and wet forms of H
2
SO
4
produced
in the atmosphere may be removed by deposition to the earth’s surface.
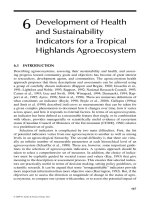
Studies show that the photochemistry of the free hydroxyl radical (OH
Á
)
controls the rate at which many trace gases, including SO
2
, are oxidized and
removed from the atmosphere.
3
The photochemistry involving the OH
Á
radical
is shown in Figure 8.1.
8.2.3 E
FFECTS ON PLANTS
SO
2
enters plant leaves predominantly by gaseous diffusion through stomatal
pores, as do other atmospheric pollutants. The number of stomata and the size
of aperture are important factors affecting SO
2
uptake. Other factors, such as
light, humidity, temperature, and wind velocity, are also important because
they influence the turgidity of stomatal guard cells. Low concentrations of SO
2
can injure epidermal and guard cells, resulting in elevated stomatal con-
ductance and greater entry of SO
2
into plants.
Following uptake by plant leaves, SO
2
is rapidly translocated through the
plant. It can then affect photosynthesis, transpiration, and respiration, the
three major functions of plant leaves. A slight increase in both net
photosynthesis and transpiration may occur at low SO
2
concentrations for
short periods, followed by a decrease in both processes. Higher SO
2
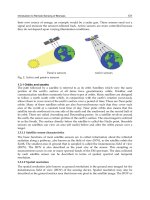
concentrations induce immediat e decreases in these processes. Plant injuries
may be manifested by leaf chlorosis and spotty necrotic lesions (Figure 8.2). As
noted previously (Table 5.1), a synergistic effect on leaf damage occurs when
plants are exposed to SO
2
and O
3
simultaneously. Damage to mesophyll cells
commonly occurs, which is the main cause of observed changes in photo-
112 Environmental Toxicology
[16:53 26/8/04 P:/CRC PRESS/4365 MING-HO.751 (1670)/4365-008.3d] Ref: 4365 MING-HO YU Chap-008 Page: 112 111-134
# 2005byCRCPressLLC
synthesis. Exposure of Chinese guger-tree seedlings grown in field chambers
with 325 ppb of SO
2
for 4 weeks showed rapid decreases in photosynthetic rate,
root weight, and total seedling weight.
4
A simultaneous increase (75%) in –SH
groups in leaves was observed.
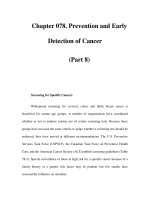
Once absorbed into a leaf, SO
2
readily dissolves in the intercellular water to
form bisulfite (HSO
3
À
), sulfite (SO
3
2À
), and other ionic species (Figure 8.3).
Air Pollution – Inorganic Gases 113
[16:53 26/8/04 P:/CRC PRESS/4365 MING-HO.751 (1670)/4365-008.3d] Ref: 4365 MING-HO YU Chap-008 Page: 113 111-134
FIGURE 8.1 The photochemistry of the free hydroxyl radical, OH
Á
, controls the rate at which many
trace gases are oxidized and removed from the atmosphere. Processes that are of primary
importance in controlling the concentration of OH
Á
in the troposphere are indicated by a solid
line; those that have a negligible effect on OH
Á
levels but are important because they control the
concentrations of associated reactions and products are indicated by a broken line. Circles
indicate reservoirs of species in the atmosphere; arrows indicate reactions that convert one
species to another, with the reactant or photon needed for each reaction indicated along each
arrow. Multistep reactions actually consist of two or more sequential elementary reactions. HX ¼
HCl, HBr, HI, or HF. C
x
H
y
denotes hydrocarbons.
Source: adapted from W.L. Chameides and D.D.Davis, C&E News, Oct. 4, 1982. With
permission from American Chemical Society.
# 2005byCRCPressLLC
Both SO
3
2À
and HSO
3
À
have a lone pair of electrons on the S atom that
strongly favors reactions with electron-deficient sites in other molecules. They
are both phytotoxic, affecting several physiological and biochemical processes
of plants.
5
The phytotoxicity of SO
3
2À
and HSO
3
À
is diminished when these
species are converted to less toxic forms, such as SO
4
2À
. For instance,
oxidation of HSO
3
À
to SO
4
2À
can occur both enzymatically and non-
enzymatically. Several factors, including cellular enzymes such as peroxidase
and cytochrome oxidase, metals, ultraviolet (UV) light, and superoxide (O
2
Á À
),
114 Environmental Toxicology
[16:53 26/8/04 P:/CRC PRESS/4365 MING-HO.751 (1670)/4365-008.3d] Ref: 4365 MING-HO YU Chap-008 Page: 114 111-134
FIGURE 8.2 Leaf damage induced by SO
2
.
FIGURE 8.3 Fate of SO2 in tissues. Arrows crossing liquid cloud drop barrier signify
heterogeneous reactions that transfer a species from the gas phase to the aqueous phase.
Source: adapted from Chameides, W. L. and Davis, D. D, C&E News, Oct. 4, 1982. With
permission from American Chemical Society.
# 2005byCRCPressLLC
stimulate the oxidation of SO
2
. In the presence of SO
3
2À
and HSO
3
À
,more
O
2
Á À
is formed by free-radical chain oxidation. Other free radicals may also be
formed. These oxidizing radicals can have detrimental effects on leaf cells.
Alternatively, SO
3
2À
and SO
4
2À
formed may be reduced and assimilated with a
carbon skeleton to cysteine.
6
Plant metabolism has been shown to be affected by SO
2
in a variety of
ways: stimulation of phosphorus (P) metabolism and reduction in foliar
chlorophyll concentration,
7
increase or decrease in carbohydrate concentra-
tions in red kidney bean plants exposed to low or high levels of SO
2
,
8
and
inhibition of lipid biosynthesis in pine needles treated with SO
2
.
9
Malhotra and Khan
9
found that pine-needle tissues, particularly the
developing tissues, actively incorporate acetate [1-
14
C] into phosphogalacto-
and neutral lipids. The major incorporation of the label among these lipids was
always in the phosphatidyl choline fraction. Treatment of needle tissues with
gaseous or aqueous SO
2
markedly inhibited lipid biosynthesis. A partial or
complete recovery in lipid biosynthesis cap acity occurred when plants were
removed from the SO
2
environment.
SO
2
has been shown to affect a number of enzyme systems in different plant
species. Enzymes studied include alanine and aspartate aminotransferases,
glutamate dehydrogenase, malate dehydrogenase, glycolate oxidase, glycer-
aldehyde-3-phosphate dehydrogenase, glucose-6-phosphate dehydrogenase,
fructose-1,6-bisphosphatase, ribulose-5-phosphate kinase, peroxidase, and
superoxide dismutase (SOD). Enzyme activity may be enhanced or depressed
by exposure to SO
2
at different concentrations. With Chinese guger-tree
seedlings exposed to 325 ppb of SO
2
, for example, peroxidase activity increased
significantly, while SOD activity was unaffected.
4
It is widely known that differences in tolerance of plant species to SO
2
occur
under similar biophysical conditions. This suggests that delicate biochemical
and physiological differences in plants could affect the sensitivity of a particular
plant species to SO
2
.
8.2.4 E
FFECTS ON ANIMALS
Although SO
2
is an irritating gas for the eyes and upper respiratory tract, no
major injury from exposure to any reasonable concentrations of this gas has
been demonstrated in animal experiments. Even exposure to pure gaseous SO
2
at concentrations 50 or more times ambient values produced little distress.
10,11
Concentrations of 100 or more times ambient are required to kill small
animals. Mortality is associated with lung congestion and hemorrhage,
pulmonary edema, thickening of the interalveolar septa, and other relatively
nonspecific changes of the lungs, such as pulmonary hemorrhage and
hyperinflation. These changes were associated with salivation, lacrimation,
and rapid, shallow ventilation. Mice exposed to 10 ppm SO
2
for 72 hours
showed necrosis and sloughin g of the nasal epithelium.
12
The lesions were more
severe in animals with preexisting infection. Other symptoms include decreased
Air Pollution – Inorganic Gases 115
[16:53 26/8/04 P:/CRC PRESS/4365 MING-HO.751 (1670)/4365-008.3d] Ref: 4365 MING-HO YU Chap-008 Page: 115 111-134
# 2005byCRCPressLLC
weight gains, loss of hair, nephrosis in kidneys, myocardial degeneration, and
accelerated aging.
Many studies have demonstrated the health effects of acidic aerosols on
laboratory animals. Changes in pulmonary function, particularly increases in
pulmonary flow resistance, occur after acute exposure. H
2
SO
4
is shown to be
more irritating than any of the sulfate salts in this regard. The irritant effect of
H
2
SO
4
depends in part on droplet size, smaller droplets being more effective.
13
For instance, animals exposed to 0.3 to 0.6 mmH
2
SO
4
droplets at various
concentrations showed either slowed or accelerated bronchial mucociliary
clearance function, depending on the concentration of the aerosol. Studies on
the comparative effects of exposure to H
2
SO
4
and ammonium bisulfate
(NH
4
HSO
4
) showed alteration of phagocytic activity, with more pronounced
effect exhibited by H
2
SO
4
. Repeated exposures to H
2
SO
4
caused the
production of hyper-responsive airways in previously healthy animals. Such
exposure also resulted in histological changes, such as increased numbers of
secretory cells in distal airways and thickened epithelium in airways of
midsized bronchi and terminal bronchioles.
14
8.2.5 HEALTH EFFECTS
Epidemiological evidence from studies during the London smog episodes
suggests that effects of SO
2
may oc cur at or above 0.19 ppm (24-hour average),
in combination with elevated particulates levels. Short-term, reversible declines
in lung function may occur at SO
2
levels above 0.10 to 0.18 ppm. These effects
may be caused by SO
2
alone, or by formation of H
2
SO
4
or other irritant
aerosols. It appears more likely that the role of SO
2
involves transformation
products, such as acidic fine particles. H
2
SO
4
and sulfates have been shown to
influence both sensory and respiratory function, such as increased respiratory
rates and tidal volumes, and slowing of mucus clearance in humans.
15
The effect of SO
2
on human health varies markedly with the health status
and physical activit y of individuals. For example, in asthmatics and others with
hyper-reactive airways exposed to SO
2
at 0.25 to 0.50 ppm and higher while
exercising, rapid bronchoconstriction (airway narrowing) was shown as the
most striking acute response. This is usually demonstrated by elevated airway
resistance, lowered expiratory flow rates, and the manifestation of symptoms
such as wheezing and shortness of breath. The time required for SO
2
exposure
to induce significant bronchoconstriction in exercising asthmatics is brief.
Exposure durations as short as 2 minutes at 1.0 ppm have produced significant
responses.
16
The combined effect of SO
2
and cold, dry air exacerbates the
asthmatic response.
17
The bronchoconstrictive effects of SO
2
are reduced under
warm, humid conditions.
18
Exposure to submicrometer-sized H
2
SO
4
aerosols increases tracheobron-
chial and alveolar rates of clearance in humans, the effects increasing with in
line with SO
2
concentration and duration. Although the altered clearance rates
may be an adaptive response of the mucociliary system to acid exposures, they
may also be early stages in the progression toward more serious dysfunctions,
116 Environmental Toxicology
[16:53 26/8/04 P:/CRC PRESS/4365 MING-HO.751 (1670)/4365-008.3d] Ref: 4365 MING-HO YU Chap-008 Page: 116 111-134
# 2005byCRCPressLLC
such as chronic bronchitis. Many researchers consider that chronic bronchitis
in exposed persons may result from continued irritant exposures. In
asthmatics, inhalation of acidic aerosols may lead to bronchospasm. Certain
morphological changes are associated with the observed clinical symptoms in
human chronic bronchitis. The changes include an increase in the number and
size of epithelial mucus secretory cells, or both, in both proximal bronchi and
in peripheral airways. The changes are accompanied by an increase in the
volume of mucus secretion.
19
These changes are followed by an increase in
epithelial thickness and a decrease in airway diameter, similar to those
observed in laboratory animals.
Synergism may be observed in elevated airway resistance induced by SO
2
in
combination with certain other air pollutants. For example, the response to
inhaled SO
2
can be exacerbated by prior exposure to O
3
. Also, the presence of
H
2
SO
4
on ultrafine ZnO particles (simulating coal combustion effluent) in a
mixture with SO
2
has been shown to increase lung reactivity responses by ten-
fold over those produced by pure droplets of H
2
SO
4
of comparable size.
20
Published reports support the hypothesis that acidic pollutants contribute
to carcinogenesis in humans. Researchers have also examined possible
biological mechanisms for such a contribution, including pH modulation of
toxicity of xenobiotics and pH-dependent alteration of cells involving mitotic
and enzyme regulation. Based on review of the mortality data from London for
the period 1958 to 1972, the EPA
21
concluded that marked increases in
mortality occurred, mainly among the elderly and chronically ill, and that the
increases were associated with black smoke and SO
2
concentrations above
1000 mg/m
3
. The conclusion was especially favored when such an elevation of
pollutants occurred for several consecutive days.
8.3 NITROGEN DIOXIDE
8.3.1 F
ORMS AND FORMATION OF NITROGEN OXIDES
Six forms of nitrogen (N) oxides occur in the atmosphere: nitrous oxide (N
2
O),
nitric oxide (NO), nitrogen dioxide (NO
2
), nitrogen trioxide (N
2
O
3
), nitrogen
tetroxide (N
2
O
4
), and nitrogen pentoxide (N
2
O
5
). Of these, NO
2
is the most
important air pollutant because of its relatively high toxicity and its ubiquity in
ambient air, while N
2
O, N
2
O
3
, and N
2
O
4
have low relative toxicity and air
pollution significance. Basic chemical reactions involved in NO
2
formation are
as below:
12108C
N
2
þ O
2
! 2NO
ð8:4Þ
2NO þ O
2
! 2NO
2
ð8:5Þ
Air Pollution – Inorganic Gases 117
[16:53 26/8/04 P:/CRC PRESS/4365 MING-HO.751 (1670)/4365-008.3d] Ref: 4365 MING-HO YU Chap-008 Page: 117 111-134
# 2005byCRCPressLLC
The NO formed in Reaction 8.4 persists when temperature is cooled
rapidly, as is the case in ambient air. Reaction 8.5 is one of the few that are
slowed down by an increase in temperature.
8.3.2 M
AJOR REACTIVE NSPECIES IN THE TROPOSPHERE
Several reactive N species, including NO, NO
2
, nitric acid (HNO
3
), occur in the
troposphere. Among these, NO
2
is of particular environmental concern
because it plays a complex and important role in the production of
photochemical oxidants and acidic deposition. NO
2
is a unique air pollutant
because it absorbs UV light energy and is then broken down to NO and atomic
oxygen. The energetic oxygen atom reacts with molecular oxygen to form O
3
.
The resultant O
3
then react s with NO to form molecular oxygen and NO
2
, thus
terminating the photolytic cycle of NO
2
(Figure 8.4). It is clear from Figure 8.4
that, as far as the cycle is concerned, there is no net gain or loss of chemical
substances. However, accumulation of O
3
does occur (for reasons that will be
discussed in the Section 8.4.1) and with numerous other photochemical
reactions occurring in the troposphere, production of photochemical smog
ensues.
In addition to NO and NO
2
, HNO
3
(nitric acid) is another important N
compound in the troposphere. Although HNO
3
is produced mainly from the
reaction between NO
2
and OH
Á
, it is formed through a secondary reactive
pathway as well. In this case, NO
2
is first oxidized to NO
3
by O
3
. The resultant
NO
3
reacts with a molecule of NO
2
, producing N
2
O
5
. The N
2
O
5
combines with
a molecule of water, yielding HNO
3
. HNO
3
, in turn, may be precipitated
through rainout or dry deposition (Figure 8.5).
8.3.3 E
FFECTS ON PLANTS
Plants absorb gaseous NO
x
through stomata. NO
2
is more rapidly absorbed
than NO, mainly because of its rapid reaction with water (NO is almost
insoluble in an aqueous medium). The absorbed NO
2
is converted to nitrate
118 Environmental Toxicology
[16:53 26/8/04 P:/CRC PRESS/4365 MING-HO.751 (1670)/4365-008.3d] Ref: 4365 MING-HO YU Chap-008 Page: 118 111-134
UV light energy
FIGURE 8.4 The photolytic cycle of NO
2
.
# 2005byCRCPressLLC
(NO
3
À
) and nitrite (NO
2
À
) ions before the plant can metabolize it. NO
2
-
induced plant injury may be due to either acidification or a photooxidation
process.
22
Symptoms exhibited by plants exposed to NO
2
are similar to those
observed in plants exposed to SO
2
, but much higher concentrations are
required to cause acute injury. However, decreased photosynthesis has been
demonstrated even at concentrations that do not produce visible injur y. The
combined effect of NO and NO
2
gases appears to be additive.
Photosynthetic inhibition caused by NO
x
may be due to competition for
NADPH between the processes of nitrite reduction and carbon assimilation in
chloroplasts. NO
2
has been shown to cause swelling of chloroplast mem-
branes.
23
Biochemical and membrane injuries may be caused by NH
3
produced
from NO
3
À
,ifNH
3
is not utilized soon after its formation. Plants can
metabolize the dissolved NO
x
through their NO
2
assimilation pa thway, as
shown below:
NO
x
! NO
3
À
! NO
2
À
! NH
3
! amino acids ! proteins
Other biochemical pathways affected by NO
x
include inhibition of lipid
biosynthesis, oxidation of unsaturated fatty acids in vivo, and stimulation of
peroxidase activity.
8.3.4 H
EALTH EFFECTS
Studies on the pathological and physiological effects of NO
2
on animals have
been conducted at concentrations much higher than those found in ambient
Air Pollution – Inorganic Gases 119
[16:53 26/8/04 P:/CRC PRESS/4365 MING-HO.751 (1670)/4365-008.3d] Ref: 4365 MING-HO YU Chap-008 Page: 119 111-134
FIGURE 8.5 Major reactive N species in the troposphere.
Source: adapted from Chameides, W. L. and Davis, D. D, C&E News, Oct. 4, 1982. With
permission from American Chemical Society.
# 2005byCRCPressLLC
air. The toxic action of NO
2
is mainly on the deep lung and peripheral airway.
In various species of animals studied, exposure to NO
2
at 10 to 25 ppm for 24
hours was shown to induce the production of fibrin in the airway, an increased
number of macrophages, and altered appearance of the cells in the distal
airway and adjacent pulmonary alveoli. Terminal bronchioles showed
hyperplasia and hypertrophy, loss of cilia, and disturbed ciliagenesis. Large
crystaloid depositions also occurred in the cuboidal cells. Continuous exposure
for several months produced thickening of the basement membranes, resulting
in narrowing and fibrosis of the bronchioles. Emphysema-like alterations of the
lungs developed, followed by death of the animals.
24
As mentioned previously, although almost all the studies reported were
conducted by using much higher concentrations of NO
2
than are found in
ambient air, a few studies have dealt with low NO
2
concentrations. Orehek et
al.
25
showed that asthmatic subjects exposed to 0.1 ppm of NO
2
resulted in
significantly aggravated hyper-reactivity in the airway. While the health effects
of prevailing concentrations of NO
2
are generally consider ed insignificant, NO
2
pollution may be an important aspect of indoor pollution. Evidence suggests
that gas cooking and heating of homes, when not wel l vented, can increase
NO
2
exposure and that such exposure may cause increased respiratory
problems among individuals, particularly young children.
NO
2
is highly reactive and has been reported to cause bronchitis and
pneumonia, as well as to increase susceptibility to respiratory infections (Table
8.1).
26
Epidemiological studies suggest that children exposed to NO
2
are at
higher risk of respiratory illness. NO
2
exposure has been shown to impair
immune responses, and be associated with daily mortality in children less than
five years old, as well as with intrauterine mortality levels in Sao Paulo,
Brazil.
27
8.3.5 BIOLOGICAL EFFECTS
Inhaled NO
2
is rapidly converted to NO
2
À
and NO
3
À
ions in the lungs, and
these ions will be found in the blood and urine shortly after exposure to
24 ppm of NO
2
.
25
Increased respiration was shown in some studies. Other
120 Environmental Toxicology
[16:53 26/8/04 P:/CRC PRESS/4365 MING-HO.751 (1670)/4365-008.3d] Ref: 4365 MING-HO YU Chap-008 Page: 120 111-134
Table 8.1 Health Effects Associated with NO
2
Exposure in Epidemiological Studies
Health effect Mechanism
Increased incidence and severity of respiratory
infections
Reduced efficacy of lung defenses
Reduced lung function Airway and alveolar injuries
Respiratory symptom Airway injury
Worsening clinical status of persons with asthma,
chronic obstructive pulmonary disease or other
chronic respiratory conditions
Airway injury
Source: adapted from Romieu, in Urban Traffic Pollution, Ecotox/WHO/E&FN Spon, London,
1999, p.9.
# 2005byCRCPressLLC
physiological alterations include a slowing of weight gain and decreased
swimming ability in rats, alteration in blood cellular constituents, such as
polycythemia, lowered hemoglobin content, thinner erythrocytes, leukocytosis
(an increase in the number of leukocytes in the circulating blood), and
depressed phagocytic activity. Methemoglobin formation occurred onl y at high
concentrations. Methemoglobinemia is a disorder manifested by high con-
centrations of methemoglobin in the blood. Under this condition, hemoglobin
contains an Fe
3þ
ion and is thus unable to combine reversibly with molecular
oxygen. The lipid material extracted from the lung of rats exposed to NO
2
has
revealed that oxidation had occurred. Lipid peroxidation was more severe in
animals fed a diet deficient in vitamin E.
27
In contrast to O
3
, reaction of NO
2
with fatty acids appears to be incomplete and phenolic antioxidants can retard
the oxidation from NO
2
.
Exposure to NO
2
may cause changes in the molecular structure of lung
collagen. In a series of studies, Buckley and Balchum
28,29,30
showed that
exposure for 10 weeks or longer at 10 ppm, or for 2 hours at 50 ppm, increased
both tissue oxygen consumption and the activities of lactate dehydrogenase
and aldolase. Stimulation of glycolysis has also been reported.
8.4 OZONE
8.4.1 S
OURCES
By far the most important source of O
3
contributing to atmospheric pollution
is photochemical smog. As discussed in the Section 8.3.2, disruption of the
photolytic cycle of NO
2
(Reaction 8.6, Reaction 8.7, Reaction 8.8, Figure 8.4)
by atmospheric hydrocarbons is the principal cause of photochemical smog.
In the above reactions, the back reaction theoretically proceeds faster than
the forward reaction, and so the resulting O
3
should be removed from the
atmosphere. However, free radicals formed from hydrocarbons (e.g., RO
2
Á
,
where R represents a hydrocarbon group) and other species occurring in the
urban atmosphere react with and remove NO, thus preventing the back
reaction. Consequently, O
3
builds up. A large number of free radicals occur in
the atmos phere, such as hydroxy radical (OH
Á
), hydroperoxy radical (HO
2
Á
),
atomic oxygen (O
1
D), and higher homologs RO
Á
and RO
2
Á
. Free radicals
participate in chain reactions, including initiation, branching, propagation, and
termination reactions in the atmosphere. The OH
Á
–HO
2
Á
chain is particularly
Air Pollution – Inorganic Gases 121
[16:53 26/8/04 P:/CRC PRESS/4365 MING-HO.751 (1670)/4365-008.3d] Ref: 4365 MING-HO YU Chap-008 Page: 121 111-134
(8.6)
(8.7)
(8.8)
# 2005byCRCPressLLC
effective in oxidizing hydrocarbons and NO. Some examples illustrating these
reactions are shown below:
OH
Á
þ RH ! R
Á
þ H
2
O ð8:9Þ
R
Á
þ O
2
! RO
2
Á
ð8:10Þ
RO
2
Á
þ NO ! RO
Á
þ NO
2
ð8:11Þ
RO
Á
þ O
2
! R
0
CHO þ HO
2
Á
ð8:12Þ
HO
2
Á
þ NO ! NO
2
þ OH
Á
ð8:13Þ
It is noticeable that the process starts with an OH
Á
radical. After one pass
through the cycle, two molecules of NO are oxidized to NO
2
. The OH
Á
radical
formed in the last step (Reaction 8.13) can start the cycle again. O
3
may also be
formed from reactions between O
2
and hydrocarbon free radicals, as shown in
the reaction below:
O
2
þ RO
2
Á
! O
3
þ RO
Á
ð8:14Þ
8.4.2 P
HOTOCHEMICAL SMOG
Hydrocarbon free radicals (e.g., RO
2
Á
) can react with different chemical
species, including NO, NO
2
,O
2
,O
3
, and various hydrocarbons, such as
Reaction 8.15:
ROO
Á
þ NO ! RO
Á
þ NO
2
ð8:15Þ
The hydrocarbon free radicals can also react with O
2
and NO
2
to produce
peroxyacyl nitrate (PAN):
ð8:16Þ
or
RO
3
Á
þ NO
2
! RO
3
NO
2
ð8:17Þ
It can be seen from the above discussion that a large number of chemical
reactions occur in the atmosphere and result in the formation of many
secondary air pollutants. In areas such as Los Angeles, where there is abundant
sunshine and unique topographical conditions, these pollutants accumulate
and produce smog. Air pollution problems like tho se found in Los Angeles and
Mexico City are common among large cities of the world. The principal
components of photochemical smog are O
3
(up to 90%), NO
x
(mainly NO
2
,
about 10%), PAN (0.6%), free radical forms of oxygen, and other organic
compounds, such as aldehydes, ketones, and alkyl nitrates (Table 8.2).
31
122 Environmental Toxicology
[16:53 26/8/04 P:/CRC PRESS/4365 MING-HO.751 (1670)/4365-008.3d] Ref: 4365 MING-HO YU Chap-008 Page: 122 111-134
# 2005byCRCPressLLC
8.4.3 EFFECTS ON PLANTS
Studies on the effects of O
3
on higher plants are extensive. Effects highlighted
by the experimental results include:
either an increase or a decrease in plant growth
32
decrease in size, weight, and number of fruits
33
decrease in shoot and root growth
34,35
decrease in seed oil
35
decrease in growth ring size
36
decrease in net photosynthesis
37
decrease in unsaturated fatty acids
38
increase in membrane permeability
39
increase in respiration
40
altered intermediary metabolism
The effect of O
3
on plant metabolism is complex. However, it is well
established that photochemical oxidants such as O
3
and PAN can oxidize –SH
groups, and such oxidation may adversely affect enzyme activity. Examples
include O
3
-induced inhibition of several enzymes involved in carbohydrate
metabolism, such as phosphoglucomutase and glyceraldehyde-3-phosphate
dehydrogenase. The hydrolysis of reserve starch in cucumber, bean, and
monkey flower was inhibited by exposure to 0.05 ppm O
3
for 2 to 6 hours,
40
suggesting an inhibitory effect on amylase or phosphorylase. While decrease in
glyceraldehyde-3-phosphate dehydrogenase activity suggests inhibition of
glycolysis, an increase in the activity of glucose-6-phosphate dehydrogenase
and 6-phosphogluconate dehydrogenase reported by some workers implies
elevated activity of the pentose phosphate pathway.
41
Recent studies indicate
that exposure of mung bean seedlings to 0.25 ppm of O
3
for 2 hours markedly
inhibited invertase activity.
42
Exposure to O
3
also interferes with lipid metabolism. For instance, lipid
synthesis, requiring NADPH and ATP, is known to pro ceed at a lower rate,
presumably because O
3
lowers the total energy of the cell. O
3
also causes
Air Pollution – Inorganic Gases 123
[16:53 26/8/04 P:/CRC PRESS/4365 MING-HO.751 (1670)/4365-008.3d] Ref: 4365 MING-HO YU Chap-008 Page: 123 111-134
Table 8.2 Compounds Observed in Photochemical Smog
Compound Typical (or maximal) concentration reported (ppm)
Ozone (O
3
) 0.1
PAN (CH
3
COO
2
NO
2
) 0.004
Hydrogen peroxide (H
2
O
2
) (0.18)
Formaldehyde (CH
2
O) 0.04
Higher aldehydes (RCHO) 0.04
Acrolein (CH
2
CHCHO) 0.007
Formic acid (HCOOH) (0.05)
Source: adapted from: NAS/NRC. Ozone and Other Photochemical Oxidants.
Committee on Medical and Biologic Effects of Environmental Pollutants. National
Academy of Sciences, 1977.
# 2005byCRCPressLLC
ozonization of fatty acids. When O
3
reacts with a polyenoic fatty acid, for
instance, the breakdown products include H
2
O
2
and malonaldyde.
43
The
structures of amino acids and proteins are also altered when these substances
are exposed to O
3
. Various amino acids, including methionine, tyrosine,
cysteine, and tryptophan, are oxidized when exposed to O
3
. For example, the
oxidation of methionine leads to methionine sulfoxide formation in a
concentration-dependent manner.
44
8.4.4 EFFECTS ON ANIMALS AND HUMANS
Ozone and other photochemical oxidants cause irritation of the respiratory
tract and the eye. The threshold limit value (TLV) for O
3
in industry is
0.1 ppm. Exposure to 0.6 to 0.8 ppm O
3
for 60 minutes resultes in headache,
nausea, anorexia, and increased airway resistance. Coughing, chest pain, and a
sensation of shortness of breath were shown in the exposed subjects who were
exercised.
45
Exposure of laboratory animals to 0.7 to 0.9 ppm O
3
may
predispose or aggravate a response to bacterial infection. Morphological and
functional changes occur in the lung in laboratory animals subjected to
prolonged O
3
exposure. Such changes as chronic bronchitis, bronchiolitis, and
emphysematous and septal fibrosis in lung tissues have been observed in mice,
rabbits, hamsters, and guinea pigs exposed daily to O
3
at concentrations
slightly above 1 ppm. Thickening of terminal and respiratory bronchioles was
the most noticeable change. For example, in the small pulmonary arteries of
rabbits exposed to O
3
, the walls were thicker and the lumens were narrower
than those of the controls. Mean ratio s of wall thickness to lumen diameter
were 1:4.9 for the control, and 1:1.7 for the exposed animals.
46
This indicates
that the width of the lumen of exposed animals was only about one third that
of the controls.
As noted in Chapter 7, emphysema is a disease in which the alveoli in the
lungs become damaged. The disorde r causes shortness of breath and, in severe
cases, can lead to respiratory or heart failure. Although emphysema is caused
mainly by cigarette smoking, atmospheric pollution due to O
3
and some other
pollutants are considered to be predisposing factors. Inhaled O
2
is passed
through the thin walls of alveoli, into the bloodstream, and CO
2
is removed
from the capillaries to be breathed out. Tobacco smoke and other air
pollutants are believed to cause emphysema by provoking the release of
chemicals within the alveoli that damage the alveolar walls. As the disease
progresses, the alveoli burst and form fewer, larger sacs with less surface area,
and so O
2
and CO
2
exchange is impaired (Figure 7.2b).
Other physiological effects include dryness of upper airway passages,
irritation of mucous membranes of nose and throat, bronchial irritation,
headache, fatigue, and alterations of visual response.
Evidence suggests that O
3
exposure accelerates the aging process. Some
investigators indicate that aging is due to irreversible crosslinking between
macromolecules, principally proteins and nucleic acids. Animals exposed to
124 Environmental Toxicology
[16:53 26/8/04 P:/CRC PRESS/4365 MING-HO.751 (1670)/4365-008.3d] Ref: 4365 MING-HO YU Chap-008 Page: 124 111-134
# 2005byCRCPressLLC
0.1 ppm O
3
may increase the susceptibility to bacterial infections. Exposed
mice may have congenital abnormalities and neonatal deaths.
The development of hyper-reactivity following O
3
exposure has been shown
in humans and dogs. The most characteristic toxic effect of exposure to
relatively high-levels of O
3
is pulmonary edema,
46
a leakage of fluid into the
gas-exchange parts of the lung. This effect was seen at concentrations only
slightly above that observed in pollution in Los Angeles, California.
Humans and animals have been shown to develop tolerance to O
3
.
Tolerance refers to increased capacity of an organism that has been pre-
exposed to a chemical agent, such as an oxidant, to resist the effects of later
exposures to ordinarily lethal, or otherwise injurious, doses of the same agent.
For example, rodents exposed to 0.3 ppm O
3
would become tolerant to
subsequent exposures of several ppm O
3
, a dose that would produce massive
pulmonary edema in animals exposed for the first time. Some human subjects
exposed to 0.3 ppm O
3
at intervals of approximately one day showed
diminished reactivity after later exposures. This response is termed adapta-
tion.
47
8.4.5 BIOLOGICAL EFFECTS
A large volume of literature has been published describing the biochemical
effects of O
3
. Examples of the reported effects include:
reactions with proteins and amino acids
reactions with lipids
formation of free radicals
oxidation of sulfhydryl compounds and pyridine nucleotides
production of more or less nonspecific stress, with the release of histamine
As mentioned in the previous section, O
3
interacts with proteins and some
amino acids, altering their characteristics. In humans, the amount of lysozyme
in tears of individuals exposed to smog was shown to be 60% less than normal.
The concentrations of protein and nonprotein sulfhydryls in the lungs of rats
exposed to 2 ppm O
3
for 4 to 8 hours were shown to be decreased. A number of
investigators have shown that O
3
can cause the oxidation of the –SH group,
and that addition of SH compounds was protective.
The activities of several enzymes are either enhanced or depressed in
animals exposed to O
3
. Reports on decreases in enzyme activities include
glucose-6-phosphate dehydrogenase, glutathione reductase, and succinate-
cytochrome c reductase in the lungs of rats exposed to 2 ppm O
3
for 4 to 8
hours, whereas increased activities were shown with glucose-6-phosphate
dehyrogenase, 6-phosphogluconate dehydrogenase, and isocitrate dehydro-
genase.
Balchum et al.
48
have provided evidence to support the concept that the
peroxidation or ozonization of unsaturated fatty acids in biological membranes
is a primary mechanism of the deleterious effects of O
3
. The hypothesis was
Air Pollution – Inorganic Gases 125
[16:53 26/8/04 P:/CRC PRESS/4365 MING-HO.751 (1670)/4365-008.3d] Ref: 4365 MING-HO YU Chap-008 Page: 125 111-134
# 2005byCRCPressLLC
based on the tendency of O
3
to react with the ethylene groups of unsaturated
fatty acids, resulting in the formation of free radicals. In the presence of
molecular oxygen, the free radicals can cause peroxidation of unsaturated fatty
acids. It has been observed that lipid material subjected to O
3
exposure showed
a relative decrease in unsaturated fatty acids as compared with saturated fatty
acids, and the more unsaturated the fatty acids were, the greater the decrease
observed. Furthermore, in the rat a deficiency of vitamin E increases the
toxicity of O
3
.
49
Possible mechanisms for O
3
toxicity involving peroxidation of
membrane unsaturated fatty acids include: the ability of O
3
to react with
polyunsaturated fatty acids (PUFA), causing lipid breakdown (breakdown
products can include H
2
O
2
, carbonyl compounds, and various free radicals,
which are detrimental to cells), and the resultant free radicals may react with:
protein –SH groups, leading to enzyme inactivation
mitochondrial PUFA, resulting in swelling and impaired energy metabolism
or loss of energy metabolism
lysosomal PUFA, causing release of lysosomal hydrolases
nuclear PUFA, leading to carcinogenesis
50
Another chemical pathway that can induce O
3
-dependent oxidation of
unsaturated fatty acids is through incorporation of O
3
into the fatty acid
double bond, resulting in ozonide formation. This process is generally known
as ozonolysis (Figure 8.6). Ozone is also known to oxidize GSH and pyridine
nucleotides NADH and NADPH. The ozonization of the nicotinamide ring of
NADPH may proceed in such a way as that shown in Figure 8.7.
Because the intracellular ratios of NADH/NAD
þ
, NADPH/NADP
þ
, and
ATP/adenylates are carefully regulated by the cell, loss of the reduced
nucleotide can be compensated for by faster operation of the Krebs cycle.
126 Environmental Toxicology
[16:53 26/8/04 P:/CRC PRESS/4365 MING-HO.751 (1670)/4365-008.3d] Ref: 4365 MING-HO YU Chap-008 Page: 126 111-134
FIGURE 8.6 Ozonization of membrane lipids.
# 2005byCRCPressLLC
However, the cell can only make up for a ne t loss of all nucleotides by an
increase in synthesis. The oxidation of NADH or NADPH results in elevated
enzyme activity, which permits the cell to restore the initial ratio of the
nucleotides. With NADPH, oxidation increases the activity of the pentose
phosphate pathway. Such increase also occurs following the oxidation of GSH
(Reaction 8.18). Oxidation of either NADPH or GSH, therefore, may be
responsible for the apparent increase in enzymes in the pentose phosphate
pathway after repeated O
3
exposure.
ð8:18Þ
ð8:19Þ
ð8:20Þ
8.5 CARBON MONOXIDE
8.5.1 I
NTRODUCTION
Carbon monoxide (CO) is an odorless, colorless, and tasteless gas found in
high concentrations in the urban atmosphere. No other gaseous air pollutants
with such a toxic potential exist at such high concentrations in urban
Air Pollution – Inorganic Gases 127
[16:53 26/8/04 P:/CRC PRESS/4365 MING-HO.751 (1670)/4365-008.3d] Ref: 4365 MING-HO YU Chap-008 Page: 127 111-134
FIGURE 8.7 Ozonization of the nicotinamide ring in NADPH.
# 2005byCRCPressLLC
environments. Historically, early exposures resulted from the use of wood-
burning fires and then from using coal for domestic heating. Combustion of
fossil fuel associated with developing industry, explosions, fires in mines, and
illumination gas prepared from coal all have been sources of exposure. The
migration of agricultural populations to cities increased the proportion of
exposed population, as well as the number of persons generating CO. With the
emergence of automobiles propelled by internal combustion engines, CO
emitted from exhaust pipes has become the major source for human exposure.
Serious problems also exist due to occupational exposure to increased levels of
CO.
8.5.2 F
ORMATION
Carbon monoxide is usually formed through one of the following three
processes: incomplete combustion of carbon-containing fuels, reactions
between CO
2
and carbon-containing materials at high temperature, and
dissociation of CO
2
at high temperatures.
Incomplete combustion of carbon or carbon-containing compounds occurs
when the available oxygen is less than the amount required for complete
combustion, in which CO
2
would be the product (Reaction 8.21 and Reaction
8.22). It will also occur when there is poor mixing of fuel and air.
2C þ O
2
! 2CO ð8:21Þ
2CO þ O
2
! 2CO
2
ð8:22Þ
Carbon monoxide is also produced when CO
2
reacts with carbon-contain-
ing materials at an elevated temperature (Reaction 8.23). Such reactions are
common in many industrial devices.
CO
2
þ C ! 2CO ð8:23Þ
The CO produced in this way is utilized in a variety of industrial facilities,
such as the blast furnace of a smelter, where the CO acts as a reducing agent in
the production of iron from Fe
2
O
3
ores (Reaction 8.24). Some CO may,
however, escape into the atmosphere.
3CO þ Fe
2
O
3
! 2Fe þ 3CO
2
ð8:24Þ
CO may also be produced by the dissociation of carbon dioxide into CO
and O at high temperatures, as shown in Reaction 8.25.
ð8:25Þ
128 Environmental Toxicology
[16:53 26/8/04 P:/CRC PRESS/4365 MING-HO.751 (1670)/4365-008.3d] Ref: 4365 MING-HO YU Chap-008 Page: 128 111-134
# 2005byCRCPressLLC
8.5.3 HUMAN EXPOSURE
Human exposure to CO occurs mainly from three sources: ambient air,
occupational exposure, and cigarette smoke.
CO in the surrounding ambient environment is largely emitted in exhaust
gases (automobiles, industrial machinery), but other sources of accidental
intoxication include house fires (which may contain more than 50,000 ppm
CO) and environmental problems in the house (such as defective furnaces,
charcoal burning in poorly vented houses, or garages connected to living
quarters).
Individuals particularly at risk from occupational exposure include fire
fighters (>10,000 ppm CO), traffic police, coal miners, coke-oven and smelter
workers, tollbooth attendants, and transportation mechanics.
8.5.4 H
EALTH EFFECTS
A constant supply of O
2
is needed in order for physiological functions to
proceed normally in the body. Oxygen is carried to body tissue by hemoglobin
(Hb), a complex component of red blood cells that consists of two pairs of
proteins (a and b chains), which themselves are bonded around an iron.
Hemoglobin picks up O
2
in the lungs, forming a complex called oxyhemo-
globin (HbO
2
), as shown below:
Hb þ O
2
! HbO
2
ð8:26Þ
Once the HbO
2
reaches the body tissues, it releases the bound O
2
to be
used:
HbO
2
! Hb þ O
2
ð8:27Þ
The Hb is then returned to the lungs for a new supply of O
2
.
CO is toxic because it enters the bloodstream and reduces the ability of the
red blood cells to deliver oxygen to the body’s organs and tissues. The toxic
action of CO involves the formation of carboxyhemoglobin (COHb or HbCO):
CO þ Hb
!
HbCO ð8:28Þ
The chemical affinity of CO for Hb is more than 200 times greater than that
of O
2
. Furthermore, in the presence of CO, HbO
2
readily releases the bound O
2
and picks up CO to form HbCO:
HbO
2
þ CO
!
HbCO þ O
2
ð8:29Þ
Because the binding sites of each polypeptide chain on the hemoglobin
molecule cannot be occupied by the O
2
and CO at the same time, it is apparent
Air Pollution – Inorganic Gases 129
[16:53 26/8/04 P:/CRC PRESS/4365 MING-HO.751 (1670)/4365-008.3d] Ref: 4365 MING-HO YU Chap-008 Page: 129 111-134
# 2005byCRCPressLLC
that CO can tie up a substantial quantity of Hb when HbCO is formed.
Consequently, Hb will not be able to transport O
2
to tissues, thus severely
impairing bodily function, especially of the heart and central nervous system.
Although increase in oxygen concentrations can shift the equilibrium in
Reaction 8.29 to the left, recovery of Hb is slow, while the asphyxiating effect
of binding Hb with CO is rapid. People with cardiovascular disease,
particularly those with angina or peripheral vascular disease, are much more
susceptible to the health effects of CO. Furthermore, research showed that the
fetus is particularly susceptible to lack of O
2
supply, therefore maternal CO
poisoning during pregnancy can lead to fetal death. Animal studies have shown
that the offspring of pregnant female rats exposed to CO have lower birth
weights and significant learning deficits.
51
The normal or background level of blood HbCO is about 0.5%. Part of the
CO in background HbCO is derived from the ambient air, while the rest is
originated by the body as a result of heme catabolism. The equilibrium
percentage of HbCO in the bloodstream of a person continually exposed to an
ambient air CO concentration of less than 100 ppm can be calculated from the
following equation:
HbCO in blood (%) ¼ 0.16 Â (CO conc. in the air in ppm) þ 0.5
According to available data (Table 8.3),
27
the concentration of HbCO in
the blood required to induce a decreased O
2
uptake capacity is approximately
5%. Impairment in the ability to correctly judge slight differences in successive
short time intervals has been observed at HbCO levels of 3.2 to 4.2%. The most
well-known symptoms of CO poisoning are headache and dizziness, which
occur at HbCO levels between 10 and 30%. At levels above 30%, the
symptoms are severe headache, cardiovascular symptoms, and malaise. Above
about 40%, there is considerable risk of coma and death.
27
In case of acute CO
poisoning, 100% oxygen is commonly used to treat the victim.
130 Environmental Toxicology
[16:53 26/8/04 P:/CRC PRESS/4365 MING-HO.751 (1670)/4365-008.3d] Ref: 4365 MING-HO YU Chap-008 Page: 130 111-134
Table 8.3 Human Health Effects Associated with Carboxyhemoglobin (HbCO) Levels
HbCO level
(%) Health effects
<1.0 No apparent effect
2–4 Impairment of visual function; decreases in the relation between work time
and exhaustion in exercising young healthy adults
2.0–4.5 Decrease in exercise capacity in patients with angina
<5 Vigilance decrement
5–5.5 Decrease in maximum oxygen consumption and exercise in young healthy
men during strenuous exercise
5–17 Impairment of visual perception, of manual dexterity, of learning ability or
performance of certain intellectual tasks
20–25 Nausea, weakness (particularly in the legs), occasional vomiting
Source: Pereira, L.A. et al., Environ. Health Perspect., 106, 325, 1998.
# 2005byCRCPressLLC
The half-life of HbCO is estimated to be 4 hours at rest at room air, and it is
shortened to 60 to 90 minutes if 100% oxygen is given using a facemask. In
addition to its association with Hb in red blood cells, CO binds to other
proteins in the body, such as myoglobin, cytochrome c oxidase, and
cytochrome P450, thereby impairing their actio n. CO also inhibits alveolar
macrophage function, weakening tissue defenses against airborne bacterial
infection.
8.6 REFERENCES
1. Kellogg, W.W. et al., The sulfur cycle, Science 175, 587, 1972.
2. Fox, D.L., The transformation of pollutants, in Stern, A.C., Ed., Air Pollution,
3rd ed. vol. VI, Academic Press, New York, 1986, p.86.
3. Chameides, W.L. and Davis, D.D., Chemistry in the troposphere, C&EN, Oct.
4, 1982, 38.
4. Sheu, B H., Effects of sulfur dioxide on growth, photosynthesis and enzyme
activities of Chinese Guger-Tree seedlings, Environ. Poll., 86, 349, 1994.
5. Plesnicar, M., Study of sulfur dioxide effects on phosphorus metabolism in
plants using
32
P as an indicator, Int. J. Appl. Radiat. Isot., 34, 833, 1983.
6. Carsed, S.G., SO
2
uptake and transport, in Winner, W.E. et al., Eds., Sulfur
Dioxide and Vegetation. Stanford University Press, Stanford, CA, 1985, 88.
7. Lauenroth, W.K. and Dodd, J.L., Chlorophyll reduction in western wheatgrass
(Agropyron smithii Rydb.) exposed to sulfur dioxide, Water Air Soil Pollut., 15,
309, 1981.
8. Koziol, M.J. and Jordon, C.F., Changes in carbohydrate levels in red kidney
bean (Phasedus vulgaris L.) exposed to sulfur dioxide, J. Exp. Bot., 29, 1037,
1978.
9. Malhotra, S.S. and Khan, A.A., Effects of sulfur dioxide fumigation on lipid
biosynthesis in pine needles, Phytochem., 17, 241, 1978.
10. Alarie, Y. et al., Long-term continuous exposure of guinea pigs to sulfur
dioxide, Arch. Environ. Health, 21, 769, 1970.
11. Alarie, Y. et al., Long-term continuous exposure of guinea pigs to sulfur
dioxide, Environ. Health, 27, 251, 1973.
12. Giddens, W.E. Jr. and Fairchild, G.A., Effects of sulfur dioxide on the nasal
mucosa of mice. Arch. Environ. Health, 25, 166, 1972.
13. Amdur, M.O., Dubriel, M. and Creasia, D., Respiratory response of guinea
pigs to low levels of sulfuric acid, Environ. Res., 15, 418, 1978.
14. Schlesinger, R.B., Naumann, B.D. and Chen, L.C., Physiological and
histological alterations in the bronchial mucociliary clearance system of rabbits
following intermittent oral or nasal inhalation of sulfuric acid mist, J. Toxicol.
Environ. Health, 12, 441, 1983.
15. Amdur, M.O., Silverman, L. and Drinker, P., Inhalation of H
2
SO
4
mist by
human subjects, Arch. Ind. Hyg. Occup. Med., 6, 305, 1952.
16. Horstman, D.H. J. et al., The relationship between exposure duration and
sulfur dioxide-induced bronchoconstriction in asthmatic subjects, Am. Ind.
Hyg. Assoc. J., 49, 38, 1988.
Air Pollution – Inorganic Gases 131
[16:53 26/8/04 P:/CRC PRESS/4365 MING-HO.751 (1670)/4365-008.3d] Ref: 4365 MING-HO YU Chap-008 Page: 131 111-134
# 2005byCRCPressLLC
17. Sheppard, D. et al., Magnitude of the interaction between the bronchomotor
effects of sulfur dioxide and those of dry (cold) air, Am. Rev. Respir. Dis., 130,
52, 1984.
18. Linn, W.S. et al., Effects of heat and humidity on the responses of exercising
asthmatics to sulfur dioxide exposure, Am. Rev. Respir. Dis. 131, 221, 1985.
19. Reid, L., An experimental study of the hypersecretion of mucus in the
bronchial tree, Br. J. Exp. Pathol., 44, 437, 1963.
20. Amdur, M.O. and Chen, L.C., Furnace generated acid aerosols: Speciation and
pulmonary effects, Environ. Health Perspect., 79, 147, 1989.
21. EPA, Second Addendum to Air Quality Criteria for Particulate Matter and
Sulfur Oxides (1982). EPA/600/8-86/020F. U.S. Environmental Protection
Agency, Washington, D.C., 1986.
22. Zeevaart, A.J. Some effects of fumigating plants for short periods with NO
2
,
Environ. Pollut., 11, 97, 1976.
23. Wellburn, A.R., Majernik, O. and Wellburn, F.A.M., Effects of SO
2
and NO
2
polluted air upon the ultrastructure of chloroplasts, Environ. Pollut., 3, 37,
1972.
24. Freeman, G. and Haydon, G.B., Emphysema after low-level exposure to NO
2
,
Arch. Environ. Health, 8, 125, 1964.
25. Orehek, J. et al., Effects of short-term, low-level nitrogen dioxide exposure on
bronchial sensitivity of asthmatic patients, J. Clin. Invest., 57, 301, 1976.
26. Romieu, I., Epidemiologcal studies of health effects arising from motor vehicle
air pollution, in Schwella, D. and Zali, O., Eds., Urban Traffic Pollution,
Ecotox/WHO/E&FN Spon, London, 1999, p.9.
27. Pereira, L.A. et al., Association between air pollution and intrauterine
mortality in Sao Paulo, Brazil, Environ. Health Perspect., 106, 325, 1998.
28. Roehm, J.N., Hadley, J.G. and Menzel, D.B., Oxidation of unsaturated fatty
acids by ozone and nitrogen dioxide – a common mechanism of action, Arch.
Environ. Health, 23, 142, 1971.
29. Buckley, R.D. and Balchum, O.J., Acute and chronic exposure to nitrogen
dioxide, Arch. Environ. Health, 10, 220, 1965.
30. Buckley, R.D. and Balchum, O.J., Effects of nitrogen dioxide on lactic
dehydrogenase isozymes, Arch. Environ. Health, 14, 424, 1967.
31. NAS/NRC. Ozone and Other Photochemical Oxidants. Committee on Medical
and Biologic Effects of Environmental Pollutants. U.S. National Academy of
Sciences, Washington, D.C., 1977, p.38.
32. Buckley, R.D. and Balchum, O.J., Enzyme alterations following nitrogen
dioxide exposure, Arch. Environ. Health, 14, 687, 1967.
33. Blum, U. and Heck, W.W., Effects of acute ozone exposures on snap bean.
(Phaseolus vulgaris cultivar BBL -290) at various stages of its life cycle, Environ.
Exp. Bot., 20, 73, 1980.
34. Henderson, W.R. and Reinert, R.A., Yield response of four fresh market
tomato (Lycopersicon esculentum) cultivars after acute ozone exposure in the
seedling stage, J. Am. Soc. Hortic. Sci., 104, 754, 1979.
35. Grunwald, C. and Endress, A.G., Fatty acids of soybean seeds harvested from
plants exposed to air pollutants, J. Agr. Chem., 32, 50, 1984.
36. Letchworth, M.B. and Blum, U., Effects of acute ozone exposure on growth,
modulation, and nitrogen content of Ladino clover, Environ. Pollut., 14, 303,
1977.
132 Environmental Toxicology
[16:53 26/8/04 P:/CRC PRESS/4365 MING-HO.751 (1670)/4365-008.3d] Ref: 4365 MING-HO YU Chap-008 Page: 132 111-134
# 2005byCRCPressLLC
37. McLaughlin, S.B. et al., Effects of chronic air pollution stress on photosynth-
esis, carbon allocation, and growth of white pine trees (Pinus strobus), For. Sci.,
28, 60, 1982.
38. Blum, U., Mrozek, E. Jr. and Johnson, E., Investigation of ozone (O
3
) effects
on
14
C distribution in Ladino clover, Environ. Exp. Bot., 23, 369, 1983.
39. Perchorozicz, J.T. and Ting, I.P., Ozone effects on plant cell permeability,
Amer. J. Bot., 61, 787, 1974.
40. Pauls, K.P. and Thomspon, J.E., Effects of in vitro treatment with ozone on the
physical and chemical properties of membranes, Physiol. Plant., 53, 255, 1981.
41. Dugger, W.M. and Ting, I.P., Air pollution oxidants: their effects on metabolic
processes in plants, Ann. Rev. Plant Physiol., 21, 215, 1970.
42. Yu, M H., unpublished data, 2004.
43. Tingey, D.T., Fites, R.C. and Wickliff, C., Activity changes in selected enzymes
from soybean leaves following ozone exposure, Physiol. Plant., 33, 316, 1975.
44. Mudd, J. B. et al., Reaction of ozone with amino acids and proteins, Atm.
Environ., 3, 669, 1969.
45. Bates, D.V. and Hazucha, M., in Proceedings of the Conference on Health
Effects of Air Pollutants, Ser. 93-15. NAS/NRC for the U.S. Senate Committee
on Public Works. US Govt. Printing Office, Washington, D.C., 1973.
46. P’an, A.Y.S., Beland, J. and Zygmund, J., Ozone-induced arterial lesions,
Arch. Environ. Health, 24, 229, 1972.
47. Horvath, S.M., Gliner, J.A. and Folinsbee, L.J., Adaptation to ozone:
duration of effect, Am. Rev.Respir. Dis., 123, 496, 1981.
48. Balchum, O.J., O’Brian, J.S. and Goldstein, B.D., Ozone and unsaturated fatty
acids, Arch. Environ. Health, 22, 32, 1971.
49. Goldstein, B.D. et al., Ozone and vitamin E, Science, 169, 605, 1970.
50. Mueller, P.K. and Hitchcock, M., Air quality criteria – toxicological appraisal
for oxidants, nitrogen oxides, and hydrocarbons, J. Air Pollut. Contr. Assoc.,
19, 670, 1969.
51. Mactutus, C.F. and Flechter, L.D., Prenatal exposure to carbon monoxide,
Science, 223, 409, 1984.
8.7 REVIEW QUESTIONS
1. Briefly explain the role that the free hydroxyl radical (OH
Á
) plays in the
atmosphere.
2. Explain the chemical changes that occur once SO
2
is absorbed into a plant
leaf.
3. Compare the phytotoxicity of S-containing chemical species produced from
SO
2
in a plant leaf.
4. What could be the basis for different plant species to exhibit different
sensitivity to SO
2
?
5. How is SO
2
exposure related to respiratory system in animals and humans?
6. Explain the toxic effect of acidic aerosol inhalation in humans.
7. Describe the photolytic cycle of NO
2
.
8. Explain the way in which plants may make use of dissolved NO
x
.
9. What can you tell from the observation that lipid peroxidation is more
severe in animals whose dietary vitamin E is deficient?
Air Pollution – Inorganic Gases 133
[16:53 26/8/04 P:/CRC PRESS/4365 MING-HO.751 (1670)/4365-008.3d] Ref: 4365 MING-HO YU Chap-008 Page: 133 111-134
# 2005byCRCPressLLC
10. Describe the mechanism whereby ozone may accumulate in the tropo-
sphere.
11. What is photochemical smog? What are the main components?
12. Explain how O
3
may injure membrane structure.
13. What is PAN? Explain how it may be formed.
14. What effect does O
3
have on amino acids?
15. What is the characteristic respiratory problem that an emphysematous
patient may suffer?
16. What is the most noticeable change in the bronchioles of animals exposed to
O
3
?
17. What is pulmonary edema? Which air pollutant(s) can cause it?: SO
2
,NO
2
,
F, O
3
.
18. Draw a diagram to illustrate the biochemical effect of O
3
on membrane
unsaturated fatty acids.
19. What is ozonolysis? Briefly explain the process involved.
20. Write a chemical equation to show the reaction between O
3
and GSH.
21. Explain how CO may be formed from CO
2
.
22. What is carboxyhemoglobin? Write down a chemical equation to show its
formation.
23. What is the physiological basis for the toxicity of CO?
24. Explain how CO may be related to macrophage function.
25. What is the relationship between CO and cytochrome P450?
134 Environmental Toxicology
[16:53 26/8/04 P:/CRC PRESS/4365 MING-HO.751 (1670)/4365-008.3d] Ref: 4365 MING-HO YU Chap-008 Page: 134 111-134
# 2005byCRCPressLLC