GIS Applications for Water, Wastewater, and Stormwater Systems - Chapter 6 ppt
Bạn đang xem bản rút gọn của tài liệu. Xem và tải ngay bản đầy đủ của tài liệu tại đây (1.74 MB, 10 trang )
CHAPTER
6
Internet Applications
Internet-based mapping applications are changing the way people
use and manage geographic information for their water, wastewater,
and stormwater systems.
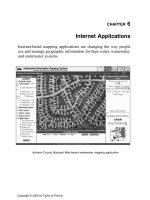
Johnson County (Kansas) Web-based wastewater mapping application.
2097_C006.fm Page 119 Monday, December 6, 2004 6:02 PM
Copyright © 2005 by Taylor & Francis
LEARNING OBJECTIVE
The learning objective of this chapter is to familiarize ourselves with the applications
of Internet technology in GIS for the water industry.
MAJOR TOPICS
• Internet GIS applications
• Internet GIS software
• Internet GIS case studies
LIST OF CHAPTER ACRONYMS
AM/FM/GIS
Automated Mapping/Facilities Management/Geographic Information
System
DXF
Drawing Exchange Format
PDA
Personal Digital Assistant
RDBMS
Relational Database Management System
WWW
World Wide Web
DUBLIN’S WEB MAP
One of the fastest growing communities in the Midwest, Dublin’s 22 mi
2
area
is home to about 30,000 people and 2,500 businesses. The city received the year
2000 Best Practices Award from the Ohio Geographically Referenced Information
Program, a state agency responsible for educating local government about GIS
technology. The city is constantly enhancing its GIS capabilities and serves as a
model medium-sized municipal GIS for the state. This application was developed
after City personnel started to realize that retrieving data from hard-copy records
was inefficient because it reduced staff time to perform engineering review and
analysis. The city needed an automated system that could recall, evaluate, and
reproduce data more quickly. The City implemented a Web-based GIS data server
using Autodesk’s (San Rafael, California) Web-based MapGuide technology
Application Web-based mapping
GIS software AutoCAD, AutoCAD Map, and MapGuide
GIS data 1-m, natural color, orthorectified, precision pan-sharpened imagery of
the entire city from Space Imaging (Thornton, Colorado) and vector
layers for school districts, corporate limits, county boundaries,
subdivisions, streets, parcels, and water (mains and hydrants),
stormwater (sewers, structures, and streams), and sanitary sewer
(sewers and manholes) systems
Study area Dublin, Ohio
2097_C006.fm Page 120 Monday, December 6, 2004 6:02 PM
Copyright © 2005 by Taylor & Francis
(Cerasini and Herskowitz, 2001). Figure 6.1 shows a screenshot of Dublin’s
Internet GIS Web site.
In addition to serving the development department, Dublin’s GIS serves all other
city departments and divisions, with data distributed to more than 200 users. Dublin’s
GIS Web site (gis.dublin.oh.us) provides quick access to utility data for maintenance,
planning, and emergency response activities. The users range from planning and
engineering professionals to grounds maintenance staff. A major challenge for any
GIS is deciding who will maintain the data and how. Dublin’s management structure
encourages departments and divisions to exchange information freely, allowing
departments to maintain their own data within the enterprise framework while
feeding the GIS. Such an approach benefits everyone.
In 2001, the City started to implement GIS based asset management systems for
the water, wastewater, and stormwater systems. Dublin also moved much of the GIS
mapping and city assets to a mobile environment with wireless technology and GPS
to allow data products to be distributed to a mobile workforce with personal digital
assistants (PDAs) and wireless notebooks. The future is expected to bring even more
integration between traditional municipal applications and GIS because the City also
plans to integrate other applications, including work orders, asset management, crime
analysis, public safety, and emergency dispatch.
Determining how much money Internet GIS technology is saving the City of Dublin
is difficult to assess. However, the City feels that in most cases the time and effort required
to respond to utility data requests have decreased from several hours to minutes, which
translates to increased staff productivity and enhanced responsiveness to customers.
This chapter provides information on the GIS applications for serving water,
wastewater, and stormwater system maps on the Internet.
Figure 6.1
Screenshot of Dublin (Ohio) Internet GIS Web Site.
2097_C006.fm Page 121 Monday, December 6, 2004 6:02 PM
Copyright © 2005 by Taylor & Francis
INTERNET GIS
The Internet is the place where an increasing number of people are going for
their mapping needs. In fact, the word
map
is one of the most commonly searched
keywords on the Web (ESRI, 2002).
Imagine going to a GIS Web site, zooming to a piece of property, defining the building
footprint, and displaying various cut and fill configurations. You could then simulate a 10-
year, 24-hour design storm to model where the runoff will go and how you would control
it to meet the local stormwater management ordinance.
The Internet is the fastest growing and most efficient technology for distributing
GIS data to the public. The Internet and the World Wide Web (WWW or Web) are
simplifying how the maps are created and maintained. The Internet is facilitating
GIS data sharing between different organizations. Intranets are making it easy to
share GIS data between coworkers of the same organization. Until the mid-1990s
spatial information was generally distributed via the Internet as static map images.
In the late 1990s dynamic GIS Web pages started allowing the public to interactively
display and query GIS databases, using what is now referred to as Internet GIS
technology (Wild and Holm, 1998).
Web browsers now provide both experts and novices with a common, powerful,
inexpensive, and intuitive interface for accessing a GIS. Because casual public users
can now access GISs through Web browsers, the water industry GIS staff is free to
spend more time on improving the database for providing better customer service
(Irrinki, 2000). Many large utilities are now using the Internet and GIS to improve
the operation and management of their water and sewer systems. They are using
Internet and GIS-based work order management and customer service software to
accomplish this.
Figure 6.2 shows a screenshot of an Internet GIS Web site for the municipality
of Penn Hills, Pennsylvania, created using ESRI’s ArcIMS software. The tools shown
at the top of the screen can be used to navigate (pan, zoom, etc.) and query the
maps. Users can also apply the measure tool to determine distance and area from
the map. The right side of the screen helps the users select the active layer for
analysis (e.g., query) and turn it on (visible) or off (invisible). The bottom of the
screen shows the query results.
Cincinnati Water Works reported a $2-million cost savings in the first year of using
Internet GIS (Anderson, 2000).
GIS and enterprise database management systems can be combined to create
geospatial data warehouses. For example, using the power of Oracle’s spatial exten-
sions, a data mining software (e.g., KnowledgeMiner from SpatialAge Solutions,
Atlanta, Georgia, www.byers.com) can mine a network inventory model from an
automated mapping/facilities management/geographic information system
(AM/FM/GIS) and make it readily available to the enterprise using the Web. The object
2097_C006.fm Page 122 Monday, December 6, 2004 6:02 PM
Copyright © 2005 by Taylor & Francis
relational database management system (RDBMS) spatial extensions, such as Oracle
Spatial, facilitate linking data warehouses with GIS software packages. RDBMS is
especially well suited for Internet and intranet data sharing. A data mining application
can translate Internet requests into RDBMS queries and send RDBMS responses back
to the Internet as Web pages. Utilities that rely on large and complex spatial data sets
could greatly benefit from the recent fusion of object RDBMS and Internet technolo-
gies (Lowe, 2000a).
Internet Security
Security issues and concerns should be evaluated when posting GIS maps on
the Internet. Precautions need to be taken to assure application security and data
integrity (Miller et al., 2004). Appropriate security measures such as firewalls, data
backups, user authentication, and password access can be used to reduce the chances
of security breaches by hackers to harm the GIS data or corrupt the application
software. Sensitive information that could help terrorists should not be posted or
should be restricted to authorized users only. According to a Rand Corporation
(www.rand.org) study released in April 2004, less than 1% of publicly available
federal Web sites and databases in the U.S. contain geospatial information that could
Figure 6.2
Screenshot of Penn Hills, Pennsylvania ArcIMS Web site.
2097_C006.fm Page 123 Monday, December 6, 2004 6:02 PM
Copyright © 2005 by Taylor & Francis
help terrorists and other hostile forces mount attacks in the U.S. (Geospatial Solu-
tions, 2004). In the wake of the September 11, 2001, terrorist attacks in the U.S.,
many Internet GIS sites were removed. Others began restricting public access to
some of their sensitive information through the Internet.
INTERNET GIS SOFTWARE
Internet GIS uses a client/server architecture. Therefore two types of software
are required to Web-enable a GIS: client-side and server-side (Shamsi, 2003). Client-
side software is very easy to use but does not provide data creation or editing
capability. It is usually available for free. Examples include:
• ArcExplorer, ESRI
• GeoMedia Viewer, Intergraph
• MapGuide Viewer, Autodesk
Server-side software, accessible through browsers, makes GIS usable over the Web.
Based on the capabilities, the cost ranges from $5,000 to $25,000. Examples include:
• ArcIMS, ESRI
• GeoMedia Web Map, Intergraph
• MapGuide, Autodesk
• MapXtreme, MapInfo
INTERNET GIS APPLICATIONS
Representative applications of Internet GIS technology are described in the
following subsections.
Data Integration
Imagine an organization with watershed data in ESRI Shapefiles, parcel data in
an Oracle Universal Data Server with Spatial Cartridge, and water main data in an
AutoCAD file. Imagine further that different data are stored on different network
drives in different projections. Software is now available to integrate different data
formats and convert them into a common projection system on the fly. Intergraph’s
GeoMedia Web Map is an example of such a software (Lowe, 2000).
Project Management
A project Web site promotes collaboration and efficient completion of utility
construction or rehabilitation projects by providing all involved parties instant access
to current information and allowing them to disseminate information automatically
and immediately. A Web site also eliminates software and hardware compatibility
problems among project team organizations. Redline (edit) capability can be added
to a project Web site to expedite the design review process (Irrinki, 2000).
2097_C006.fm Page 124 Monday, December 6, 2004 6:02 PM
Copyright © 2005 by Taylor & Francis
These possibilities are the result of a new generation of software from the leading
GIS and CAD software companies. For example, in addition to the traditional CAD
work, Autodesk’s AutoCAD 2000i enables users to collaborate with design profes-
sionals anywhere in the world and move the designs and processes to their companies’
intranets and the Web. Similarly, Intergraph’s GeoMedia, in conjunction with Oracle
Spatial, enables all the users to see the latest engineering project information against
the base-map images. The various projects are represented as polygons overlayed on
the base-map image. A user can simply click on one of the project polygons to obtain
the most recent information about that project. After a project has been completed,
the engineering information (including redlines) is used to update the spatial data
stored in Oracle Spatial. This approach was successfully implemented by the Public
Works Department of the City of Minneapolis. The City used GeoMedia and an Oracle
Spatial data warehouse to provide future users the most current information about the
city’s infrastructure (Murphy, 2000). Figure 6.3 shows a project portal designed using
this approach for a wastewater improvement project for the Borough of California
(Pennsylvania), created
by Chester Engineers, Pittsburgh, Pennsylvania.
Figure 6.3
Screenshot of the Borough of California (Pennsylvania) project portal.
2097_C006.fm Page 125 Monday, December 6, 2004 6:02 PM
Copyright © 2005 by Taylor & Francis
3D Visualization Applications
Internet GIS applications can also provide 3D visualization capability that converts
2D aerial photographs and satellite images into 3D terrain. The 3D terrain can be used
as a base map for draping other information such as realistically textured buildings.
For example, Skyline Software Systems’ (www.skylinesoft.com) TerraExplorer pro-
vides realistic, interactive, photo-based, 3D maps of many locations and cities of the
world on the Internet. Skyline’s Internet technology enables creation, delivery, and
interaction with content-rich, 3D geographic environments. Skyline enhances the Web
experience for a variety of location-specific applications such as travel and tourism,
real estate, entertainment, mapping, tracking, planning, and engineering. Standard
CAD or GIS data layers such as DXF or Shapefiles can be easily incorporated to create
dramatic 3D movies. Such Internet-based mapping applications are designed for a
layperson and do not require GIS expertise.
CASE STUDIES
Two case studies illustrating the application of Internet GIS technology are
described in the following subsections.
Tacoma’s Intranet and Mobile GIS
Tacoma Water, a division of Tacoma Public Utilities (TPU) located in the state
of Washington, serves 146,000 customers in the city of Tacoma’s 52 mi
2
area and
surrounding parts of Pierce and King counties. Tired of flipping through outdated
map books and clumsy blueprints to locate water and sewer lines, Tacoma Water
implemented intranet and wireless GIS applications.
Because of their familiarity with CAD, which was used in their engineering
projects, Tacoma Water began a $750,000 multiyear project in 1990 to create
CAD-based digital base maps and facility layers. The base map consisted of digital
orthophotos and planimetric layers, such as building footprints, pavement edges,
rights-of-way, lots and blocks, and easements, in a CAD format. Data conversion
was completed in 1997 producing 6.5 GB of data with a horizontal accuracy of
6 in. Initially these data were distributed on CD-ROMs. In 1998, Tacoma Water
Application Intranet and Wireless GIS
GIS software AutoCAD, AutoCAD Map, MapGuide, and GE Smallworld
Other software Microsoft Access and SQL Server databases
Hardware Laptop computers from Dell Computer Corp. and Gateway, Inc., 14.4K
CDPD wireless PC card modems from Sierra Wireless
GIS data Black and white orthophotos and planimetric base map layers from
Bentley ADR, 3-ft and 6-ft color digital orthophotos from Triathlon, Inc.
Study area Tacoma, Washington
Organization Tacoma Public Utilities and Tacoma Water
2097_C006.fm Page 126 Monday, December 6, 2004 6:02 PM
Copyright © 2005 by Taylor & Francis
implemented an intranet GIS using Autodesk’s intranet and Internet software suite
consisting of AutoCAD, AutoCAD Map, and MapGuide for an initial investment
of $12,000. Using these packages, they integrated their CAD data in a GIS and
hosted it on a central server from where it was accessible to any computer using
a standard Internet browser. The intranet GIS enabled the users to query the map
features by simply placing the mouse cursor over that feature. By putting the
cursor over a valve, for instance, the user will see a pop-up window showing the
size, type, and number of turns required to open or close the valve.
According to Tacoma Public Utilities, “Having multiple layers of information available
on mobile computing devices is like a holy grail to the water field crews.”
In order to provide the available intranet GIS data to crews in the field, Tacoma
Water implemented a wireless GIS in 1999. Consisting of off-the-shelf laptop com-
puters and wireless modems, the truck-mounted wireless GIS was initially used by
18 field crews. The cost of unlimited wireless airtime was $50 per month. The
mobility allowed by such a system puts field crews light years ahead of the time
when finding a water main meant rummaging through a map book or reading
microfiche (Teo, 2001).
Montana’s Watershed Data Information Management System
Montana Department of Environmental Quality (DEQ) is responsible for devel-
oping integrated water, air, waste management, and energy plans to protect Montana's
environmental resources. To comply with the Montana Water Quality Act and the
Federal Clean Water Act, an ArcView-based watershed data management system
called MontanaView was developed in 2000. The system was designed to meet the
specific information management needs of the state of Montana, focusing on water
resource management issues. The project goals were: (1) integrating extensive and
diverse data into one system, covering demographic, land-use and land-cover, infra-
structure environmental, and natural resource information and (2) orienting programs
and organizations around watersheds as the primary unit for assessing and managing
resources.
These goals were accomplished by developing MontanaView, a PC-based appli-
cation that runs under Windows operating systems, and linked to distributed data-
bases over the Internet. The system provided online access to U.S. EPA mainframe
databases and United States Geological Survey (USGS) real time and historical
stream-flow data. For example, it provided access to EPA’s national water quality
database, STORET, to identify water quality monitoring stations that met user-
defined requirements for selected parameters. It could then go to the Montana USGS
Internet site (montana.usgs.gov) and import stream-flow data for the user-specified
Application GIS-based watershed data management system
GIS software ArcView
Organization Montana Department of Environmental Quality
2097_C006.fm Page 127 Monday, December 6, 2004 6:02 PM
Copyright © 2005 by Taylor & Francis
station. The maps generated by MontanaView proved to be excellent visual aids
during public meetings (Samuels et al., 2000).
USEFUL WEB SITES
CHAPTER SUMMARY
This chapter provided information on the GIS applications for serving water,
wastewater, and stormwater system maps on the Internet. The Internet is the fastest
growing and most efficient technology for distributing GIS data. Internet-based
mapping applications are changing the way people use and manage geographic
information in the water industry. The Internet can be used to both obtain and
distribute GIS data. Two types of software are required for creating Internet GIS
Web sites: client-side software and server-side software. Many cities and counties
in the U.S. have developed Internet GIS sites for sharing their GIS data and maps.
CHAPTER QUESTIONS
1. What is Internet GIS?
2. What are the applications of Internet GIS technology?
3. What kind of software is required for developing Internet GIS applications?
4. Search the Internet to describe three Internet GIS Web sites that provide water,
wastewater, and stormwater system maps on the Internet.
Dublin, Ohio, Internet GIS Web site gis.dublin.oh.us
Johnson County, Kansas, Internet GIS
Web site
aims.jocogov.org
Town of Blacksburg, Virginia, Internet GIS
Web site
arcims2.webgis.net/blacksburg/default.asp
2097_C006.fm Page 128 Monday, December 6, 2004 6:02 PM
Copyright © 2005 by Taylor & Francis