Heat Transfer Theoretical Analysis Experimental Investigations and Industrial Systems part 6 ppt
Bạn đang xem bản rút gọn của tài liệu. Xem và tải ngay bản đầy đủ của tài liệu tại đây (3.76 MB, 40 trang )
Heat Transfer - Theoretical Analysis, Experimental Investigations and Industrial Systems
190
of μs, the calculated values of the minimum velocity of the bubble wall, the peak
temperature and pressure are excellent agreement with the observed ones for the
sonoluminescing xenon bubble in sulfuric acid solutions (Kim et al., 2006). Furthermore, the
calculated bubble radius-time curve displays alternating pattern of bubble motion which is
apparently due to the heat transfer for the sonoluminescing xenon bubble, as observed in
experiment (Hopkins et al., 2005). The bubble dynamics model presented in this study has
also revealed that the sonoluminescence for an air bubble in water solution occurs due to the
increase and subsequent decrease in the bubble wall acceleration which induces pressure
non-uniformity for the gas inside the bubble during ns range near the collapse point (Kwak
and Na, 1996). The calculated sonoluminescence pulse width from the instantaneous gas
temperature for air bubble is in good agreement with the observed value of 150 ps (Byun et
al., 2005). Due to enormous heat transfer the gas temperature inside the sonoluminescing air
bubble at the collapse point is about 20000~40000 K instead of 10
7
K (Moss et al., 1994)
which is estimated to be in the adiabatic case. Molecular dynamics (MD) simulation results
for the sonoluminescing xenon bubble were compared to the theoretical predictions and
observed results (Kim et al., 2007, Kim et al., 2008).
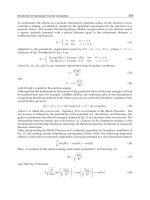
2. Temperature profile in thermal boundary layer
A sketch of the bubble model employed is given in Fig.1, which shows a spherical bubble in
liquid temperature T
∞
and liquid pressure P
∞
. Heat transfer is assumed to occur through the
thermal boundary layer of thickness δ(t). The temperature profile in this layer is assumed to
be quadratic (Theofanous et al., 1969).
2
-
(1 - )
-
bl
TT
TT
ξ
∞
∞
= (1)
where T
bl
is the temperature at the bubble wall and T
∞
is the ambient temperature in Eq.(1).
The parameter ξ in Eq.(1) is given as ξ = ( r - R
b
)/δ and R
b
(t) is the instantaneous bubble
radius. Such a second order curve satisfies the following boundary conditions:
(,) , ( , )
bbl b
TRtT TR tT
δ
∞
=
+= and 0
b
rR
T
r
δ
=+
∂
⎛⎞
=
⎜⎟
∂
⎝⎠
(2)
The heat transfer conducted through this thermal boundary layer whose thickness is δ(t) can
be obtained by applying the Fourier law at the bubble wall, or
2
8(-)
-
b
bl bl
blb
rR
Rk T T
T
QkA
r
π
δ
∞
=
∂
⎛⎞
==
⎜⎟
∂
⎝⎠
(3)
where A
b
is the surface area of bubble and k
1
is the conductivity of liquid. The bubble model
including such liquid phase zone has been verified experimentally (Suslick et al., 1986).
3. Conservation equations for the gas inside bubble
The hydrodynamics related to studying the bubble behavior in liquid involves solving the
Navier-Stokes equations for the gas inside the bubble and the liquid adjacent the bubble
Nonlinear Bubble Behavior due to Heat Transfer
191
Fig. 1. A physical model with thermal boundary layer for a spherical bubble in liquid.
wall. Especially the knowledge of the behavior of gas or vapor inside evolving bubble is a
key element to understand the bubble dynamics. Firstly, various conservation laws for the
gas are considered to obtain the density, pressure and temperature distributions for the gas
inside the bubble.
3.1 Mass conservation
The mass conservation equation for the gas inside a bubble is given by
0
g
gg
D
u
Dt
ρ
ρ
+
∇⋅ =
K
(4)
where ρ
g
and u
g
are gas density and velocity, respectively. With decomposition of the gas
density in spherical symmetry as ρ
0
(t) + ρ
r
(r,t), the continuity equation becomes
0
or
og rg
dD
uu
dt Dt
ρρ
ρρ
⎡⎤
+
∇⋅ + + ∇⋅ =
⎢⎥
⎣⎦
K
K
(5)
where ρ
0
is the gas density at the bubble center and ρ
r
is the radial dependent gas density
inside the bubble and the notation of the total derivative used here is D/Dt = ∂/t + u(∂/∂r).
The rate of change of the density of a material particle can be represented by the rate of
volume expansion of that particle in the limit V→ 0 (Panton, 1996). Or
b
g
b
R
ur
R
=
(6)
With this velocity profile, the density profile can be obtained as
g
or
ρ
ρρ
=
+ (7-1)
3
0b
ρ R =const. (7-2)
Heat Transfer - Theoretical Analysis, Experimental Investigations and Industrial Systems
192
25
rb
ρ =ar /R . (7-3)
The constant, a is related to the gas mass inside a bubble (Kwak and Yang, 1995).
3.2 Momentum conservation
The momentum equation for the gas when neglecting viscous forces may be written as
-
g
g
b
Du
P
Dt
ρ
=
∇
K
(8)
The gas pressure P
b
inside bubble can be obtained from this equation by using the velocity
and density profiles given in Eq. (6) and (7), respectively. Or
2
00
11
-
22
b
bb r
b
R
PP r
R
ρρ
⎛⎞
=+
⎜⎟
⎝⎠
(9)
Note that the linear velocity profile showing the spatial inhomogeneities inside the bubble is
a crucial ansatze for the homologous motion of a spherical object, which is interestingly
encountered in another energy focusing mechanism of gravitational collapse (Jun and
Kwak, 2000). The quadratic pressure profile given in Eq. (9), was verified recently by
comparison with direct numerical simulations (Lin et al., 2002).
3.3 Energy conservation
Assuming that the internal energy for the gas inside a bubble is a function of gas
temperature only as de = C
v,b
dT
b,
the energy equation for the gas inside the bubble may be
written as
,
-
b
ggvb bg
DT
De
CPuq
Dt Dt
ρρ
=
=∇⋅−∇⋅
K
K
(10-1)
where Cv,b is the constant-volume specific heat and q is heat flux. The viscous dissipation
term in the internal energy equation also vanishes because of the linear velocity profile.
Since the solutions given in Eqs. (6), (7) and (9) also satisfy the kinetic energy equation, only
the internal energy equation given in Eq. (10-1) needs to be solved. On the other hand,
Prosperetti et al.(1988) solved the internal energy equation combined with the mass and
momentum equation numerically to consider heat transport inside the bubble using a
simple assumption. However, heat transfer through the liquid layer, which is very
important in obtaining the temperature at the bubble wall, was not considered in their
study.
Using the definition of enthalpy, the internal energy equation for the gas can also be written
as
gg,
bb
pb
DT DP
Dh
Cq
Dt Dt Dt
ρρ
=
=−∇⋅
K
(10-2)
where C
p,b
is the constant-pressure specific heat. Eliminating DT
b
/Dt from Eqs. (10-1) and
(10-2), one can obtain the following heat flow rate equation for the gas pressure inside the
bubble (Kwak et al., 1995, Kwak and Yang, 1995)
Nonlinear Bubble Behavior due to Heat Transfer
193
(1)
b
bg
DP
Pu q
Dt
γγ
=
−∇⋅−−∇⋅
K
K
(11)
Rewriting Eq. (11), we have
3
3
1
(1) ( )
b
b
b
D
qPR
Dt
R
γ
γ
γ
−∇⋅=−
K
(12)
which implies that the relation P
b
V
3γ
= const. holds if
∇
·q = 0 inside the bubble.
Substituting Eq. (12) into Eq. (10), and rearranging the equation, we have
3
1
ln
gg
bb b
bbb
R
PR DT
D
Dt T P T Dt
ρ
⎧⎫
⎛⎞
⎛⎞
⎪⎪
=−
⎜⎟
⎜⎟
⎨⎬
⎜⎟
⎜⎟
⎪⎪
⎝⎠
⎝⎠
⎩⎭
(13)
where R
g
is gas constant. If the equation of state for ideal gas, P
bo
= ρ
g
R
g
T
bo
holds at the
bubble center, LHS in Eq. (13) vanishes. The result can be written as
3
/.
bo b bo
PR T const= , (14)
which is consistent with Eq.( 7-2).
Note that the time rate change of the pressure at the bubble center can be written as with
help of Eqs. (3) and (11).
36(1)()
bo bo b l bl
bb
dP P dR k T T
dt R dt R
γγ
δ
∞
−−
=− − (15)
The time rate change of the temperature at the bubble center can be obtained with help of
Eq. (14). That is
3( 1) 6( 1) ( )
bo bo b l bl
bbbo
dT T dR k T T
dt R dt R P
γγ
δ
∞
−−−
=− − (16)
4. Temperature profiles inside the bubble
4.1 Uniform pressure profile inside the bubble
A temperature profile can be obtained by solving Eq. (12) with the Fourier law by assuming
that the conductivity of gas inside the bubble is constant and the gas pressure inside the
bubble is uniform (Kwak et al., 1995). That is
2
3()
6( 1)
bb
bbbo
gb
dP R
r
TPTt
kdt R
γ
γ
⎡⎤
=++
⎢⎥
−
⎢⎥
⎣⎦
(17)
where k
g
heat conductivity of gas inside the bubble. The above equation can be written, with
help of Eq.(12), as follows:
2
()1 /(1)
bbo
b
r
TTT T
R
η
∞
∞
⎡⎤
⎛⎞
⎢⎥
=− − ++
⎜⎟
⎜⎟
⎢⎥
⎝⎠
⎣
⎦
(18)
Heat Transfer - Theoretical Analysis, Experimental Investigations and Industrial Systems
194
where
g
lb
k
kR
δ
η
= .
The temperature at the bubble wall can be obtained easily from the above equation. That is
(
)
(
)
/1
bl bo
TTT
η
η
∞
=
++
(19)
The above relation shows how the bubble wall temperature is related to the temperature at
the bubble center and the ambient temperature. Assigning an arbitrary value on T
bl
is not
permitted as a boundary condition.
An uniform temperature distribution also occurs when there is no heat flux inside the
bubble. This can be achieved when the bubble oscillating period is much longer than the
characteristic time of heat diffusion so that the gas distribution function depends only on
thermal velocity (thermal equilibrium case). In this limit, we may obtain the gas temperature
inside the bubble by taking the value of the gas conductivity as infinity in Eq. (19). That is
T
b
=T
bl
=T
bo
, which validates the bubble dynamics formulation with an assumption of
uniform vapor temperature inside the bubble (Kwak et al., 1995). The heat transfer through
the thermal boundary layer adjacent to the bubble wall determines the heat exchange
between the bubble and medium in this case.
However, the temperature gradient inside the bubble should exist, provided that
characteristic time of bubble evolution is much shorter than the relaxation time of the
vibration motion of the gases inside the bubble, which is of the order on 10
-6
s for high gas
temperature. If the temperature gradient inside the bubble exists inside the bubble, the heat
transfer through the bubble wall depends on both the properties of the gas inside the bubble
and the liquid in the thermal boundary layer. In this case one may rewrite Eq.(3), with help
of Eq.(19). That is
()
2( )
/1
bg bo
b
b
Ak T T
Q
R
η
∞
−
=
−+
(20)
As long as the value of
η is finite, there exists a temperature distribution inside the bubble.
For a very small value of
η, the heat flow rate from the bubble is solely determined from the
temperature gradient of the gas inside the bubble (Prosperetti et al., 1988).
Assume the thermal conductivity for the gas inside the bubble is linearly dependent on the
gas temperature such as
gb
kATB
=
+ (21)
For air A=5.528x10
-5
W/mK
2
and B=1.165x10
-2
W/mK (Prosperetti et al., 1988) and for xenon,
A=1.031×10
-5
W/mK
2
and B=3.916×10
-3
W/mK were used. With this approximation and
Fourier law, one can obtain the following temperature profile by solving Eq. (12) with
uniform pressure approximation, which is quite good until the acceleration and deceleration
of the bubble wall is not significant. Thus
22'
bb0bl
b
() 1 (1 ) 2 ( )( )/
BAAr
Tr T T T
ABBR
η
∞
⎡
⎤
=⋅−+ + − −
⎢
⎥
⎢
⎥
⎣
⎦
(22)
Nonlinear Bubble Behavior due to Heat Transfer
195
where
'
1
lb
B
kR
δ
η
= .
The temperature distribution is given in Eq. (22) is valid until the characteristic time of
bubble evolution is of the order of the relaxation time for vibrational motion of the
molecules ( Vincenti and Kruger, 1965) and/or is much less than the relaxation time of the
translational motion of the molecules (Batchelor, 1967). The temperature at the bubble wall
T
bl
can also be obtained with the thermal boundary conditions given in Eq.(2). That is
2
2
b
'' '
11
(1 ) 1 2
2
lbobo
BB AAT
TTT
AA BB
ηη η
∞
⎛⎞ ⎛ ⎞
=− + + + + + +
⎜⎟ ⎜ ⎟
⎜⎟ ⎜ ⎟
⎝⎠ ⎝ ⎠
(23)
For constant gas conductivity limit, or A→0 and B→
k
g
the temperature distribution inside
the bubble, Eq. (22), reduces to Eq. (18).
4.2 Non-uniform pressure profile
If the bubble wall acceleration has significant value, for example, the value exceed 10
12
m/s
2
,
the second term is comparable to the first term in RHS of Eq.(9). This occurs for the
sonoluminescing air bubble during few nanoseconds of collapse phase. Taking into account
the bubble wall acceleration, the heat flow rate equation given in Eq. (12) may be rewritten
as with help of Eqs. (6), (7) and (9)
()
2
1
(1) 3 (31)
2
b
bo o r
bbb
dP
RRRR
q
Pr
dt R R R
γγρργ
⎡
⎤⎡ ⎤
−∇⋅=− + + + − +
⎢
⎥⎢ ⎥
⎢
⎥⎢ ⎥
⎣
⎦⎣ ⎦
K
(24)
Since the temperature rise due to the bubble wall acceleration is transient phenomenon
occurred during few nanoseconds around the collapse point of the bubble, the above
equation may be decomposed into
(1) 3
b
obo
b
dP
R
qP
dt R
γγ
⎡
⎤
−∇⋅ =− +
⎢
⎥
⎢
⎥
⎣
⎦
K
(25-1)
and
()
2
1
(1)( ) (31)
2
oor
bb
RR R
r
RR
γρργ
⎡
⎤
−∇⋅ − = + − +
⎢
⎥
⎢
⎥
⎣
⎦
KK
(25-2)
Abrupt temperature rise and subsequent rapid quenching due to the bubble wall
acceleration and the increase and decrease in the acceleration may be treated in another time
scale (Davidson, 1972), different from the bubble wall motion. A solution of Eq.(25-2) with
no temperature gradient at the bubble center is given as
' 4
'
15
() (3 2) ()
21
40( 1)
bb b
bor
bb
g
RR R
Tr r Ct
RR
k
ρργ
γ
⎡⎤
⎛⎞
=− + − + +
⎢⎥
⎜⎟
−
⎝⎠
⎢⎥
⎣⎦
(26)
The coefficient C may be determined from a boundary condition k
g
dT
b
/dr=k
l
dT
l
/dr at the
wall where T
l
is the temperature distribution in the thermal boundary layer with different
Heat Transfer - Theoretical Analysis, Experimental Investigations and Industrial Systems
196
thickness δ'. Note that the boundary conditions employed for solving Eq. (25-1) and (25-2)
are the same at the bubble center. However different properties of the gas was employed at
the bubble wall so that the coefficient C(t) given in Eq. (26) is given as
'
2
'
155
( ) (3 2)
20( 1) 14 21
2
bb
b
bbb bb o rR o rR
l
g
R
Ct RRR RR
k
k
δ
γρρρρ
γ
==
⎡
⎤
⎛⎞⎛⎞
⎡⎤
⎢
⎥
=− − + + + +
⎜⎟⎜⎟
⎣⎦
−
⎢
⎥
⎝⎠⎝⎠
⎣
⎦
(27)
The temperature distribution from Eq. (22) with low thermal conductivity k
g
can be
regarded as background one because the duration of the thermal spike represented by Eq.
(26) is so short less than 500 ps. The gas conductivity at ultra high temperature k
g
’ may be
obtained from collision integrals (Boulos et al., 1994 ). The value of δ' may be chosen so that
proper bouncing motion results after the collapse and is about 0.1 μm. The final solution of
the heat transport equation can be represented by the superposition of the temperature
distributions caused by the uniform pressure and by the radial pressure variation induced
by the rapid change of the bubble wall acceleration, as can be seen in equation (28); that is,
() () '()
bb
Tr T r T r
=
+ (28)
5. Navier-stokes equation for the liquid adjacent to the bubble wall
5.1 Bubble wall motion
The mass and momentum equation for the liquid adjacent bubble wall provides the well-
known equation of motion for the bubble wall (Keller and Miksis, 1980), which is valid until
the bubble wall velocity reaches the speed of sound of the liquid. That is
2
31
111
23
bb b bb b
bb Bs
bbbbb
UdU U U R R
d
RU PPtP
Cdt C CCdt C
ρ
∞
∞
⎡
⎤
⎛⎞ ⎛ ⎞⎛ ⎞ ⎛⎞
−+−=++ −+−
⎢
⎥
⎜⎟ ⎜ ⎟⎜ ⎟ ⎜⎟
⎜⎟ ⎜ ⎟⎜ ⎟ ⎜⎟
⎢
⎥
⎝⎠ ⎝ ⎠⎝ ⎠ ⎝⎠
⎣
⎦
(29)
The liquid pressure on the external side of the bubble wall
B
P is related to the pressure
inside the bubble wall
b
P according to:
2
4
b
Bb
bb
U
PP
RR
σ
μ
=− − (30)
The driving pressure of the sound field
s
P
may be represented by a sinusoidal function such
as
sin
sA
PP t
ω
=
− (31)
where
2
d
f
ω
π
= .
The Keller-Miksis equation reduces to the well known Rayleigh equation which is valid at
the incompressible limit without forcing field (Batchelor, 1967). That is
()
2
31
2
b
bbB
dU
RUPP
dt
ρ
∞
∞
+= − (32)
Nonlinear Bubble Behavior due to Heat Transfer
197
5.2 Thermal boundary layer thickness
The mass and energy equation for the liquid layer adjacent to the bubble wall with the
temperature distribution given in Eq. (1) provides a time dependent first order equation for
the thermal boundary layer thickness (Kwak et al., 1995, Kwak and Yang, 1995). It is given
by
22
2
361
12
10 2
11 1
1
210
b
bb bb
bl
bbbl
dR
d
R R dt R R dt
dT
RRTTdt
δδδαδδ
δ
δδ
δ
∞
⎡⎤⎡⎤
⎛⎞ ⎛⎞
⎢⎥⎢⎥
++ =− +
⎜⎟ ⎜⎟
⎜⎟ ⎜⎟
⎢⎥⎢⎥
⎝⎠ ⎝⎠
⎣⎦⎣⎦
⎡⎤
⎛⎞
⎢⎥
−+ +
⎜⎟
⎜⎟
⎢⎥
−
⎝⎠
⎣⎦
(33)
The above equation which was discussed in detail by Kwak and Yang (1995) determines the
heat flow rate through the bubble wall. The instantaneous bubble radius, bubble wall
velocity and acceleration, and thermal boundary thickness obtained from Eqs. (29) and (33)
provide the density, velocity, pressure and temperature profiles for the gas inside the bubble
with no further assumptions. The gas temperature and pressure at the bubble center can be
obtained from Eqs. (15) and (16), respectively.
The entropy generation rate in this kind of oscillating bubble-liquid system, which induces
lost work for bubble motion needs to be calculated by allowing for the rate change of
entropy for the gas inside the bubble and the net entropy flow out of the bubble as results of
heat exchange (Bejan, 1988). That is
bb
g
DS Q
S
Dt T
∞
=−
(34)
6. Calculated examples
6.1 An evolving bubble formed from the fully evaporated droplet at its superheat limit
- Uniform temperature and pressure distributions for the vapor inside the bubble
It is well known that one may heat a liquid held at 1 atm to a temperature far above its
boiling point without occurrence of boiling. The maximum temperature limit at which the
liquid boils explosively is called the superheat limit of liquid (Blander and Katz, 1975). It has
been verified experimentally that, when the temperature of a liquid droplet in an immiscible
medium reaches its superheat limit at 1 atm, the droplet vaporizes explosively without
volume expansion and the fully evaporated droplet becomes a bubble (Shepherd and
Sturtevant, 1982). Since the internal pressure of the fully evaporated droplet is very large
(Kwak and Panton, 1985, Kwak and Lee, 1991), the droplet expands spontaneously. At the
initial stage of this process, the fully evaporated droplet expands linearly with time.
However, its linear growing fashion slows down near the point where the nonlinear
growing starts. The pressure inside the bubble may be taken as the vapor pressure given
temperature with saturated vapor volume at the start of the nonlinear growing. Since the
vapor pressure inside the bubble is still much greater than the ambient pressure, the bubble
expands rapidly so that it overshoots the mechanical equilibrium condition and its size
oscillates. In this case, since the temperature of the vapor inside the bubble is so low that
Heat Transfer - Theoretical Analysis, Experimental Investigations and Industrial Systems
198
vibrational motion of the vapor is not excited and the characteristic time of bubble evolution
of ms range is much longer than the relaxation time of the translational motion of vapor
molecules, uniform temperature and pressure distribution for the vapor molecules inside
the bubble are achieved (Kwak et al., 1995).
The calculated pressure wave signal from the evolving butane bubble in ethylene glycol at
the ambient pressure of 1 atm and at a temperature of 378 K is shown in Fig. 2, together with
the observed data (Shepherd and Sturtevant, 1982). In this case heat transfer occurs through
the thermal boundary layer. Thermal damping due to finite heat transfer (Moody, 1984) is
barely seen in this Figure. In Fig. 3(a), the time rate change of the vapor temperature during
the bubble evolution is shown. As can be seen in this Figure,the bubble evolution is neither
isothermal nor adiabatic. In Fig. 3(b), the entropy generation rate due to finite heat transfer
for the evolving butane bubble is shown. As expected, the entropy generation during the
bubble oscillation is always positive. More clear thermal damping can be observed from the
far-field pressure signal of the evaporating droplet and evolving bubble formed from a
cyclohexane droplet at its droplet, 492.0 K (Park et al., 2005) as shown in Fig.4. After first
two volume oscillations, the original bubble has begun to disintegrate into a cloud of
bubbles so that the far-field pressure signal becomes considerably smaller compared to the
calculation results.
The far field pressure signal from the evolving bubble at a distance r
d
from the bubble center
can be written in terms of the volume acceleration of the bubble (Ross, 1976). Or
22
() (2 )
4
b
bb b b
dd
V
p
tRRRR
rr
ρ
ρ
π
∞
∞
== +
(35)
For the uniform temperature and pressure distribution, the bubble behavior can be
calculated from Eqs. (15), (16), (19), (32) and (33) with appropriate initial conditions.
Time (ms)
0.0 0.5 1.0 1.5 2.0
Pressure wave signal (bar)
-0.2
0.0
0.2
0.4
0.6
Calculated pressure signal
Adapted from experimental results
of Shepherd and Sturtevant
Time (ms)
0.0 0.2 0.4 0.6 0.8 1.0 1.2 1.4 1.6 1.8 2.0
Radius (mm)
1.0
1.5
2.0
2.5
3.0
3.5
4.0
(a) (b)
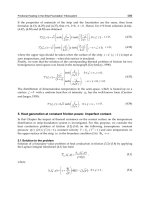
Fig. 2. Pressure wave signal from a oscillating butane bubble in ethylene glycol at 1.013 bar
(a) and radius-time curve for the butane bubble (b) with the observed results (full circles).
Nonlinear Bubble Behavior due to Heat Transfer
199
Time (ms)
0.00.51.01.52.0
Temperature (K)
360
380
400
420
440
Time (ms)
0.00.51.01.52.0
Entropy generation rate (J/Ksec)
0.00
0.05
0.10
0.15
0.20
0.25
0.30
(a) (b)
Fig. 3. Time dependence of the temperature inside the bubble (a) and time dependent
entropy generation rate for the butane bubble (b) shown in Fig. 2.
Time (ms)
0 5 10 15 20
Pressure (bar)
-0.2
-0.1
0.0
0.1
0.2
0.3
0.4
0.5
Observed value
Calculated result
Fig. 4. Far-field pressure signal from an evolving bubble formed from a fully evaporated
cyclohexane droplet at its superheat limit, 492.0 K in glycerine.
6.2 An air bubble oscillation under ultrasonic field Non-uniform temperature and
uniform pressure distribution for the gas inside bubble
If the gas temperature is above 2000 K, the vibrational modes of polyatomic molecules are
expected to be excited. Since the relaxation time of the vibrational motion is rather long (10
-6
s) compared with that of the translational motion, the perfect thermal equilibrium cannot be
achieved for the duration in which mechanical equilibrium prevails. Certainly the
temperature gradient for the gas inside bubble exists in this situation which is the case of an
air bubble of micro size oscillates under ultrasonic field of amplitude below 1.2 atm and
frequency of 26.5 kHz (Kwak and Yang, 1995).
Heat Transfer - Theoretical Analysis, Experimental Investigations and Industrial Systems
200
The calculated radius–time curves for the bubble with an equilibrium radius of 8.5 μm,
driven by the ultrasonic field with a frequency of 26.5 kHz and an amplitude of 1.075 atm
which is certainly below the sonoluminescence threshold is shown in Fig.5. As shown in
Table 1, the calculated values of the maximum radius and the period for each bouncing
motion are in good agreement with the observed one (Loefstedt et al., 1993) can be seen.
However, the bubble radius-time curve obtained by the Rayleigh equation with a polytropic
relation of P
b
V
b
1.4
=const. shows 10 number of bouncing motions rather than 7.
010203040
0
5
10
15
20
25
30
010203040
0
5
10
15
20
25
30
35
(a) (b)
Time (µm)
Time
(µm)
Radius (µm)
Radius
(µm)
Fig. 5. Theoretical radius-time curves for an air bubble of R
o
=8.5 μm at P
A
=1.075 atm and
f=26.5 kHz in water by our model (a) and by the Rayleigh-Plesset equation with polytropic
relation (b).
Also the magnitude of the maximum bubble radius at the first bounce is significantly less
than the observed one. The radius, the center temperature and pressure of the bubble at the
collapse point are 2.23 μm, 2354 K and 518 atm, respectively (Kwak and Yang, 1995). The
minimum bubble wall velocity at the bubble collapse point is about -111.5 m/s. In this case
it is better to use Eq. (23) to obtain the bubble wall temperature and Eq. (29) to obtain the
instantaneous bubble radius and velocity.
Maximum bubble size
(μm)
Corresponding period
(μs)
Bouncing
number
Measured value Calculated value Measured value Calculated value
1 19.9 20.0 3.56 3.62
2 15.6 16.2 2.43 2.76
3 13.0 13.6 2.24 2.24
4 11.1 12.1 2.06 2.07
5 10.4 10.5 1.87 1.90
6 9.7 9.5 1.87 1.82
Table. 1. Calculated and measured maximum bubble size and the corresponding period of
bouncing motion after the first bubble collapse for air bubble of R
0
= 8.5 μm at P
A
= 1.075
atm and f = 26.5 kHz.
Nonlinear Bubble Behavior due to Heat Transfer
201
6.3 Sonoluminescing xenon bubble in sulfuric acid solutions Non-uniform
temperature and almost uniform pressure distribution for the gas inside the bubble
Sonoluminecence (SL) phenomena associated with the catastrophic collapse of a gas bubble
oscillation under ultrasonic field (Gaitan et al., 1992) have been studied extensively during
last 20 years or so for their exotic energy focusing mechanism (Putterman and Weinger,
2000, Young, 2005). The SL from gas bubble in water is characterized by ten to hundred
picoseconds flash (Gompf et al., 1997, Hiller et al., 1998), the bubble wall acceleration
exceeding 10
12
m/s
2
(Kwak and Na, 1996, Wininger et al., 1997), and submicron bubble
radius at the collapse point (Weninger et al., 1997 ). On the other hand, the SL in sulfuric
acid solution revealed rather longer flash widths of ns (Jeon et al., 2008), mild wall
acceleration of 10
10
m/s
2
(Hopkins et al., 2005) and micron bubble radius at the collapse
point under similar conditions of ultrasonic field for the case of sonoluminescence in water.
The calculated radius-time curve along with observed results for a xenon bubble with R
o
=
15 μm , driven by the ultrasonic field with a frequency of 37.8 kHz and an amplitude of 1.5
atm in aqueous solution of sulfuric acid is shown in Fig. 6. With air data for the thermal
conductivity, the calculated radius-time curve which exactly mimics the alternating pattern
of for the observed result shows two different states of bubble motion. With xenon data for
the thermal conductivity, however, slight different pattern for the bubble motion was
obtained. These calculation results imply that the bubble behavior, consequently the
sonoluminescence phenomena depends crucially on the heat transfer in the gas medium as
(a) (b)
Fig. 6. Theoretical radius-time curve (a) along with observed one by Hopkins et al.(2005) for
xenon bubble of
0
R =15.0 μm at
A
P =1.50 atm and
d
f
=37.8 kHz in sulfuric acid solutions
and the curve calculated by polytropic relation (b).
Heat Transfer - Theoretical Analysis, Experimental Investigations and Industrial Systems
202
well as in the liquid layer and that the xenon bubble may contain a lot of air molecules. On
the other hand the Rayleigh-Plesset equation with a polytropic relation, a conventional
method used to predict the sonoluminescence phenomena cannot predict the two states of
bubble motion as shown in Fig. 6(b). The alternating pattern for the bubble motion may
happen due to the entropy generation by the finite heat transfer through the bubble wall,
which produces lost work: less entropy generation in one cycle having lower maximum
bubble radius provides more expansion work to the bubble next cycle, while larger
amplitude motion experiencing more entropy generation provides less expansion work to
the subsequent motion (Kim et al., 2006).
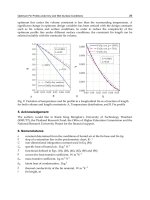
Fig. 7. Calculated bubble wall velocity (line) and acceleration (dash) near the collapse point
for the bubble shown in Fig. 6.
Figure 7 shows the time-dependent bubble wall velocity and the variation of the bubble wall
acceleration around the collapse point for the bubble shown in Fig. 6. The calculated
magnitude of the minimum velocity at the collapse point for the light emitting cycles is
about 115 m/s which is close to the observed velocity of 80 m/s. Whereas the maximum
bubble wall velocity for non-light-emitting cycle is about 88 m/s, which is also close to the
observed results of 60 m/s (Hopkins et al., 2005). However, the magnitude of the minimum
velocity calculated by the Rayleigh-Plesset equation with the polytropic relation, which is
about 900 m/s, is much higher than the observed value.
Figure 8 shows the calculated time-dependent bubble center temperature and the temporal
emissive power with the average temperature for the light-emitting cycle of the bubble
shown in Fig.6. The peak temperature calculated at the bubble center is about 8200 K, which
is excellent agreement with the observed value of 6000~7000 K. In fact, the average
temperature at the collapse point is about 6000 K because considerable temperature drop
occurs at the bubble wall as shown in the insert. However, the pressure inside the bubble is
almost uniform as expected as shown in Fig. 8 (b).
Nonlinear Bubble Behavior due to Heat Transfer
203
(a) (b)
Fig. 8. Time dependent gas temperature at the bubble center and the corresponding total
blackbody emission (a) with the average temperature and the temperature and pressure
distributions at the collapse point for the bubble shown in Fig.6. The dotted curve in
(b) indicates the temperature distribution obtained by Prosperetti eat al.’s (1988) boundary
condition at the bubble wall.
6.4 Sonoluminescing air bubbles in water Non-uniform temperature and non-uniform
pressure distribution for the gas inside the bubble
When the bubble wall acceleration exceeds 10
12
m/s
2
, the pressure distribution for the gas
inside the bubble is no longer uniform, as clearly confirmed by Eq. (9). In fact, the SL was
observed for an air bubble in water or in sulfuric acid solution when the bubble wall
acceleration exceeds 10
12
m/s
2 (
(Kim et al., 2006).
Figure 9 shows the density, pressure and temperature distributions inside the bubble at 400
ps before the collapse. Certainly, uniform pressure approximation is no longer valid during
the collapsing phase for a sonoluminescing air bubble in water solution. Time dependent
bubble wall acceleration and the gas temperature at the bubble center are shown in Fig. 10.
As can be seen in this Figure, sudden increase and subsequent decrease in acceleration of
the bubble wall results in rapid quenching of the gas followed by the substantial
temperature rise up to 25000 K, which can be regarded as a thermal spike. Considerable
increase in the gas temperature due to the bubble wall acceleration can be seen clearly in
this Figure. The maximum bubble wall acceleration achieved near the bubble collapse point
is over 10
11
g (Kwak and Na, 1996), which is consistent with the observed value (Weininger
et al., 1997). With uniform pressure approximation, the maximum temperature achieved is
only 5800 K. On the other hand, the temperature of the gas inside the bubble goes to infinity
without heat loss to the environment, that is k
g
goes to zero. One may obtain the maximum
temperature up to 10
7
K if one uses k
g
= 0.01 W/mK, which indicates that heat transfer is
very important also in this case. The heat flux at the collapse point is as much as 10 GW/m
2
,
however, the heat flow rate is about 2 mW.
Heat Transfer - Theoretical Analysis, Experimental Investigations and Industrial Systems
204
The intense local heating and high pressure inside bubble and liquid adjacent to the bubble
wall from such collapse that it can give arise to unusual effects in chemical reactions
(Suslick, 1990), and the sonochemical process has been proven to be useful technique in
making specialty nanomaterials (Kim et al., 2009). Note that the estimated temperature and
pressure in the liquid zone around the collapsing bubble is about 1300 K and 1000 atm,
respectively (Kwak and Yang, 1995).
75 80 85 90 95 100 105 110 115
0
5
10
15
20
25
r/R
b
0.0 0.2 0.4 0.6 0.8 1.0
Pressure (bar) and Temp. (K)
inside bubble
0
5000
10000
15000
20000
25000
30000
Density inside bubble (kg/m
3
)
0
150
300
450
600
750
900
Pressure
Temperature
Density
Time (µm)
Bubble radius (µm)
(a) (b)
Fig. 9. Theoretical radius-time curve for an air bubble of
0
R =4.5 μm at
A
P =1.30 atm and
d
f
=26.5 kHz in water (a) and density , pressure and temperature distributions inside this
bubble at 400 ps prior to the collapse point.
97.20 97.21 97.21 97.21 97.22 97.22 97.23
Temperature (K)
-5000
0
5000
10000
15000
20000
25000
30000
Bubble wall acceleration
(
m/s
2
x 10
9
)
-500
0
500
1000
1500
2000
2500
3000
Gas temperature with
bubble wall
acceleration
Gas temperature with
bubble wall
acceleration
Bubble wall
acceleration
Time (µm)
Fig. 10. Time dependent bubble wall acceleration and gas temperature around the collapse
point for the case shown in Fig. 9.
Nonlinear Bubble Behavior due to Heat Transfer
205
7. Molecular dynamics simulation for sonoluminescing xenon bubble
In previous sections, the gas temperature inside the bubble depends crucially on the thermal
conductivity of gas inside the bubble as well as the thermal conductivity of liquids in the
thermal boundary layer. However, transport property values for the gas and liquid at the
extreme condition are not available. As a consequence of this fact, validation of theoretical
results was attempted through the MD simulation. The bubble radius was determined by
the pressure obtained from MD simulation using Keller-Miksis equation. The mass transfer
through the bubble wall, which does not affect the thermal properties at the collapse point
very much (Kim and Kwak, 2007) was not considered in this simulation.
7.1 Molecular dynamics simulation
The principles and procedures for molecular dynamics simulation are well documented in
standard text books (Haile, 1992, Rapaport, 1995). In this study, numerical integration of one
million hard spheres was done in order to count the impulsive collisions between molecules
moving by Newton’s second law. As is well known, the kinetic events driven by Newton’s
law can be described by the Vlasov equation or the collisionless Boltzmann equation (Krall
and Trivelpiece, 1973), which also yields the conservation equations for mass, momentum,
and internal energy. This fact implies that MD simulation of hard sphere molecules might
capture the physics related to SL phenomena. Furthermore, the soft parts of the potential are
not significant for high energy collisions which occur near the collapse point (Ruuth et al.,
2002).
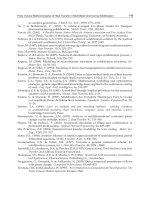
7.2 Collision between molecule and bubble wall
The molecules inside the bubble may hit the molecules at the layer of the gas-liquid
interface. In this simulation, the interface was assumed to be a hard wall, so that when a
molecule hits the bubble wall, it reflects from the wall, as shown in Fig. 11. When
considering the velocity of the bubble wall and assigning the thermal energy of the
temperature at the bubble wall T
bl
, the velocity of the reflected molecules
f
v
G
may be
obtained by the following equation for the heat bath boundary condition. In this case, the
direction of the reflected particle may be assigned randomly or specularly (Kim et al., 2007).
2
ˆ
/2 (3/2)( / )
fbi Bbl
UkTm−=vr
G
(36)
where U
b
is the instantaneous bubble wall velocity, m is the mass of a molecule and k
B
is the
Boltzmann constant.
For the adiabatic boundary condition, the particles were assumed to be reflected from the
wall with speed equal to the pre-collision speed in the local rest frame of the wall. The
direction of reflected particles was determined according to the reflection law at the planar
interface in this case. Explicitly, the velocity of the reflected particles is given by
ˆˆ ˆˆˆ
()()2()
f
bi i bi i bi i i
UU U−=−− −⋅
⎡
⎤
⎣
⎦
v rvr vrrr
G
GG
(37)
However, it has been found that neither the adiabatic nor the heat bath boundary condition
is appropriate for treating the collapsing process of sonoluminescing gas bubbles. The heat
Heat Transfer - Theoretical Analysis, Experimental Investigations and Industrial Systems
206
bath boundary condition means that heat flow exists at the bubble wall while adiabatic
means no heat flow at the boundary. The degree of the adiabatic change during the
collapsing process can be described by the following effective accomodation coefficient
(Yamamoto et al., 2006):
()/()
in out in bl
TT TT
α
=
−−. (38)
where T
in
is the temperature of the gas particle moving toward the bubble wall and T
out
is
the temperature of particle leaving the wall. Two limiting cases are α = 0 for adiabatic
boundary condition and α = 1 for the heat bath boundary condition.
For the adiabatic boundary case, a molecule does not lost its kinetic energy after a collision
made with a molecule at the bubble wall. On the other hand, for the heat bath boundary
case, a molecule having kinetic energy of T
i
lost its kinetic energy to become a molecule
having kinetic energy of T
bl
after collision. The value of α defined in Eq. (38) determines the
instantaneous gas temperature and pressure as well as the bubble radius and wall velocity
via the heat transfer through the bubble wall.
Fig. 11. A collision model between molecules and the bubble wall where v
i
and v
f
denote the
velocity if incident and reflected molecule, respectively.
7.3 Calculation procedures
In this study, a sonoluminescing gas bubble in sulfuric acid solution was considered. The
number of molecules in the sonoluminescing bubble may be obtained from the equation of
state for an ideal gas.
3
0
4
3
B
PRNkT
π
∞
∞
⎛⎞
=
⎜⎟
⎝⎠
(39)
where N is the number of molecules inside the bubble and P
∞
and T
∞
are the ambient pressure
and temperature, respectively. For a sonoluminescing xenon bubble with an equilibrium
radius of 0.7 μm in water at T
∞
=300 K and P
∞
=1 atm, the number of molecules occupying the
bubble is about 3.5×10
7
, which is difficult to handle with today’s computing power.
Nonlinear Bubble Behavior due to Heat Transfer
207
One may use a scaling transformation for the molecular volume such as V
g
N = const. where
V
g
is the volume of gas molecule and N is the number of molecules occupying the bubble
and that reduces the number of molecules that are handled in the MD simulation (Metten
and Lauterborn, 2000). With this scaling transformation, of course, the mass and the energy
of the system should be conserved so that mN = const. and TN = const.
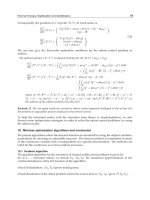
Fig. 12. Theoretical radius-time curves for a xenon bubble of R
o
= 15 μm at P
A
= 1.5 atm and
f
d
= 37.8 kHz in a sulfuric acid solution. Shaded area indicates the time span for MD
simulations.
In this study, we chose number of simulated molecules to be 10
6
, so the hard sphere
diameter of a molecule increases to 71.79 σ for the xenon bubble of 15 μm in radius, where σ
is the hard sphere diameter of the xenon molecule, taken to be 0.492 nm . The number 71.79
can be obtained from a relation σ
3
N=σ
s
3
N
s
with the number of simulated molecules of N
s
=10
6
and the total number of xenon molecules inside the bubble of equilibrium radius of 15
μm, N= 3.46x10
11
. The conversion factors for the bubble radius, pressure and temperature,
which were used in this MD simulation are σ, ε/ σ
3
and ε/ k
B
, respectively.
7.4 Calculation results and discussion
MD simulation for a collapsing xenon bubble with equilibrium radius of 15.0 μm, driven by
an ultrasound frequency of 37.8 kHz and amplitude of 1.5 atm in sulfuric acid solution, was
started at its maximum radius of 50.3 μm
. The xenon bubble was chosen in this study
because observed data for the bubble wall velocity and the peak pressure and temperature
at the collapse point have been reported (Hopkins et al., 2005), which is same as the case
shown in Fig. 6. One to three million particles were used for a scaled-down MD simulation
of the bubble that actually had 35 million molecules. The initial gas state with temperature
of 297.8 K and pressure of 3.64 × 10
-2
atm was obtained from theoretical results obtained
using a set of solutions of the Navier-Stokes equations for the gas inside the bubble with
consideration of heat transfer through the bubble wall (Kwak and Yang, 1995, Kwak and
Na, 1996). The cross-hatched region in Fig.12 indicates the time period of MD simulation for
the xenon bubble which shows an on/off luminescence pattern in sulfuric acid solution
(Hopkins et al., 2005).
Heat Transfer - Theoretical Analysis, Experimental Investigations and Industrial Systems
208
In Fig.13, the bubble radius-time curve(a) and the time-dependent bubble wall velocity (b)
near the collapse point, calculated by MD simulations with α =0.15 are plotted along with
the theoretical results. The time-dependent gas temperature at the bubble wall, used in the
MD simulation for employing the heat bath boundary condition, was calculated by theory.
A very similar trend between MD simulation and theoretical calculation in the bubble
radius-time curve and the time-dependent bubble wall velocity were obtained. It is noted
that the theoretical minimum velocity at the collapse point, which is about -115 m/s, is close
to the observed value of -80 m/s (Hopkins et al., 2005). The calculated value of the
minimum velocity by MD is about -130 m/s. The best agreement between the MD
simulation and the theoretical results was obtained with a value of α =0.15 among the trial
of α values, 0.1, 0.15, 0.3 and 0.5. The minimum radius of the at the collapse point for the
xenon bubble is about 4.56 μm so that the packing fraction at the point is about 0.058.
(a) (b)
Fig. 13. Calculated radius–time curves (a) and time-dependent bubble wall velocity (b)
obtained by MD simulation with α =0.15 and theory for the bubble shown in Fig. 12.
The time-dependent gas temperature and pressure inside the bubble around the collapse
point, which were obtained by MD simulation with α =0.15 are shown in Fig.14. The peak
temperature and pressure estimated by MD simulation are about 7,500 K and 1,260 atm,
respectively, and are very close to the theoretically predicted values of 8,200 K and 1,010
atm, respectively. The MD simulation results shown in Figs.13 and 14 indicate that the
collapsing process of a sonoluminescing micron bubble undergoes an almost adiabatic
change although a large amount of heat transfer through the bubble wall occurs. At the
moment of collapse, the heat flux at the bubble wall is much as 0.6 GW/m
2
. A quite different
collapsing process was obtained from the MD simulation with the heat bath boundary
condition (α =1.0) (Kim et al., 2007): the compression was started very slowly at first and the
final stage occurs very rapidly so that the estimated full width at half maximum (FWHM) of
the luminescence pulse is about 5 ns, which is quite less than the value of the theoretical
estimate of 20 ns (Kim et al., 2006).
Once the time dependent temperature for the gas inside the bubble around the collapse
point, the FWHM of the light pulse can be estimated from the temperature profile with
assumption of mechanism of the light emission (Kwak and Na, 1996, 1997). In Fig.15, the
Nonlinear Bubble Behavior due to Heat Transfer
209
(a) (b)
Fig. 14. Time-dependent center pressure (a) and temperature (b) obtained by MD simulation
with α =0.15 and theory near the collapse point for the bubble shown in Fig. 12.
(a) (b)
(c) (d)
Fig. 15. Gas density(a), velocity(b), pressure(c), and temperature(d) distributions near the
bubble collapse point obtained by MD simulation for the bubble shown in Fig.2 before 2.5 ns
(— • — •), at (—) , and after 2.5 ns (•••• ) the collapse.
Heat Transfer - Theoretical Analysis, Experimental Investigations and Industrial Systems
210
MD simulation results with α =0.15 for distribution of gas density(a), velocity(b),
pressure(c), and temperature(d) are plotted before and at the collapse point for the bubble
shown in Fig.12. The gas density increases radially in both compression and expansion
phases, as predicted by theory. The magnitude of the gas velocity increases radially and has
its maximum value at the bubble wall and a uniform null value at the collapse point, which
can be predicted by the linear velocity profile obtained theoretically. The pressure has an
almost uniform distribution before collapse. The temperature shows a quadratic profile with
its minimum value near the bubble wall because of heat transfer, which can also be
predicted by theory (Kwak and Yang, 1995, Kwak and Na, 1996, Kim et al., 2006).
8. Conclusions
A bubble dynamics model with consideration of heat transfer inside the bubble as well as in
the thermal boundary layer of liquid adjacent to the bubble wall was discussed. Thermal
damping due to finite heat transfer turns out to be very important factor for the evolving
bubble formed from a fully evaporated droplet at its superheat limit and for the
sonoluminescing xenon bubble showing two states of bubble motion in sulfuric acid
solutions. Molecular dynamics simulation has been done to validate our theoretical model of
bubble dynamics. In conclusion, the nonlinear behavior of an ultrasonically driven bubble
and the sonoluminescence characteristics from the bubble in sulfuric acid solutions have
been found to be correctly predicted by a set of solutions of the Navier-Stokes equations for
the gas inside the bubble with considering heat transfer through the bubble wall.
9. References
Batchelor, G.K. (1967). An Introduction to Fluid Dynamics, Cambridge University Press,
London.
Barber, B.P. & Putterman, S.J., Light scattering measurements of the repetitive supersonic
implosion of a sonoluminescing bubble, Phys. Rev. Lett. Vol. 69, 3839, (1992).
Bejan, A. (1988). Advanced Engineering Thermodynamics, John Wiley & Sons, New York.
Blander , M. & Katz, J. L. (1975). Bubble nucleation in liquids, AIChE J. Vol. 21, No. 5, pp.833-
848.
Boulos, M.I., Fauchais, P. & Pfender, E. (1994). Thermal Plasma Vol.1 , Plenum Press, New
York.
Byun,K., Kim, K.Y. & Kwak, H. (2005). Sonoluminescence characteristics from micron and
submicron bubble, J. Korean Phys. Soc. Vol. 47, No. 6, pp.1010-1022.
Davidson, R.C. (1972). Methods in Nonlinear Plasma Theory, Academic Press, New York.
Gaitan, K.F., Crum, L.A., Church, C.C. & Roy, R.A.( 1992). Sonoluminescence and bubble
dynamics for a single, stable, cavitation bubble, J. Acoust. Soc. Am., Vol.91, pp.3166-
3183.
Gompf, B., Guenter, R., Nick, G., Pecha, R. & Eisenmenger, W. (1997). Resolving
sonoluminescence pulse width with time-correlated single photon counting, Phys.
Rev. Lett., Vol. 79, pp. 1405-1407.
Haile , M. (1992). Molecular Dynamics Simulation ,John Wiley & Sons.
Hiller, R., Putterman, S.J. & Wininger, K.R. (1998). Time resolving spectra of
sonoluminescence, Phys. Rev. Lett. Vol.80, pp. 1090-1093.
Nonlinear Bubble Behavior due to Heat Transfer
211
Hopkins, S.D., Putterman, S.J., Kappus, B.A., Suslick, K.S. & Camara, C.G. (2005). Dynamics
of a sonoluminescing bubble in sulfuric acid, Phys. Rev. Lett. Vol.95, paper #
254301.
Jeon, J., Lim, C. & Kwak, H. (2008). Measurement of pulse width from sonoluminescing gas
bubble in sulfuric acid solution, J. Phys. Soc. Jpn, Vol. 77, paper # 033703.
Jun, J. & Kwak, H. (2000). Gravitational collapse of Newtonian stars, Int. J. Mod. Phys. D,
Vol.9, pp.35-42.
Keller, J.B. & Miksis, M. (1980). Bubble oscillations of large amplitude, J. Acoust. Soc. Am.,
Vol.68, pp.628-633.
Kim, H., Kang K. & Kwak, H. (2009). Preparation of supported Ni catalysts with a core/shell
structure and their catalytic tests of partical oxidation of methane, Int. J. Hydrogen
Energy, Vol. 34, pp. 3351-3359.
Kim, K., Byun, B. & Kwak, H. (2006). Characteristics of sonoluminescing bubbles in aqueous
solutions of sulfuric acid, J. Phys. Soc. Jpn., Vol. 75, paper # 114705.
Kim, K. & Kwak, H. (2007). Predictions of bubble behavior in sulfuric acid solutions by a set
of solutions of Navier-Stokes equations, Chem Eng. Sci., Vol. 62, pp. 2880-2889.
Kim, K., Kwak, H. & Kim, J.H. (2007). Molecular dynamics simulation of collapsing phase
for a sonoluminescing gas bubble in sulfuric acid solutions : A comparative study
with theoretical results, J. Phys. Soc. Jpn. Vol.76, 024301.
Kim, K.Y., Lim, C., Kwak, H. & Kim J.H. (2008). Validation of molecular dynamic simulation
for a collapsing process of sonoluminescing gas bubble, Mol. Phys., Vol. 106, No. 8,
pp. 967-975.
Krall, N.A. &Trivelpiece, A.W.(1973). Principles of Plasma Physics ,McGraw-Hill, New York.
Kwak, H. & Lee, S. (1991). Homogeneous bubble nucleation predicted by molecular
interaction model, ASME J. Heat Trans. Vol. 113, pp. 714-721.
Kwak, H. & Na, J. ( 1996). Hydrodynamic solutions for a sonoluminescing gas bubble, Phys.
Rev. Lett., Vol.77, pp.4454-4457.
Kwak, H. & Na, J. (1997). Physical processes for single bubble sonoluminescence, J. Phys.
Soc, Jap. Vol.66, pp.3074-3083.
Kwak, H., Oh, S. & Park, C. (1995). Bubble dynamics on the evolving bubble formed from
the droplet at the superheat limit, Int. J. Heat Mass Transfer, Vol.38, pp.1707-1718.
Kwak, H. & Panton, R.L. (1985). Tensile strength of simple liquids predicted by a model of
molecular interactions, J. Phys. D: Appl. Phys., Vol. 18, pp.647-659.
Kwak, H. & Yang,H. (1995). An aspect of sonoluminescence from hydrodynamic theory, J.
Phys. Soc. Jpn. Vol. 64, 1980-1992.
Lauterborn, W. (1976). Numerical investigation of nonlinear oscillation of gas bubbles in
liquids, J. Acoust. Soc. Am., Vol. 99, pp. 283-293.
Lin, H., Storey, B.D. & Szeri, A.J.( 2002). Inertially driven inhomogenieties in violently
collapsing bubbles: the validity of the Rayleigh-Pessset equation, J. Fluid Mech.,
Vol.452, pp.145-162.
Loefstedt, R., Barber, B.P. & Putterman, S.J. (1993). Toward a hydrodynamic theory of
sonoluminescence, Phys. Fluids, Vol. A5, pp. 2911-2928.
Metten, B. & Lauterborn, W. (2000). In Nonlinear Acoustics at the Turn of the Millennium:
ISNA 15, 15th International Symposium on Nonlinear Acoustics edited by W.
Lauterborn and T. Kurz, AIP Conf. Proc. No. 524, pp. 429-432.
Heat Transfer - Theoretical Analysis, Experimental Investigations and Industrial Systems
212
Moody, F.J. (1984). Second law thinking-example application in reactor and containment
technology, In Second Law Aspects of Thermal Design (Edited by A. Bejan and R.C.
Reid) Vol. HTD-33, pp. 1-9. ASME, New York.
Moss,W.C., Clarke, D.B., White, J.W. & Young, D.A.(1994). Hydrodynamic simulations of
bubble collapse and picosecond sonoluminescence, Phys. Fluids, Vol.6, No. 9, pp.
2979-2985.
Na, J., Byun, G. & Kwak, H. (2003) Diffusive stability for sonoluminescing gas bubble, J. Kor.
Phys. Soc. Vol. 42,pp.143-152.
Panton, R.L. (1996). Incompressible Flow, John Wiley & Sons, 2
nd
Edition, New York.
Park, H., Byun, K. & Kwak, H. (2005). Explosive boiling of liquid droplets at their superheat
limits, Chem. Eng. Sci., Vol. 60, pp. 1809-1821.
Prosperetti, A., Crum, L. A. & Commander, K. W. (1988). Nonlinear bubble dynamics, J.
Acoust. Soc. Am., Vol.88, pp.1061-1077.
Putterman, S.J. & Weininger, K.R. (2000). Sonoluminescence: How bubbles turn sound into
light. Annual Review of Fluid Mech., Vol. 32, pp. 445-476.
Rapaport,D.C.(1995). The Art of Molecular Dynamics Simulation, Cambridge University Press,
London.
Ross, D. (1976). Mechanics of Underwater Noise, Pergamon Press, Oxford.
Ruuth, S.J., Putterman, S. & Merriman, B. (2002). Molecular dynamics simulation of the
response of a gas to a spherical piston: Implications for sonoluminescence, Phys.
Rev. E, Vol. 66, 036310.
Shepherd, J.E. & Sturtevant, B. (1982). Rapid evaporation at the superheat limit, J. Fluid
Mech., Vol. 121, pp. 379-402.
Suslick, K.S. (1990). Sonochemistry, Science, Vol. 247, pp. 1439-1445.
Suslick, K.S., Hammerton, D.A. & Cline, R.E. (1986). The sonochemical hot spot, Am. Chem.
Soc., Vol. 108, pp. 5641-5642.
Theofanous, T., Biasi, L. & Isbin, H.S.(1969). A theoretical study on bubble growth in
constant and time-dependant pressure fields, Chem. Eng. Sci., Vol.24, pp.885-897.
Vincenti, W.G. & Kruger, C.H. (1965). Introduction to Physical Gas Dynamics, New York.
Weninger, K.R., Barber, B.P. & Putterman, S.J. (1997). Pulsed Mie scattering measurements
of the collapse of a sonoluminescing bubble, Phys. Rev. Lett., Vol. 78, pp. 1799-1802.
Yamamoto,K., Takeuchi,H. & Hyakutake, T. (2006). Characteristics of reflected gas
molecules at a solid surface, Phys. of Fuids, Vol.18,046103.
Young, F.R.(2005). Sonoluminescence , CRC Press, Boca Raton.
Part 2
Boiling, Freezing and
Condensation Heat Transfer