GIS Applications for Water, Wastewater, and Stormwater Systems - Chapter 9 docx
Bạn đang xem bản rút gọn của tài liệu. Xem và tải ngay bản đầy đủ của tài liệu tại đây (3.69 MB, 15 trang )
CHAPTER
9
Mapping Applications
A map is worth a thousand numbers but you must go beyond mapping
to sustain your GIS program. This requires putting your GIS maps to
beneficial use.
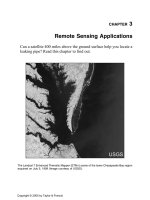
3D display of sewer system for the Municipality of Bethel Park, Pennsylvania.
2097_C009.fm Page 161 Monday, December 6, 2004 6:05 PM
Copyright © 2005 by Taylor & Francis
LEARNING OBJECTIVE
The learning objective of this chapter is to understand the applications of GIS maps
in the water industry.
MAJOR TOPICS
• Common mapping functions
• Mapping application examples for water systems
• Mapping application examples for wastewater systems
• Mapping application examples for stormwater systems
LIST OF CHAPTER ACRONYMS
2-DTwo
Two-Dimensional
3-DThree
Three-Dimensional
COGO
Coordinate Geometry
CSO
Combined Sewer Overflow
DEM
Digital Elevation Model
DTM
Digital Terrain Model
I/I
Inflow/Infiltration
MS4
Municipal Separate Storm Sewer System
NPDES
National Pollution Discharge Elimination System
SQL
Structured Query Language
TIN
Triangular
Irregular Network/Triangulated Irregular Network
This book focuses on the four main applications of GIS, which are mapping, monitor-
ing, modeling, and maintenance and are referred to as the “4M applications.” In this chapter
we will learn the applications of the first
M
(mapping).
CUSTOMER SERVICE APPLICATION IN GURNEE
The Village of Gurnee, located near Chicago (Illinois), has seen explosive growth
since the 1970s. Population more than doubled from 13,701 in 1990 to 28,834 in
2000. This growth bogged down Gurnee personnel with public meetings, rezoning
hearings, code violations, road construction, and water line and sewer line repairs.
Several departments were legally required to notify property owners of meetings,
pending changes, or future disruptions. The Village used GeoMedia GIS software
from Intergraph to automate the resident notification process (Venden and Horbinski,
2003). The automated system — known as Notifast
™
— allows staff members to
enter a street address or select a parcel, specify a distance radius, and identify all
property owners within that distance. Notifast then generates a list of mailing labels
2097_C009.fm Page 162 Monday, December 6, 2004 6:05 PM
Copyright © 2005 by Taylor & Francis
and mail-merged form letters. Each letter includes an embedded map that clearly
shows the area in question. This application of existing GIS maps has improved
efficiency and customer service. What used to take hours is now completed in
minutes.
Figure 9.1 shows a screenshot of how parcels can be selected in ESRI’s ArcGIS
software by drawing a circle. The 200-ft radius circle is drawn with its center at the
project site. All the parcels that are intersected by the circle are selected as shown
in the hatched pattern. The attribute data for the selected parcels are shown in the
table to the left of the circle. These data can be copied in a word processor’s mail-
merge feature to generate notification letters.
As explained in Chapter 8 (Mapping), creation of GIS maps is a huge undertak-
ing. Unfortunately, in today’s competitive world, despite the enormous effort
required to create them, colorful maps alone can no longer justify the existence of
a GIS program. This is because, after spending large sums of money on a mapping
project, many water and sewerage agencies are wondering what else to do with their
GIS maps. To garner continued financial support for a GIS program, GIS programs
must go beyond conventional map printing activities and demonstrate the usefulness
(applications) of GIS maps. This chapter shows how to do that.
It does not occur to most people that a good map raises more questions than it answers —
that the question of why things are located where they are raises important intellectual
issues, with immediate serious implications. (Lewis, 1985).
Figure 9.1
Selecting notification parcels in ArcGIS.
2097_C009.fm Page 163 Monday, December 6, 2004 6:05 PM
Copyright © 2005 by Taylor & Francis
A paper map provides the power of place but a map in GIS can automate “the
why of where.” Most GIS applications originate from GIS maps. This chapter
describes simple mapping applications. Advanced applications like hydrologic and
hydraulic modeling, facilities management, inspection and maintenance, and plan-
ning are described in other chapters.
COMMON MAPPING FUNCTIONS
Most GIS packages provide simple data analysis capabilities that can be used
to create basic mapping applications without custom programming. Typical examples
of these GIS functions are given in the following subsections.
Thematic Mapping
Thematic mapping is one of the easiest ways to develop mapping applications.
Map components can be logically organized into sets of layers called
themes
. A theme
is a group of similar geographic features, such as hydrants (points), water mains
(lines), or pressure zones (polygons). These themes can be manipulated using clas-
sification and legend (symbology) to create different thematic maps. Classification
places attribute values into groups. For example, water mains for a city can be
classified by diameter to create groups such as pipes smaller than 6 in., pipes 8 to
12 in., and pipes greater than 12 in. These groups can then be displayed using different
legends reflecting different colors, line thicknesses, and symbols (e.g., solid, dashed,
or dotted lines). Each combination of a classification method and legend will produce
a different thematic map. Figure 9.2 shows the difference between an unclassified
and nonsymbolized sewer map (top) and the same map classified and symbolized by
pipe diameters (bottom). Obviously, the bottom map will be more useful in applica-
tions that require pipe diameters, such as flow monitoring and hydraulic modeling.
Spatial Analysis
Many GIS packages also allow users to select the features of one or more themes
using the features of another theme. Referred to as spatial or overlay analyses, these
theme-on-theme
selection functions identify whether one feature lies within another,
whether it completely contains another, or whether it is within a specified distance
of another, and so on. For example, these mapping operations can identify the
manholes in a given drainage basin, or census blocks within a watershed, or the
properties within a certain distance of a water main.
Buffers
A buffer can be created around one or many features by using the buffer function
typically found in most GIS packages. Creating a buffer provides a visual represen-
tation on a map of the area within a certain distance of one or more features. Buffer
can also be used to select features in other layers that fall within the buffered area.
2097_C009.fm Page 164 Monday, December 6, 2004 6:05 PM
Copyright © 2005 by Taylor & Francis
Figure 9.2
A sewer system map. Above: without attribute classification and symbology; below:
with attribute classification and symbology for pipe diameter.
Sewersp.shp
<all other values>
DIAM
24"
20"
18"
16"
15"
12"
10"
6"
8"
4"
2097_C009.fm Page 165 Monday, December 6, 2004 6:05 PM
Copyright © 2005 by Taylor & Francis
For instance, a buffer can be drawn to show the area around a well that is contam-
inated or to represent a floodplain around a river. Figure 9.3 shows a buffer created
around existing combined sewers in the Borough of Kittanning, Pennsylvania. It
identifies the area targeted for sewer separation in the Borough’s combined sewer
overflow (CSO) control plan.
Figure 9.3
Buffer for a sewer separation project.
2097_C009.fm Page 166 Monday, December 6, 2004 6:05 PM
Copyright © 2005 by Taylor & Francis
Hyperlinks
Some GIS packages such as ArcView and ArcGIS have Hotlink or Hyperlink
functions respectively to provide additional information about the features. For
example, when a feature is clicked with the Hyperlink tool, a document or file is
launched using the application associated with that file type. This function can be
used as a document management system from within a GIS. For example, users
can click on a valve to display the valve card, on a sewer pipe to launch a televised
video file, or on a water main to display its as-built drawing. Figure 9.4 shows a
display of a scanned image of a water distribution system valve parts list using
ArcView’s Hotlink function. Additional information on hyperlinks is provided in
Chapter 15 (Maintenance Applications).
WATER SYSTEM MAPPING APPLICATIONS
Representative mapping applications for water distribution systems are given in
the following subsections.
MWRA Water System Mapping Project
In the late 1990s the Massachusetts Water Resources Authority (MWRA) con-
ducted a major in-house effort to develop a linked system schematic set. These
overview maps did not have a scale or base, but showed how the elements of the
system connected hydraulically. In addition to developing the digital version of these
maps, the GIS staff created links to a number of real time databases and the location
plans for each valve. Thus, the schematic showed the status of all mainline valves
for emergency response planning. If a valve was inoperable or had been opened or
closed, the GIS updated the color of the pipe line on the schematic, alerting the
users to its condition.
MWRA then consolidated their water distribution facility data and source docu-
ment references into a manageable set of data tables and digital maps that were easily
accessible to MWRA staff. They also linked the records of every pipe, valve, meter,
and fitting in the distribution system to existing databases of record plans, land takings,
hydraulic conditions, leaks, maintenance activities, and schematic representations in
the GIS. This effort allowed MWRA users to click on a pipe drawing, and instead of
being able to access just the record drawing, choose from a menu of options regarding
the land records and model scenarios, as well as the physical condition and mainte-
nance history of the pipe. This provided access to a variety of maintenance and data
development activities throughout the water division (Estes-Smargiassi, 1998).
Service Shutoff Application
To strengthen enforcement activities on delinquent accounts, the Philadelphia
Water Department (PWD) developed an ArcView GIS tool to support its shutoff
program. The shutoff tool identifies priority sites and automates crew assignments
2097_C009.fm Page 167 Monday, December 6, 2004 6:05 PM
Copyright © 2005 by Taylor & Francis
to increase crew productivity. A prioritizing algorithm identifies delinquent cus-
tomers based on age and amount in arrears. These priority accounts identify
clusters of shutoff sites. Clusters are formed using ArcView Network Analyst
extension to locate nearby sites reachable by the street network. The application
generates maps and tables for each crew’s daily schedule. With the help of this
Figure 9.4
Hotlink function displaying valve information for a water distribution system.
2097_C009.fm Page 168 Monday, December 6, 2004 6:05 PM
Copyright © 2005 by Taylor & Francis
application and other measures, PWD improved enforcement efficiency by 60%
(Lior et al., 1998).
Generating Meter-Reading Routes
Seattle Public Utilities (SPU) has more than 174,000 customers. In an effort to
save meter-reading cost and improve customer service, GIS was used to create more
efficient meter-reading routes. In 1995, SPU’s Metering and GIS departments joined
forces to explore the feasibility of rerouting meter-reading routes. In 1997, a pilot
project was completed using software from ESRI and RouteSmart Technologies,
which convinced the SPU management to implement a citywide rerouting project.
The project implementation resulted in cost savings for the ratepayer, especially
because of SPU’s prior investments in GIS data conversion (Lee, 1998).
Map Maintenance Application
In Ohio, Cincinnati Water Works (CWW) developed a GIS application for water
distribution system maintenance, hydraulic modeling, and customer service. A major
component of this application was the development of a Map Maintenance Application
(MMA), which is an update developed using ArcInfo and Oracle. It allows simulta-
neous maintenance of water system layers and related RDBMS tables. The MMA
features COGO data entry, scroll lists for table inserts, and feature abandonment. It
also utilizes the integrity constraint checking capability of the RDBMS (Guetti, 1998).
WASTEWATER SYSTEM MAPPING APPLICATIONS
Representative mapping applications for wastewater systems are given in the
following subsections.
Public Participation with 3D GIS
At the present time many cities in the U.S. are planning to spend billions of
dollars to meet the regulatory requirements for correcting their wastewater problems,
such as wet-weather overflows from the sewer systems. Given the potential for
significant expenditures of public funds, a key to the future success of capital projects
is public participation. The regulatory agencies are mandating public participation
as a required element of these projects. Therefore, establishing early communication
with both the public and the regulatory agencies should be an important first step
in a long-term planning approach, and crucial to the success of a wastewater capital
improvement program. By informing the public early on in the planning process
about the scope and goals of the program, and continuing this public involvement
during development, evaluation, and selection of alternatives, issues and potential
conflicts can be identified and addressed more expeditiously, minimizing the poten-
tial for prolonged delay or additional cost.
Three-dimensional (3D) maps are an effective means of public education, noti-
fication, and communication. They provide impressive “real-life” visions of proposed
2097_C009.fm Page 169 Monday, December 6, 2004 6:05 PM
Copyright © 2005 by Taylor & Francis
projects. GIS, CAD, and multimedia technologies can be combined to produce 3D
models and 3D animations.
3D maps can be created by adding elevation data to existing 2D vector layers.
Elevation data can be obtained from contour maps, digital elevation models (DEM),
digital terrain models (DTM), aerial surveys, engineering drawings, or GPS surveys.
The quality of 3D analysis largely depends on the accuracy and resolution of
elevation data. For engineering design, highly accurate data are required. For pre-
sentation mapping, less accurate data can be used. For example, in-lieu of accurate
heights, buildings can be elevated in proportion to the number of floors.
GIS fly-through scenes allow the public to experience a 3D walk-through of a
proposed project. Animation can animate objects within a model, e.g., cars moving
down the road or people walking on the curbs. Realistic materials and textures can
be added to depict the actual field conditions, e.g., wet streets. Climatic conditions,
e.g., snow cover or sunlight can be added to portray the specific design conditions.
3D capability is usually added to standard GIS packages by installing additional
3D extensions or modules. For example, 3D Analyst Extension enables ESRI’s
ArcGIS users to visualize and analyze surface data. Using 3D Analyst, one can view
a surface from multiple viewpoints, query a surface, determine what is visible from
a selected location on a surface, and create a realistic perspective image draping
raster and vector data over a surface.
The figure on the first page of this chapter shows a 3D map of a sewer system
for the Municipality of Bethel Park, Pennsylvania. Created using 3D Analyst Exten-
sion, the map shows buildings, contours, and sewer lines overlaid on an aerial
photograph. Because wastewater must flow down the hill, design of gravity sewers
depends on topography. GIS can help create 3D maps to facilitate efficient engi-
neering of a new sewer system, quick assessment of an existing sewer system, or
presentation of the project layout to the general public.
Figure 9.5 shows a 3D fly-through animation of an Allegheny County Sanitary
Authority (ALCOSAN) sewer construction project in the City of Pittsburgh, Penn-
sylvania. Completed in 1999, this $24-million project involved construction of a
5.2-mi-long parallel relief interceptor to relieve sewer overflows and basement flood-
ing in the Saw Mill Run Watershed of the city. The pipe sizes for the relief interceptor
ranged from 36 to 54 in. in diameter. The parallel interceptor was designed to follow
the alignment of the Saw Mill Run Creek because the right-of-way corridor along
the main street (Route 51) was not conducive to a major interceptor construction
project. Animation was used to present the project design in a general public meeting.
Figure 9.5 shows the sewers and manholes exposed above the ground surface to
help the general public envision the proposed interceptor layout. The animation
clearly indicated that the new sewers will mostly avoid backyards, parking lots, and
roads — an issue that was very important to the residents of the community. This
approach helped ALCOSAN to win the public support for the project.
Mapping the Service Laterals
Recent inflow and infiltration (I/I) studies have shown that service laterals are
one of the most significant I/I contributors, generating as much as 60% of the total
2097_C009.fm Page 170 Monday, December 6, 2004 6:05 PM
Copyright © 2005 by Taylor & Francis
I/I quantity. Unfortunately, most collection systems do not have maps of their service
laterals. TV inspection logs provide accurate lateral location information, which can
be used to prepare service lateral GIS maps. For example, Chester Engineers (Pitts-
burgh, Pennsylvania) developed a Wyemaker ArcView extension to add service wyes
(Ys) to sewer lines. Developed using ArcView Dialog Designer extension, this utility
is a good example of GIS customization.
Figure 9.6 shows a typical two-page TV inspection log. The first page provides
general information about a sewer pipe. The second page details the specific pipe
defects and their location. This page also includes the location of service laterals
measured in feet from one manhole to the next. The Wyemaker extension will first
create a database containing the wye information for each sewer main. The wye
information is entered in a wye input form shown in Figure 9.7 that basically
replicates the data fields on the log sheets. The upstream and downstream manhole
identification numbers are entered. In this case, the sewer segment ID is created by
concatenating the upstream and downstream manholes. The sewer length from the
inspection log is entered as well as the beginning distance (usually zero). The user
then indicates the direction of the measurements, the wye measurement and the side
of the line in which the wye is located. The direction of the measurements is the
direction in which the line was inspected. The direction is either “against the flow”
(from the downstream manhole to the upstream manhole) or “with the flow” (from
Figure 9.5
3D fly-through animation of a sewer construction project.
2097_C009.fm Page 171 Monday, December 6, 2004 6:05 PM
Copyright © 2005 by Taylor & Francis
Figure 9.6
Sample TV inspection log.
Figure 9.7
Service laterals view in ArcView.
2097_C009.fm Page 172 Monday, December 6, 2004 6:05 PM
Copyright © 2005 by Taylor & Francis
the upstream manhole to the downstream manhole). Entering the direction of
measurement and the side of the line eliminates the need for the user to recalculate
distances if the line was measured against the flow. The calculations are automatically
done by the extension and the position of the wye (right or left) is automatically
switched if necessary. Once the form is completed, the user simply clicks on “Save
Record” and the wye record is automatically saved to the wye table.
When all records are entered, the database table is used to create a Shapefile of
the wyes. All the wyes in the Shapefile are exactly the same length and at the exact
same angle from the sewer line, creating an aesthetically appealing data set. The
wyes are kept in a separate Shapefile rather than being added to the existing sewer
theme in order to maintain the connectivity of the main lines. A sample lateral map
created using this method is shown in Figure 9.7.
Additional examples of wastewater system mapping applications are included
in Chapter 15 (Maintenance Applications).
STORMWATER SYSTEM MAPPING APPLICATIONS
A representative mapping application for stormwater systems is presented below.
Stormwater Permits
In the U.S., many cities with storm sewers and outfalls must comply with a
National Pollution Discharge Elimination System (NPDES) Stormwater Permit
under the U.S. Environmental Protection Agency’s Municipal Separate Storm Sewer
System (MS4) permit program. These permits require U.S. municipalities to develop
stormwater pollution prevention programs, track the compliance schedules, and
monitor stormwater system maintenance and water quality sampling.
Some cities finance the operation of a stormwater utility that pays for permit
compliance by assessing a stormwater fee (drainage tax) on the properties. Initially,
some U.S. municipalities chose to implement a flat tax for all property owners, based
on the tax value of their property. Because only the impervious area of a property
contributes to stormwater runoff, many cities used a more equitable approach that
assessed the tax in proportion to the impervious area of each property. Accurate
calculation and tracking of impervious areas from conventional methods (e.g., from
survey or paper maps) is cumbersome and costly. GIS allows accurate and inexpen-
sive capture of impervious surfaces from aerial photographs, orthophotos, scanned
site plans, and parcel maps.
GIS can be used to develop stormwater user fees using the following steps:
1. Delineate property land covers using digital orthophotos.
2. Assign a percent imperviousness factor to each land cover. For example:
• Roofs, 100%
• Concrete driveway, 100%
• Gravel driveway, 75%
• Parking lot, 90%
2097_C009.fm Page 173 Monday, December 6, 2004 6:05 PM
Copyright © 2005 by Taylor & Francis
3. Estimate land-cover area-weighted mean percent imperviousness of each property.
4. Determine stormwater rates based on mean percent imperviousness of a property
rather than the total impervious area.
For example, the Texas legislature passed a law allowing municipalities to create
drainage utilities that assessed utility fees associated with each land parcel based on
the amount of stormwater runoff it contributed. The City of Irving, Texas, started
using GIS and color-infrared aerial photography in 1993 to examine and map the
sources of the city’s stormwater runoff. The City assumed that a simple distinction
between pervious surfaces such as vegetative cover and impervious surfaces such
as buildings and parking lots would be sufficient to determine the stormwater runoff
of each parcel with acceptable accuracy. To determine the area of each surface type
with individual parcels, the tax-parcel layer was overlaid with the pervious/imper-
vious layer. This operation created a list of each parcel’s tax identification number
and the associated pervious/impervious area. This table was then linked to the City’s
water utility billing system to calculate the amount due from each property owner
and include that amount in the monthly utility bill (
American City&County
, 1994).
The City and County of Denver, Colorado, has a storm drainage utility that
assesses a fee on all properties in Denver based on the amount of impervious surface
present on each property, as well as on the percentage of the total area of each property
that the impervious surface represents. Initially, Denver used field measurements but
did not find them cost-effective. In 2002, they hired the Denver firm of Elroi Con-
sulting, Inc., to implement an impervious surface GIS for the County. Initially, the
system was implemented using ArcGIS 8.1 and a personal geodatabase that required
only ArcView licenses. The system was later upgraded to work with an ArcSDE
geodatabase, complete with versioning and multiuser editing. The system builds on
the ArcMap component of ArcGIS, both removing unnecessary toolbars from the
user interface and adding several custom toolbars. The user-friendly interface enables
even the non-GIS users (e.g., field inspectors) to use the system. Impervious surfaces
are digitized directly into the GIS, thus making impervious surface fee assessments
defensible. The impervious surface GIS was subsequently linked to Denver’s storm-
water billing system for rapid database update. With this system, Denver now collects
over $12 million annually in impervious surface fees (Elroi, 2002).
Oakland County, Michigan, which has more than 440,000 parcels, uses high-
density spot elevation and break-line data in GIS to create triangular irregular
network (TIN) surface models. These models help the county drain commissioner’s
office to visualize the terrain and delineate catchment areas. This approach identifies
precise drainage patterns and the land that contributes runoff to a storm drain. The
catchments define the drainage district boundaries that are used to assess the appro-
priate drainage tax in an equitable manner (Gay, 2003).
The conventional paper-based permit compliance approach can be very hectic
for large cities. GIS is being used in many U.S. cities to meet the stormwater permit
requirements system in a user-friendly environment. For example, SQL, Avenue,
and Dialog Designer have been utilized to develop an interface between ArcView
GIS and Microsoft Access for developing an NPDES compliance application (Huey,
1998). This application is helping both the management of stormwater features such
2097_C009.fm Page 174 Monday, December 6, 2004 6:05 PM
Copyright © 2005 by Taylor & Francis
as sewer lines and outfalls, and preparation of complex NPDES Annual Reports.
The report requires summarizing all stormwater management program goals and
efforts toward meeting those goals. An example of the use of dialogs and custom-
programmed icon buttons for query is shown in Figure 9.8.
CHAPTER SUMMARY
Paper maps are useful but their applications are limited. In most cases, mapmak-
ing alone cannot justify the continued financial support for a GIS department. GIS
maps and associated databases can be manipulated in a variety of ways to develop
applications that automate and simplify the routine tasks. GIS maps are the starting
point for developing GIS applications: no maps, no applications. In this chapter we
learned about some basic applications of GIS maps. Advanced applications will be
presented in subsequent chapters.
CHAPTER QUESTIONS
1. What is the meaning of “beyond mapping?” Why is it important to go beyond
mapping?
2. Compile a list of ten mapping applications.
3. Using literature review or the Internet, write a 200-word example of a mapping
application for a water distribution system not described in this chapter.
4. Repeat Question 3 for a wastewater collection system.
5. Repeat Question 3 for a storm drain system.
Figure 9.8
Utilization of dialogs to monitor and update structure-maintenance activities.
2097_C009.fm Page 175 Monday, December 6, 2004 6:05 PM
Copyright © 2005 by Taylor & Francis