báo cáo khoa học: " Major multinational food and beverage companies and informal sector contributions to global food consumption: implications for nutrition policy" potx
Bạn đang xem bản rút gọn của tài liệu. Xem và tải ngay bản đầy đủ của tài liệu tại đây (304.87 KB, 8 trang )
RESEARCH Open Access
Major multinational food and beverage
companies and informal sector contributions
to global food consumption: implications for
nutrition policy
Eleanore Alexander
1
, Derek Yach
1*
and George A Mensah
2
Abstract
Background: In recent years, 10 major multinational food and beverage companies have worked together within
the International Food and Beverage Alliance (IFBA) to increase their commitments to public health. Current IFBA
commitments include initiatives to improve the nutrition quality of products and how these products are
advertised to children. The impact and magnitude of IFBA member contributions to the total market share of
packaged foods and beverages consumed remain incompletely understood, however.
Methods: In order to evaluate this impact, we examined packaged food and soft drink company shares provided
by Euromonitor, an international independent market analysis company. Packaged foods include baby food, bakery,
canned/preserved food, chilled/processed food, confectionery, dairy, dried processed food, frozen processed food,
ice cream, meal replacement, noodles, oils and fats, pasta, ready meals, sauces, dressings and condiments, snack
bars, soup, spreads, and sweet and savoury snacks. Soft drinks include carbonates, packaged fruit/vegetable juice,
bottled water, functional drinks, concentrates, ready-to-drink tea, ready-to-drink coffee and Asian specialty drinks.
We calculated the market shares for IFBA companies, globally and within nine countries–the US, China, India,
Egypt, South Africa, Brazil, Mexico, Turkey and the UK.
Results: Worldwide, the top ten packaged food companies account for 15.2% of sales, with each individual
company contributing less than 3.3%. The top ten soft drink companies account for 52.3% of sales worldwide;
Coca-Cola and PepsiCo lead with 25.9% and 11.5% of sales, respectively.
Conclusions: Although the top ten soft drink companies account for half of global sales, the top ten packaged
food companies account for only a small proportion of market share with most individual companies contributing
less than 3.3% each. Major multinationa l companies need to be joined by the myriad of small- and medium-sized
enterprises in developing and implementing programs to improve the health of the public, globally. Without full
participation of these companies, the impact of commitments made by IFBA members and other major
multinational food and beverage companies will remain limited.
Introduction
The packaged food and beverage industry, including
large multinationals (MNCs)
1
, medium- and small-sized
enterprises (SMEs)
2
as well as the informal sector, need
to be involved in improving the nutrition status of the
populations they serve [1]. Major food and beverage
companies–Ferrero, General Mills, Grupo Bimbo, Kel-
logg’s, Kraft Foods, Mars, Nestlé, PepsiCo, the Coca-
Cola Company and Unilever–have worked together over
several years within the International Food and Beverage
Alliance (IFBA) to increase their commitment to public
health [ 2]. The IFBA set five global commitments
addressing food reformulation, consumer information,
responsible marketing, promotion of healthy lifestyles
and public private partnerships. Progress includes
* Correspondence:
1
Global Health and Agriculture Policy, PepsiCo, Inc., Purchase, NY, USA
Full list of author information is available at the end of the article
Alexander et al. Globalization and Health 2011, 7:26
/>© 2011 Alexander et al; licensee BioMed Central Ltd. This is an Open Access article distributed under the terms of the Creative
Commons Attribution License ( which permits unrestricted use, distribution, and
reproduction in any medium, provided the original work is properly cited.
pledges to improve the nutrition quality of products and
restrict advertising to children. However, the impact and
magnitude of the IFBA contribution to the total mark et
share of packaged foods and b everages consumed is not
fully understood due to insufficient data.
The data on the relative contribution of various food
and beverage c ompanies to people ’ s diets is critical, as
they often drive policy development to improve nutri-
tion status. Basic information, for example on sources of
sodium, is needed for ration aleinpolicydevelopment.
Without such information, anecdote can drive policies
in ways that may undermine public health goals. This
paper seeks to fill one gap in knowledge by describing
which companies are the major contributor s to pack-
aged food and soft drink sales, both at a global level and
within nine countries–the US, China, India, Egypt,
South Africa, Brazil, Mexico, Turkey and the UK.
Objectives
This paper defines the contribution of selected players
in the food and beverage industry to the sales of pack-
aged foods and soft drinks sold globally and in selected
countries. Further, it describes fo od and soft drink com-
pany pledges related to health, with a focus on IFBA
commitments.
Methods
Data were gathered through Eur omonitor International,
an independent market analysis company that provides
information on industries, countries and consumers,
using Passport, a global market analysis software plat-
form [3]. Euromonitor gathers data using national- and
international-level desk research, including company
research and analysis, store checking, trade interviewing
with national players, market analysis and MNC
research and analysis. Data standardization ensures
international comparability across the global database.
Data were extracte d for the world, and for the follow-
ing countries: US, China, India, Egypt, South Africa,
Brazil, Mexico, Turkey and the UK. Countries were
selected based on market strength or recent market
growth. L eading companies were ranked within the top
ten for each geographic region based on sales value.
Categories: Packaged Food and Soft Drinks
Packaged food
3
data are defined in terms of retail sales
and foodservice sales [Table 1] [3]. Retail sales include
sales intended for consumption at home. Foodservice is
def ined as sales to consumers in a non- or semi-captive
environment and includes venues such as cafes, bars
and street stalls. Packaged food includes sales by cor-
porations, retailers as “private label,” artisanal and gen-
eric/unbranded. Artisanal products are those sold on the
site of production and are common in bakery products.
Soft drink company share data are defined in off-trade
value. Off-trade does not include sales through bars, res-
taurants and cafes. Products in the soft drin k category
include: carbonates, packaged fruit/vegetable juice,
bottled water, functional drinks, concentrates, ready-to-
drink tea, ready-to-drink coffee and Asian specialty
drinks [Table 1]. The terms beverage and soft drink are
used interchangeably i n this paper; beverage if often
used to promote understanding that the category is not
limited to carbonated soft drinks. Soft drink sales are
categorized as sales from corporations, private label and
other.
Euromonitor does not collect data on the i nformal
sector (defined as sales that are not taxed). While pro-
ducts from the informal sector and artisanal products
are often locally made, products from the informal sec-
tor differ from artisanal products because artisanal pro-
ducts are taxed, while informal sector products are not.
Metrics
Packaged food sales are measured in percent retail value
RSP (defined as retail selling prices or how much the
product sells for in the store) for the year 2009. Soft
Table 1 Packaged food and soft drink definitions
Packaged food baby food
bakery
canned/preserved food
chilled/processed food
confectionery
dairy
dried processed food
frozen processed food
ice cream
meal replacement
noodles
oils and fats,
pasta
ready meals
sauces
dressings and condiments
snack bars
soup
spreads
sweet and savoury snacks.
Soft drinks Carbonates
packaged fruit/vegetable juice
bottled water
functional drinks
concentrates
ready-to-drink tea
ready-to-drink coffee
Asian specialty drinks
Alexander et al. Globalization and Health 2011, 7:26
/>Page 2 of 8
drink value is measured in off-trade value RSP for the
year 2010. On-trade soft drink company share value is
not available from Euromonitor P assport; however, t he
omission of on-trade soft drink sales, often led by
MNCs, limits this analysis. Most soft drink c ompanies
rank similarly in volume and value. Packaged food com-
pany share data are only available for value. Therefore,
company shares value data are reported in this paper.
Results
[See Tables 2 and 3 for country s pecifi c packaged food
and soft drink data]
The top ten packaged food companies globally–Nestlé,
Kraft Foods, Unilever, PepsiCo, Mars, Danone, Cad-
bury
4
, Kellogg, General Mills and Ferrero –account for
15.2% of global packaged food sales [Table 4]. Each
company contributes fewer than 3.3% of total sales.
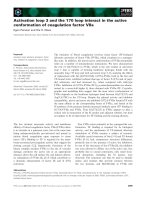
IFBA members in the top ten–Nestlé, Kraft, Unilever,
PepsiCo, Mars, Kellogg, General Mills and Ferrero–
account for 13% of global packaged food sales [Figure 1].
Artisanal packaged food products contribute 11.3% of
total sales.
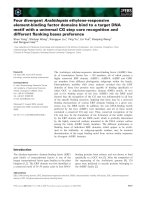
The top ten soft drink companies globally–Coca-Cola,
PepsiCo, Nestlé, Suntory Holdings Ltd, Dr Pepper Snap-
pleGroup,Danone,KirinHoldingsCoLtd,RedBull
GmbH, Tingyi (Cayman Islands) Holdings Corp and
Asahi Breweries Ltd–account for 52.3% of total soft
drink sales [Figure 2]. Three IFBA members–Coca-Cola,
PepsiCo and Nestlé–rank in the top ten for the global
soft drink market, with sales totaling 40.4% [Figure 2].
Discussion
IFBA companies account for a relatively small fraction of
global packaged food sales, while a few IFBA companies
dominate soft drink sales
Overall, individual pack aged food c ompanie s each con-
tribute a small share of total sales and IFBA member
compa nies vary in strength by country: IFBA companies
that rank in the top ten for packaged food sales range in
contributions from 2.3% of sales in China to 25.9% of
sales in the US. The range of soft drink company invol-
vemen t in each country varies widely: IFBA members in
the top ten for soft drink sales range from 21.0% in
China to 75.0% in Egypt.
Data gaps
Data are needed to describe the size of the informal sec-
tor in the packaged food and soft drink markets. Collec-
tion of data from the informal sector is difficult, as
informal sector vendors mostly operate beyond the reg-
ulatory reach of governments. Further data are also
needed from the informal sector and from companies
on the amount of specific nutrients that each organiza-
tion contributes to nutrient intake. This paper uses
Table 2 Country Packaged Food Company Shares
(Euromonitor, 2011)
US Packaged Food Company Shares
Rank Company Value
(%)
% top
10
Artisanal
(%)
31.9 25.9
1 Kraft Foods Inc 6.7
2 PepsiCo Inc 5.3
3 Nestlé SA 3.7
4 Mars Inc 3
5 General Mills Inc 2.6
6 Kellogg Co 2.6
7 Hershey Co, The 2.2
8 ConAgra Foods Inc 2.1
9 Unilever Group 2
10 Campbell Soup Co 1.7
China Packaged Food Company Shares
Rank Company Value
(%)
% top
10
Artisanal
(%)
25.4 7.1
1 Inner Mongolia Mengniu Dairy
Industry (Group) Co Ltd
4.5
2 Inner Mongolia Yili Industrial Group
Co Ltd
4.1
3 Kuok Oils & Grains Pte Ltd (KOG) 3.3
4 Ting Hsin International Group 2.9
5 Shineway Group 2.8
6 Hangzhou Wahaha Group 2.1
7 Want Want Group 1.8
8 Bright Food (Group) Co Ltd 1.6
9 Mars Inc 1.2
10 Nestlé SA 1.1
India Packaged Food Company Shares
Rank Company Value
(%)
% top
10
Artisanal
(%)
39.6 4.2
1 Gujarat Co-operative Milk Marketing
Federation Ltd
8
2 National Dairy Development Board 4.9
3 Nestlé SA 4.8
4 Britannia Industries Ltd 4.4
5 Parle Products Pvt Ltd 4.2
6 Karnataka Cooperative Milk
Producers Federation Ltd
2.9
7 Cadbury Plc 2.9
8 GlaxoSmithKline Plc 2.8
9 Ruchi Group 2.4
10 Tamil Nadu Cooperative Milk
Producers Federation Ltd
2.3
Egypt Packaged Food Company Shares
Rank Company Value
(%)
% top
10
Artisanal
(%)
18.8 48
1 Savola
Group 3.6
2 Nestlé SA 2.5
Alexander et al. Globalization and Health 2011, 7:26
/>Page 3 of 8
company shares sales data, the most specific data avail-
able for both packaged food and soft drink on Euromo-
nitor; however, population intake data are needed to
describe the nutrient contributions of companies and
specific foods. The data on the nutrient contribution
from each company and the informal sector will
describe the role of each o rganization in contributing to
nutrient intake.
The sales data detailed in Tables 2, 3 and 4 do not
thoroughly describe the global reach of food and bever-
ageindustryMNCs.Thisrequires detailed information
about corporate ownership, partnerships, joint-ventures
and local counterparts. The larger picture of corporate
governance, ownership and control must be addressed
to understand fully the global reach of companies.
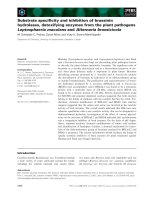
Comparing the packaged food market to the fruit and
vegetable market in a country will provide insight into
food and nutrient intake. Globally, the sales volume of
the packaged food market is smaller than the fruit and
vegetable market with a ratio of 0.73 [Figure 3]. How-
ever, five of the nine countries examined have a ratio
Table 2 Country Packaged Food Company Shares
(Euromonitor, 2011) (Continued)
3 Al Doha Co for Processing &
Distribution
2.3
4 Delta Rice SAE 1.6
5 Cadbury Plc 1.6
6 Americana Group 1.6
7 Faragello Group 1.6
8 Arma Food Industries 1.5
9 Juhayna Food Industries 1.3
10 PepsiCo Inc 1.2
South Africa Packaged Food Company Shares
Rank Company Value
(%)
% top
10
Artisanal
(%)
51.8 7.3
1 Tiger Brands Ltd 17.2
2 Unilever Group 4.9
3 Parmalat Group 4.8
4 Nestlé SA 4.6
5 Clover Ltd 4.6
6 Dairybelle (Pty) Ltd 4
7 Pioneer Food Group Ltd 3.7
8 Cadbury Plc 2.8
9 AVI Ltd 2.8
10 PepsiCo Inc 2.4
Brazil Packaged Food Company Shares
Rank Company Value
(%)
% top
10
Artisanal
(%)
30.4 21.1
1 Nestlé SA 7.9
2 Brf Brasil Foods SA 4.7
3 Unilever Group 3.3
4 Danone, Groupe 3
5 PepsiCo Inc 2.4
6 Kraft Foods Inc 2.1
7 Bunge International Ltd 2.1
8 M Dias Branco Indústria e Comércio
de Alimentos
1.8
9 Cadbury Plc 1.7
10 Itambé SA 1.4
Mexico Packaged Food Company Shares
Rank Company Value
(%)
% top
10
Artisanal
(%)
32.4 31.5
1 Bimbo SA de CV, Grupo 8.8
2 PepsiCo Inc 5.2
3 Nestlé SA 4.4
4 Industrial Lala SA de CV, Grupo 3.6
5 Ganaderos Productores de Leche
Pura SA de CV
2.1
6 Cadbury Plc 2
7 Sigma Alimentos SA de CV 1.8
8 Kellogg Co 1.7
9 Unilever
Group 1.7
Table 2 Country Packaged Food Company Shares
(Euromonitor, 2011) (Continued)
10 Conservas La Costeña SA de CV 1.1
Turkey Packaged Food Company Shares
Rank Company Value
(%)
% top
10
Artisanal
(%)
20.7 56.9
1 Ülker Gida Sanayi ve Ticaret AS 7.6
2 Unilever Group 3.2
3 Yasar Holding AS 1.6
4 Eti Gida Sanayii ve Ticaret AS 1.5
5 Sütas AS 1.3
6 Danone, Groupe 1.2
7 Cadbury Plc 1.2
8 Tat Konserve Sanayii AS 1.1
9 PepsiCo Inc 1.1
10 Marsan Gida San ve Tic AS 0.9
UK Packaged Food Company Shares
Rank Company Value
(%)
% top
10
Artisanal
(%)
26.4 2.8
1 Cadbury Plc 4.5
2 Mars Inc 3.7
3 Premier Foods Plc 3.6
4 Nestlé SA 2.7
5 PepsiCo Inc 2.6
6 Unilever Group 2.6
7 Heinz Co, HJ 2
8 United Biscuits (Holdings) Plc 1.9
9 Danone, Groupe 1.4
10 Dairy Crest Group Plc 1.4
Alexander et al. Globalization and Health 2011, 7:26
/>Page 4 of 8
greater than 1.0 and the magnitude of difference
between the markets is striking in several countries; for
example, the packaged food market is more than double
the size of the fruit and vegetable market in the US and
Mexico, and more th an triple the size in the UK. A
ratio greater than 1.0 suggests a larger contribution of
packaged foods than fresh foods to the diet in these
countries, and packaged foods often contain high
amounts of salt and fat as well as refined flour and
added sugar.
What about the informal sector?
The packaged food and soft drink markets include a
wide range of players including the formal and informal
sector. Keith Hard first described the informal sector as
those earning income through various activities yet not
included in the census under wage employment [as
cited in [4]]. Euromonitor describes the informal sector
as retailing that is not taxed and over estimates the con-
tribution of individual companies by not collecting data
on the informal sector.
In some areas, especially in developing countries, the
informal food sector comprises a large segment of the
working population, gross national income, food proces-
sing output, as well as a significant portion of total
nutrient intake [4]. Up to 60% of people in some African
cities are employed through the informal food sector.
The informal food sector accounts for a significant por-
tion of food purchases and energy intake in some popu-
lations: 60% of Brazil’s mini and midsize supermarkets
are informal retailers and 40% of resident total energy
intake in Bangkok, Thailand is accounte d for by street
food, including 88% of energy intake for children four to
six years of age [4,5]. Street foods are common in South
Afric a and are purchased at almost twice the amount of
fast food–fruit is the most commonly purchased item,
chosen by 60% of consumers (Steyn & Labadarios: Street
foods and fast foods: How much do South Africans con-
sume?, submitted).
Table 3 Global Soft Drink Company Shares (Euromonitor,
2011)
Region Rank Company Value
(%)
% top
10
World 52.3
1 Coca-Cola Co, The 25.9
2 PepsiCo Inc 11.5
3 Nestlé SA 3
*All other companies contribute less than 2.9%
US 70.8
1 Coca-Cola Co, The 24.9
2 PepsiCo Inc 22.5
3 Dr Pepper Snapple Group Inc 9.2
*All other companies contribute less than 4.6%
China 57
1 Coca-Cola Co, The 15.5
2 Tingyi (Cayman Islands) Holdings
Corp
13
3 PepsiCo Inc. 5.5
*All other companies contribute less than 5.6%
India 88.4
1 Coca-Cola Co, The 33.7
2 PepsiCo Inc 24.2
3 Parle Bisleri Ltd 13.8
*All other companies contribute less than 6.5%
Egypt 93.6
1 PepsiCo Inc 34.9
2 Coca-Cola Co, The 32
3 Juhayna Dairy Corp 7
*All other companies contribute less than 6.3%
South Africa 79
1 Coca-Cola Co, The 49.8
2 Tiger Brands Ltd 9.4
3 PepsiCo Inc 5.5
*All others contribute less than 3.5%
Brazil 67.9
1 Coca-Cola Co, The 39
2 PepsiCo Inc 9.3
3 Anheuser-Busch InBev NV 5.2
*All others contribute less than 3.3%
Mexico 88
1 Coca-Cola Co, The 47.7
2 PepsiCo Inc 15.1
3 Danone, Groupe 7.5
*All others contribute less than 3.3%
Turkey 68.8
1 Coca-Cola Co, The 32.3
2 PepsiCo Inc 6.9
3 Yildiz Holding AS 6.1
*All other contribute less than 5.6%
UK 61.2
1 Coca-Cola Co, The 22.5
2 PepsiCo Inc 10.1
3 GlaxoSmithKline Plc 8.8
*All others contribute less than 6.1%
Table 4 Global Packaged Food Company Shares 2009
(Euromonitor, 2011)
Rank Company Value (%) % top 10 Artisanal (%)
15.2 11.3
1 Nestlé SA 3.2
2 Kraft Foods Inc 2.4
3 Unilever Group 2.1
4 PepsiCo Inc 1.8
5 Mars Inc 1.4
6 Danone, Groupe 1.3
7 Cadbury Plc 0.9
8 Kellogg Co 0.8
9 General Mills Inc 0.7
10 Ferrero Group 0.6
Alexander et al. Globalization and Health 2011, 7:26
/>Page 5 of 8
In addition to contributing to higher energy and nutri-
ent intakes, foods from the informal sector may also
carry a higher food safety and health risk as these foods
are not subjected to the same rigorous standards
required for the formal packaged food sector. Unpub-
lished data from South Africa, for example, show higher
levels of ar tificial food color and sodium in Bottom of
the Pyramid (BoP) pro ducts than in brand-name p ro-
ducts (PepsiCo data: RSA BoP Salty & Sweet Snacks
Quality Survey). For example, BoP products contain 30%
more sodium than Sim ba brand products, with mean
sodium levels of 332 mg and 233 mg, respectively.
Corporate Health and Wellness Initiatives: IFBA vs. Others
Members of IFBA have made substantial progress in
response to the five commitments made by IFBA in
2006 [6]. Other m ajor regional pledges include those
made by the CFBAI
5
the EU pledge
6
,theGCCpledge
7
and the ICBA pledge
8
[7-10]. Many of these other
pledges have been committed to by IFBA members, and
most companies that follow the EU and IFBA pledges
are large MNCs–few small and medium-sized compa-
nies are included.
Several top packaged food companies that a re not
IFBA members have health and wellness pledges, includ-
ing Parmalat and Brasil Foods with pledges on market-
ing to kids, and Premier Foods with diet and health
policies to improve ingredients. Conversely, most of the
leading packaged food companies in China and India,
and several companies in the US, South Africa, Brazil,
Mexico and the UK are national companies without
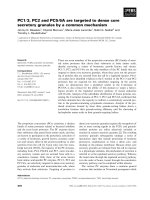
Figure 1 IFBA and top ten packaged food and soft drink company shares.
Figure 2 Global Soft Drink Company Shares 2010.
Figure 3 Ratio of packaged food to fruit and vegetable market
size (volume).
Alexander et al. Globalization and Health 2011, 7:26
/>Page 6 of 8
published evidence of significant health and wellness
pledges. Additionally, numerous soft drink companies in
each country are not engaged in significant h ealth and
wellness pledges.
Context: UN High Level Meeting on Noncommunicable
Diseases (NCDs)
The UN High Level Meeting on NCDs (September 19
and 20, 2011) offers the opportunity to place NCDs,
specifically cardiovascular disease, diabetes, cancer and
chronic lung disease, higher on government, NGO and
development agency agendas. It will focus on ways to
improve the four major risk factors for NCDs: unhealthy
diet, tobacco use, physical inactivity and alcohol intake
[11]. The draft Outcomes Document requests the pri-
vate sector to reformulate foods and beverages, reduce
sugar, salt, and trans-fats, and responsibly market and
advertise to children. IFBA companies are actively
engaged in such actions. This analysis highlights the
importance of including small and medium companies,
and in time, the vast informal food sector, in initiatives
to improve population health. Without this active parti-
cipation, IFBA gains will remain limited.
Future Work
Further work is needed to dete rmine whether IFBA
membe rs represent the “healthiest” part of the food sys-
tem. National health and wellness pledges are needed to
include companies that are not incorporated through
international pledges such as the IFBA. In addition,
efforts aimed at informing consumers on health issues
related to nutrition through health promotion cam-
paigns in low and middle income countries are needed
and can increase demand for health and wellness
policies.
The lack of data describing nutrient intake from both
the formal and informal sectors of the food and bever-
age market hi ghlights research gaps in defining major
contributors to intake. Further data need to be collected
that describe nutrient contributions of foods from the
formal and informal sectors.
The lack of engagement, including research, related to
the informal sec tor is a target area for future progress.
Defining the s ize and impact of the informal sector is
necessary to understand the best ways to engage the
informal sector in actions to improve diets.
Appendix
1)
The OECD describes multinational enterprises, dis-
cussed in this paper as multinational companies or
multinational corporations (MNCs), as “companies or
other entities whose ownership is private, state or
mixed, established in different countries and so linked
that one or more of them may be able to exercise a
significant influence over the activities of others and,
in particular, to share knowledge and resources with
the others.” [1]
2)
Small and medium enterprises (SMEs) refer to
enterprises usually with 250 or l ess employees who
mainly operate in one country or a single well defined
geographic region.
3)
Packaged foods, as define d by Euromonitor, include
baby food, bakery, canned/preserved food, chilled/pro-
cessed food, confectionery, dairy, dried processed food,
frozen processed food, ice cream, meal replacement,
noodles, oils and fats, pasta, ready meals, sauces, dres-
sings and condiments, snack bars, soup, spreads, and
sweet and savoury snacks.
4)
Cadbury became a p art of Kraft in 201 0; Cadbury
company shares are listed separately from Kraft in 2009
packaged food data.
5)
The Children’s Food and Beverage Advertising
Initi ative (CFBAI) was started in 2006 by the Council of
Better Business Bureaus to allow food and beverage
companies to have transparent advertising self-regula-
tion (CFBAI, 2010).
6)
The European Union (EU) pledge was s tarted in
2007 to change food and beverage advertising to chil-
dren and includes eleven company members (EU Pledge,
n.d.).
7)
Seven companies operating in the Gulf Cooperation
Council for the Arab States of the Gulf (Bahrain,
Kuwait, Oman, Qatar, Saudi Arabia, an d the United
Arab Emirates) signed a pledge in 2010 to restrict mar-
keting and advertising to children under 12 (Yale, 2010).
8)
In 2009, the International Council of Beverages
Associations (ICBA) implemented a pledge on market-
ing to children under 12; Coca-Cola and PepsiCo are
members.
Acknowledgements
We thank many colleagues within and outside PepsiCo for insightful
comments. These include members of PepsiCo’s Africa, Middle East and Asia
Advisory Committee.
Disclaimer
*Statements made and opinions expressed in this paper are those of the
authors and should not be construed as necessarily representing an official
position of PepsiCo, Inc.
Author details
1
Global Health and Agriculture Policy, PepsiCo, Inc., Purchase, NY, USA.
2
Global Nutrition, Global Research and Development, PepsiCo, Inc., Purchase,
NY, USA.
Authors’ contributions
EA researched and contributed to writing the document; DY led conception
and development of arguments and contributed to writing the document;
Alexander et al. Globalization and Health 2011, 7:26
/>Page 7 of 8
GM critically revised the document. All authors read and approved the final
manuscript.
Competing interests
EA is a PepsiCo consultant; DY and GM are fulltime PepsiCo employees.
Received: 26 May 2011 Accepted: 1 August 2011
Published: 1 August 2011
References
1. The OECD Guidelines for Multinational Enterprises. OECD [http://actrav.
itcilo.org/actrav-english/telearn/global/ilo/guide/oecd.htm].
2. Progress Report. International Food and Beverage Alliance 2009 [https://
www.ifballiance.org/our-commitments.html].
3. Euromonitor. 2011 [ />4. Promises and challenges of the informal food sector in developing
countries. FAO 2007 [ />htm].
5. Capp J, Elstrodt HP, Jones WB Jr: Reigning in Brazil’s informal economy.
McKinsey 2005 [ />BrazilEconomy.pdf].
6. Yach D, Khan M, Bradley D, Hargrove R, Kehoe S, Mensah G: The role and
challenges of the food industry in addressing chronic disease.
Globalization and Health 2010, 6:10.
7. Children’s Food and Beverage Advertising Initiative - About the
Initiative. Better Business Bureau 2010 [ />children-food-beverage-advertising-initiative/].
8. European Union Pledge. [ />9. The GCC Food and Beverage Pledge on Responsible Marketing and
Advertising to Children. [ />%20GCC%20-%20Marketing%20to%20Children%20Pledge%20-final%20%
20signed.pdf].
10. International Council of Beverages Associations Guidelines on Marketing
to Children. [ />children-guidelines.pdf].
11. Beaglehole R, Bonita R, Horton R, Adams C, Alleyne G, Asaria P, et al:
Priority actions for the non-communicable disease crisis. Lancet 2011,
377:1438-47.
doi:10.1186/1744-8603-7-26
Cite this article as: Alexander et al.: Major multinational food and
beverage companies and informal sector contributions to global food
consumption: implications for nutrition policy. Globalization and Health
2011 7:26.
Submit your next manuscript to BioMed Central
and take full advantage of:
• Convenient online submission
• Thorough peer review
• No space constraints or color figure charges
• Immediate publication on acceptance
• Inclusion in PubMed, CAS, Scopus and Google Scholar
• Research which is freely available for redistribution
Submit your manuscript at
www.biomedcentral.com/submit
Alexander et al. Globalization and Health 2011, 7:26
/>Page 8 of 8