báo cáo khoa học: " Health system determinants of infant, child and maternal mortality: A cross-sectional study of UN member countries" doc
Bạn đang xem bản rút gọn của tài liệu. Xem và tải ngay bản đầy đủ của tài liệu tại đây (1.16 MB, 31 trang )
Globalization and Health
This Provisional PDF corresponds to the article as it appeared upon acceptance. Fully formatted
PDF and full text (HTML) versions will be made available soon.
Health system determinants of infant, child and maternal mortality: A
cross-sectional study of UN member countries
Globalization and Health 2011, 7:42
doi:10.1186/1744-8603-7-42
Katherine A Muldoon ()
Lindsay P Galway ()
Maya Nakajima ()
Steve Kanters ()
Robert S Hogg ()
Eran Bendavid ()
Edward J Mills ()
ISSN
Article type
1744-8603
Research
Submission date
10 June 2011
Acceptance date
24 October 2011
Publication date
24 October 2011
Article URL
/>
This peer-reviewed article was published immediately upon acceptance. It can be downloaded,
printed and distributed freely for any purposes (see copyright notice below).
Articles in Globalization and Health are listed in PubMed and archived at PubMed Central.
For information about publishing your research in Globalization and Health or any BioMed Central
journal, go to
/>For information about other BioMed Central publications go to
/>
© 2011 Muldoon et al. ; licensee BioMed Central Ltd.
This is an open access article distributed under the terms of the Creative Commons Attribution License ( />which permits unrestricted use, distribution, and reproduction in any medium, provided the original work is properly cited.
Health system determinants of infant, child and maternal mortality: A cross–
sectional study of UN member countries
Katherine A Muldoon1,2, Lindsay P Galway3, Maya Nakajima3, Steve Kanters3, Robert
S Hogg2,3, Eran Bendavid4, Edward J Mills2,5.
1
School of Population and Public Health, University of British Columbia, 2206 East
Mall, Vancouver, British Columbia, Canada;
2
British Columbia Centre for Excellence in HIV/AIDS, St. Paul's Hospital, 1081
Burrard Street, Vancouver, British Columbia, Canada;
3
Faculty of Health Sciences, Simon Fraser University, 888 University Drive, Burnaby,
British Columbia, Canada
4
Division of General Internal Medicine, Stanford University, Palo Alto, California,
USA.
5
Faculty of Health Sciences, University of Ottawa, Roger Guindon Hall 451, Smyth
Road, Ottawa, Ontario, Canada.
Correspondence:
Dr. Edward Mills
1
Abstract
Objective: Few studies have examined the link between health system strength and
important public health outcomes across nations. We examined the association between
health system indicators and mortality rates.
Methods: We used mixed effects linear regression models to investigate the strength of
association between outcome and explanatory variables, while accounting for
geographic clustering of countries. We modelled infant mortality rate (IMR), child
mortality rate (CMR), and maternal mortality rate (MMR) using 13 explanatory
variables as outlined by the World Health Organization.
Results: Significant protective health system determinants related to IMR included higher
physician density (adjusted rate ratio [aRR] 0.81; 95% Confidence Interval [CI] 0.71–
0.91), higher sustainable access to water and sanitation (aRR 0.85; 95% CI 0.78– 0.93),
and having a less corrupt government (aRR 0.57; 95% CI 0.40– 0.80). Out-of-pocket
expenditures on health (aRR 1.29; 95% CI 1.03– 1.62) were a risk factor. The same four
variables were significantly related to CMR after controlling for other variables.
Protective determinants of MMR included access to water and sanitation (aRR 0.88; 95%
CI 0.82– 0.94), having a less corrupt government (aRR 0.49; 95%; CI 0.36– 0.66), and
higher total expenditures on health per capita (aRR 0.84; 95% CI 0.77– 0.92). Higher
fertility rates (aRR 2.85; 95% CI: 2.02– 4.00) were found to be a significant risk factor
for MMR.
Conclusion: Several key measures of a health system predict mortality in infants,
children, and maternal mortality rates at the national level. Improving access to water
2
and sanitation and reducing corruption within the health sector should become
priorities.
Background
A working definition of a health system, as proposed by the World Health Organization
(WHO) is a system “whose primary purpose is to promote, restore, or maintain health”
[1]. In 2007, with the purpose of promoting a common understanding of what a health
system is and action areas for strengthening health systems, the WHO developed a
framework composed of six building blocks of a health system: 1) health service
coverage, 2) human health resources, 3) health information systems, 4) medical
products, vaccines and technology, 5) health financing, and 6) leadership and
governance [2]. These building blocks aim to support a health system that can prevent,
treat and manage illness and to preserve mental and physical well-being for all
individuals equitably and efficiently, within a specified geographic area. Health system
activities range from direct service provision through clinics and hospitals to
community level prevention strategies and health education. Over the past decade there
has been renewed interest in the horizontal role of health systems in the promotion and
maintenance of health [3]. Additionally, the robustness of a public health system has
been highlighted as a necessary component to achieve the Millennium Development
Goals (MDG) [4, 5], however the indicators to measure health system strengthening are
less understood.
There is an on-going debate about global health ‘geometry’ of the vertical or horizontal
approaches to health as both have strengths and limitations [6-8]. Both private and
3
public systems can employ vertical and horizontal approaches to health care and
programming and some have even used the term ‘diagonal’ to describe combining the
two approaches to optimize processes and outcomes [9]. A notable trend is that private
organizations tend to have a more narrow focus and employ a more vertical approach.
For example, in many low-income countries (LIC), externally led, donor driven
projects have met with some success, especially with the establishment of care centres
for the treatment and prevention of HIV/AIDS, immunization coverage, TB control,
and Roll Back Malaria Campaigns, all typically considered a vertical approach to
health. These disease-focused initiatives are intensive, may avoid the bureaucracies and
inefficiencies of a national health system, and are typically implemented to either
respond to an emergency (as in the case of HIV/AIDS) or meet donor specific
requirements (such as vaccines through GAVI, the Global Alliance for Vaccines and
Immunizations). However, investments aimed at the overall strength and functioning
of a health system (i.e. horizontal approaches to health) are grounded in the expectation
that a functioning, efficient health care system will contribute most effectively to
improving the health of a population [10].
Although some countries have made substantial improvements in infant, child and
maternal mortality rates (IMR, CMR, MMR respectively) during the last century,
improvements have slowed and even reversed in some nations during the last few decades
[11]. An estimated 9.7 million children under-five die worldwide each year [12].
Additionally, mortality rates are highly variable across nations highlighting health
inequities and larger social and environment determinants that predispose some nations to
higher rates of mortality [13]. Differences in all-cause mortality rates across nations may,
in part, be explained by the strength and functioning of a national health system’s ability
4
to safe-guard health beyond the disease specific approach. Important funding agencies
such as the US Global Health Initiative, are now directing their financial contributions to
health system strengthening at the expense of disease focused initiatives, even though
validated indicators to determine and monitor health systems strength are not well
determined or understood [14]. We aimed to develop an exploratory analysis to examine
the strength of association between important public health endpoints (IMR, CMR,
MMR) and potential indicators of health system strength and functioning as theorized by
the WHO using publicly available data.
Methods
Data and variables
Variable selection was informed a priori by the WHO building block framework.
The goal was to select variables that could represent each of the 6 building blocks and
then to investigate how well they explain the variability in global mortality rates. All data
was publicly access so variable selection was constrained by data availability. Data on ten
indicators categorized into five of the six main building blocks of a health system as
outlined by the WHO, and four relevant demographic variables were used as explanatory
variables. Nursing and midwife density and physician density measured available human
health resources. Vaccines coverage was indicated by the percentage of children receiving
measles immunizations annually. Health service delivery was represented by the
percentage of the population with sustainable access to water and sanitation and the
percentage of births attended by skilled attendants. Health financing was assessed by
total, out-of-pocket, government, and private expenditures on health. The health finance
data was gathered from WHOSIS. They cite that all financial measurements are made
5
using the “International dollar rate [which] is a common currency unit that takes into
account differences in relative purchasing power annual average”.
Finally, The Corruption Perception Index, a metric designed to measure the perceived
levels of public sector corruption published annually by Transparency International, was
used to measure the governance and leadership category [15]. Although the CPI focuses
on perceptions of corruption rather than the actual extent of corruption, the index has been
assessed to be a reliable and consistent measure [16]. The final building block of a health
system is health information systems that can be captured by the presence of a functioning
surveillance system, however multinational data was not available for this building block.
Together these indicators act as a proxy representing the robustness of national health
systems to finance, staff, and provide health services to their citizens. Demographic
variables included fertility rate, national population growth, urban population growth, and
female labour force participation and were used to capture demographic heterogeneity
across countries.
We extracted all data from our prospectively maintained archive of publicly accessible
health statistics, named the Globally Accumulated health Indicator Archive (GAIA).
Source data for the outcome and explanatory variables originated from UN and WHO
data, with the exception of the CPI, which originated from Transparency International; all
publicly available sources. The outcome variables are based on 2008 data while the
explanatory variables were collected over a seven-year span from 2001–2008 using the
most recent data available. Of 192 UN member countries, 136 countries provided
sufficient data for the chosen variables. Eight of the 136 countries would have been
excluded due to lack of data on sustainable access to water. Rather than excluding these
countries, we assumed 95% value for Poland and Portugal and assumed 100% for
6
Belgium, France, Ireland, Italy, New Zealand, and the United Kingdom (the median value
for Australia, and Western European and North American countries). Without this
assumption the countries from Western and Southern Europe were under-represented.
Statistical Analysis
Descriptive statistics were used to display the dispersion of the outcome and
explanatory variables. A linear mixed effect model was chosen to account for the
natural geographic clustering of the countries according to UN sub–region
classification. In order to comply with the strict conditions of linear modeling, some
transformations were required. Each outcome required a logarithmic transformation.
Nursing and midwife density, total government spending, out-of- pocket expenditures,
government expenditures and fertility rate were transformed via logarithm. Measles
immunization and skilled birth attendants were dichotomized as 90% or more and
under 90% based on the scatter plot indicating a clear drop-off after 90%.
Multicollinearity was an issue as the variance inflation factors (VIF) was high for
government health expenditures. Upon removing government expenditures, the VIF
were moderate in size, reaching a maximum value of 6.21 when considering the full
model prior to model selection. Model conditions were assessed through analysis of
marginal and conditional residuals. Model selection was achieved by minimizing the
Akaike Information Criterion (AIC) while keeping all type III p–values for covariates
below 0.20. Unadjusted results consider the association between the outcome and each
explanatory variable individually. Adjusted risk ratios consider the association between
the outcome and an explanatory variable simultaneous to all variables selected in the
model. Variables selected in the multivariate models are considered the strongest
7
predictors because the non-selected variables are no longer informative with respect to
the outcome. All analyses were done by SK using SAS 9.1.3 [17].
Ethics approval for this project was not required because it uses publicly available data.
Results
The descriptive statistics for each of the outcome measures (IMR, CMR, MMR) and the
explanatory variables are included in Table 1. The median IMR across all nations was
21.5 deaths per 1,000 live births (IQR 10.0 – 60.0), median CMR was 24.5 deaths per
1,000 live births (IQR 11.0–80.0) and median MMR was 81.5 deaths per 100,000 live
births (IQR 26.0–350.0). The geographic classification of the 136 countries included in
this study is shown in Table 2. Of the 136 countries, 46 (33.8%) of the countries are
located in Sub-Saharan Africa; 39 (28.7%) in Asia; 25 (18.4%) in Europe; 21 (15.4%) in
Latin America and the Caribbean; 2 (1.8%) in North America; and 3 (2.2%) in Oceania.
The proportion of countries included in the model varies between regions, where over
80% of all Sub-Saharan countries are included but only 12% of Oceanic countries had
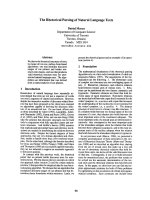
sufficient data available for inclusion in this model. The countries included in the analysis
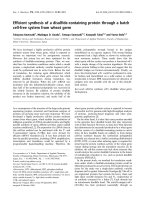
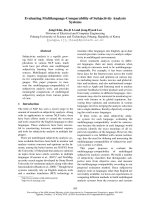
and the mortality rates are represented in Figure 1, Figures 2, 3, and 4 show the global
distribution of mortality rates in 2008.
All selected health system indicators were significantly associated with IMR at the
bivariate level except for population growth and female labour force participation, and
were therefore included in the multiple regression analysis. When controlling for the
effects of other variables in the model, four variables remained significantly associated
8
with IMR. Health system determinants associated with lower IMR are higher physician
density (adjusted rate ratio [aRR] 0.81; 95% CI 0.71–0.91), higher sustainable access to
water and sanitation (aRR 0.85; 95% CI 0.78– 0.93), and having a less corrupt
government (aRR 0.57; 95% CI 0.40– 0.80). Out-of-pocket expenditure on health (a-RR
1.29; 95% CI 1.03– 1.62) was associated with higher for IMR (see Table 3).
The same four variables that were significantly associated with IMR were also significant
for CMR after controlling for other factors (see Table 4). Higher physician density (aRR
0.80; 95% CI 0.70–0.92), higher sustainable access to water and sanitation (aRR 0.82,
95% CI 0.75–0.91), and having a less corrupt government (a-RR 0.58; 95% CI 0.40–
0.84) were associated with lower CMR. Out-of-pocket expenditures on health (aRR 1.29;
95% CI 1.01, 1.65) was significantly associated with higher CMR.
Finally, higher sustainable access to water and sanitation (aRR 0.88; 95% CI 0.82– 0.94),
having a less corrupt government (aRR 0.49; 95% CI 0.36–0.66), and higher total
expenditures on health per capita (a-RR 0.84; 95% CI 0.77– 0.92) were associated with
lower MMR. It should be noted that higher fertility rate (aRR 2.85; 95% CI 2.02– 4.00) is
a significant risk factor for MMR (see Table 5).
Interpretation
This ecological analysis explores how the WHO building blocks of a health system are
associated with infant, child and maternal mortality rates across 136 UN member
countries. Service coverage as measured by sustainable access to water is associated with
decreased mortality. Leadership and governance as measured by the corruption index (i.e.
less government corruption) are associated with decreased mortality.
Human health
9
resources as measured by physician density, and health financing as measured by less outof-pocket payments are associated with decreased mortality but only for infants and
children.
Stewardship is a neglected function in most health systems [18]. Murray & Frenck
(2000) have described health system stewardship as involving three key aspects “setting,
implementing and monitoring the rules for the health system; assuring a level playing
field for all actors in the system; and defining strategic directors for the health system as a
whole”. Currently there is no one metric to measure health stewardship at the national
level, we used the Corruption Index as a measure of national governance and a proxy for
health system stewardship because the general functioning of the government can strongly
influence stewardship and regulation. Corruption is broadly defined by Transparency
International as the misuse of public office for private gain [19]. As a result, our findings
are limited to corruption within the public sphere although we do acknowledge that
corruption is present in the private and non-governmental arena. In our study we have
found that the more corrupt a government is perceived to be (i.e. lower CPI score) the
stronger the association with increased rates of infant, child and maternal mortality.
As health systems are publicly administered and require strong national
commitment and resources, a corrupt government runs the risk of diverting public health
resources for private gains. Our findings suggest that transparent governance is an
essential component of health system strengthening and an important pathway to improve
population health. Three quarters of the countries in the world have a CPI score less than
five, translating to a serious level of corruption [20], as a result it has been recognized by
the UN that anti-corruption should be a central approach to global aid and development
10
[21]. Corruption is systemic and exists within and across scales and sectors of the
government and thus requires anti-corruption efforts that are both broad and sectorspecific. Private vertical programs are often fast and effective because they often operate
outside the public sphere, however an unintended consequence of this approach could be
enabling a cycle of corruption within the public sphere. Public health exists and is
implemented within the larger public system, and therefore must incorporate wherever
possible policies that buttress transparency among participating stakeholders from
multiple disciplines [22].
Sustainable access to water and sanitation was significantly associated with IMR, CMR
and MMR when controlling for other variables presumably for several reasons. Elevated
incidence and prevalence rates of diarrhoeal diseases are commonly observed in settings
with limited access to improved and sustainable water and sanitation services. Foreign aid
is associated with increased access to water, but not necessarily sanitation [23]. Waterborne diarrhoeal diseases alone account for 17% of deaths in children under-five and 1%
of neonatal deaths [12]. Other ecological level studies have also shown that MMR is
strongly associated with sustainable access to water and sanitation because access to safe
drinking water is a fundamental pillar for maternal health [24].
Unhygienic birthing
practices and facilities that are not properly equipped to provide a sterile environment for
a post-partum mother commonly contribute to elevated rates of maternal mortality.
Mothers who are unable to breast-feed are at risk of using unsafe water for formulafeeding especially in low income countries as a mode of prevention of mother-to-child
transmission of HIV [25].
11
Health financing was a central finding across all three models. Each financial variable
with the exception of private share of total health expenditure was significantly related to
mortality outcomes, but once we included them within the multivariate model out-ofpocket best explained IMR and CMR, and total health expenditure best describes the
MMR. This finding is not indicative that out-of-pocket is not important for MMR, or that
total health expenditure is not important for IMR and CMR, but rather that the model
selected the variable that described the strongest association. Out-of-pocket expenditure is
a commonly cited barrier to health care especially if out-of-pocket costs exceed household
income. In many African countries, the health financing system is too weak to function
without the cushion of out-of-pocket costs. In a study of 15 African countries
investigating household coping behaviours in the face of health expenditures, it was found
that between 23–68% of households would resort to borrowing and selling their assets
[26]. Households in this situation are often affected by both the cost of medical care, but
also the loss of income from sick family members that cannot work [26]. This contributes
to a highly inequitable system that puts infants and children at increased risk for adverse
health outcomes and death.
Although we cannot tell the temporality of this relationship, we observe that as per capita
spending on health increases mortality rates decrease. Others have shown that total health
expenditures is a significant predictor of IMR in their bivariate analysis, however, this is
no longer significant in the multivariate model, after including Gross National Income per
capita [11]. This was the same for our analysis and probably points to the larger influence
of a countries economic status (i.e. GNI) rather than the amount of funding earmarked for
health care.
12
Physician density significantly reduces infant and child mortality but does not appear to
reduce maternal mortality after controlling for other health system indicators, nor does
nursing and midwife density. There have been at least six cross-national studies that have
investigated human health resources, indicated by either physician or nurse densities as
predictors of infant mortality [4, 27-32]. Of these studies, four found no relationship
between human health resources while two of the more recent studies have indicated that
both physician and nurse densities are significant in accounting for variations in rates of
infant mortality across countries. Interestingly, Farahani et al. (2009) have shown, using
longitudinal panel data to examine both the short- and long-term effects of human health
resources, that human health resources may have greater long-term benefits than
previously estimated. We chose not to use an amalgamated measure (i.e. nurses, doctors,
skilled birth attendants) for human health resources and found that physician density was
significant yet nurse density and % of births with a skilled attendant was not significant.
This could be due to the fact that some countries only include professional nurses while
associate profession such as nursing assistants are not included [33]. This would underrepresent the role that nurses play in human health resources.
The MDG #6 was designed to improve maternal health because it is estimated that in
some areas of the world a woman has a 1 in 16 chance of dying in pregnancy. High infant,
child and maternal mortality are often observed concurrently with high fertility, however
only MMR was positively and significantly associated with fertility in our analysis. It is
widely supported that a high fertility rate is observed in settings where children are not
surviving and families need to replace the lost children. If a woman has had a
complication during a previous pregnancy or her health becomes compromised this can
13
lead to a vicious circle that puts mothers (and children) at risk for malnourishment and
health complications [34].
In 1990, The World Summit for Children called for a reduction in infant mortality to
below 70 deaths per 1000 live births (or a one third reduction if this resulted in a lower
mortality rate) by the year 2000 [12, 35]. This goal was attained by discouragingly few
nations; a failure that some suggest may be rooted in inadequate investments in health and
limited improvements in the strength and functioning of health systems [35]. Results from
our analyses show that more up-stream determinants such as sustainable access to water
and sanitation, health financing, and transparent governance are important pathways to
reducing mortality rates.
Health financing is not currently listed within the MDGs
however the latest WHO report [36] focuses exclusively on sustained economic and social
development to move towards universal coverage and improved health outcomes. Studies
such as this are needed to strengthen our current understanding of the role of health
systems as a societal safety net in achieving the MDGs and improving health worldwide.
Limitations
Several limitations should be considered when interpreting these results. Data selection
was constrained primarily by data availability and therefore does not include the most
comprehensive list of health system indicators. Our sample size (n=136 countries) also
constrains our choices for the number of variables that we can include in the model. As a
result we have a relatively small number of variables used to describe the variability and
complex nature of a health system. This study is a cross-sectional analysis at the country
level and therefore we cannot draw causal inferences from the results. As we have used
countries as the unit of analysis, this does not provide any information about variation
14
within the nation state. This is an important point to stress because health status
throughout a country may vary tremendously and these differences will be masked by
country-level data.
While many studies have controlled for female education as an
important variable related to infant mortality, we did not include this as an explanatory
variable because the data was not adequately populated [11]. In place, we used the
indicator for female labour involvement. While our study focused on outcomes of
maternal and child health we recognize that men are one of the highest risk groups for
early mortality, yet are not the focus of any large directed funding initiatives, with the
possible exception of male circumcision [37].
Conclusion
In conclusion, our analysis identifies the importance of several key indicators of health
system strength and functioning that are significantly associated with infant, child and
maternal survival at the national aggregate level and after controlling for other health
system determinants and demographic factors. The strength of a health system offers an
important and sustainable mechanism to influence key population level indicators of
health. There is now an important need to understand indicators of health system strength
at the local level and how to improve health system strength and functioning in practice.
15
Competing interests
No authors have any competing interests.
Ethics
Ethics approval for this project was not required because it uses publicly available data.
Authors' contributions
K.A.M., L.P.G. and M.N. contributed equally to the drafting, interpretation and
incorporation of critical feedback from co-authors. S.K. conducted the statistical
analysis and assisted with interpretation. E.B, R.S.H. and E.J.M. supervised, drafted,
and provided critical feedback at all stages of the manuscript. All authors read and
approved the final manuscript.
Acknowledgements
The authors would like to acknowledge Erin Ding, Anya Shen, and Christopher AuYeung for contributions to the preliminary analysis. No funding was received for this
work, no funding bodies played any role in the design, writing or decision to publish
this manuscript.
16
References
1.
WHO: World Health Report: Health Systems Improving Performance.
Geneva, Switzerland 2000.
2.
WHO: Everybody's Business: Strengthening Health Systems to Improve
Health Outcomes. pp. 44. Geneva: World Health Organization; 2007:44.
3.
Leipziger D, Fay, M., Wodon, Q., Yepes, T.: Achieving the Millennium
Development Goals. World Bank Policy Working Paper 2003, 3163.
4.
Farahani M, Subramanian, S.V.: The Effect of Changes in Health Sector
Resources on Infant Mortality in the Short-run and the Long-run: A
longitudinal econometric analysis. Social Science & Medicine 2009, 68:19181925.
5.
UN: UN Millennium Project: Who's Got the Power? Transforming health
systems for women and children. Summary version of the report of the Task
Force on Child Health and Maternal Health 2005.
6.
Levine R: Should All Vertical Programs Just Lie Down? Centre for Global
Development 2007.
7.
Mills A: Vertical vs. Horizontal Health Programmes in Africa: Idealism,
pragmatism, resources and efficiency. Social Science & Medicine 1983,
17:1971-1981.
8.
Elzinga G: Vertical-Horizontal Synergy of the Health Workforce. Bulletin of
the World Health Organization 2005, 83:242.
9.
Ooms G, Van Damme W, Baker BK, Zeitz P, Schrecker T: The 'Diagonal'
Approach to Global Fund financing: A cure for the broader malaise of
health systems? Globalization and Health 2008, 4:1.
17
10.
De Savigny D, Kasale, H., Mbuya, Reid, G.: Fixing Health Systems (2nd
Edition). 2008.
11.
Schnell CO, Reilly, M., Rosling, H., Peterson, S., Skstrom, A.M.:
Socioeconomic Determinants of Infant Mortality: A world-wide study of
152 low-, middle-, and high-income countries. Scandinavian Journal of
Public Health 2007, 35:288-297.
12.
UNICEF: The State of the World's Children. New York, NY, USA 2009.
13.
Marmot M: Achieving health equity: From root causes to fair outcomes. The
Lancet 2007, 370:1153-1163.
14.
PEPFAR: Health System Strengthening
[ />
15.
Transparency International: Global Corruption Report.
2010, (accessed November 20, 2010).
16.
Ko K, Samajdar A: Evaluation of International Corruption Indexes: Should
we believe them or not? The Social Science Journal, 47:508-540.
17.
Littell RC: SAS for Mixed Models. SAS Institute Inc 2006.
18.
Murray CJL, Frenk J: A Framework for Assessing the Performance of
Health Systems. Bulletin of the World Health Organization 2000, 78:717-731.
19.
Transparency International: Corruption Perception Index 2010. 2010.
20.
Paldam M: The Cross-Country Patterns of Corruption: Economics, culture
and the seesaw dynamics. European Journal of Political Economy 2002,
18:215-240.
21.
UN: United Nations Convention Against Corruption. United Nations; 2004.
22.
Vian T: Review of Corruption in the Health Sector: Theory, methods and
interventions. Health Policy Plan 2008, 23:83-94.
18
23.
Botting MJ, Porbeni EO, Joffres MR, Johnston BC, Black RE, Mills EJ: Water
and Sanitation Infrastructure for Health: The impact of foreign aid. Global
Health 2010, 6:12.
24.
Alvarez JL, Gil R, Hernandez V, Gil A: Factors Associated with Maternal
Mortality in Sub-Saharan Africa: An ecological study. BMC Public Health
2009, 9:462.
25.
Piwoz E, Ross, J.S.: Use of Population-Specific Infant Mortality Rates to
Inform Policy Decisions Regarding HIV and Infant Feeding. Journal of
Nutrition 2005, 145:1113-1119.
26.
Leive A, Xu K: Coping with Out-of-pocket Health Payments: Empirical
evidence from 15 African countries. Bull World Health Organ 2008, 86:849856.
27.
Anand S, Barnighausen, T.: Human Resources and Health Outcomes: Crosscountry econometric study. Lancet 2004, 364:1603-1609.
28.
El-Jardali F, Jamal, D., Abdallah, A., Kassak, K.: Human Resources for
Health Planning and Management in the Eastern Mediterranean Region:
Facts, gaps and forward thinking for research and policy. Human Resources
for Health 2007, 5:9-20.
29.
Hertz E, Hebert, J.R., Landon, J.: Social and Environmental Factors and Life
Expectancy, Infant Mortality and Maternal Mortality Rates: Results of a
cross-national comparison. Social Science & Medicine 1994, 39:105-114.
30.
Kim K, Moody, P.: More Resources Better Health? A cross-national
perspective. Social Science & Medicine 1992, 34:837-842.
19
31.
Kruppa K, Madhivanan, P.: Leveraging Human Capital to Reduce Maternal
Mortality in India: Enhanced public health system or public-private
partnerships? Human Resources for Health 2009, 7:18-25.
32.
Robinson J, Wharrad, H.: Invisible Nursing: Exploring health outcomes at a
global level. Relationships between infant and under-5 mortality rates and
the distribution of health professionals, GNP per capita, and female
literacy. Journal of Advanced Nursing 2000, 32:288-297.
33.
Adams O, Buchan J, M.R. DP: Human Resources for Health (internal
document), . In Department of Health Services. Geneva: World Health
Organization; 2003.
34.
Zakir M, Wunnava, P.: Factors Affecting Infant Mortality Rates: Evidence
from cross-sectional data. Applied Economic Letters 1999, 6:271-273.
35.
Black R, Morris, S., Bryce, J.: Where and Why are 10 million children dying
every year? Lancet 2003, 361:2226-2234.
36.
WHO: The World Health Report 2010: Health system financing: the path
to universal coverage. (WHO ed. Geneva: WHO; 2010.
37.
Wakabi W: Uganda Steps up Efforts to Boost Male Circumcision. Lancet
2010, 376:757-758.
20
Figure legends
Figure 1. Countries included in analysis (n=136).
Figure 2. Infant mortality rate per 1000 live births across countries (n=136).
Figure 3. Child mortality rate per 1000 live births across countries (n=136).
Figure 4. Maternal mortality rate per 100,000 live births across countries (n=136).
21
Tables
Table 1. Descriptive statistics for all outcome and explanatory variables sub-divided
into the WHO framework for the building blocks of a health system (n= 136 countries)
Variables
Outcome
Infant mortality rate (per 1,000 births)
Child mortality rate (per 1,000 births)
Maternal mortality ratio (per 100,000 births)
Explanatory
I. Human health resources
Nursing/midwife density (per 10,000
population)
Physician density (per 1,000 population)
II. Health service coverage
% Of population with sustainable access to
water and sanitation
% Of births attended by skilled staff
III. Medical products, vaccines and technology
% Measles immunization coverage
IV. Health financing
Total health expenditure per person (USD)
Out-of-pocket expenditure on health (as a %
of total health expenditure)
Government health expenditure (USD)
Private share of total health expenditure (%)
V. Leadership and governance
Corruption Index
Demographic variables
Fertility rate (average number of children
per woman)
Population growth value (annual %)
Urban population value (annual %)
Female labour force participation (%)
Median (IQR)
Range
21.5 (10.0 – 60.0)
24.5 (11.0 – 80.0)
81.5 (26.0 – 350.0)
2.0 – 165.0
3.0 – 257.0
3.0 – 1400.0
18.5 (7.0 – 51.0)
2.0 – 158.0
11.0 (2.0 – 25.0)
0.3 – 64.0
87.50 (59.0 – 98.5)
24.0 – 100.0
93.0 (57.0 – 100.0)
6.0 – 100.0
91.0 (79.0 – 97.0)
23.0 – 99.0
153.0 (35.5 – 441.0)
33.1 (19.8 – 48.4)
4.0 – 6714.0
4.2 – 82.7
148.0 (41.0 – 457.5)
44.8 (27.9 – 58.5)
4.0 – 3074.0
9.3 – 83.6
3.0 (2.4 – 4.5)
1.3 – 9.4
2.5 (1.8 – 4.1)
1.2 – 6.6
1.42 (0.72 – 2.29)
2.23 (1.16 – 3.35)
59.8 (48.5 – 68.1)
-1.17 – 5.32
-1.02 – 5.90
14.9 – 90.2
Legend: Lower value of Corruption Index on a scale of ten indicates higher perceived corruption
22
Table 2. Descriptive classification of the study countries (n=136 countries)
Region
Africa
Asia
Europe
Latin America and the
Caribbean
North America
Oceania
Total
N (%)
46 (33.8)
39 (28.7)
25 (18.4)
21 (15.4)
2 (1.5)
3 (2.2)
136 (100.0)
Total number of countries by region, %
included in the analysis by region
57 (80.7)
50 (78.0)
51 (49.0)
48 (43.8)
5 (40.0)
25 (12.0)
236
23
Table 3. Linear mixed effect regression analysis results for IMR, 2008 sub-divided into
the WHO framework for the building blocks of a health system (n=136 countries)
Explanatory Variables
I. Human health resources
Nursing/midwife density (per 10,000
population)
Physician density (per 1,000 population)
II. Health service coverage
% Of population with sustainable access to
water and sanitation (for a 10% increase)
% Of births attended by skilled staff
III. Medical products, vaccines and technology
% Measles immunization coverage
IV. Health financing
Total health expenditure per person (USD)
Out-of-pocket expenditure on health (as a %
of total health expenditure)
Government health expenditure (USD)
Private share of total health expenditure (%)
V. Leadership and governance
Corruption index (log of)
Demographic variables
Fertility rate (average number of children per
woman)
Population growth value (annual %)
Urban population value (annual %)
Female labour force participation (%)
Unadjusted Risk Ratio
(95% CI)
Adjusted Risk
Ratio (95 %CI)
0.82 (0.71, 0.94)
–
0.72 (0.63, 0.83)
0.81 (0.71, 0.91)
0.74 (0.68, 0.80)
0.85 (0.78, 0.93)
0.28 (0.20, 0.39)
–
0.71 (0.52, 0.98)
–
0.74 (0.67, 0.82)
1.60 (1.28, 2.01)
–
1.29 (1.03, 1.62)
0.65 (0.58, 0.71)
1.01 (1.00, 1.02)
–
–
0.37 (0.26, 0.53)
0.57 (0.40, 0.80)
3.07 (2.04, 4.62)
–
1.20 (1.01, 1.43)
1.26 (1.12, 1.43)
1.00 (0.99, 1.01)
–
–
–
Legend:
– : Not selected in final model
CI: Confidence interval
A Risk Ratio below 1 corresponds to a protective variable
A Risk Ratio above 1 corresponds to a risk factor
24