SURGICAL OPTIONS FOR THE TREATMENT OF HEART FAILURE - PART 6 potx
Bạn đang xem bản rút gọn của tài liệu. Xem và tải ngay bản đầy đủ của tài liệu tại đây (1.59 MB, 20 trang )
96
J-D:
Hosenpud et at
74.0%
41
A%
\A%
17.3%
7,2% 50.4%
3,6%
3,7%
61-
<1
Ys
1-5 Years
i45Years
•CongBnital BOlhet •Myopathy OReTK
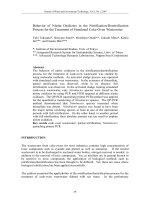
Figure 6. Pediatric heart transplantation indications by
age.
Rett = Retransplantation.
cardiomyopatliy and patisnts with coronarv' lulery disease. Figures 5 and 6 present tlie
indications for pedia.tnc heart tra.nspIantation (age < 16 years), first a.s overall uidications,
indications by yeai- for the two major indications, and finally indications by age of Ihc
recipient. Congenital heait disea-se is the most common indication for transplantation
in.
the
pediatric population and has been since 1989, As anticipated, congenital heart disease
makes up close to 75% of the transplan^iations in the less than
1
year age group, 3'et less
than 30% m the older aged children.
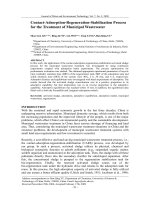
Figure 7 presents tie actuarial suri'ival rate after heart transplantation over a 13^yeai-
penod. 'Die overall
1-ycar
siu-^ival rate for heart transplantation is
79%.
The patient
V2
lite
(time to 50% sim'ival) is 8.7 years and m those surviving tlie firet year, the patient
V2
He is
11.4 years. The falloff
in
sur\'ival is almost a straight luie
firom
year
1
through 14. witli a
constant mortality rate of
4%
per year.
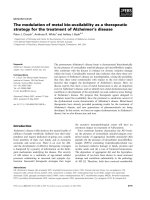
The next .series of figiu'es represent actumal sur>;ival rates for
yeai"
of transplantation,
recipient age, and retransplantation. Figure 8 demonstjates
5-year
actuarial son-ival rates
over the past
] 7
yeai's broken down
m
,3-ycar time blocks. There was a substantial increase
in more recent patients, compared with those who underwent transplantation
fi^oin
1980 to
1985.
There is a marginal but statisticahy significant fuitlier increase in survival rates
comparmg tic last 5 years of the 1980s with patients who imdeweiit transplantation from
Haif-lif8=8,7 yrs
Ccnd,
tialf-llfe=11,4yre
7 8 8 10 11 12 13 14
Years Post Transplantation
Hgnre 7. Total heart transplantation actuarial survival.
Registry ofint 1 Soc. for Heart & Lung Transplantation: 15'" Official Report '98 97
100
90
80
70
60
50
40
•'^'Sj-
1980-1985 Ha)f4ife=5.3 yrs
1986-1990 ttalfnife=8.8yrs
1991-1997 Half-life=9.4yrs
""-5JJI»imjjj„
i80-85vs 86-90: p=<,0001
•'-"
*' "•
p=<.OI)Of
p=<.0001
i80-85vs 91-97:
86-90 «s 91-97:
0
5 10 15 20 25 30 35 40 45 50 55 60
Months Post Transplantation
• 1980-1985
»
1986-1990
»
1991-1997
N=2,207 N=-,2,80! N=2:,97-;
Figure 8. Aduh hean transplantation actuarial
f-annval
by era
Monttis Post Transplantation
• <45 Years
u
4S-54 Years
-+
55-64 Years
•»
>=65 Years
N=mi95 N-12 769 N=12.J86 N=1
291
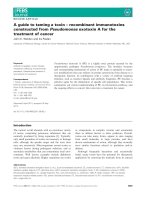
Figure
f.
Adult heart transplantation actuarial survival by age.
0
6 12 18 24 30 36 42 48 54 60
ivionths Post Transplantation
+ Retransplant < 9 MO
»
Retransplant > 9 MO
o
Overall Retransplants
N=484 N=415 N=899
Figure IS. Adult heart retransplanlation actuarial survival
98 J.D. Hosenpudetal.
3? 100
03
>
d
-:
rn
r
ID
TO
k_
to
0)
>
an
tjO
40
20
I 40-^
T
+
I4±n
3^
7-12 13-24 25-36 37-48 4a«) 61-84 85+
Inter-transplart interval (months)
Figure 11. Adult heart retransplanlatton !-year survival by interval from first transplantation.
1991 onward. Figure 9 demonstrates actuarial survival rates broken down by recipient age
group. There is a statistically significant decrease in survival for each increase in decade
of life, with a clinically significant decrease in those patients over age 65 years The
actuarial survival rate for adult retransplantation is displayed in Figures 10 and 11. Figure
10 presents 5-year actuarial survival rates for those retransplantations done within and
beyond 9 months after the initial transplantation. Figure 11 presents the average (± 95%
confidence intervals)
1
-year survival rate depending on the interval between first and second
transplantation. As can be seen, there is a progressive increase in survival rates with
increased time between operations. Those patients who underwent transplantation after 2
years have
1-year
survival rates of approximately 70%, still lower than priman
transplantation.
Tables I and
11
show multivariate logistic regression analyses for adult cardiac allogratt
recipients perfonned on all patients in the Registry having complete data. In this analysis,
the end points are
1
-
and 5-years survival rates. As has been previously shown in prior
Registry reports, the vast majority of risk factors known to affect
1
-year mortality persist at
the 5-year time point as a result of their profound effects early on. Recipient factors that
have a statistically significant negative impact include prior transplantation, requiring a
venU-icular assist device or ventilator support before transplantation, and increasing age
Recipient factors that have a positive impact include diagnosis of either coronan artery
disease or cardiomyopathy and ABO blood group A. Center factors that
are negative include low volume, and donor factors include increasing ischemic time, donor
sex, iuid age In this report (as with last year's report) donor and recipient age, as well as
ischemic time, were analyzed as a)ntinuous variables and dcTnonstrate a highly statisticalh
significant increasing risk with increasing values.
Figure 12 demonstrates survival rates after pediatnc heart transplantation overall
and
IS
broken down by age groups. The older age pediatric group has sur\ival rates
nearly identical to the adult population, whereas those with the worst outcome are less
than
1
year of
age.
Patients
1
to 5 years of
age
have intermediate survival rates
Registry
-oflnt
'I
Soc.
for
Heart
<S
Lung Tmnsplaniation:
15''^
Official Report
'98 99
Taile
1.
Risk
factors,
for
I-year
mortality
aftcsr adult heart
transplantation.
Variable
Odds ratio
95%'Confidenes
iniervat
p
Value
Negative recipient
factors
Ventilator
2.66
Repeat
Tx
2.33
VAD
IA<J
Ctrvol" :9TX/YR
1.3
Female,
donor
1.2'!^
Positive reeipiettt factors
AEO.iypsA
-0,9
CAD
0.79
CM
0.71
Isctieiiiic time linear
lschefnic'time:(0}
QJS
Ischeniictlme
(2)''
.0.93
Ischemic time (4)-
1.1 S
rseliemic time (6)'
1.
.43
rscliemic4'i!ae:(.S) .1 7S
Recip age (linear)
Recip
age.
20
0.S5
KecipageSO'
O.XS:
Recip.agc.40
0.8?:
Reeip age
50
1
Recip
age
50
1,19
Recip
age
70
1,5'
Donor
age
(linear)
Donor
age JO-
0\t9
'Donor
age \10 .0,9.9-
Donor
age 4.0'
1.18.
Donor
age
50
1 48:
Donor age'6Q
1.99
,2.20-3.2!
1,80-3.01
1.23-1,SO
1 15-1.47
1.11-1,33
0,83.0:9S
fl.8-8-0.93
0.:60-0.83
0.67-0.83:
0.90-0 95
1.09-1.22
1.25-1.64
1.43-2.22
0.'69-1.06:
0.76-0.94
0.85-0.93
LOW.OO
.1.11-1.27
•1.26-1,?<)•
0.84-0:95
0.99-1,00
1 14-1.22
1.34-1.64
159-2.48
0 0001
0 01^01
onooi
0
0001
0 OOOI
OOl
0
005
(.IHIiIl
0 CIIJOI
<a.ooo;l
•<0.0001
T%^Jransplantation'^
VAB,
V^asmlar
CM,
•cnrdiomyffpaihy^
Recip,
mapient.
device;
Ctr
viA,.Gmter
volsira^,.CAD,
comnnry-artery dh^me.
l<1
vs6 15
p='f»00!
1.
18 i4 30 3o 42 4'J
Months Post Trahsplantalion,
-•••<1Yea.r
-u
.1-5 Tears ©:.S 15Yea«.
»-Overall
N-=1.01-0-
N=71-8 N=!,2» l<J=3.,1319
Figure
12.
Pediatric heart (rampkmtalkm 'actuarial 'mtvivai by
age
100 J.
D.
Hosenpud et al.
Table 2. Risk factors for 5 year mortality after adult heart transplantation
Variable
Repeal Tx
Ventilator
Ctr vol 9 Tx,yr
Female donor
Ischemic time (linear)
Ischemic lime (0)
Ischemic time (2)
Ischemic time (4)
Ischemic time (6)
Ischemic time (8)
Recip age (linear)
Recip age 20
Recip age 30
Recip age 40
Recip age 50
Recip age 60
Recip age 70
Donor age (linear)
Donor age 20
Donor age 30
Donor age 40
Donor age 50
Donor age 60
l>onor age 60
Odds ratio
3.08
1.78
1.29
1.15
0.77
0.94
1.13
1.37
1.66
1.21
0.99
0.93
1
1.22
1.71
0.89
0.99
1.19
1.53
2.21
2.21
95%
Confidence interval p Value
2.34-4.05
1.40-2,27
1.14-1.47
1 04-1.28
0.68-0.88
0.91-0.97
1.06-1.21
1.17-1.60
1.29-2.13
0.97-1.51
0.89-1.10
0.89-0.97
1.00-1.00
1.10-1.31
1.40-2.09
0.83-0.94
0.99-1,00
1.14-1.25
1.34-1.76
1.57-2.82
1.78-2.75
0.0001
• 0.0001
0.0001
0.006
0.0001
0.0001
0.0001
Tx. Transplanlatwn. Ctr vol. center volume. Recip, recipient
' 9.536
Tables III and IV demonstrate the multivariate logistic regression analysis of risk at
1
and
5 years for pediatric heart transplantation. Similar to the adult population, repeat
transplantation, ventricular assist device, and ventilator mechanical support carry the
greatest risks. Other risk factors include very young age, congenital heart disease, low
center volume, and donor age Interestingly, recipient age risk m the pediatric population
is also linear, but in this ca.se, the risk is inversely correlated to age At 5 years, recipient
age is no longer a nsk factor, but recipient se.x (female) becomes one
In this year's report, morbidity' data at both
1
and 3 years are presented The data set
for these analyses include worldwide data from 1994 onward (US data only for
employment status). Figures 13 and 14 demonstrate the acti\ity levels and employment
status of paticiits 1 iind 3 years after transplantation. Most of the patients are considered to
have no limitations in function, yet less than 40% are working (does not include those
retired).
Figure 15 demonstrates the percent of patients requiring hospitalization alter the initial
transplantation, with approximately 18% still requiring a hospitalization between the second
and third years after tran.splantation
Figures 16 to 18 outline incidences of other morbid conditions in the first 3 years after
tran.splantation, including drug-treated hypertension, renal dysfunction, drug-treated
Registry of bit
1
Soafor Heart A Lung Transplantation:
15'"
Official Report '98 101
Table 3. Risk factors for
1
year mortality in pediatric heart transplantation
Variable
Odds ratio
95%
Confidence interval
p Value
Retransplmt
lABP/VAD
Ventilator
Congenital
Ctr vol <9 Tx,'>T
Becip age (linear)
Recip age 0
Recip age 3
Recip age 6
Recip age 12
Recip age 17
Donor age (quadratic)
Donor age 0
Donor age 10
Donor age 20
Donor age 30
Donor age 40
Donor age 50
2.55
2.54
1.5
1.41
1.36
1.39
1.2
1.03
0.75
0.58
1.08
1
1.07
1.33
1.89
3.11
1.44-4.51
1.17-5.51
1.24-2.0C
1.10-2.80
1.08-1.71
1.21-1.61
1.11-1.29
1.01-1.04
0.67-0.85
0.46-0.73
1.03-1.13
1.00-1.00
1.02-1.12
1.10-1.60
1.24-2.87
0.87-7.86
<0.0001
0.02
0.0003
0.006
0.009
<0.0001
0.003
lAWjMraaomc balloon
pump;
VAD, vmcular assist
device-,
Ctr vol, cenler
volume;
Tx, transplantation; Recip, recipient
II = 20113,
Table 4, Risk factors for 5 year mortality after pediatric heart transplantation.
Variable
Odds ratio
95%
Confidence interval
p Value
Retranisplant
Ventilator
Diagnosis-cong
Female recipient
Donor age (quadratic)
Donor age 0
Donor age 10
Donor age 20
Donor age 30
Donor age 40
Donor age 50
3.21
1.47
1.36
1.31
1.08
1
1.08
1.34
1,95
3,28
1.40-7.35
1.08-2.01
1.03-1.79
1.00-1.71
1.01-1.15
1.00-1.00
1.01-1.15
1.04-1.7.1
1.10-3.45
1.19-9.0S
0.006
0.02
0.03
0.05
0.03
,
congemtal;
n~
i
063.
93.5%
1.4%
8.5%
O.B%
5 8%
1 Year Followup
3 Year Follovjup
•
No
Activity Limitations nPerforms witli Assistance •Total Assistance
Figure
13.
Heart transplant recipient functional status.
102 /.
D.
Ilosenpud et al.
47.1
39J ^-'A
1 Year Followup 3 Year Followup
•Working Full Time S Working Part Time
a
Not
Working
HI
Retired
Figure
14.
Heart transplant recipient work status.
5-
i
:::•:•
. •
1 Year Followup
mi'/-
•
7.1%
4.8%
"if:.
;::iE"
•••:::••••::•}?:::
3 Year Followup
•
No
Hospitalization •Hosp., NoiRei ,'Not liifect. THosp, Rejection
•
Hosp,
Infection •Hosp,
Rej
+Infect
Figure 15. Rehospifabzation after heart transplantation.
HTN
No
33.7%
Yes
66.3%
No
29.7»/.
Yes
70.3%
Renal
Dysfyni
o°*
•No Rsnai •ZJysfunclion IHHenal Dysf iliJCreatnine >?.5mg/dl •Cnronic Datv'sss
Figure
16.
Hyperten-iiot:
and renal dysjunction after heart transplantation. HTN. hypertension
Registry of Im'l Soc. for Heart & Lung Tmmplantaimn: 15* Official Report '98 103
Hyperiipder
Ni
64.1
Diabetes
«
^"J
"^
•^M"-
s,1.^|
P
Yes
45.6%
16
SK
r
Figure 17. Hyperlipidemia
and
diabetes after heart transptantation.
Malignancif
No
96.3»,-,
1 Year Foilowu,
^^^
No JIIM
92
4¥
IIIIIIJ^^
3 Year Foitowup illlllP'
licA
?.(.•••
.
1 !1
Yes
3
7%
0! •
••=; ••
25 •••••
•
Lynip'l
NotRe-pora
'
5.0%
1
Ves
FigMi-e 18. Malignancy after heart transplantation.
^WVear 1 llYiSar
3
^^^_
1
•
;
:i4.9%
1-
1 51.7%
-
\
\ \
r//
Hgure 19. Maintenance immunosuppression after heart transplantation.
104 J.D. Ilosenpiid et
at
Muitio
• , •••••• •••••••• ••' ^^*^^'
Other.Cardiac
31 Days-1 Year
•• • • •.•• •
•.;ardiac
CAl
Lymphom
Malig,
C -
1+ Year
Figure 20. Heart transplantation cause of death by time after tramplantation.
CMV, Cytomegalovirus, CAV, cardiac allograft myopathy.
hyperlipidemia, drag-treated diabetes, and malignancy. Figure 19 demonstrates the
inaiBtenance itninimosuppression in the population. An increasing number of patients are
being treated willi tacrolimus or mycophcnolatc mofetil, and more than
75%
of patients arc
still on corticosteroids at
3
years after transplantation.
Figure 20 demonstrates the causes of death after heart transplantation (both adult and
pediatnc) at three different time points with the entire data set. Early after transplantation,
nonspecific graft failure accounts for the largest proportion of
deaths.
In the mtennediate
penod, there is an approximately equal representation by aeute rejection and infection. Late
after transplantation the most common causes of
death
are cardiac allograft vasculopathy,
malipancy, and, interestingly, acute rejection. The other categoiy is made up of listed
diagnoses not fitting into die more common categories.
>
Figure
21.
Heart-lung transplantation volumes and donor age
hyyear.
Registryof Int'lSoc. for Heart & Lung Transplantation:
15'^'
Official Report '98 105
50
S
I 40
'a.
£ 30
H 20
^^
O
^ 10
0
>1 1-5 6-10 11-17 18-34 35-49 50-64
Age
Figure 22. Age distribution of heart-lung transplant recipients.
Heart-Lung Tranplantatioii
Figure 21 shows tlie number of heart-lung trasnplantations reported to the registrv' from
1982 to 1997 and the average donor age over this period. The number of heart-lung
transplantations peaked in 1989 and has dechned thereafter. Similar to heart,
transplantation, donor age has continued to
ri.se.
Figure 22 demonstrates the age distribution
for heart-lung transplantation, with clustering between 18 and 49 years.
Figure 23 demonstrates the indications for heart-lung Iran.splantation in the adull
population. The three most common indications are pulmonar}' hypertension, congenital
heart disease, and cystic fibrosis.
The 11-year actuanal survival rate for heart-keg transplantation is demonstrated m
Figure
24.
The
1
-year siir\'ival rate is approxmiately
60%,
whereas tlie
11
-year .survival rate
IS
21%.
The survival
Vi
life for the entire curve is 2.6 years because of
the
high first-year
mortality rate. The conditional Yi life for those sun-iving the first year is more than 8.4
years.
Tables V and VI demonstrate the multivariate logistic regression analysis of
lital 27,7%
PPH 25,9'
,1A 2,3%
ipp 2.' nnphysema 3,8%
ReTx 2.8"/
X., 15.6%
Misc 19.2%
Figure
23.
Heart-lung transplant indications. PPH, Primary pulmonary hypertension; AI,4, alpha,,
antitrypsin: C¥. cystic fibrosis, MeTx, reinmsplantation, IPF, idiopathic pulmonary fibrosis.
106 J.D.
Hosenpud
et al.
0
Half-life=2.6 yrs
Cond.
half-life=8.4 yrs
1 2345 6789 10 11
Years Post Transplantation
Figure 24. Heart-lung transplantation actuarial survival.
Table 5 Risk factors for
1
year mortality after adult heart-lung transplantiition
Variable
Odds ratio
95%
Confidence interval p Value
Repeat Tx
Ctr vol 5 T»VT
Donor age (linear)
Donor age 20
Donor age 30
Donor age 40
Donor age 50
Donor age 60
5.07
1.9
0.85
1.09
1.39
1.79
2.29
1.25-2060
1,27-2.85
0.76-0.95
1.03-1.15
1 11-1.74
1.20-2.65
1,30-4.02
0.02
0.002
0.004
Tx. tratviplantation: Ctr vol, center volume.
n '.:7
Table 6. Risk factors for 3 year mortality in adult heart-lung transplantation
Variable Odds ratio
95%
Confidence interval p Value
Ventilator
Ctr vol 5 l\ \T
Donor age (linear)
Donor age 20
Donor age 30
Donor age 40
Donor age 50
Donor age 60
9
1.7
0.87
1.07
1 31
1.61
1.98
1.25-20.60
1.27-2.85
0.77-0.99
I.00-1.I4
1.02-1.69
1.03-2.51
1.05-3.73
0.01
0.02
0.03
<'tr vol, center volume. Tx. rmnspluniation-
11 432
Registry ofint
1
Soc.
for Heart & Lung Transplantation: /J* Official Report '98 107
Acute Reiediori
Tec:h/HemofTliage
lnfccl,Olhti
Irteciior"
^^j|£'
-• Rejector.
Bronchjoiitis
Mull.ofgan
iejector. ^^W__;.
' fnfection,
CI.W
0-30 DajfS 3^ oayg.^ year
^1^
Infectrcn
other h
CAV
Bronchicl'tis
1+ Year
Hpire
25.
Heart-lung transplantation cause of death by
lime
after transplantation.
CMV, Cytomagatovirus; Hrt, heart: CAV. cardiac allograft vasculaopathy
risk factors for
1 -
and
3-year
mortality after adult heait-lung transplantation. As shown m
previous Registry reports, being on a ventilator before transplantation and low center
volume continue to be statistically significant risk factors for death after heart-lung
transplantation. As was shown for heart transplantation, the risk according to donor age
increases as a continuous variable at both 1 and 3 years (Tables V and Vl)^ Figure 25
demonstrates the most common causes of death alter heart'4uEg transplantation at three
different postoperative iiiten'als. Early after transplantation, nonspecific graft failure,
infection and techiiicaMiemorrbagc factors account for a substantial majority of
the
deaths,
hi tlie intermediate time period, infection is tlie
pnmar}'
cause, and late atter transplantation,
infection and bronchiolitis obliterans are the pnncipal causes of death. CAV does account
for a small
mmorit}'
of
deaths
(3%) late after heart-lung transplantation.
Lung Transplantation
Although lung transplantation has enjoyed continued growtli through 1993, on the basis of
tlie past
3
years' data, this growth has clearly ceased, again
m
spite of the use of increasingly
older donors (Figure 26). The age distribution for lung transplantation is younger than for
heart or heart-lung transplant recipients, priraanly because of
its
use in the cystic fibrosis
population (Figure 27). Figure 28 demonstrates the pediatric lung and heart-lung
transplantation volumes over the past
14
years. Heart-lung transplantation seems to have
been largely abandoned in this patient population, \vhcreas pediatric lung transplantation
continues to occur at low but steady rates.
The indications for adult single limg transplantation continue to be dominated
praicipally by chronic obstructive pulnionaiy disease, whereas cystic fibrosis is the most
common indication for double/bilateral lung transplantation, as shown m Figure 29.
Idiopathic pulmonaiy fibrosis and primary pulnionan' hypertension arc also important
108 J.D.Hosenpiidetal
3 700
i J no
.i3
/o '- -".
^r.
'n /n ^f:
%,%
%>'%;%'%%
%-%\%^%%
fniBiiateral'l'-jubie Lung fisSingle Lung
Figure 26. Ijing tran;iplcmiaikm volumes and donor age hy year.
50
40
30
20
10
>1 I-5 6 0 11-17 13-34 35-49 50-64 >6E
Age
Figure 27. Age distnbuiion of lung recipiems.
20
0)
X
JJJIIIJJJJ^.
\%%%%%%%%%\%%%
Figure 2Ji. ''cdirjinc hcai
>-haig-hiny^
iroh^iptai'iiaiiim mLmber:', by age undyear.
Registry ofint
1
Soc.
for Heart & Lung Transplantation:
15'''
Official Report '98 109
Emphysema
44.1%
A1A ^IIIM
IPF ppH CF13J%
20.9%
.5.2%2^0%
Single Lung Bilateral/Double Lung
Fipire 29. Adult lung transplantation indications. AlA alpha, 'antitrypsin; Rets, retransplantation; CF,
cystic fibrosis, PPH, Primary pulmonary hypertension; IPF, idiopathic pulmonary fibrosis.
uidicatioiis for these procedures. The indications for pediatric limg and heart-lung
transplantation are shown overall and over time m Figure 30 and by the two priman' age
groups m Figure 31. Congenital heart disease, cystic fibrosis, and priinaiy pulmonary'
hypertension ai^e tlie principal indications. Interestingly, retransplantation is used much
more frequently in this age group than m adults.
The
7-year
actuarial sun,'ival rate for all lung transplantations (adult and pediatric) is
shown
m Figui-e
32.
There is no .significant diflerence in actuaiial survival companng single
lung to bilateral/double lung ti-ansplantation. with patient half times of 3.6 years and 4.5
years for single and double lung, respectively. For adult transplantation, there is a
Significant diflcircncc companng lung transplantation performed from 1988 tliixtugli 1990
compared with later years, but no further improvement after 1991 (Figure 33). Figure 34
demonstrates the effect of recipient age on survival. Patients aged 55 and older had a
significantly lower siin.'ival than younger recipients.
CF
.•.GENITAL
14.2%
1987 1988 1989 1990 1991 1992 1993 1994 1995 1996 1997
(•PPH
*CF •*Congenital
Figure M. Pediatric heart-bmg/lung transplantation indications and indications by year. CF; Cystic
flbrosi.r, PPH; primary pulmonary hypertension; ReTx, retransplantation.
110 /.£). Hosenpud et ah
6.0=.
lf :•
9.0%
34.:
i-5 Years
40.7%
6-15 Years
^Congenital UlReTx BOlher aPPH IIICF
Figure
31.
Pediatric hearl-bmg/lung tramplantation indications by
age.
ReTjs, retramphnlatiom PPH;
primary pulmonary hypertension; CF; Cystic fibrosis.
100 f"
Bilateral Lung Half4ife=4.5 yrs!
Sinale Lung Half:ie=Mjgg-'
All Lungs Half-life=3,7 yrs!
*^^^1
2 3 4 5 6 7
Yeara Post Transplantation
" Single Lung » Bilateral/Double Lung o All Lungs
N=4195 N=28a2 N=7021
Figure 32. Toto/ lung transplantation actuarial survival by procedure.
ri
18 24 30 36 42 48 54
Months Post Transplantation
-• 1988-1990 '1991-1993 ^1904-199?!
N=S62_
N=2.431 _ N=3,64S_ !
Hiure
33.
Tolai lung transplantation actuarial smvivai by era.
60
Registry'
of hit'I
Soc.
for Heart & Lung Tramplantation:
15'^'
Official Report '98 111
0 6 12 18 24 30 36 42 48 54 60
Months Post Transplantation
• <45 Years -• 45^-54 Years o 55I64 Years • >=65 Years i
lii=2,158
N-l,832
N=1,«S N=125
Figure M,.iduH huig iran.ipiamslion acmanai sun'jval by age.
Adult
I'jng
and hcaii-Iurig ti";iiiSj3lantation survivai rates are presented
m
Figure
liS-
I'lie
1-,
2-,
ami
3-yeiirs
acluaria! sun'ival rates for lung Iransplantation arc 45%, 37%,aiid 3!%,
respeclivcly. For heart-lung retransplantation the outcomes are even worse, with siir\'ival
rates of
33%
and 30% ai
1
and 2 years, respectively.
Tables VII and VIII present tlie results of
the
multivariate logistic regression analyses
for nsk factors for
1 -
and
5-year
mortality after limg tnmsplantatiorr iDdepeiidcnt prcdielors
of adverse oiucome at
1
year mciude ventilator support, retransplanuilion, diagnosis other
than emphysema, and recipient age. Witii an increased number of
patients
in tlie Registrv,
donor age is now identified as a significant ri.sk factor
m
iung transplantation, similar lo that
seen in heart and hcart-luog traasplaiiialioiL At 5 years otttcotncs arc predicted by
retransplantation, Linderlymg diagnoses, and recipient age.
Actuaiial sur\'ival for pediatric lung and heart-lung transplantation is sliown m Figure
36.
'fhcrc arc no .significaii! differences in outcomes between tliesc three procedures;
h.owcver, numbers in all groups are small. Table IX displays the multivariate analysis for
1
-year mortality after pediatric lung and heart-lung transplantation.
100
£
\
BO b ••,_ - ;
I *
- -'"^- •'
-' -—-^
:•;?•;;«-i^^^.,
20 . •
a
•
'
0 3 6 9 12 15 18 21 24 27 30 33 36
tvlonths Post Transplantation
^
• Lyng » Heart-Lung
i N=HO ,N=44
Figure iS. Adult heart-lung/hng transplantation actuarial survival
112 J
D.
Hosenpud et al.
Table 7. Risk factors for I-year mortality after adult lung transplantation.
Variable Odds ratio
95%
Confidence interval p Value
Ventilator
Retransplant
Diagnoses
Congenital heart
PPH
AlA
Emphysema
Female recip
Recip age (linear)
Recip age 20
Recip age 30
Recip age 40
Recip age 50
Recip age 60
Recip age 70
Donor age (quadratic)
Donor age 20
Donor age 30
Donor age 40
Donor age 50
Donor age 60
2.39
1.88
2.07
1.31
0.74
0.48
0.77
0.6
0.74
0.9
1.09
1.33
1.62
107
1
1.08
1.33
1.87
1.65-3.47
1.25-2.84
1.37-3.12
1.01-1.71
0.58-0.94
0.40-0.59
0.66-0.89
0.51-0,72
0.66-0.82
0.86-0.93
1.06-1.13
1.21-1.47
1.37-1.92
1.02-1.11
1.00-1.00
1.03-1.12
1.11-1.58
1.27-2.76
<0.0001
0.003
0.0005
0.04
0.01
<0.000I
0.0005
<0.0001
0.002
PPH, Pnmary pulmonary hypertension; AlA, alpha,-antitrypsin deficiency. Recip, recipient.
n
=
4237
Table 8. Risk factors for
5-year
mortality after adult lung transplantation.
Variable
Odds ratio
95%
Confidence interval p Value
Repeat Tx
IPF
AlA
Recip age (linear)
Recip age 20
Recip age 30
Recip age 40
Recip age 50
Recip age 60
Recip age 70
2.12
1.68
0.67
1.07
0.91
0.92
1.11
1.6
2.74
1.11-4.06
1.16-2.43
0.48-0.92
0.68-1.68
0.76-1.10
0.87-0.98
1.04-1.19
1.17-2.18
1.35-5.57
0.007
0.01
0.002
Tx, TninsplanUtion, IFF, idiopathic pulmonary fibrosis; AlA, alpha,-antitrypsin deficiency, Recip, recipient
n 1411
Table 9. Risk factors for
1
-year mortality after pediatric lung / heart-lung trzmsplantation
Variable Odds ratio
95%
Confidence interval p Value
Ventilator
Non-white recipient
Cold ischemic time
13.1
3.57
1.7
4.49-38.21
1.20-10.59
1.23-2
34
•
0.0001
0.02
0001
Regist}y ofhit'l
Sac.
for
Heart
<&
Lung
Tmnsplantation:-
IS*
Official
Report
'98
113.
30
36 42 48 54 BO
Wonlhs PoslTranspianfafion
I »Smgl6Llng
&
Heart-Lung
^.
Bilat/Oouble Lung.
L N?>2.
^ y;?*
'!i'23I
Fign»-M,Ferf«fric
hearl/'hearl-lung
•tmnsplantation acmanalsurvsmt ly procedure.
Independent risk facjtors include tlie requirement
far
mechanical ventilation before
transplan.tafion. (a
5.56-foM
risk), md. -ABO blood 'groups
of
both donor and recipemt
Given the verv' small numbers, the confidence
is
wide
in
these latter two factors, and
(he
predietive .ab.ility of
•these
factors needs confirmalion.
Figures 37 ,'md38 dem,on.strale the activity levels'and emplojinent stHtus of patients
1
and
3
years after transplantation-
A
slightly peater .percentage
of
pa.tieats. have
s:ome
limitations compared with those after heart transplantation, although' similar percentages
S2'.0<
:89,6'
4.2%
l; Year f oltowup
3
Year "^oilowup
:
>BNs Aotreity Limtetions •Psfformst with A^s-ssancs- •"^aW Ass'istanc.8
l1giire37,L«ng transplmtrecipiemjutwu tia' \t ij
8.2%'
.4:7%:
sg.
1 Year Foiiowup-
3'YBarFollowup
HWork'irig' Full Ti'me aWarking Part Time' ENot Working 'illRetired;
FigH-re
.3S,
isjig: transplam
'reeipient work
-stmuj;.
114 J.
D.
Hosenpud et al
4B.2»A
•17,3%
•:; 5.9%
J.J n ! 8"-'
g
L,
^
1 Ye.ir,' tllO*iij
',
tear Fnlicwjp
[ ]No HCspliallZlSl'i •HlSO fjot'd3i !(.itinVct t'HOSD
P^JgCt
3n
Figure
J'A/.Vii
ap
>ut
^.it^i
ttt •
i.h^t'iin
;ia«lHUT,
to leq^irt-
KJICJ<
ho^piylizafai after lartg luinsni mt'ition cicu ID ihe tliiid wai" alter
transj^IauUtion Im.n
%
4'J to i? show the pi
c-^
.ilcnce of
>
(mv^:
hui c.inMn
>ns
m the li: ^t
3 xej'-s dl*n U,ii,-,>!antdtu^n, agi'ii inc!>tduii_' dpig-tieaicJ h\ri-ri''nsi t. jenai i!\"lanelii!n,
(H»j;-luMtedhvfalil'jdentw itm^-tiearci! Jiibt-t^j .atdmaliguanc} isgtacJ; Jeniouvtialc-'
ihr rwirk-njnLC inimiuioMippressinn i:i the pupulatn'ii Tlie.'i. H a lirgc j>jnji^in<in nl
piitieiiis tox-r> itij tjcioiiotja
OUCT
kifig tiatiHpiJntalRin ^onipdtcd nitij hv rt d 'OTsf'kuit'iiioti
MTN
W, •
1 Ygpr -I
1
law ' 'fl 0,1*10
Oy^fonction IWlrfM'*
,,
,_^
r
•
MNa Renal 0ys%E!Ci « *"•. Dj ' „ < '^ts p ' r i Wvhr -> Ln^ =
Figure
4flA'>pertf.>5i£"!afi.t
" i;,!
!•
sti,p
,ioii
.<'ii'(
'.'.•>«
v
.rstZ-jsteftofniTf*,
Bypettemton.
Hfpeitip-flemla
i;
1 YaarFoliowup
Plabctss
8'
n%at-eAt. Hyperh^
., .No,
mm
•3
Ys
Yes
12,88.
.
Www.
Registry ofint
1
Soc^
for Hean & Lung Transplantation:
15'^
Official Report '98
115
Malignancy
95,2%
1 Year FoHowup
No
97.5%
57.5%
Yes
4.8%
Not Reportei
4.1%
Yea
"*
Oil-
20,
v"
3 Year Fallow.
Figure
42.
Malignancy after lung transplaniauon.
,2
w
a.
'o
I Year
1
MYsar
.0'4
Figure 43.Maintenance immunosuppression after lung transplantation.
f.i'ect.
OElw
Otner
CJ-
0-30 Days
if:ute ReiRctiori
achnicef
./HemorrSiage
-:
.
••••
.
Infe::
, •,' ;
Othei
31 Days-1 Year
htr Lung
.
. •, «her
1+Year
Figure
44.
Lung transplantation cause of death by time after transplantation.
CMV, Cytomegalovirus.