RESTORATION AND MANAGEMENT OF LAKES AND RESERVOIRS - CHAPTER 6 docx
Bạn đang xem bản rút gọn của tài liệu. Xem và tải ngay bản đầy đủ của tài liệu tại đây (357.02 KB, 16 trang )
6
Dilution and Flushing
6.1 INTRODUCTION
Dilution and flushing can achieve improved quality in eutrophic lakes by reducing the concentration
of limiting nutrient (dilution) and by increasing the water exchange (flushing) rate. Both processes
can reduce the biomass of plankton algae, by reducing the inflow concentration of limiting nutrient,
resulting in a decreased lake concentration, on which maximum biomass depends. By increasing
the water input the flushing rate is increased, which in turn increases the loss rate of plankton algae
from the lake. Dilution can be effective even when the increase in flushing rate is insufficient to
cause a significant loss of algae. On the other hand, flushing rate increase can cause a significant
loss without achieving a reduction in the limiting nutrient concentration. Other effects of dilution
are also possible, such as increased vertical mixing and a decrease in the concentration of algal
excretory products, which can influence the kinds and abundance of algae (Keating, 1977).
Dilution is usually feasible only where large quantities of low-nutrient water are available.
Treatment effectiveness is greatest when dilution water is low in limiting nutrient concentration
relative to that in the lake and its natural inflow. Lake nutrient concentration can be more effectively
lowered if dilution water is the dominant inflow. In some instances, improvements can be achieved
by adding water with moderate to high nutrient content, but these results are less certain than with
low-nutrient water, largely because lowering the lake concentration is more effective at reducing
biomass than washout.
Dilution and flushing have worked successfully in several lakes. Green Lake in Seattle, Wash-
ington, was improved markedly by adding city water, beginning in the 1960s (Oglesby, 1969).
Moses Lake in eastern Washington has received Columbia River dilution water on a regular basis
since 1977, resulting in substantial improvement in lake quality (Welch and Patmont, 1980; Welch
and Weir
,
1987;
Welch
et
al.,
1989,
1992).
Dilution
was instituted in three other lakes in Washington
State and was proposed for Clear Lake, California (Goldman, 1968). Lake Bled, Yugoslavia, was
flushed intentionally with water from the River Radovna (Sketelj and Rejic, 1966). Lakes Veluwe
and Donten in The Netherlands have been diluted with relatively low-P water during winter since
1979 (Hosper, 1985; Hosper and Meyer, 1986). Snake Lake, Wisconsin, was diluted by removing
the equivalent of three lake volumes, which allowed low nutrient groundwater to refill the small
seepage lake (5 ha, mean depth 2.3 m) (Born et al., 1973).
In what must be one of the world’s first lake flushing experiments, water was diverted from
Switzerland’s Ruess River to Rotsee in 1921 to 1922 to alleviate eutrophic conditions (Stadelman,
1980). The flushing rate of this 460-ha lake was increased from 0.33 to 2.5/yr (or about 0.1 to
0.7%/d) following construction of a canal between the Ruess River and the lake. The lake’s state
did not improve because the increased flushing rate was insufficient to significantly washout
biomass, and because of high concentrations of nutrients in the river water used for flushing. The
nutrients originated in sewage effluent from the upstream city of Luzern. There was still no
improvement following diversion of direct inputs of sewage effluent to the lake in 1933. There was
considerable improvement, however, after nutrient removal from Luzern’s wastewater, in the 1970s,
resulting in a tenfold P reduction in the Ruess River inflow water.
Following is a discussion of the theoretical basis for the dilution and flushing, reviews of the
Moses Lake, Green Lake, and Lake Veluwe cases and general guidelines for application of the
Copyright © 2005 by Taylor & Francis
technique. The latter includes quantity and quality of water, frequency of application, and project
and operating costs.
6.2 THEORY AND PREDICTIONS
Maintenance of low phytoplankton concentrations by high natural rates of dilution and flushing is
a commonly observed phenomenon (Dickman, 1969; Dillon, 1975; Welch, 1969). The mechanisms
involved in the control of nutrients and/or algal biomass in lakes are in many ways analogous to
those in continuous culture systems. When low-nutrient dilution water is added to a laboratory
continuous algal culture, the inflow concentration of limiting nutrient is reduced, the maximum
biomass concentration possible in the reactor vessel is likewise reduced, and at the same time
nutrients and algal biomass are more rapidly washed from the reactor vessel since the water
exchange rate is increased. Concentration of limiting nutrient is the critical variable that determines
algal biomass in many lakes, as well as in continuous culture systems. The in-lake nutrient
concentration may sometimes be more, but is usually less than the inflow concentration, because
sedimentation is greater than internal loading. However, increased rates of dilution/flushing will
theoretically reduce loss through sedimentation, as demonstrated by predictions using the Vollen-
weider equation (Figure 3.8), where at short detention times, the lake P concentration equals the
inflow concentration. That situation is most typical of reservoirs, which tend to have shorter
detention times than lakes and would, therefore, behave more like a continuous culture system with
algae (McBride and Pridmore, 1988).
To predict the response of a lake to the addition of low-nutrient water on a day-to-day or year-
to-year basis, without consideration of sedimentation or internal loading, the following “dilution only”
first order, integrated equation is useful:
(6.1)
where C
1
is the concentration at time t; C
i
is the concentration in the inflow water; C
o
is the initial
lake concentration; and ρ is the water exchange or flushing rate. This equation assumes the lake
is well mixed, that no other nutrient sources exist, and that the limiting nutrient or “percent lake
water” can be treated as conservative. Because this equation does not include a sedimentation term,
it is normally useful only in the short term as a tracer for nutrient behavior and under conditions
of rather large water exchange rates (several percent per day or more). However, in some instances
(e.g., Lake Norrviken, Figure 4.6) the response of lake nutrient concentration could follow a simple
dilution model if there were no retention of nutrient in sediments, i.e., sediment release equals
sediment uptake. In most instances, however, it could be used to estimate the potential for reducing
average lake concentrations with a given source of water, and the time necessary for that reduction.
Such predictions can be compared with the observed distribution of dilution water — as percent
lake water — indicated by a conservative variable, such as sodium or specific conductance. For
more realistic predictions, sediment–water interchange of nutrients must be considered. Equations
given in Chapter 3 are pertinent in that regard where flushing rate and external loading terms are
modified for the added dilution water.
Increased flushing has an indirect effect on lake P concentration, as shown with a Vollenweider
steady state, mass balance P model. Adding more water with lower nutrient content also increases
nutrient loading, while the resulting increased flushing rate decreases nutrient loss through sedi-
mentation (Uttormark and Hutchins, 1980). These processes could be counteracting the dilution
effect in some instances, because, as the authors stated, “a reduction in the influent concentration
tends to reduce in-lake concentration, but a reduction in phosphorus retention tends to increase in-
lake concentration.” They showed that a large increase in the combined flushing rate obtained by
adding low-nutrient water (40% of the normal inflow nutrient content) could theoretically increase
CC CCe
ioi
t
1
=+ −
−
()
ρ
Copyright © 2005 by Taylor & Francis
the lake nutrient concentration if the original flushing rate ρ is low enough, e.g., 0.1/yr. If the
flushing rate is relatively large (≥ 1.0/yr) initially, the effect of reduced sedimentation rate is
minimized and a reduction in lake concentration will result, but large quantities of water are
necessary. Of course, the amount of water needed to achieve a given reduction in inflow concen-
tration is a function of the concentration difference between the normal inflow and dilution water
source.
In an actual case, the effect of diminished sedimentation was not significant, but the effect of
dilution was reduced because of enhanced sediment release of P (Jones and Welch, 1990). Additions
of dilution water (plus normal inflow) to Parker Horn of Moses Lake, Washington resulted in
average flushing rates of 8%/d from April to September during 12 years of treatment. Based on a
calibrated and verified steady state, mass balance P model, where net internal loading of P was
indicated by a negative sedimentation rate coefficient (Equation 3.10), increased dilution water
input predicted a much more gradual reduction in lake P concentration than was expected from the
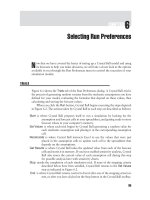
diluted inflow concentration alone (Figure 6.1). The minimizing effect of dilution water could not
have been caused by reduced sedimentation, because the lower curve of inflow concentration is
the highest possible lake concentration with no sedimentation.
6.3 CASE STUDIES
Two lakes where the dilution and flushing technique was implemented can be used as guides for
application elsewhere. Moses Lake lies in eastern Washington, and has a surface area of 2,753 ha
and mean depth of 5.6 m. Dilution water has been added to one arm of Moses Lake during spring
and early summer since 1977. Transport to previously undiluted portions of the lake, by pumping,
was begun in 1982. Green Lake, in Seattle, has an area of 104 ha and a mean depth of 3.8 m. The
lake received dilution water from the city domestic supply at relatively high rates from 1962 through
the mid 1970s, but inputs were subsequently variable resulting in worsening lake quality. The effect
of low-nutrient water was to dilute internal loading, the primary cause for summer algal blooms.
The cost and effectiveness of other, more reliable dilution-water sources and other controls on
internal loading were evaluated and alum (Chapter 8) was implemented in 1991 (URS, 1983, 1987;
Jacoby et al., 1994). The suitability of dilution water sources for treating these lakes is apparent
FIGURE 6.1 Predicted and observed (solid circles) column-weighted mean TP as a function of dilution water
input in Lower Parker Horn (7) during May–September for the 9-year average TP loading, flushing rate, and
range of RTR values observed. (From Jones, C.A. and E.B. Welch. 1990. J. Water Pollut. Cont. Fed. 62:
847–852. With permission.)
130
120
110
100
90
80
70
60
50
20
40
30
TP (μg/l)
2
6
0
2
4
0
2
2
0
2
0
0
1
8
0
1
6
0
1
4
0
Dilution inputs (m
^
3
*
10
^
6)
1
2
0
1
0
0
8
0
6
0
4
0
2
0
0
0
Upper limit
Upper limit
Inflow
Mean
Copyright © 2005 by Taylor & Francis
from the large ratios of nutrient content in the lakes relative to the dilution inflows, ranging from
5:1 to 10:1. A third case to be discussed is LakeVeluwe in The Netherlands (Hosper, 1985; Hosper
and Meyer, 1986), where dilution was used together with wastewater P removal.
6.3.1 MOSES LAKE
Dilution water from the Columbia River has been added to Moses Lake’s Parker Horn via the U.S.
Bureau of Reclamation’s East Low Canal and Rocky Coulee Wasteway (Figure 6.2). The pumping
of dilution water from Parker Horn to the previously undiluted Pelican Horn began in 1982, and
sewage effluent was diverted from Pelican Horn in 1984. The effects of dilution water only on lake
quality can be evaluated for Parker Horn for all years. Because South Lake was affected to some
extent by sewage effluent, the added improvement for that area after 1984 was partly due to diversion.
The principal effects in Pelican Horn, however, were from sewage diversion. The ashfall from the
eruption of Mount St. Helens reduced the lake’s internal P loading during 1980 to 1981, so effects
of dilution are obscured during those years when dilution water additions were also low. Therefore,
periods of evaluation are for 1977 to 1979 and 1986 to 1988 in Parker Horn (dilution only) and
1977 to 1979 (dilution only) and 1986 to 1988 (dilution plus sewage diversion) in South Lake.
The patterns of dilution water addition have been varied but not in a systematic way conducive
to determining optimum quantity and seasonal distribution. The average amount of dilution water
added from 1977 through 1988 was 169.4 × 10
6
m
3
/yr, which represented a flushing rate in Parker
Horn of 17%/d for the 971 d of actual inflow. The average input for April to September (includes
days with and without input) was 130 × 10
6
m
3
/yr or 5.8%/d. With dilution water plus the normal
input, the flushing rate averaged 7.8%/d for Parker Horn. For the whole lake, these inputs repre-
sented a flushing rate of less than 1%/d. Thus, dilution water input created flushing rates in Parker
Horn that could have caused some washout of algal cells, but such an effect would not have been
significant in the remainder of the lake.
Dilution water addition continued at a slightly higher rate during the 1990s, with input averaging
221 × 10
6
m
3
/yr over the subsequent 13-year period through 2001 — a 30% increase over the
previous 12 years. Inputs during the wet years of 1996 and 1997 were only 75 and 32 × 10
6
m
3
/yr.
So while dilution has not been constant from year-to-year or evenly distributed in time, water was
delivered every year except one during the past 25 years. Nevertheless, low dilution water years
(e.g., 1997) still produced large algal blooms and poor lake quality.
Columbia River water was nearly ideal for dilution (Table 6.1). Because the P and N concen-
trations in Crab Creek (Parker Horn’s natural inflow) were so high, apparently due to irrigation
and fertilization practices in the watershed, relatively large quantities of Columbia River water were
needed to significantly lower the composite inflow concentration, and thus to lower the in-lake
concentration. This resulted in larger exchange rates than would otherwise have been necessary
without the Crab Creek inflow. Unfortunately, diverting Crab Creek was not economically feasible
in this case, but such a manipulation could be considered for other lakes to obtain more efficiency
from dilution water quantities.
The addition of dilution water to Moses Lake predictably and rapidly replaced lake water, as
judged by tracing a conservative parameter, specific conductance. Values for percent lake water
were calculated, assuming that 100% was represented by the conductance of Crab Creek and 0%
by the conductance of Columbia River water. For example, using a typical value of 460 μmhos/cm
for Crab Creek (CCW), 250 μmhos/cm for lake water (LW), and 120 μmhos/cm for East Low
Canal dilution water (ECDW), the percent lake water would be
(6.2)
100
100 250 120 46
()/( )
()/(
LW ECDW CCW ECDW LW−−=
−
%
00 120 38−=)
Copyright © 2005 by Taylor & Francis
Percent lake water, which decreases with dilution, is used instead of percent dilution water, to
represent the behavior of nutrients in the lake. Remaining lake water in Parker Horn, where water
enters (Figure 6.2), was reduced to values around 20%, much less than in other parts of the lake
(Figure 6.3). This was expected (dashed line, for Equation 6.1), because the average dilution rate
during the period from April to June, described here, was 15%/d for Parker Horn, which is a small
(8%) portion of the lake volume. The dilution rate decreased, as the water moved through other
parts of the lake. As the dilution water input declined in June, the fraction of lake water in Parker
FIGURE 6.2 Moses Lake, Washington, Note source of dilution water from East Low Canal via Rocky Coulee
Wasteway and point of pumped transfer of dilution water from Parker Horn to Pelican Horn. (From Cooke,
et al. 1993. With permission.)
TABLE 6.1
Nutrient Concentration (μg/L) in Inflow Water to Parker
Horn from May to September, 1977 and 1978
Total P Total N SRP NO
3
–N
Crab Creek inflow without dilution 148 1331 90 1096
East Low Canal dilution water 25 305 8 19
Source: From Cooke et al., 1993. With permission.
Present dilution
input from
East Low
Canal
Rocky
Coulee
Wasteway
Scale
1 km
Scale
4 km
Main Arm
Lewis
Horn
Moses Lake
State Park
Parker Horn
City
of Moses Lake
Pelican
Horn
Lower Lake
Lake outlets
I-90
Dilution
water transfer
Copyright © 2005 by Taylor & Francis
Horn quickly rose to between 50% and 60% (Figure 6.3). Part of that increase was probably caused
by wind pushing water from the Main Arm and South Lake into Parker Horn.
Moses Lake is dendritic in shape and most of the lake’s volume (63%) is in the Main Arm,
out of a direct path from the dilution water inflow. Thus, dilution water was expected to have little
effect in the main arm compared to Parker Horn and South Lake, which together represent 29%
of the lake volume. However, the lake water residual decreased similarly to that for the lower lake,
even if the whole lake volume was used to calculate residual lake water and water exchange rate
(solid line and Equation 6.1). Lake water residuals in the whole lake and lower lake reached levels
between 50% and 60% in late May and early June and then began a more gradual return to normal
as dilution input declined (Figure 6.3).
Improvement in lake quality during the first three years (1977 to 1979), compared to predilution
years 1969 to 1970, was near or in excess of 50% for TP, SRP, and chlorophyll (chl) a. Secchi
transparency increased markedly, not only for Parker Horn but for South Lake as well (Table 6.2).
Total N decreased by about the same magnitude, although predilution data for N are incomplete.
By 1986 through 1988, lake quality improved even more. The further improvement in Parker Horn
was due to reduced inflow P (50%) in Crab Creek during the 12-year study period. The further
improvement in most of the lake volume was due partly to sewage diversion, which primarily
affected South Lake (Table 6.2). Pelican Horn, which was influenced entirely by groundwater and
sewage effluent, showed little effect of dilution water in 1977 to 1979. The extensive improvement
there in 1986 to 1988 (Table 6.2) was due primarily to sewage diversion.
While dilution water was distributed throughout the lake, improvement in quality was greatest
in Parker Horn, where the fraction of dilution water was highest (Figure 6.3). Wind was probably
the main force causing the transport of dilution water from Parker Horn into the Main Arm, with
the fraction of dilution water, which reached half the distance through the main arm, being dependent
largely upon the fraction existing in Parker Horn (Welch et al., 1982). About half the natural surface
inflow and P load entered the Main Arm via Rocky Ford Creek. Phosphorus concentration in that
source did not decline during the 12-year study, as it had in Crab Creek. Thus, the continued trend
in quality improvement was not as apparent in the Main Arm.
Means for the May to September periods obscure the extreme conditions, such as a maximum
Secchi transparency of 3 m in June (4 m was reached in 1982) throughout most of the lake. Chl
a reached peaks near 50 μg/L in late July and August after dilution water input was curtailed for
two to four weeks. Unless dilution water was added continually, blooms returned as the fraction
of dilution water in the lake declined. This “boom and bust” phenomenon, promoted by large inputs
followed by no input at all, did not produce the optimum effects that would have occurred with a
continual input at low rates throughout the summer, while employing similar total amounts of water.
The large quantities added over a short period of time — exchanging water in Parker Horn at the
rate of about 20%/d and in most of the lake at 2–3%/d — are probably unnecessary, considering
that induced flushing rates throughout most of the lake were insufficient to cause significant washout
of algal cells and most improvement was due to dilution.
Determining the optimum quantity of dilution water and its distribution over time requires
defining the cause(s) for the quality improvement, in this case algal reduction. The reduction of N
concentration was the most probable cause for the dilution effect on algal biomass following the
initiation of dilution and prior to the Mount St. Helens ashfall. Nitrate, rather than SRP, was the
nutrient that most frequently limited algal growth rate (Welch et al., 1972). Nitrate per se was not
appreciably reduced by dilution, because it was limiting and remained rather low in the lake water
during summer both before and after dilution. Although control of biomass was discernable at total
N concentrations in lake water below about 600 μg/L (Welch and Tomasek, 1981), the best
relationship was found between flow weighted NO
3
concentration in the inflow (Crab Creek) and
the average chl a concentration in Parker Horn and South Lake (r = 0.97; Welch et al., 1984).
Controlling algal biomass by reducing the inflow concentration of limiting nutrient, which in its
Copyright © 2005 by Taylor & Francis
soluble, available form continues to remain at low concentration in the lake (seemingly unrelated
to biomass), is analogous to the functioning of a continuous culture system (see Welch, 1992).
Prior to implementation of this project, it was thought that TP would be the most important
nutrient to control in order to reduce algal biomass. Although NO
3
limited growth rate during
summer, fixation of atmospheric N by blue-green algae should have supplied enough N to com-
plement the available P supply. N fixation is not a rapid process; maximum rates of cell N
replacement and growth of about 5% and 10%/d have been reported (Horne and Goldman, 1972;
Horne and Viner, 1971). A growth rate by N fixation of only 2.4 ± 1.8%/d was determined for
Moses Lake algae (Brenner, 1983). With such slow growth, increasing the flushing rate by about
tenfold may well have prevented N uptake by fixation from fully utilizing the available P. In any
event, there was a close relationship between inflow NO
3
and chl a. Using data before and three
years after dilution started (1977 to 1979), that relationship allowed estimates of optimum dilution
water input.
The Mount St. Helens ashfall produced a seal over Moses Lake sediments and stopped internal
P loading for two years (Welch et al. 1985; Jones and Welch, 1990). That event, coupled with the
continued reduction in inflow P concentration to Parker Horn, resulted in a trend toward P limitation
(Welch et al., 1989, 1992). Sewage diversion from Pelican Horn also contributed to that trend in
the lower lake. For 1986–1988 when P was limiting, the Jones and Bachmann (1976) relationship
provided an adequate fit of the data for predicting chl a from TP. A steady state model for TP was
developed in which internal loading was predicted as a function of flushing rate and relative thermal
resistance to mixing (RTRM) (Welch et al., 1989; Jones and Welch, 1990). The resulting relationship
between dilution water input and lake TP in Parker Horn shows the moderating effect of internal
P loading on the effectiveness of dilution water input (Figure 6.1).
TABLE 6.2
Average April–September Dilution Rates through Discrete Sections of
Moses Lake and Resulting Average May–September Values for TP, SRP,
Chl a and Secchi Transparency for before (1969–1970) and after
(1977–1979) Dilution (except for Pelican Horn) and after Dilution and
Sewage Diversion (1986–1988)
Years/Lake Area
Dilution Rate
(%/d) TP (μg/L) SRP (μg/L) Chl a (μg/L) Secchi (m)
Parker Horn
1969–1970 1.6 152 28 71 0.6
1977–1979 7.8 68 15 26 1.3
1986–1988 8.0 47 6 21 1.5
South Lake
1969–1970 1.1 156 48 42 1.0
1977–1979 3.5 86 35 21 1.7
1986–1988 3.6 41 7 12 1.7
Pelican Horn
1969–1970 0.0 920 634 48
a
0.40
1977–1979 0.0 624 441 39
a
0.45
1986–1988 7.7 77 6 12 0.65
a
Chl a: biolvolume ratios one half rest of lake.
Note: Samples from 0.5 m depth transects.
Source: From Cooke et al., 1993. With permission.
Copyright © 2005 by Taylor & Francis
Goldman (1968) suggested that reducing the N content in Clear Lake, CA (a hypereutrophic,
shallow lake in an arid region, like Moses Lake), by adding Eel River water, should reduce algal
content (as it did initially in Moses). There was uncertainty about the buffering effect of increased
release of N from sediments once the lake water N content decreased and a larger gradient between
sediment interstitial N and the overlying water occurred. That effect did occur in Moses Lake, as
indicated earlier, although the effect of increasing RTRM was 2.8 times more important, based on
the steady state P model, than increasing the flushing rate of dilution water (Jones and Welch,
1990). Reducing the inflow concentration of P, either by adding dilution water or by removing P
from the external input, results in an increased gradient in P concentration between sediment and
water and, thus, a greater diffusive flux from sediments (Poon, 1977; Sas et al., 1989). A decrease
in internal loading as sediments become depleted of P is possible with continued dilution as with
wastewater P removal or diversion. The year-to-year variability in internal load was too great to
detect any trend in Moses Lake with the 12 years of data through 1988. However, a 2001 P budget
shows a negative P internal loading for the April–September period (Carroll, personal communi-
cation), compared with internal loading being 53% of the total for that period in 1988.
The physical loss of algal cells by washout has probably contributed to reduced biomass in
Parker Horn, where high rates of exchange (20–25%/d) existed for short periods. For example,
biomass in upper Pelican Horn decreased from 80 to 10 mm
3
/L in about 1 month following increased
water exchange by pumping Parker Horn water through Pelican Horn (Carlson and Welch, 1983;
Welch et al., 1984). The greatest decrease occurred with an exchange rate of 9%/d, although
FIGURE 6.3 Residual lake water, in percent, remaining in Parker Horn (open circles), South Lake (closed
circles), and the whole lake (triangles) compared with that predicted (based on average inflow from mid-April
to mid-June) for the whole lake (solid line) and Parker Horn (dashed line) in response to dilution water input
in 1978. Parker Horn, South Lake, and the whole lake represent, respectively, 8%, 21%, and 100% of the lake
volume. (Reprinted from Welch, E.B. and C.R. Patmont. 1980. Water Res. 14: 1317–1325. With permission
from Pergamon Press Ltd., Oxford.)
100
80
60
40
20
0
April May June
Percent lake water
m
3
sec
−1
Dilution water
Copyright © 2005 by Taylor & Francis
subsequent exchange rates were higher (19%/d). Persson (1981) observed that Oscillatoria biomass
was greatly influenced by flushing rate during the period (about a month) of maximum growth in
a hypereutrophic brackish-water bay. At a flushing rate of 8.1% and 9.4%/d the average biomass
was about one half the level at 4.7%/d. At 20.7%/d biomass was only about one third the level at
4.7%/day.
For Parker Horn, therefore, where the mean flushing rate was about 8%/d from April to
September (Table 6.2), washout of cells probably represented part of biomass control. In the
remainder of the lake, where flushing averaged less than 1%/d, washout was of less significance
when compared with a 50%/d maximum growth rate, which was observed for Aphanizomenon in
the lake. If the N source is fixation, however, even relatively low flushing rates may effectively
reduce the biomass of that alga through washout.
Instability of the water column, as indicated by a decreased vertical density gradient (low
relative thermal resistance to mixing, RTRM), has contributed to the crash or prevention of blue-
green algal blooms in Moses Lake (Welch and Tomasek, 1981). Because the buoyancy capability
of blue-greens provides advantages over greens and diatoms when mixing is poor, decreased
stability hinders dominance by blue-greens (Knoechel and Kalff, 1975; Paerl and Ustach, 1982;
Chapter 19). Daily monitoring showed that blue-green biomass increases and surface accumulations
become more pronounced under quiescent conditions, but biomass disperses with increased mixing
from wind > 4.9–7.6 m/h (Bouchard, 1989; Welch et al., 1992). Wind has more effect on water
column stability in Moses Lake than dilution water input.
While biomass was substantially reduced by dilution, algal composition did not change during
the 12 years dilution. Blue-greens dominated the phytoplankton throughout the summer (Welch et
al., 1992). The blue-green fraction decreased initially (Welch and Patmont, 1980), but that did not
persist. This was unexpected since decreased blue-green dominance has accompanied decreased TP
content in most situations (Sas et al., 1989). However, the first intensive monitoring since 1988,
conducted during 2001, the fifth highest dilution water input year, showed low mean surface TP
(20 μg/L), low chl a and a near absence of blue-green algae in Parker Horn and South Lake (Carroll,
personal communication).
The optimum use of dilution water for Moses Lake is a moderate, but continuous input from
May through August. Water added too early (February to March) would be largely replaced by
high-nutrient Crab Creek water by June, when algal blooms begin. Replacement with Crab Creek
water creates a problem if dilution water is stopped in June or early July. Unfortunately, the lack
of irrigation demand during wet years reduces space available in the downstream impoundment
for dilution water routed through Moses Lake. Thus, dilution water transport through the lake is
higher in dry years. Nevertheless, based on the earlier relationship between May to August average
inflow NO
3
concentration and June to August average chl a, a dilution water volume of about 100
× 10
6
m
3
from May through August should control chl a to an average of about 20 μg/L, whether
that quantity comes as 10 m
3
/s for the whole period or is divided into 25 m
3
/s for May and 5 m
3
/s
for June through August. If water input is not maintained through August, blooms with very high
chl a levels will result. Also as indicated in Figure 6.1, that volume should result in a TP concen-
tration of about 55 μg/L and a chl a content of about 24 μg/L if P is limiting. Also as indicated
by Figure 6.1, there is a diminishing value to more dilution water and any further improvement in
the quality of Moses Lake must involve control of internal P loading. However, if the lack of
internal P loading observed in 2001 is representative of conditions in recent years, effectiveness of
long-term dilution is greater than expected from Figure 6.1.
Although the input of dilution water has not been distributed over the summer as desired, the
water has cost the Moses Lake Irrigation and Rehabilitation District nothing, because water diverted
through Moses Lake is used for downstream irrigation. The primary project cost has been the
pumping facility for Pelican Horn, at $577,000 (2002 U.S. dollars) plus planning, administrative,
and monitoring and research cost. To guarantee a flow of 5 m
3
/s during July and August, however,
it would be necessary for the District to buy water. Although this is not planned and costs and
Copyright © 2005 by Taylor & Francis
liabilities have not been considered, it is instructive to assume a cost (2002 dollars) similar to that
encountered for diluting Green Lake ($0.13/m
3
; see Green Lake section). For two months the
volume would be about 26 × 10
6
m
3
, with a cost of nearly $3.5 × 10
6
. The cost for dilution water
at Moses Lake would probably not be as high as that for the domestic water used in Green Lake.
However, it becomes clear that to buy dilution water may be a practical restoration alternative only
for relatively small lakes, such as Green Lake, that require much lower rates of dilution water
input. Green Lake is not fed naturally by a large input of high-nutrient water that must be diluted
in order to dilute the lake nutrient concentration. In that respect, Moses Lake may be a rather
unique case of a large lake existing at a location where large amounts of low-nutrient water are
available at no cost.
6.3.2 GREEN LAKE
This is another example of the benefits of dilution. The setting is the Seattle metropolitan area;
47,000 people live within 1.6 km of the lake, and as many as 1,162 people per hour use the 4.5-
km path around the lake. Perhaps the smaller Green Lake (100 ha) represents a more practical
example of dilution than does Moses Lake (2,700 ha).
Dilution was proposed as the primary treatment in 1960 (Sylvester and Anderson, 1964) and
was instituted in 1962. In contrast to the high rate of water input to Moses Lake’s Parker Horn,
the dilution of Green Lake represented a much lower rate of flushing, even less than the whole of
Moses Lake (2–3%/day). The average combined flushing rate was increased nearly threefold by
adding low-nutrient water from the Seattle domestic supply, which comes from diversions near the
source of two Cascade mountain streams. The addition of dilution water to Green Lake from 1965
to 1978 produced a flushing rate, based on dilution water only, ranging from 0.88 to 2.4/yr
(0.24–0.65%/d).
A marked improvement in chl a, TP, and Secchi transparency (SD) was noted during the first
few years of dilution. Only one year’s predilution data existed for comparison with the three years
of postdilution monitoring. Water transparency during the summer increased nearly fourfold, to an
average of 4 m (because the mean depth is 3.8 m, most of the lake bottom was visible), and chl a
decreased more than 90% from 45 to 3 μg/L. The summer mean TP decreased from 65 to 20 μg/L.
A substantial decrease in the blue-green algal fraction was observed, particularly during spring and
early summer.
Regular monitoring was terminated in 1968, but the lake was again studied intensively for the
purpose of proposing a new restoration plan (Perkins, 1983; URS, 1983). Mean chl a and TP had
increased to 38 and 55 μg/L, respectively, during the summer of 1981; the lake quality had degraded
markedly during the late 1970s, primarily due to declining dilution water inputs. No water was
added in 1982, resulting in massive blue-green algal blooms. Dilution water was subsequently
added in modest amounts on a regular basis to avoid deterioration in lake quality. Future limitation
in the availability of Seattle domestic water necessitated developing a long-term solution.
The percent decrease in TP concentration following initiation of dilution was about what would
be expected from Equation 3.10. The expected TP concentration in Green Lake prior to dilution,
calculated from estimated external loading, should have been about 80 μg/L, but was only 65 μg/L.
Following dilution, the steady state concentration should have been about 35 μg/L; however, it
actually declined to 20 μg/L by 1967 (Welch, 1979). The pre- to post-dilution decrease was the
same (45 μg/L) for the expected and the actual TP values. The discrepancy is most likely due to
overestimating external loading.
Mass balance analysis in the 1980s showed that much of the lake’s problem was due to internal
P loading, which was unrecognized earlier. Internal loading was high despite nearly the whole lake
being unstratified and oxic during summer (Perkins, 1983; URS, 1983). Internal loading accounted
for 21% of the total annual P loading during 1981 (determined by difference in the annual mass
balance of P). During the three summer months, however, when chl a averaged 38 μg/L, with a
Copyright © 2005 by Taylor & Francis
maximum of 60 μg/L, the internal source accounted for 88% of the total. By calibrating a non-
steady state model (Equation 3.23), Chapter 3), the average areal gross release rate was determined
to be 4.0 mg/m
2
per day (Mesner, 1985). Some of that release can be attributed to migration of P-
rich Gloeotrichia echinulata from sediments (Barbiero and Welch, 1992). Three storm drains
contributed 41% of the annual external loading to the lake, but their inputs are largely confined to
the winter, high runoff period.
Dilution remained the principal choice to improve and maintain Green Lake quality, with a
goal of achieving a mean summer TP concentration of 28 μg/L. Water from the city supply is most
desirable because the delivery facility is in place, and because the city water P concentration is
only 10 μg/L. However, city water costs about $0.13/m
3
(2002 dollars), and the supply during
summer was no longer routinely available (URS, 1983). Other water sources were considered, even
though construction of delivery systems would be required. Local groundwater supplies contained
too much P. Lake Washington water is sufficiently low in TP concentration (15 μg/L), and its use
seemed feasible with construction of a piping system. However, the State’s objection to withdrawal,
and potential local impacts of the piping system, resulted in favoring an alum alternative (Chapter 8).
If the use of Lake Washington water were feasible, one could calculate a first approximation
of the amount of dilution water necessary to reduce the summer lake TP from 55 to 28 μg/L. The
annual mean TP of 42 μg/L was 0.76 of the summer mean, so assuming that factor is reasonable,
the annual mean should be reduced to 21 μg/L to achieve a summer mean of 28 μg/L. Calibrating
a TP steady state model (Equation 3.12) for the 1981 external loading of 203 mg/m
2
per yr (160
external + 43 internal) gives the following estimate for the sedimentation rate coefficient, which
integrates external loading and net internal loading:
To achieve 21 μg/L (mg/m
3
) as an annual mean, the steady state Equation 3.10 can be solved for
the unknown dilution water inflow (X) assuming a Lake Washington TP of 15 μg/L (A
o
= area, V
= volume):
Rearranging and solving for X gives
The addition of this much water would increase the flushing rate from 0.92 to 5.95/yr and
reduce the sedimentation rate coefficient, which is not taken into account. However, there are other
σρ
σ
=−
=
⋅
×
−
L
TPZ
yr203
42 3 8
092
mg /m
mg/m m
/y
2
3
.
.rr/yr= 035.
TP
LXA
ZX V
o
=
+
+
=
⋅+
(/)
(/ )
(
15
203
σ
21 mg/m
mg/m yr
3
115
104 10
6
mg/m m /yr)
m
3.8 m
m/yr
3.
33
2
3
⋅
×
X
X
.
995 10 m
/yr
63
×
+
⎛
⎝
⎜
⎞
⎠
⎟
035.
21 8 29 203 14 4
23 5 10
6
.
XX
X
+= +
=×m/yr
3
Copyright © 2005 by Taylor & Francis
errors as well in using a steady state equation, the major one being that a steady state model
based on annual means does not separate seasonal variations in loading. In the Green Lake
case, summer TP and algal blooms are due primarily to summer internal loading, and the 41%
of total annual loading from storm drains is relatively insignificant in determining the summer
concentration.
To account for the effect of seasonal variations in loading, a non steady state model (Equation
3.9) was used (URS, 1987; Mesner, 1985). Also with that model, the sedimentation rate coefficient
was calibrated as a function of flushing rate (σ = ρ
0.71
) so that changes in sedimentation could be
accounted for in determining the appropriate dilution volume to achieve a summer average concen-
tration. For Lake Washington water, and based on 1981 data in which about 2.8 × 10
6
m
3
/yr of city
dilution water was added, only about 15 × 10
6
m
3
/yr dilution water was required to achieve a summer
mean TP of 28 μg/L. That is only 60% of the previous estimate from a steady state model (23.5
× 10
6
m
3
/yr). The non steady state model showed that control of storm water inputs would be
unnecessary. The effect on summer TP concentration from adding 15 × 10
6
m
3
/yr (11 mgd) of Lake
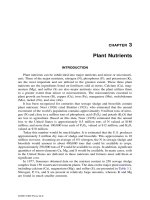
Washington water is shown in Figure 6.4.
The estimated present-worth cost for using Lake Washington water, which would be the capital
and operating cost for the piping system, was $13.8 × 10
6
for the annual flow rate of 11 mgd (15
× 10
6
m
3
/yr) over a 20-year period. The cost for city water at 7.5 mgd (10.4 × 10
6
m
3
/yr) was $27.4
× 10
6
(2002 dollars) over 20 years. Other techniques, such as storm water diversion and artificial
circulation, were projected to lower the total project cost. The final decision regarding Green Lake
was to abandon the alternative of Lake Washington water due to cost, environmental impacts, and
the failure to obtain approval for withdrawal. Instead, an alum treatment of the sediments, along
with the construction of a 3 mgd treatment plant ($9.3 × 10
6
), to create dilution water by removing
P from Green Lake water, was the selected alternative. Ultimately, the treatment plant was deemed
unnecessary and the lake was treated with alum in 1991 (Chapter 8). City water is still added
occasionally when excessive algal blooms occur.
6.3.3 LAKE VELUWE
This lake in The Netherlands is not a clear-cut case for dilution because dilution water addition
was begun coincident with P removal from sewage effluent input in 1979. Internal P loading was
high and was expected to minimize the benefits of P removal, so dilution was successfully instituted
to mitigate internal loading (Hosper, 1985; Hosper and Meyer, 1986).
FIGURE 6.4 TP concentrations predicted (calibrated) for calendar year in Green Lake, Washington for 1981,
in which the lake received 2 mgd low-nutrient dilution water, compared with predicted TP for 11 mgd dilution
water. (From Cooke et al., 1993. With permission.)
5248444036322824
Time (weeks)
201612840
100
90
80
70
60
50
40
30
20
10
0
Lake total phosphorus (μg/L)
Control
Dilution (11 mgd)
Copyright © 2005 by Taylor & Francis
Lake Veluwe is large and shallow (3,240 ha, 1.28 m mean depth) with a flushing rate of 1.43/yr.
Groundwater, which was low in TP (80 to 100 μg/L) relative to the lake and other sources, was
pumped into the lake during winter (November to March) at 19 m
3
/s, giving a flushing rate of
3.6%/d (5.5/yr). The purpose of dilution was to begin the summer with less algae (Oscillatoria)
and P, and a lower, more buffered pH (groundwater was hard). The principal cause for summer
internal P loading was photosynthetically caused high pH (up to 10) and the resulting dissolution
of ironbound P at the sediment–water interface.
The plan apparently worked. TP in the lake should have decreased from 400–600 μg/L to
130–200 μg/L if lake concentration were proportional to loading (i.e., no internal loading). In
fact, TP dropped to 100–200 μg/L, indicating that internal loading was substantially curtailed.
Internal loading, estimated by calibrating a non steady state model (Chapter 3), decreased from
1.5–5.9 mg/m
2
per day in 1978 to 1979, before treatment, to 0.0–0.8 mg/m
2
per day in 1982 to
1983, after treatment.
Chl a decreased from 200–400 μg/L before, to 50–150 μg/L after treatment and the transparency
range increased from 0.15–0.25 m before to 0.25–0.45 m after treatment. Although the lake was
still turbid, green algae and diatoms dominated the plankton for the first time in 20 years, replacing
the nearly permanent bloom of Oscillatoria. However, the lake did not return to the clear condition
that existed prior to the mid 1960s, when nutrient loading increased.
6.4 SUMMARY: EFFECTS, APPLICATIONS, AND PRECAUTIONS
Dilution is frequently used synonymously with flushing. Actually, dilution includes a reduction in
the lake concentration of nutrients and a washout of algal cells, while flushing may only cause the
latter. For dilution to be cost effective, the inflow water must be substantially lower in concentration
than the lake. Effectiveness increases as the difference between inflow and lake concentrations
increases. For washout to be an effective control on algal biomass, the flushing rate must be a
sizeable fraction of, or preferably approach, the algal growth rate.
In the three lake cases described, facilities for transporting water already existed. While irri-
gation water added to Moses Lake had a cost, the Bureau of Reclamation delivered the water to
users via the treated lake. For Green Lake, a domestic supply was used with little operational cost.
Maintenance of water quality in both systems suffered, however, during late summer in Moses
Lake, and in Green Lake during some years when low water supplies were encountered. The use
of dilution and flushing usually will not be limited as much by costs for facilities or water as by
proximity to a supply of low-nutrient water.
Low-P water from the city supply was added to Green Lake in Seattle, beginning in 1962. This
raised the water exchange rate from an annual average of 0.83/yr to 2.4/yr. After 5 years of treatment,
summer Secchi transparency improved fourfold, chl a decreased by over 90%, and TP declined by
over 50%. Dilution water inputs declined by the late 1970s and early 1980s, and the lake’s quality
again deteriorated. While city water was still used on a temporary basis to dilute the lake, that
supply was increasingly limited. Other sources of water were considered (including treated lake
water), along with stormwater diversion, lake circulation, alum, and biological manipulation. Insti-
tutional and supply constraints minimized the use of dilution in favor of an alum application.
Moses Lake receives low-nutrient dilution water from the Columbia River via an irrigation
system during spring and summer periods since 1977. Although the lake is highly dendritic in
shape, dilution water entering one arm distributed throughout most of the lake, primarily as a result
of wind. Prior to dilution, the lake maintained very high nutrient and algal content and very low
transparency; TP and chl a normally averaged about 150 and 45 μg/L, respectively. After dilution,
the respective spring–summer average for Secchi transparency doubled in most of the lake, and TP
and chl a were reduced by at least 50%. Initially, the biomass of algae was reduced in direct relation
to the reduction of NO
3
in the inflow water, although cell washout contributed some to the effect
in highly flushed sections. Facilitating the distribution of dilution water to another, previously
Copyright © 2005 by Taylor & Francis
undiluted arm of the lake demonstrated that algal biomass could be controlled by washout with
moderate water exchange rates. With the exception of one year (1984), dilution water addition has
continued for 25 years.
The ideal plan would achieve an adequate reduction in limiting nutrient content through a low-
rate, annual input of low-nutrient water. Where there is an existing high-nutrient input, it should
be diverted, if possible, for the low dilution rate to be most effective. This plan provides for a
reduction in biomass primarily through nutrient limitation. If nutrient diversion is not possible, one
is faced with higher-rate inputs to sufficiently reduce the inflow nutrient concentration. If only
moderate- to high-nutrient water is available, flushing may work well if the loss rate of cells is
sufficiently great relative to the growth rate. Flushing rates on the order of 10–15%/d should afford
some control through washout. Results from Moses Lake suggest that, until the flushing rate reached
20%/d or more, the zooplankton crop was not reduced and growth rate may even increase.
Internal loading was an important source of P in the three lakes discussed, and dilution achieved
substantial control of that source. For Green and Moses Lakes, dilution represented a direct control
for internal loading. For Lake Veluwe, dilution indirectly reduced internal loading by decreasing
the winter blue-green algal concentration and thereby decreasing summer internal loading as a
result of a lower early summer pH.
Costs are highly variable, depending upon the presence of facilities to deliver the water and
the quantity and proximity of available water. If the lake is in an urban setting and domestic water
is available, then improvement may be possible for less than $150,000 for construction, water costs,
and the first year of maintenance and operation. For Wapato Lake in Tacoma, Washington, the cost
was less than maintenance and operation of the city’s swimming pools, and the lake had more
swimmers (Entranco Engineers, personal communication). If the lake is near a free-flowing river
and diversion of a portion of the river flow through the lake during summer is feasible, then the
costs involve facilities, pumps and pipes, operation, and prevention of side effects (entraining fish).
The advantages of using dilution water include (1) relatively low cost if water is available, (2)
an immediate and proven effectiveness if the limiting nutrient can be decreased, and (3) some
success even if only moderate- to high-nutrient water is available, through physical limitations to
large algal concentrations. However, the principal limitation for use of this technique is the avail-
ability of low-nutrient dilution water.
REFERENCES
Barbiero, R.P. and E.B. Welch. 1992. Contribution of benthic blue-green algal recruitment to lake populations
and phosphorus. Freshwater Biol. 27: 249–260.
Born, S.M., T.L. Wirth, J.O. Peterson, J.P. Wall and D.A. Stephenson. 1973. Dilutional Pumping of Snake
Lake, Wisconsin. Wis, Tech. Bull. 66, Dept. Nat. Res., Madison, NJ.
Bouchard, D. 1989. Carbon Dioxide: Its Role in the Succession and Buoyancy of Blue Green Algae at the
Onset of a Bloom in Moses Lake. MS Thesis, University of Washington, Seattle.
Brenner, M.V. 1983. The Cause for the Effect of Dilution Water in Moses Lake. MS Thesis, University of
Washington, Seattle.
Carlson, K.L. and E.B. Welch. 1983. Evaluation of Moses Lake Dilution: Phase II. Water Res. Tech. Rept.
80. Dept. Civil Eng., Washington Dept. of Ecology, Olympia. Personal communication.
Carroll, J. 2004. Moses Lake Total Maximum Daily Load Phosphorus Study. Pub. No. 04-03-0, WA Dept. of
Ecology, Olympia, WA.
Cooke, G.D., E.B. Welch, S.A. Peterson and P.R. Newroth. 1993. Restoration and Management of Lakes and
Reservoirs, 2nd. ed. CRC Press, Boca Raton, FL.
Dickman, M. 1969. Some effects of lake renewal on phytoplankton productivity and species composition.
Limnol. Oceanogr. 14: 660–666.
Dillon, P.J. 1975. The phosphorus budget of Cameron Lake, Ontario: the importance of flushing rate relative
to the degree of eutrophy of a lake. Limnol. Oceanogr. 29: 28–39.
Entranco Engineers, Inc., Bellevue, WA. personal communication.
Copyright © 2005 by Taylor & Francis
Goldman, C.R. 1968. Limnological Aspects of Clear Lake, California with Special Reference to the Proposed
Diversion of Eel River Water through the Lake. Rept. Fed. Water Pollut. Control Admin.
Horne, A.J. and C.R. Goldman. 1972. Nitrogen fixation in Clear Lake, California. I. Seasonal variation and
the role of heterocysts. Limnol. Oceanogr. 17: 678–692.
Horne, A.J. and A.D. Viner. 1971. Nitrogen fixation and its significance in tropical Lake George, Uganda.
Nature 232: 417–418.
Hosper, S.H. 1985. Restoration of Lake Veluwe, The Netherlands, by reduction of phosporus loading and
flushing. Water Sci Technol. 17: 757–786.
Hosper, H. and M.L. Meyer. 1986. Control of phosphorus loading and flushing as restoration methods for
Lake Veluwe, The Netherlands. Hydrobiol. Bull. 20: 183–194.
Jacoby, J.M., H.L. Gibbons, K.B, Stoops and D.D. Bouchard. 1994. Response of a shallow, polymictic lake
to buffered alum treatment. Lake and Reservoir Manage. 10: 103–112.
Keating, K.I. 1977. Blue-green algal inhibition of diatom growth: transition from mesotrophic to eutrophic
community structure. Science 199: 971–973.
Knoechel, R. and J. Kalff, 1975. Algal sedimentation: The cause of a diatom-blue-green succession. Verh. Int.
Verein. Limnol. 19: 745–754.
Jones, C.A. and E.B. Welch. 1990. Internal phosphorus loading related to mixing and dilution in a dendritic,
shallow prairie lake. J. Water Pollut. Cont. Fed. 62: 847–852.
Jones, J.R. and R.W. Bachmann. 1976. Prediction of phosphorus and chlorophyll levels in lakes. J. Water
Pollut. Cont. Fed. 48: 2176–2182.
McBride, G.B. and R.D. Pridmore. 1988. Prediction of [chorophyll a] in impoundments of short hydraulic
retention time: Mixing effects. Verh. Int. Verein. Limnol. 23: 832–836.
Mesner, N. 1985. Use of a Seasonal Phosphorus Model to Compare Restoration Strategies in Green Lake.
MSE Thesis, University of Washington, Seattle.
Oglesby, R.T. 1969. Effects of controlled nutrient dilution on the eutrophication of a lake. In: Eutrophication:
Causes, Consequences and Correctives. National Academy of Science, Washington, DC. pp. 483–493.
Paerl H.W. and J.F. Ustach. 1982. Blue-green algal scums: An explanation for their occurrence during
freshwater blooms. Limnol. Oceanogr. 27: 212–217.
Perkins, M.A. 1983. Limnological Characteristics of Green Lake: Phase I Restoration Analysis. Dept. Civil
Eng., University of Washington, Seattle.
Persson, P.E. 1981. Growth of Oscillatoria agardhii in a hypertrophic brackish-water bay. Am. Bot. Finnici.
Vol. 18.
Poon, C.P.C. 1977. Nutrient exchange kinetics in water-sediment interface. Prog. Water Technol. 9: 881–895.
Sas, H. et al. 1989. Lake Restoration by Reduction of Nutrient Loading: Expectations, Experiences and
Extrapolations. Academia-Verlag, Richarz, St. Augustin, Germany.
Sketelj, J. and M. Rejic. 1966. Pollutional phases of Lake Bled. In: Advances in Water Pollution Research.
Proc. 2nd Int. Conf. Water Pollut. Res. Pergamon, London, pp. 345–362.
Stadelman, P. 1980. Der zustand des Rotsees bei Luzern. Kantonales amt fur Gewasserschutz, Luzern.
Sylvester, R.O. and G.C. Anderson. 1964. A lake’s response to its environment. J. Sanit. Eng. Div. ASCE 90:
1–22.
URS. 1983. Green Lake Restoration Diagnostic Feasibility Study. URS Corp., Seattle, WA.
URS. 1987. Green Lake Water Quality Improvement Plan. URS Corp., Seattle, WA.
Uttormark, P.D. and M.L. Hutchins. 1980. Input–output models as decision aids for lake restoration. Water
Res. Bull. 16: 494–500.
Welch, E.B. 1969. Factors Initiating Phytoplankton Blooms and Resulting Effects on Dissolved Oxygen in
Duwamish River Estuary. U.S. Geol. Surv. Water Suppl. Paper 1873-A. Seattle, WA. p. 62.
Welch, E.B. 1979. Lake restoration by dilution. In: Lake Restoration. USEPA-400/5-79-001. pp. 133–139.
Welch, E.B. and C.R. Patmont. 1979. Dilution effects in Moses Lake. In: Limnological and Socioeconomic
Evaluation of Lake Restoration Projects. USEPA-600/3-79-005. pp. 187–212.
Welch, E.B. and C.R. Patmont. 1980. Lake restoration by dilution: Moses Lake, Washington. Water Res. 14:
1317–1325.
Welch, E.B. and M.D. Tomasek. 1981. The continuing dilution of Moses Lake, Washington. In: Restoration
of Lakes and Inland Waters. USEPA-440/5-81-010. pp. 238–244.
Welch, E.B. and E.R. Weiher. 1987. Improvement in Moses Lake quality by dilution and diversion. Lake and
Reservoir Manage. 3: 58–65.
Copyright © 2005 by Taylor & Francis
Welch, E.B., J.A. Buckley and R.M. Bush. 1972. Dilution as an algal bloom control. J. Water Pollut. Control
Fed. 44: 2245–2265.
Welch, E.B., K.L. Carlson, R.E. Nece and M.V. Brenner. 1982. Evaluation of Moses Lake Dilution. Water
Res. Tech. Rept. 77. Dept. Civil Eng., University of Washington, Seattle.
Welch, E.B., M.V. Brenner, and K.L. Carlson. 1984. Control of algal biomass by inflow nitrogen. In: Lake
and Reservoir Management. USEPA-440/5-84-001. pp. 493–497.
Welch, E.B., M.D. Tomasek and D.E. Spyridakis. 1985. Instability of Mount St. Helens ash layer in Moses
Lake. J. Fresh Water Ecol. 3: 103–112.
Welch, E.B., C.A. Jones and R.P. Barbiero. 1989. Moses Lake Quality: Results of Dilution, Sewage Diversion
and BMPs — 1977 through 1988. Water Res. Tech. Rept. No. 118. Dept. Civil Eng., University of
Washington, Seattle.
Welch, E.B., R.P. Barbiero, D. Bouchard and C.A. Jones. 1992. Lake trophic state change and constant algal
composition following dilution and diversion. Ecol. Eng. 1: 173–197.
Copyright © 2005 by Taylor & Francis