Soil and Environmental Analysis: Physical Methods - Chapter 15 (end) pdf
Bạn đang xem bản rút gọn của tài liệu. Xem và tải ngay bản đầy đủ của tài liệu tại đây (442.51 KB, 34 trang )
15
Soil Profile Description and Evaluation
Tom Batey
University of Aberdeen, Aberdeen, Scotland
I. INTRODUCTION
The preceding chapters cover a wide range of soil physical measurements. In con-
trast, this chapter deals with the often neglected topic of the visual and tactile
methods of assessment that can be made directly in the field. Both have their place.
Systematic examination of soil in the field should be a basic skill to evaluate
its physical state. This was one of the conclusions of the international conference
called Problems in Modern Soil Management (van Ouwerkerk et al., 1992). Infor-
mation obtained in such a way can be used independently or can be used to com-
plement and supplement measurements made by instruments in the field or the
laboratory. Field examination should also precede the collection from the field of
samples that are to be subject to other tests in the laboratory.
A. General Background
Expressions used to describe the field characteristics of soil go back to the begin-
nings of a settled agriculture. When manual work was required to till the soil and
remove weeds, differences in particle size were readily detected by contact with
the foot and hand. ‘‘Light’’ and ‘‘heavy,’’ expressions still in use, did not refer to
soil bulk density but to the stickiness of wet soil, which is texture related.
Despite the wide range of instruments available to measure physical prop-
erties of soils, there are many circumstances where such tests cannot be done.
The equipment may not be available, the cost may be high, and the time taken to
complete a test may be so long that the results cannot be available in time to deal
with a practical problem. Unless the soil is examined first, samples taken for
Copyright © 2000 Marcel Dekker, Inc.
subsequent analysis may be taken from material that crosses physical boundaries
and includes layers with dissimilar properties. There are also situations where the
lateral distribution of a particular physical condition must be determined. Where
any test is time-consuming or costly it may be possible to undertake it at only a
few spots; examination of the soil is required to select a representative area.
Field techniques have been widely used in pedology and soil surveys, in
land evaluation for crop growth, and in the use and management of soils. For these
purposes, techniques have been developed with specific emphasis on particular
properties.
1. Pedology and Soil Surveys
The identification of soil horizons and their sequence feature prominently in stud-
ies of soil genesis, soil distribution, and soil classification. For these purposes,
there is an emphasis on criteria such as soil color and texture, which are relatively
permanent, and on the examination of soils under ‘‘natural’’ conditions. A soil
classification name may be given to the profile as a whole, based on the sequence
of horizons that are identified. Although the names and nomenclature may differ
between classification systems, they share a common core of diagnostic criteria to
identify a particular horizon. The methods used for describing soils in the field,
including any for diagnostic horizons, are described in detail in soil survey manu-
als or reports accompanying soil surveys. Although local or national systems of
classification may reflect more accurately the circumstance of a particular territory
(e.g., Glentworth and Muir, 1963; Taylor and Pohlen, 1976; Avery, 1990; Soil
Survey Staff, 1993), there are two major soil classification systems that are used
worldwide, U.S. Soil Taxonomy (Soil Survey Staff, 1975, 1998) and FAO (1998).
Some systems of soil classification rely on features that can be identified in
the field (e.g., Avery, 1990); others require climatic data or laboratory analysis to
supplement the field-based descriptions (e.g., Soil Survey Staff, 1993).
2. Land Evaluation
Key features that are required for the evaluation of land quality are related to the
growth of crop plants and are climate specific. These include the amount of avail-
able water within the potential rooting zone (based on soil texture, aeration, and
consistence), drainage class (based on color, texture, and porosity), and soil ero-
dibility (based on soil texture) (Corbett and Tatler, 1970; FAO, 1976; Bibby et al.,
1982; MAFF, 1988).
3. Soil Management
Where the physical properties of soil are altered, for example as the result of
tillage or the application of mechanical pressure, it is often necessary to find out
596 Batey
Copyright © 2000 Marcel Dekker, Inc.
what changes have taken place. These could include soil compaction, surface
crusting, erosion, structure degradation, or reduced permeability to air or water
(Simpson, 1983; Davies and Payne, 1988; Batey, 1988, 1989; Daniells et al.,
1996). Strictly speaking, permeability to air relates to the gaseous diffusivity
(Chap. 13), and permeability to water to the saturated hydraulic conductivity of
the soil (Chap. 4), although the earlier but less precise terminology has persisted
in the literature on applications. With the advent of heavy machinery in agriculture
and forestry, considerable emphasis is placed on the assessment of compaction
and whether remedial deep tillage is required. There is also an accompanying need
to evaluate the effects of a test run after soil has been loosened to confirm that
landwork is effective. Such investigations must be done on the spot and the results
evaluated immediately so that appropriate action can be taken.
For whatever purpose, properties that can be determined in the field by sight
or by handling the soil have an important part to play in soil physical analysis.
Some tests such as soil texture are of general applicability; others have been de-
veloped for situations where the physical properties have been changed by man-
kind’s use of the soil. Such includes use as urban parks, playing fields, sports
grounds, and paths and tracks as well as for crop production, grazing, or forestry.
Profile examination is particularly appropriate for land that has been subject to
high mechanical pressure under wet conditions, e.g., during harvesting of root
crops, or to major disturbance such as extraction of minerals, renewal of land-
scapes, or installation of pipelines (e.g., Lowe, 1993), or after prolonged periods
of industrial use.
B. Advantages of Direct Field Assessment
of Soil Physical Conditions
The advantages of making assessments of soil physical conditions directly in the
field are as follows:
1. The examination and evaluation can be done on the spot in a relatively
short time, and the results are immediately available.
2. The examination can be comprehensive and thorough.
3. The methods are flexible and can deal with a wide range of situations.
They can be done at any time of the year whether the land is bare, under
crop, grassland, or forest.
4. Little equipment is required—simply a means to dig a hole in the
ground, by spade or mechanical digger, followed by dissection of the
profile with a knife or pointed trowel. For some properties, further in-
formation can be obtained from examination of the soil extracted by an
auger.
Soil Profile Description and Evaluation 597
Copyright © 2000 Marcel Dekker, Inc.
5. Slight changes in physical conditions can often be detected that may be
difficult to determine by other means.
6. Values for some key physical characteristics can be estimated by com-
bining data on related properties determined in the field, for example
saturated hydraulic conductivity, from field assessments of soil texture,
structure, and porosity.
II. METHODS AND APPLICATIONS
A. Techniques of Field Examination and Evaluation
To be effective, examination of soils in the field requires access to a soil profile,
the vertical face of which has been carefully prepared to expose both natural ho-
rizons and any features created as a result of the use and management of the land.
The techniques described below are based on Batey (1975, 1988), Hodgson
(1978), Simpson (1983), Pizer (1990), and McKenzie (1998).
1. When to Look
The techniques can be applied at any time of the year. If it is possible to choose
the timing, examination should be made preferably when the maximum amount
of information can be obtained. Under annual crops, this would be when the
crops are close to their peak of vegetative growth and while the soil is moist. In
many climates this would be in late spring. However, other factors may dictate
the timing, such as access to the land. Postharvest examination is frequently
made both because of easy access and because of the need to assess soil compac-
tion, so that remedial deep tillage may be done timeously prior to the establish-
ment of the next crop. Some of the information obtained may be limited by the
conditions under which the examination is made. For example, if the soil is very
dry, it is difficult to distinguish between layers that are hard because they are com-
pact and those that are hard because they are dry. If the land is very wet, it may
not be possible to prepare a hole without excessive damage to the soil in its vi-
cinity, nor to make an adequate examination under soft and wet ground conditions.
In some circumstances it may be possible to use extremes of weather, such
as drought or heavy rain, to supplement the information obtained from profile
examination. The reaction of soil to heavy rain can be used to assess its hydraulic
conductivity, its erodibility and the stability of soil structure. A wet and soft sur-
face present after heavy rain may be caused by an impermeable compact layer
below (Sec. II.E). If the surface of the land is bare, the degree of breakdown of
structure and the degree of slumping can be determined (Sec. II.C).
598 Batey
Copyright © 2000 Marcel Dekker, Inc.
2. Where to Look
This depends on the reason for the examination. Unless the diagnosis of a specific
problem is the objective, care should be taken to avoid gateways, tracks, head-
lands, wheelings, and other abnormally disturbed ground. A representative area of
land should be selected that is uniform in appearance.
When undertaking soil examination to determine the reason for a variation
in crop growth, the pattern of growth can be a useful diagnostic feature and en-
ables holes to be made in areas of good and poor growth. In times of drought,
areas of shallow, rocky, or gravelly land (and archaeological foundations) may be
shown up by pale or stunted vegetation. A similar appearance can be caused by
soil compaction. Deeper soils may be shown up by darker, more vigorous plant
growth. Photographs are recommended as a means of recording permanently the
distribution of variations in soil color or of crop appearance, whether caused by
inherent differences in soils or by the effects of management of the land. These
may be taken at field level, from high ground or buildings, or from the air, and can
be used subsequently to locate areas for detailed soil examination. Satellite im-
agery can be used to record variations in soil properties or plant growth. It can be
very informative to dig a trench at right angles across the principal direction of
tillage or harvest so that any compaction related to wheeltrack patterns can be
more readily identified.
3. How to Look
a. Digging a Hole and Preparation of the Profile Face
A mechanical digger is recommended, provided that there is access to the location
required without causing excessive crop damage. Alternatively, a hole can be dug
with a clean sharp spade, supplemented if necessary with a pickaxe or crowbar.
An auger maybe used to extract soil from depth. Details of augers and other equip-
ment suited to soil examination are given in Sec. b below.
The dimensions of a hole depend on the question being asked and on how
far the deepest zone of interest lies below the surface. Rarely would the depth be
less than 50 cm, and it could be 1.2 meters or more. There should be enough
space at the bottom of the hole to accept waste soil taken off the face during
examination. While digging, two edges of the hole should be left untrampled, and
the soil dug out should be kept well away from these sides. One or more vertical
faces should then be cleared of any soil that was smeared or compressed while the
hole was dug. The next objective is to highlight the physical characteristics of the
soil. Using a small pointed trowel or penknife, the face should be gently probed,
beginning at the surface then working down the face to restore natural features
and to search for any human-induced changes. Where coarse blocky structure
(Sec. II.C.1) is found, this can be levered out with a spade, beginning near the base
of the hole.
Soil Profile Description and Evaluation 599
Copyright © 2000 Marcel Dekker, Inc.
Where a mechanical digger is used, a trench can be dug readily to a depth
of 1.5 m or more, to provide a hole wide enough to walk along and to have top
soil almost at eye level. Safety aspects must be considered and local regulations
followed when working in trenches more than 1 m deep. Care must be taken when
digging a hole in loose soil or where marked vertical fissures are present; the risk
of injury as a result of wall collapse must be evaluated.
If compaction of the soil just below plow or cultivation depth is suspected,
most of the loose soil above can be lifted off by spade or trowel and the last
remnants lying on the upper surface of the suspect compact layer brushed or
flicked off.
b. Equipment for Examining Soils in the Field
The suggestions made in this paragraph are based on the author’s experience (see
also ADAS, 1971). Catalogs of equipment for field use can be obtained from sev-
eral of the suppliers listed in Table 1 of Chap. 10. These contain a much wider
range of equipment than that described here, with some dedicated for specific
purposes. Local suppliers may also be able to provide suitable equipment. Some
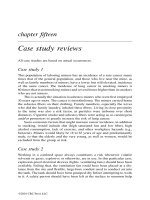
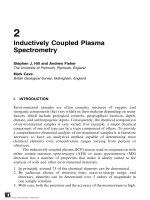
examples of equipment are shown in Fig. 1.
Spades: A conventional rectangular spade, typically 20 ϫ 25 cm, is often
used. However, this may be difficult to push into firm or dry soil. It can be modi-
fied to penetrate more easily by cutting off the corners to make it U-shaped. A
smaller spade 15 ϫ 20 cm in size with a concave face is also often used.
Screw augers: These are usually modified wood-boring augers of 2 or
2.5 cm diameter with a screw length of 20 cm, to which a stem has been welded
to increase its length to 1 m or possibly longer. If the original point is cut off, the
auger can more easily penetrate soils which are slightly stony. Because a large
pull is often required to extract the auger from the soil, care must be taken to avoid
back strain or injury. Screw augers are suitable for taking samples for tests where
structure is of no significance. The soil core retained on the screw can be examined
for texture and color but not for structure.
Dutch augers: These are specially designed for soil examination and have
an open twist tapered head about 20 cm long, typically of 3 or preferably of 5 cm
diameter. The head is at the end of a stem 1.2 m long. Despite their larger diame-
ter, they usually take less force to insert and pull out of the soil than screw augers.
A core can be extracted that is partly intact, and about 15 cm long; this can be
used to examine the texture, color, root numbers, and, to a certain extent, structure.
Crescent-shaped open corers (sometimes called cheese corers): These are
semicircular in cross-section and some 2 to 2.5 cm in diameter. The length of the
core may be limited to a specific distance of 15 or 30 cm for taking samples to
that depth. Alternatively it may extend to 1.0 m, the whole length of the corer.
After insertion into the soil and giving it a half rotation, an entire core can be held
on the corer when it is pulled out. By cutting the exposed part off with a blade, an
undisturbed soil profile can be retained on the corer for examination. Such corers
600 Batey
Copyright © 2000 Marcel Dekker, Inc.
cannot be used where stones are present. They can be used to extract deep cores
in wet or soft soil such as peat, but in mineral or dry soils the force required to
insert and extract long cores may be too great for manual use.
Mechanical corers and split samplers: Where cores are required of a size or
depth that exceed human endeavor, mechanical equipment as used in geology or
Soil Profile Description and Evaluation 601
Fig. 1 Augers used for obtaining soil samples. From left to right: gouge, screw, Dutch
auger.
Copyright © 2000 Marcel Dekker, Inc.
engineering can be used. Those used for extracting cores for root measurements
are shown in Chap. 12.
4. What to Look For—Examination and Interpretation
Physical properties that can be determined by tactile and visual examination di-
rectly in the field are described in the following sections of this chapter. To assess
their characteristics, it is convenient to divide the soil into four layers: the soil
surface, the layer disturbed by normal cultivations, the soil just below the culti-
vated soil, and subsoil undisturbed by normal cultivations. Visual and tactile ex-
amination can also help to locate the optimum position for instrumental measure-
ments to be made, or for samples to be taken for testing later in the laboratory
[e.g., bulk density (Chap. 8) or gas movement (Chap. 13)].
a. The Soil Surface
If a bare soil has been exposed to rain, any disintegration of aggregates can be
used as an indication of the stability of the structure. Individual aggregates may
have partially collapsed, and if severe, a smooth surface can be the result (see
Sec. II.B). The presence of such a layer can be confirmed by probing and levering
up the surface with a pointed blade. Such a crust may act as a seal on the surface,
which excludes air when it is wet; when dry, it may become hard and impenetrable
to emerging seedlings. More stable aggregates and large mineral particles such as
coarse sand or small stones can sometimes be seen firmly embedded in the crust
and projecting above the otherwise smooth surface. Below a crust, aggregates can
be firmly attached to the underside of the crusted portion. Soils with a high content
of fine or very fine sand and silt, particularly where the organic matter content is
low, are prone to show this feature (Davies, 1974). If rain is heavy and prolonged
or the land is flooded for a while, a crust may develop into a layer 3 –5 cm thick.
Compaction of the surface is widespread, caused by the treading of animals
(including wildlife and human activity) and by the passage of wheeled or tracked
vehicles. The surface is depressed by the pressure applied and the pattern is related
to the movement of the animals or machines. The effects are worst when the land
is soft. The primary effect is a decrease in porosity and infiltration that may lead
to water flowing downslope and inducing erosion. In hot, dry regions of the world,
hard and compact soil may be found extending from the surface throughout the
topsoil and even deeper (see Sec. II.C.5). These are known as hardsetting soils
and may be found occasionally in temperate regions where intensive management
has reduced soil organic matter content (Mullins et al., 1987).
b. Within the Cultivated Layer
This refers to the layer disturbed by cultivation, usually to between 20 and 30 cm
below the surface (i.e., the depth to which the deepest working implement oper-
ates). The term ‘‘cultivation’’ includes any operation done by a moldboard or disc
602 Batey
Copyright © 2000 Marcel Dekker, Inc.
plow, or by a rotary, tined or other implement. Multiple cultivations are common
and may take place at a range of depths.
Most types of cultivation implement can form a thin zone of compressed
soil, just below their operating depth (often called a cultivation pan). In this zone,
a pan may be detected by the relative resistance to a probe pushed manually into
the soil (a spade, auger, or stick can be used). Such pans occur not only just be-
low plow depth (see the next section) but can also be found within the cultivated
layer due to shallower secondary cultivations or the use of shallower implements
in the later stages of seedbed preparation. A pan can often be seen from above as
a smooth, slightly shiny smeared surface, which may be continuous or discontinu-
ous, and may bear the imprint of the blade or implement responsible for its for-
mation. In a thick panned layer, aggregates pack tightly together to form a slab of
visibly dense soil, with reduced or no visible pores. When dry, this would be
detected as a hard layer. Thick pans usually have a greater adverse effect than thin
ones on water or root penetration, but the depth at which they occur is important.
Shallow pans can have more severe effects (see Sec. II.D). Soils of all types, in-
cluding sands and peats, may exhibit smeared or compacted layers.
On very sandy soils an unusual method to detect thin compact layers is to
remove carefully an entire spadeful of dry soil and lay it on its side, tap the spade,
and blow away any loose sand. If compact layers are present they may be seen as
thin or thick layers separated by cleavage planes often lying parallel to the surface
(Harrod, 1975).
In wet weather, water may build up above a compacted or smeared layer and
can be seen seeping out and running down the side of an inspection pit. On sloping
land, if water cannot drain through a pan, the risk of erosion is considerably en-
hanced. Other changes may also accompany soil compaction; for example, dark
gray anaerobic pockets with a malodorous smell may be seen where recent crop
residues have been incorporated into the compact soil (Sec. II.F).
c. Just Below the Base of the Cultivated Layer
This is the position of the classic plow-pan; it is one of the most critical for root
and water penetration. Above it, the soil is loosened regularly by normal cultiva-
tions; within and below it, soil is rarely disturbed. However, it is not only plowing
that may be responsible for compaction. Wheels of tractors, harvesters and loaded
trailers running on the surface can transmit pressure to this depth (or even below)
and can cause severe compaction (Soane and van Ouwerkerk, 1994; Hakansson
and Petelkau, 1994; McKenzie, 1998).
The signs of compaction are high density as determined by probing, reduced
hydraulic conductivity leading to an accumulation of water above the compact
layer, a marked discontinuity in structural form often with horizontal laminated or
platy units within the compact layer, which may have a smooth shiny upper sur-
face, and the absence of pores, fissures, roots, or earthworm holes within it. Tor-
Soil Profile Description and Evaluation 603
Copyright © 2000 Marcel Dekker, Inc.
tuous root paths with common horizontal segments provide a good indication of
compaction (McCormack, 1986). The upper surface may also bear the imprint
of cultivator tines or the lugs of tractor tires. Such imprints may even be found
in prehistoric fields that have not been subsequently cultivated (Ashmore, 1996),
which is an indication of the potential longevity of unrelieved compaction.
The pattern of roots can be used directly to assess the significance to the
crop of any suspect compact layer. In a crop growing under unrestricted physical
conditions, the root pattern would be related to the species and variety of the crop,
to the soil water regime, to acidity, and sometimes to differences in soil nutrient
status. The concentration of roots is usually greatest in the topsoil, with a relatively
steady reduction in numbers with depth (Gregory, 1988). A compact or smeared
layer can restrict the number of roots penetrating below it. A mat or an increased
density of roots may be found on the upper surface of severely compacted soil.
Roots that are able to grow a short way into compacted soil are often much thick-
ened and distorted.
If roots have been unable to grow much into or below a compact soil, a
sharply differentiated moisture profile may develop, with dry soil within and
above the compact layer and moist below. This is caused by the lack of roots below
the compaction to extract moisture. On the other hand, if the soil has dried to some
depth in the subsoil below the compaction, this may be a useful indication that
roots have been able to penetrate and extract moisture. However, the change in
consistence at the base of the cultivated layer may be mistaken for the upper sur-
face of a compacted layer, particularly in late summer when subsoils may be dry
and hard. The unloosened subsoil is harder than the topsoil without necessarily
having been compacted (discussed further in Sec. II. D.3).
Although the upper surface of a compacted layer may be readily located, it
is more difficult to determine how far down the compaction persists. The most
compacted soil is found on the upper surface. The severity of compaction then
declines with depth until the layer merges with unaffected soil at some depth be-
low. If possible, a comparison should be made between the physical properties of
soil nearby that has not been compacted. The effects that compact layers may have
on crops and on soil properties is discussed in Sec. II.D.
d. The Subsoil
This section deals mainly with the identification of natural soil features, as the
physical properties of subsoil are not normally affected by grazing or cropping.
However, there is increasing evidence that the continued use of tractors and har-
vesters of large mass transmit pressure deep into the subsoil (McKenzie et al.,
1990; Hakansson and Petelkau, 1994; Sullivan and Montgomery, 1998). These
effects have yet to be fully evaluated. The signs to look for are increased density,
lack of porosity, and reduced penetration of water or roots.
604 Batey
Copyright © 2000 Marcel Dekker, Inc.
The agronomic role of the subsoil is to provide entry and egress for water
and to permit the entry and extension of crop roots to extract water and nutrients.
Roots can grow into quite stiff soil by deforming it but tend to grow mainly down
pores and cracks in structured soils if the peds are fairly dense. Pores and fissures
may be up to several mm across and can be observed directly by eye, and by the
presence within them of roots either living (white when young) or dead (brown).
In some soils, fissures and pores may have been created many years ago when the
land was in forest or marsh and when trees or other species were growing with
roots much thicker than those of the present vegetation. The imprint of roots can
persist on the faces of fissures for long periods, possibly centuries. Earthworm
holes often contain roots and darker colored topsoil, and sometimes follow former
root channels. Particularly where they are numerous, they may significantly im-
prove root penetration and drainage.
In some subsoils dominated by sand, root penetration may be very poor,
without obvious signs of compaction or hardness. In such soils roots may extend
only 8–10 cm into the subsoil sand and also show a characteristic swollen appear-
ance (Batey, 1988). This phenomenon is thought to be due to the close packing of
the grains and their resistance to moving apart to create the space needed for roots
to expand and grow normally (Hettiaratchi, 1987). Loamy subsoils in their natural
state usually provide excellent conditions for root growth, unless affected by
acidity or waterlogging.
In some clay soils distinctive and characteristic vertical cracks develop due
to shrinkage of the clay when it dries (see also Sec. II.C.4). These cracks fre-
quently re-form in the same position each year and roots therefore grow also in
the same position. The degree and depth of fracturing is related to the magnitude
of the soil water deficit, to the clay content, and to the type of clay present (Wil-
kinson, 1975). Topsoil often falls down cracks in summer, and whether this is a
beneficial effect is equivocal. Chemical fertility may be enhanced in the subsoil,
but the extra material may give rise to a tighter seal when the clay expands as it
rewets (Smart, 1998; Batey and McKenzie, 1999). Because roots can be so readily
seen on crack faces in the subsoil, their presence is a good guide to the absence of
any major limiting feature higher up the soil profile.
e. Cemented and Indurated Layers
Hard layers may develop by natural processes. In northern latitudes, indurated
layers occur in many sandy and loamy soils within 30 –50 cm of the surface; these
are relics of the Ice Age (Fitzpatrick, 1956; Glentworth and Muir, 1963). Their
presence is rarely in doubt, as they are extremely hard even when wet; a strong
blow with a spade may penetrate less than 1 cm. If shallow, they may adversely
affect drainage, the growth of crops, and land capability. However, their direct
significance for crop growth is often less than expected because of the cooler,
Soil Profile Description and Evaluation 605
Copyright © 2000 Marcel Dekker, Inc.
wetter climate in which they are usually found (Batey, 1988). Dense layers can
also occur due to pedogenic processes. These include the downward movement of
clay, and cementing by iron and other oxides and oxyhydroxides (plinthite) (Soil
Survey Staff, 1993).
B. Soil Texture
The expression ‘‘soil texture’’ is used to describe the feel and molding charac-
teristics of moist soil. Words such as clay, sand, and loam have been used to dis-
tinguish soils with different properties since the beginnings of a settled agricul-
ture. Hand texturing is one of the most important single tests that can be done in
the field.
Four terms are used in varying combinations: sand, loam, silt, and clay,
together with adjectives qualifying the size of the sand grains, to describe just over
20 different classes of texture. Texture must not be confused with soil structure,
which describes the way the individual particles are assembled and bound into
groups, usually called aggregates.
Soil texture gives a guide to many soil characteristics. The textural class
provides an indication of soil water retention and the available water capacity
(Chap. 3); particle size distribution (Chap. 7); the likely development and stabil-
ity of soil structure; cation exchange capacity (and hence nutrient retention and
availability, and the activity and retention of residual soil-acting herbicides); ero-
dibility by wind or water; stickiness and ease of cultivation; drainage characteris-
tics, saturated hydraulic conductivity and suitability for mole draining; cropping
suitability; and thermal properties of soils (Chap. 14).
1. Soil Texture Classes and Particle Size
The size ranges of soil particles are classified into three groups, sand, silt and clay,
with the upper limit of ‘‘soil’’ set at 2 mm. However, there is no general consensus
regarding the size range of each group, as discussed in Chap. 7 and by Hodgson
(1978). One system that is widely accepted classifies particles as follows (Hodg-
son, 1974):
Sand: between 2 mm and 60 mm
Silt: between 60 and 2 mm
Clay: less than 2 mm
Particles larger than 2 mm, i.e., stones (2 to 600 mm in size) and boulders
(Ͼ600 mm), are important where present in a significant proportion. Stone sizes
can be further subdivided into very small (2– 6 mm), small (6 –20 mm), me-
dium (20 –60 mm), large (60 –200 mm) and very large (200 –600 mm) (Hodg-
son, 1974).
606 Batey
Copyright © 2000 Marcel Dekker, Inc.
There are two types of method available to determine soil particle size dis-
tribution, laboratory analysis and field assessment. To avoid confusion between
the two, it is recommended that the term particle-size class be used to express the
descriptive names applied to different mixtures of sand, silt, and clay size particles
based on laboratory analysis. The term soil texture is then reserved for the esti-
mation based on a field test as described in Sec. II.B.2 below.
Particle size analysis provides precise values for the proportions of particles
in a number of size classes. The terms already used to describe soil texture classes
are then used to describe soils with different proportions of sand, silt, and clay.
The conversion is done using a triangular or orthogonal diagram (Chap. 7). Details
of size classes and of the naming of various mixtures of these are discussed by
Hodgson (1978). However, particle size analysis is conventionally done after re-
moving cementing materials such as organic matter, carbonate, and iron and alu-
minum oxides and hydroxides. Laboratory results therefore cannot always be ex-
pected to relate accurately to the field behavior of soils. Furthermore, the textural
diagrams commonly used take no account of the range of particle sizes within a
class, so that important qualifying adjectives such as ‘‘coarse’’ or ‘‘fine’’ cannot
be applied. Care must be taken when interpreting soil surveys where particle size
analysis figures are used to verify field estimates of texture (Avery, 1990).
In some red tropical soils, estimating the texture by hand gives a result of
silty loam, whereas a laboratory determination shows a high content of clay. This
difference is due to the intense microaggregation of the clay particles, which
masks some of the cohesive properties of the clay when manipulated by hand.
In such soils, the results of hand texturing give a much better indication of the
field behavior and capability of the soil (Trapnell and Webster, 1986).
When hand-based assessment of soil texture has been tested against labo-
ratory analysis, the results showed that, for soils within a limited geographic re-
gion, those with experience of hand assessment could confidently estimate the
particle size distribution of a wide range of samples (Hodgson et al., 1976; Pizer,
1990).
2. Field Method
Methods for assessment of soil texture are given in national and international soil
survey manuals (e.g., Hodgson, 1974, 1978). A brief description of one method
that has been used successfully over many years for field evaluation in England
and Wales is given here (further details can be found in ADAS, 1971; Batey, 1988;
and Pizer, 1990). The field properties associated with each class are described in
the next section.
The procedure is as follows: Take about half a handful of soil, and if it is
dry, add water gradually until the particles hold together to form a moist ball. No
excess water should be present. The assessment is made by kneading the moist
Soil Profile Description and Evaluation 607
Copyright © 2000 Marcel Dekker, Inc.
soil between fingers and thumb. It is important to work the soil thoroughly to
eliminate any small lumps (aggregates) present. The assessment is then done by
estimating the contribution that the different particles, sand, silt, and clay, make
to the feel of the soil as a whole.
The physical properties of the individual fractions that determine the texture
of a soil are as follows.
Sand consists of grains that feel gritty and are large enough to grate against
each other; they may be detected individually by both touch and sight. Four sub-
grades can be distinguished, coarse, medium, fine, and very fine.
With silt, individual grains cannot be detected; silt feels smooth, soapy, or
silky. It adheres readily to the fingers.
Clays are sticky; some dry clays require a great deal of moistening and
working between the fingers before they develop their maximum stickiness. Clay
coheres and can come away fairly cleanly from the fingers. A moist surface will
take a slight polish when a finger or thumb is rubbed firmly across it.
Each class of soil texture has a characteristic feel (Table 1) and is best
thought of as a single entity. For those unfamiliar with the technique of hand
texturing, expert advice should be sought initially until experience is gained to
make accurate assessments. Practicing on samples that have already been classi-
fied is a good way to gain experience.
3. Soil Texture Descriptions and Associated Physical Properties
In Table 1, one column describes the tactile characteristics of each class and the
other the physical characteristics associated with each class. Although this is
based on U.K. experience, the method can be applied with only minor modifica-
tions to the soils of most countries. In Table 1, particles between 20 and 60 mmin
size are referred to as very fine sand. In some systems (Hodgson, 1974) this size
range is called coarse silt.
4. Hand Assessment of Soil Texture
The characteristics of the different textural classes are set out below:
a. Sandy Soils
Those with a significant amount of grittiness. Test the binding and cohesion.
None Sand
Slight Loamy sand
Readily molded into a cohesive ball, does not form threads Sandy loam
Moderately cohesive, sticky and plastic, forms threads, will take a
polish on the surface Sandy clay loam
Very cohesive, very sticky, forms long threads, will take a high polish
when rubbed Sandy clay
608 Batey
Copyright © 2000 Marcel Dekker, Inc.
For each of the sand groups it is also important to identify the grade of sand, and
the main classes should be prefixed accordingly, though for sandy clay loam and
sandy clay it is less easy to identify the sand grades.
Coarse sand Very harsh feel 2.0–0.6 mm
Medium sand Moderately harsh feel (e.g., sea shore sand) 0.6–0.2 mm
Fine sand Slightly gritty (e.g., dune sand) 0.2–0.06 mm
Very fine sand Smooth and powdery, only just visible to the naked eye 0.06–0.02 mm
b. Clayey Soils
Those which are not gritty, but are strongly cohesive, form threads and rings easily
and have a surface that readily takes a polish when rubbed with thumb or finger.
Moderately sticky, deforms readily when squeezed Clay loam
Extremely sticky, moderately smooth, difficult to deform Silty clay loam
Extremely cohesive, forms long threads and rings, high degree of
polish when rubbed Clay
Extremely cohesive, high polish, also smooth and silky Silty clay
c. Silty Soils
Those dominated by a smooth, soapy slipperiness or silkiness, moderately cohe-
sive. Silt adheres readily and fingers become very dirty; clay coheres, i.e., sticks
to itself and fingers remain relatively clean.
Smoothness and silkiness dominant Silty loam
d. Loam
Where none of the above fractions, sand, silt, or clay, imparts a dominant feel.
Moderately smooth and can be rolled into short threads; no polish can be
obtained when rubbed Loam
C. Soil Structure
In its broadest sense, soil structure refers to the physical organization of soil ma-
terials as expressed by the arrangement of solid particles and voids (Avery, 1990).
Field descriptions place emphasis on the degree of development, and on the size,
shape, and arrangement of naturally formed aggregates that are separated from
each other by voids or planes of weakness (Hodgson, 1974; Avery,1990).
Soil structure has also been described as the architecture of the soil (Russell,
1961). Certainly it has to do with space, construction, stability, pathways, and
Soil Profile Description and Evaluation 609
Copyright © 2000 Marcel Dekker, Inc.
610 Batey
Table 1 Soil Textural Descriptions and Associated Physical Properties
Texture Description Associated Physical Properties
SANDY SOILS: soils dominated by
sands; divided into three groups (sands,
loamy sands, and sandy loams), de-
pending on the proportion of sand
present. Each group is then subdivided
into four (coarse, medium, fine, very
fine), according to the dominant size
of the sand grains
SANDS feel gritty, lack any cohesion,
loose when dry, not sticky at all when
wet, do not stain the fingers
Low retention of water and nutrients
COARSE SAND (2– 0.6 mm): harsh
to the touch
Very droughty, fast draining, readily
eroded by water
MEDIUM SAND (600 –200 mm):
sands of the seashore
Very droughty, erodible by wind and wa-
ter, root entry difficult
FINE SAND (200 – 60 mm): dune sand Very erodible by wind and water, root en-
try difficult
VERY FIND SAND (60 –20 mm): lo-
ess, barely visible to the naked eye,
powdery
Very erodible, root entry difficult
LOAMY SANDS feel gritty, slight cohe-
sion— can be molded into a ball when
sufficiently moist, do not stick to the
fingers
Low retention of nutrients and usually of
water
LOAMY COARSE SAND: harsh to
the touch
Very droughty, fast draining, erodible by
water
LOAMY MEDIUM SAND: as me-
dium sand
Low water retention, very prone to ero-
sion by wind, erodible by water
LOAMY FINE SAND: as fine sand Reasonable water retention weak struc-
ture, liable to collapse in heavy rain,
crusts and caps on surface, very erod-
ible by wind and water
LOAMY VERY FINE SAND: very
fine powder
Very weak structure, collapses readily,
easily compacted, forms hard surface
cap
Copyright © 2000 Marcel Dekker, Inc.
Soil Profile Description and Evaluation 611
Texture Description Associated Physical Properties
SANDY LOAMS feel gritty, show a fair
degree of cohesion, can be molded
quite readily into a ball when just
moist
Free draining, easily tilled yet easily
deformed
COARSE SANDY LOAM: harsh and
gritty
Very fast draining, free working, low wa-
ter retention
MEDIUM SANDY LOAM: gritty,
firmly molded
Fast draining, free working, reasonable
water retention, stable structure, few
physical problems
FINE SANDY LOAM: slight gritti-
ness, firmly molded
Fast draining, free working, good reten-
tion of water—high proportion avail-
able, erodible by water, structure
slightly weak, liable to cap
VERY FINE SANDY LOAM: gritti-
ness barely detectable, firmly
molded, fine and powdery when dry
Moderately porous, weak structure and
liable to cap, surface ponding com-
mon, excellent retention of water, high
available water capacity, erodible by
water, very high value in dry areas
LOAMS
LOAM: no fraction dominates the feel of
the soil, readily molded into a ball al-
though sand present, does not feel ob-
viously gritty; insufficient silt to im-
part silky feel, insufficient clay to
make it sticky or to take a polish
Good water retention, porous, easy work-
ing, stable structure
SILTY LOAM: smooth silky feel, sticky
when wet, firmly cohesive
Good water retention, adhesive and diffi-
cult to work when wet, structure usu-
ally stable but may break down if over-
worked, high value in dry areas, less
good in wet
SILT: as silty loam but smoothness, silki-
ness, and adhesion more distinct, sur-
face takes a weak polish when rubbed
with finger
As silty loam but more sticky, moder-
ately slow draining
CLAY LOAM: sticky, binds together
strongly when moist and resists defor-
mation, takes a polish on surface
Good water retention, slow draining,
high retention of nutrients, strongly
developed stable structure, weathers
into fine aggregates on surface, high
draught requirement, readily smeared,
may shrink on drying to form deep
cracks
(continued )
Copyright © 2000 Marcel Dekker, Inc.
microhabitats. It is also an ephemeral property. Structure may change over a range
of time scales from instantaneous disruption to slow modifications over decades.
Consequently, it is often more appropriate to describe the structure of a soil than
it is to measure it. There are no shortages of methods to measure structure; over
200 are listed in De Boodt et al. (1967).
1. Description of Soil Structure
Because of its compound and complex nature, soil structure can be described in
several ways. The very act of breaking soil apart alters its properties, so that care
is needed in deciding on the amount of effort applied before making a descrip-
tion. A number of pedological terms have been developed to describe soil struc-
ture on which there is more or less international agreement. Examples of these
can be found in many soil survey manuals and textbooks (e.g., Payne, 1988;
White, 1997).
Words such as crumb, blocky, and angular are used in their normal sense in
soil descriptions; however others, such as prismatic, have specific definitions that
deviate from the normal use of the word. Furthermore, it is important to realize
that the terms used when describing structure have been precisely defined and
612 Batey
Table 1 Continued
Texture Description Associated Physical Properties
SANDY CLAY LOAM: as clay loam but
also gritty
As clay loam but is extremely hard when
dry, difficult to manage under tillage,
readily smeared and compressed
SILTY CLAY LOAM: as clay loam but
more sticky, adhesive and smooth
As clay loam but with a higher draught
requirement
CLAYS
CLAY: very sticky, binds together very
strongly, ball of moist clay is very dif-
ficult to deform by hand, takes a high
polish when moist clay is rubbed
As clay loam but clay characteristics
more extreme, widespread as a subsoil
below clay loam, forms deep and wide
vertical cracks on drying
SANDY CLAY: as clay but also gritty As sandy clay loam but clay characteris-
tics more extreme, very difficult under
tillage
SILTY CLAY: as clay but extremely
sticky and adhesive
As clay but very difficult under tillage
Note: The physical properties of any of the clay textures may be altered if a few percent of chalk is
present [e.g., in the Chalky Boulder Clays in eastern England; these soils develop a finer structure,
drain faster, and are easier to till than equivalent clays that do not contain chalk (ADAS, 1971)].
Source: Batey, 1988; Pizer, 1990.
Copyright © 2000 Marcel Dekker, Inc.
should not be confused with everyday descriptive terms that have not been defined
in a particular system. Some terms to describe the structure of a soil are given in
Table 2.
Structure can also be examined at a microscopic level (Brewer and Sleeman,
1988; Fitzpatrick, 1993). However, microstructures are not discussed further in
this chapter.
2. Soil Structure Assessment
A comprehensive description of soil structure is time-consuming to complete.
However carefully this is done, it is sometimes difficult to compare one descrip-
tion with another and to determine what are the essential differences between
them. McKenzie and MacLeod (1989) found that conventional descriptions of
structure, including grade, ped type, ped size, fabric, and macroporosity, were
poor predictors of agronomically important soil properties on a broad range of
irrigated soils. Gameda et al. (1994) found that soil profile assessment was a very
useful tool for complementing conventional procedures and that parameters such
as bulk density and penetration resistance, although they provided a reasonable
indication of the degree of compaction and freedom from waterlogging, were in-
adequate to describe the overall suitability of soil structure for crop growth.
A numerical scale can be used to overcome some of the difficulties inherent
in a purely descriptive method or to evaluate the result of a specific measurement.
An early example by Peerlkamp (1967) assessed the structure of the cultivated
layer as a whole. This test was originally designed for arable land and is to be
done on moist soil in spring or autumn. However, it can be adapted for grassland,
and for dry soil, and to be done at other times of the year.
Soil Profile Description and Evaluation 613
Table 2 Widely Used Terms to Describe Different Types of Soil Structure
Term Description
Single grain No perceptible bonding between particles to form compound units
Massive An amorphous lump of soil devoid of fracture planes
Platy Platelike with planes of weakness orientated horizontally
Crumb Distinct rounded porous aggregates up to 1 cm in diameter
Blocky Aggregates with similar dimensions in all three planes; they may have
edges that are angular or subangular
Prismatic Subsoil separated into vertically orientated units up to1mormore
long, often pentagonal or hexagonal in cross-section and between
5 and 30 cm across
Columnar As for prismatic but with the topmost part rounded
The terms can also be subdivided into size classes (Hodgson, 1974).
Copyright © 2000 Marcel Dekker, Inc.
The method is based on an examination of the structure in the cultivated
layer and a ranking of its quality as a medium for root development. The assump-
tions made are that medium crumb structures, low cohesion, high porosity, and
the absence of surface capping and dense clods are all beneficial qualities. The
method involves visual examination and manipulation by hand of a spadeful of
soil lifted up and laid on the ground. A number between St 1 (ϭ poor structure)
and St 10 (ϭ very good structure) is assigned to the whole spadeful of soil, after
consideration of the size, shape, and density of the aggregates; the porosity of the
entire layer; and the ease with which surface aggregates break down (Table 3). To
make adequate comparisons between different situations, a minimum of 10, or
preferably 20, tests should be made on each area or treatment. The results can be
statistically evaluated.
Experience has shown the method to be capable of detecting small changes
in structure. The St value has been related to soil organic matter, to soil consis-
tency, to the concentration of calcium in solution, to the residual effects of grass
leys, and to crop yields (Eagle, 1975). The concept of using a numeric scale to
assess a complex physical property has been further developed to assess the de-
gree of compaction under irrigated cotton grown on vertisols in Australia (Dan-
iells and Larsen, 1991; McKenzie, 1998) (discussed further in Sec. II.D). This
SOILpak score has been tested against a range of physical measurements and has
been found to be a successful predictor of soil conditions (Greenhalgh, 1995;
McKenzie, 1997).
Scoring methods can be sensitive and flexible and can provide an accurate
evaluation of structure. They help to focus on key properties and encourage a
detailed evaluation of the whole soil environment; they can also be adapted and
modified for specific situations wherever appropriate criteria can be established.
614 Batey
Table 3 Numerical Assessment of Soil Structure
St 1 Plow layer consists entirely of big clods, smooth dense crack faces, reducing
conditions, roots only in cracks
St 3 Plow layer big dense aggregates, smooth crack faces, roots between aggregates.
or
Top 6 cm angular dense aggregates, very dense below
St 5 Plow layer big but porous aggregates, rather smooth crack faces
or
Top 7– 8 cm small porous aggregates with denser layer below
St 7 Plow layer mostly porous crumbs partly combined as porous aggregates. Occa-
sional denser clod
St 9 Plow layer all porous crumbs, very few dense aggregates
Source: Based on the method of Peerlkamp (1967). These are the criteria for clay and loam soils; those
for sandy soils can be found in the original reference.
Copyright © 2000 Marcel Dekker, Inc.
3. Soil Structural Stability
Structure is an ephemeral property. Its deterioration is almost always on or close
to the soil surface and is associated with the exposure of bare soil to rain, with
arable cropping, and with a decline in the concentration of soil organic matter.
There are many laboratory tests available to measure the stability of struc-
ture (e.g., De Boodt et al., 1967; Kemper and Rosenau, 1986). Most are based on
the behavior of aggregates when immersed in water (and often shaken, too). There
is no universal agreement on a standard method. Some have been developed for
use in the field (e.g., McKenzie, 1998).
Signs of an unstable structure that may be seen in the field include
(a) Collapse or partial disintegration of aggregates when exposed to the
direct impact of raindrops or irrigation, or when immersed under water. The re-
action of a bare soil surface to such pressures (‘‘verschlumping’’) can be assessed
on a visual scale of 1 to 9 developed by De Boodt (pers. communication, 1971),
with 9 representing stable aggregates unchanged by pressure and 1 representing
soils showing total collapse of the aggregates after drop impact or immersion, to
form a continuous crusted surface.
(b) In soils containing a significant content of fine or very fine sand, small
pockets or thin layers of pale sand grains may be seen within the cultivated layer
or concentrated at its base (De Leenheer, 1967; Batey, 1988). These are the con-
sequences of the disintegration of aggregates into their component particles. From
the same process, very thin skins of clay (cutans) can sometimes be seen within
the soil profile and on the surface, often in minor depressions where water has lain
temporarily (Davies, 1975).
4. Structure and Clay Mineralogy
The structure of subsoils that contain a significant content of clay is usually domi-
nated by a pattern of vertical cracks. These open as a soil dries and close as it
rewets. The degree to which soils shrink as they dry is determined by the content,
type, and organization of the clay. The depth and width of the cracks are deter-
mined by the soil moisture deficit. Although it is not possible to identify specific
clay minerals by examining the frequency and width of cracks found in a soil, an
indication of the overall proportion of different groups can be obtained. Soils with
a high proportion of smectitic (montmorillonite) clays form cracks that are both
wide and deep, as exemplified by many vertisols. Soils dominated by illitic clays
show only narrow cracks. When kaolinitic clays dominate, crack formation is
likely to be less well developed.
The shrink–swell phenomenon has a marked effect on the overall character-
istics of a clay soil. The cracks often are the principal pathway for root entry into
the subsoil. In cracking clays, roots of cereal crops may reach depths of 2 m or
more. In dry areas such soils may thus be of high value. On the other hand, a soil
Soil Profile Description and Evaluation 615
Copyright © 2000 Marcel Dekker, Inc.
with a similar clay content in the same area but with few cracks would have a
much lower value (Wilkinson, 1975).
5. Hardsetting Soils
The phenomenon of hardsetting has been described by Mullins et al. (1987, 1990).
When dry, such soils are hard, compact, and apparently structureless, and the sur-
face cannot be indented by the pressure of a forefinger (Northcote et al., 1975).
They may be soft when wet. The hard condition may extend from the surface
throughout the depth of cultivation, to a depth of 30 cm or more. Textures that
may exhibit this phenomenon range from loamy sand to sandy clay with the clay
fraction frequently dominated by kaolinite and/or illite. The particle size distri-
bution is such that the individual particles will pack to a high density upon wetting
alone. Hardsetting becomes worse as the amount of exchangeable sodium in-
creases (McKenzie, 1998). The phenomenon is widespread in hot, dry regions of
the world and may be found occasionally in temperate regions where intensive
management has reduced soil organic matter content.
D. Soil Compaction
There is great concern worldwide over the adverse effects of soil compaction
on crop production (Larsen et al., 1994). These include restricted root growth,
reduced aeration, reduced availability of nutrients, reduced infiltration and re-
duced drainage. Any or all of these can lead to a reduction in plant growth (Batey,
1988, 1989; Larsen et al., 1994), although the manifestation of adverse effects are
related to the weather. Soil compaction has been the subject of several interna-
tional conferences (Anon., 1989; Herman, 1992; Nugis and Lehtveer, 1992) and
books (Soane, 1983; Soane and van Ouwerkerk, 1994). However, there is not
much guidance available on how to recognize soil compaction in the field. It is
particularly important to establish such techniques because of the potential effects
of compaction on land degradation and the need to enable appropriate remedies
to be applied timeously. In some cropping systems, there may be only a matter of
days between the harvest of one crop and the establishment of the next. Such an
interval may preclude the use of complex or time-consuming tests for compaction.
The state of packing of a soil can be estimated in the field by careful visual
and tactile examination. Such estimates are linked to the texture of the soil and
will be of most use in making comparisons within a profile or between parts of
the same land, which have been treated differently. The results can be used directly
to make decisions on soil tillage, particularly subsoil loosening (Batey, 1988;
McKenzie et al., 1990; McKenzie, 1998). They can also be used as an adjunct to
measurements of saturated conductivity (Chap. 4), strength (Chap. 11), penetra-
tion resistance (Chap. 10), or bulk density (Chap. 8).
616 Batey
Copyright © 2000 Marcel Dekker, Inc.
1. The Damaging Effects of Compaction and Their Identification
The physical characteristics that can be used to identify compaction are lack of
visible pores, high density, high strength, and massive structure. The damaging
effects may be caused by a reduction in macroporosity, which will reduce air po-
rosity, saturated hydraulic conductivity, and root penetrability. Such a reduction
may bring about changes in other properties, some of which can also be used as
diagnostic features (Batey, 1988). These include
1. The formation of anoxic layers or pockets within a compact soil, de-
tectable by a malodorous smell or by a field test to confirm the presence
of ferrous ions (Batey and Childs, 1982). One of the consequences of
anoxia is denitrification, which can reduce the nitrate content of the soil
and therefore reduce plant growth.
2. The presence of wet soil above the compacted layer after rain or irriga-
tion (see Sec. II.E).
3. Comparatively dry soil within and above the compacted layer, due to
the greater uptake of water by plants from a shallower layer because of
a restriction in root penetration.
4. Reduced nutrient uptake from the dry soil and consequent symptoms of
deficiency (e.g., of N).
5. Tortuous root patterns often with a marked horizontal orientation.
6. A reduction in crop growth. This last effect is related to climate and to
a reduction in crop root penetration and accessibility to available water.
The pattern of crop growth may help diagnosis if also related to the
degree of traffic passing over the land.
In many instances one can identify compact soil but cannot tell whether its effects
will adversely affect crop yield or quality. Only when a problem is apparent can
one deduce that compaction was the likely cause.
Compaction can also induce secondary effects. For example, the retention
of water above a compact layer can create a soft zone rendering it susceptible
to further compaction (see Sec. II.E). This is common where soils are puddled or
poached (surface damage by hooves or feet) (Scholefield and Hall, 1985).
Based on a detailed and systematic examination of the soil, Daniells and
Larsen (1991) developed a key with three ratings for soil structure for firm soil
(shown in Table 4) and three for loose soil. In a further refinement of their SOIL-
pak scoring procedure (McKenzie, 1998), eight separate factors are assessed and
a weighting is given to each to provide a combined score between 0.0 (poor) and
2.0 (good). This system is used extensively by cotton agronomists in Australia to
assess soil compaction and to provide options for soil loosening and soil manage-
ment. It has been shown to correlate well with soil aeration and soil strength mea-
Soil Profile Description and Evaluation 617
Copyright © 2000 Marcel Dekker, Inc.
sured by several methods (McKenzie, 1997). A list of diagnostic features has also
been made by Wildman (1980).
2. The Location of Compact Soil Layers
Compact soil can be present in several positions within the soil profile. It can be
found on the surface as a hardsetting horizon or as a compact layer caused by the
application of pressure from the wheels of tractors, trailers, and harvesters, or
from the feet of livestock or other animals (including humans). It can occur within
the layer of soil disturbed by regular tillage, where more than one denser layer
may be found. Smearing as well as pressure may be involved in the formation of
thin compact layers.
618 Batey
Table 4 Numerical System for Classifying Soil Structure
Firm, most soil: soil below the tilled layer or below the natural loose mulch;
aggregates fit together along faces and it requires force to lever them apart
Firm 0 (F0, poor structure)
General: Difficult for spade or knife to penetrate; lumps of soil levered off made up of
large tight fitting blocks. These fracture along the lines of forced applied in any direc-
tion into units with sharp right-angled corners. Finely grained and even internal sur-
faces with no pores visible or no subaggregates projecting from the fractured surface.
Breaks like heavy dough or plasticine. Low number of new roots
Clod shape: massive, platy, or conchoidal
Clod or ped size: Usually Ͼ5 cm towards the surface, larger at depth
Clod faces: dull
Firm 1 (F1, moderate structure)
General: some natural planes of separation but distinct force needed to part the blocks,
fracturing taking place mainly along the line of force applied to produce angular and
mainly nonporous surfaces
Clod shape: Mixed shapes
Clod or ped size: 0.5–5 cm towards the soil surface, larger at depth
Clod faces: Occasionally shiny faces
Firm 2 (F2, good structure)
General: Parts readily into porous subunits along natural fracture planes that have a
smooth and shiny face, or the fractured faces may be polyhedral with the exposed inter-
nal surfaces multifaced and with subangular units protruding. Good penetration by new
roots
Clod shape: Polyhedral, subangular blocky or lenticular
Clod or ped size: Usually Ͻ5 cm towards the soil surface, larger at depth
Clod faces: Shiny
Note: The ratings can be subdivided, e.g., ‘‘Firm 1.5’’ for a structure that is not quite ideal.
Source: After Daniells and Larsen, 1991.
Copyright © 2000 Marcel Dekker, Inc.
A particularly important location is just below the working depth of plows,
where the plowshare or disk scrapes across the soil and where tractor wheels (or
the feet of draught animals) gain traction in the open furrow. Dense layers can also
occur due to pedogenic processes as discussed in Sec. II.A.4e. These include in-
duration, in areas subject to past or present periglacial conditions (Fitzpatrick,
1956), and cementing by plinthite and other agents (Soil Survey Staff, 1993).
It is often straightforward to identify the upper surface of a compact layer
but difficult to determine the depth to which it extends. Such information is re-
quired to make key decisions on deep tillage or subsoiling. The signs characteris-
tic of compaction must be carefully assessed. Otherwise deep loosening may be
ineffective or even harmful to the soil. It is also important to reassess the soil
condition after a test run of deep tillage to determine whether the work has been
effective.
3. Physical Discontinuities
On land that has been tilled and also on land in its natural state, the upper horizon
usually has a relatively low bulk density. At the base of this horizon, there is often
a sharp increase in bulk density. The looser consistence of the A horizon may be
the result of mechanical loosening (tillage) and/or due to greater biotic activity.
The lower layer may be firmer simply because it has not been disturbed, but it
must be examined carefully to decide whether the hardness is due to compaction.
Dry and hard layers can be found in the subsoil after harvest of cereal crops, when
the land is rewetting from the surface downwards. In terms of root penetration it
is important to realize that a sudden change in bulk density can result in the de-
flection of roots that would have been able to penetrate the subsoil from a more
compact upper horizon that did not so readily permit root buckling (Whiteley
et al., 1982).
E. Soil Bearing Capacity
This property is related principally to the texture, to water tension, and to bulk
density of the soil. It is applied almost exclusively to surface soils and is linked to
the response of soil to traffic by agricultural or military vehicles and to feet or the
hooves of animals.
Although this property can be measured using instruments (Chap. 10), a
simple field assessment of relative soil resistance can be obtained by pushing a
spade, auger, or probe manually into the ground and noting its depth of penetra-
tion. An assessment of softness can be made using the squelch test. This was first
used as an assessment of field drainage status (MAFF, 1969); a revised version is
described below (Batey, 1988).
Soil Profile Description and Evaluation 619
Copyright © 2000 Marcel Dekker, Inc.