Mechanical Engineering Systems 2008 Part 3 pptx
Bạn đang xem bản rút gọn của tài liệu. Xem và tải ngay bản đầy đủ của tài liệu tại đây (300.78 KB, 25 trang )
42 Thermodynamics
p
4
V
4
␥
= p
5
V
5
␥
p
5
= p
4
V
4
V
5
␥
= 60
1.358V
3
16V
3
1.4
= 1.899 bar
T
5
= T
4
V
4
V
5
␥ – 1
= 1573
1.358 V
c
16 V
c
0.4
= 586.5 K
Heat energy supplied = m.c
v
(T
3
– T
2
) + m.c
p
(T
4
– T
3
)
= 0.717(1159 – 918) + 1.004(1573 – 1159), using a mass of
1kg
= 173 + 416 = 589 kJ/kg
Heat energy rejected = m.c
v
(T
5
– T
1
)
= 0.717 (586.5 – 303)
= 203.3 kJ/kg
Air standard efficiency = 1 –
heat rejected
heat supplied
=1 –
203.3
589
= 0.6548
= 65.48%
Problems 2.4.1
(1) A petrol engine working on the Otto cycle has a compression
ratio of 9:1, and at the beginning of compression the
temperature is 32°C. After heat energy supply at constant
volume, the temperature is 1700°C. The index of compres-
sion and expansion is 1.4. Calculate:
(a) temperature at the end of compression;
(b) temperature at the end of expansion;
(c) air standard efficiency of the cycle.
(2) In a diesel cycle the pressure and temperature of the air at
the start of compression are 1 bar and 57°C respectively.
The volume compression ratio is 16 and the energy added at
constant pressure is 1250 kJ/kg. Calculate:
(a) theoretical cycle efficiency;
(b) mean effective pressure.
(3) The swept volume of an engine working on the ideal dual
combustion cycle is 0.1068 m
3
and the clearance volume
is 8900 cm
3
. At the beginning of compression the pressure is
1 bar, and temperature is 42°C. If the temperature after
Thermodynamics 43
expansion is 450°C, the maximum temperature 1500°C and
the maximum pressure 45 bar, calculate the air standard
efficiency of the cycle.
␥ = 1.4,
c
v
= 0.715 J/kgK
(4) A compression ignition engine cycle is represented by
compression according to the law pV
1.35
= C, 1160 kJ/kg of
heat energy supplied at constant pressure, expansion
according to the law pV
1.3
= C back to the initial volume at
bottom dead centre, and completed by heat rejection at
constant volume. The initial conditions are 1 bar, 43°C, and
the compression ratio is 13:1.
Assuming air to be the working fluid throughout, determine
the heat transfer per kg during:
(a) the compression process;
(b) the expansion process;
(c) the constant volume process.
c
p
= 1005 J/kgK
c
v
= 718 J/kgK
(5) In an engine operating on the ideal dual combustion cycle
the compression ratio is 13.5:1. The maximum cycle
pressure and temperature are 44 bar and 1350°C respec-
tively. If the initial pressure and temperature are 1 bar and
27°C, calculate the thermal efficiency of the cycle and the
mean effective pressure of the cycle.
c
p
= 1.005 kJ/kgK
c
v
= 0.718 kJ/kgK
The indicator diagram
A real-life p/V diagram is called an indicator diagram, which shows
exactly what is happening inside the cylinder of the engine.
This plot is useful because it allows us to find the work which the
engine is doing and therefore its power, and it also enables us to see the
effect of the timing of inlet, exhaust and fuel burning, so that
adjustments can be made to improve cycle efficiency.
In the case of a large slow-speed engine, like a marine diesel engine
which typically rotates at about 100 rpm, an indicator diagram can be
produced by screwing a device called an engine indicator onto a special
cock on the cylinder head of the engine. The indicator records the
pressure change in the cylinder and the volume change (which is
proportional to crank angle), and plots these on p/V axes using a needle
acting on pressure sensitive paper wrapped around a drum. This
produces what is known as an ‘indicator card’.
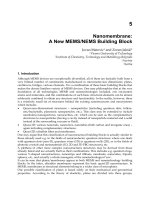
Figure 2.4.10 shows the indicator. The spring in the indicator can be
changed to suit the maximum cylinder pressure, so that a reasonable plot
can be obtained.
Such a mechanical device is not satisfactory for higher-speed engines,
but the same result can be plotted electronically.
44 Thermodynamics
In both cases we get an actual p/V diagram from within the cylinder,
and just as we were able to find work done from our air standard cycles
by finding the area within the diagram, so we can find the actual work
done, and therefore the power of the engine, by finding the area of the
indicator diagram. Of course in this case, the curves are not ‘ideal’, and
the equations cannot be used, but the area within the diagram can be
found by some other means, such as by using a planimeter.
Indicated power
As you might expect, the power calculated from the indicator diagram
is called the indicated power of the engine. It is the power developed
inside the cylinder of the engine.
As we saw earlier, a value of indicated mean effective pressure can be
found by dividing the area of the diagram by its length, but in this case,
we must multiply the result by the spring rate of the indicator spring.
This gives an ‘average’ cylinder pressure, used in the expression
for indicated power, and it is also used as an important value for
comparison between engines.
Indicated power is given by the formula,
Indicated power, ip = P
mi
.A.L.n
where:
P
mi
= mean effective pressure
N
m
2
A = area of piston (m
2
)
L = length of stroke (m)
n = number of power strokes per second.
The verification of this expression can be seen in two ways.
First, we know that the area under the p/V diagram is work done. The
product (P
mi
.A.L) gives this area since P
mi
is the height of the rectangle
and the volume change is given by length multiplied by the area of the
bore. The n term then imposes a time element which ‘converts’ the work
done to power in kW.
Figure 2.4.10 Engine indicator
Key points
᭹ The number of power
strokes per second is the
same as the rev/s for a
2-stroke engine, because
there is a power stroke
every revolution of the
crank.
᭹ For a 4-stroke engine, n
is the rev/s divided by 2
because there is a power
stroke once every two
revolutions of the crank.
Thermodynamics 45
Second, we can use the well-known work done expression from
mechanics, work = force × distance. The force on the piston is
(pressure × area, i.e. P
mi
× A), and this force operates over a distance
equal to the length of stroke, L. The n term then gives power.
Putting the units into our expression for indicated power,
ip =
N
m
2
× m
2
× m ×
1
s
=
N.m
s
=
J
s
= watts
Brake power
Brake power is the power actually available at the output shaft of the
engine.
It would be a wonderful world if all the power developed in the
cylinders was available at the output shaft, but unfortunately this is not
the case because of the presence of friction. This absorbs a certain
amount of power, called the friction power. The brake power is,
therefore, always less than the indicated power, and this is expressed by
the mechanical efficiency of the engine,
m
.
m
=
bp
ip
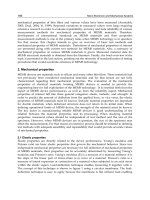
To find the brake power, it is necessary to apply a braking torque at the
shaft by means of a dynamometer. The simplest form of this is a rope-
brake dynamometer which consists of a rope wrapped around the
flywheel carrying a load. See Figure 2.4.11.
More sophisticated types used on high-speed engines are hydraulic or
electrical. They all do the same job in allowing the value of braking
torque applied to the engine to be measured.
This value is put into the formula for rotary power, i.e. P = T, where
T is the torque in N.m and is the speed of rotation in rad/s. can be
inserted as 2n, since there are 2 radians in one revolution and n is the
rev/s. We then have the usual form of the equation for brake power,
bp=2n.T
Putting in the units, we have,
bp =
1
s
× N.m =
N.m
s
=
J
s
= watts
Note again that ‘rev’ is dimensionless, as is 2.
For the rope-brake dynamometer in Figure 2.4.10, the friction load on
the flywheel is,
(W – S) newtons
where W is the applied weight and S is the spring balance reading.
The friction torque is,
(W – S) × r
where r is the radius of the flywheel.
The brake power is then given by,
bp=(W – S) × r × watts
Figure 2.4.11 Rope brake
dynamometer
Key point
When dealing with brake
power, remember that we are
dealing with the power ouput
from the engine, i.e. from all
the cylinders combined in a
multi-cylinder engine. We
usually assume that each
cylinder is delivering the
same power.
46 Thermodynamics
Brake mean effective pressure, P
mb
It was explained (see page 36) that a value of brake mean effective
pressure, P
mb
, is used as a comparator between engines, because it is
easier to find than indicated mean effective pressure, P
mi
.
Brake mean effective pressure is calculated from the indicated power
formula with brake power and P
mb
substituted,
bp = P
mb
× A × L × n
Fuel consumption
The fuel consumption of an engine is of great importance, and is
affected by detail engine design. The figure most often used to express
it is a specific fuel consumption (sfc) based on the number of kg of fuel
burned per second for a unit of power output, i.e. the kg of fuel burned
per second for each brake kW.
sfc =
kg fuel burned per sec
brake power in kW
putting in the units,
sfc =
kg
s
×
s
kJ
=
kg
kJ
An alternative is to express the fuel consumption for each unit of power,
e.g for 1 kWh, brake or indicated. A kilowatt hour is a power of 1 kW
delivered for 1 hour.
We then have,
Brake specific fuel consumption,
bsfc =
kg fuel burned per hour
bp
= kg/bkWh
and
Indicated specific fuel consumption,
isfc =
kg fuel burned per hour
ip
= kg/ikWh
These values are also often quoted in grammes, i.e. g/kWh.
Brake and indicated thermal efficiency
The thermal efficiency of the engine can be found by considering, as
for all values of efficiency, what we get out for what we put in. In this
case we get out a value of brake power and we put in heat energy
from the fuel burned. The amount of heat energy we put in is the kg
of fuel burned per second multiplied by the calorific value of the fuel,
CV in kJ/kg.
Thermodynamics 47
If we are using the brake power, the efficiency we get is called the
brake thermal efficiency,
b
.
b
=
brake power
kg fuel per sec × CV
which gives units,
b
= kW ×
s
kg
×
kg
kJ
=1
This can be a decimal 0–1, or a percentage.
Indicated thermal efficiency is found in a similar way, i.e.,
i
=
indicated power
kg of fuel per sec × CV
Example 2.4.6
An indicator diagram taken from a large diesel engine has an
area of 400 mm
2
and length 50 mm. The indicator spring is
such that the scale of the pressure axis is 1 mm = 1 bar. If
the cylinder diameter and stroke are both 250 mm and the
engine is 4-stroke running at 6 rev/s, find the indicated power
if the engine has six cylinders.
Mean effective pressure = P
mi
=
area of diagram
length of diagram
× spring rate
=
400
50
× 1 × 10
5
=8 × 10
5
N/m
2
Indicated power = P
mi
A.L.n
=8 × 10
5
×
× 0.25
2
4
× 0.25 ×
6
2
= 29 452 W per cylinder
Indicated power = ip per cylinder × number of cylinders
= 176 715 W =176.7 kW
48 Thermodynamics
Example 2.4.7
The area of an indicator diagram taken off a 4-cylinder,
4-stroke engine when running at 5.5 rev/s is 390 mm
2
, the
length is 70 mm, and the scale of the indicator spring is
1 mm = 0.8 bar. The diameter of the cylinders is 150 mm and
the stroke is 200 mm. Calculate the indicated power of the
engine assuming all cylinders develop equal power.
P
m
=
A
L
× spring rate =
390
70
× 0.8
= 4.46 bar = 4.46 × 10
5
N/m
2
ip = P
m
A.L.n × number of cylinders
= 4.46 × 10
5
×
× 0.15
2
4
× 0.2 ×
5.5
2
× 4
= 17 339 W = 17.34 kW
Example 2.4.8
During a test, a 2-cylinder, 2-stroke diesel engine operating at
2.75 rev/s records at the dynamometer a brake load of 2.7 kN
acting at a radius of 1.6 m. The bore of the cylinder is 0.35 m
and the stroke is 0.5 m. If the indicated mean effective
pressure is 3 bar, calculate:
(a) the indicated power;
(b) the brake power;
(c) the mechanical efficiency.
ip = P
mi
A.L.n =3 × 10
5
×
× 0.35
2
4
× 0.5 × 2.75 × 2
= 79 374 W = 79.37 kW
bp = T = (2.7 × 1.6) × 2.75 × 2
= 74.64 kW
Note: Torque = force × radius.
m
=
bp
ip
=
74.64
79.37
= 0.94 = 94%
Thermodynamics 49
Example 2.4.9
A marine 4-stroke diesel engine develops a brake power of
3200 kW at 6.67 rev/s with a mechanical efficiency of 90%
and a fuel consumption of 660 kg/hour. The engine has eight
cylinders of 400 mm bore and 540 mm stroke. Calculate:
(a) the indicated mean effective pressure;
(b) the brake thermal efficiency.
The calorific value of the fuel = 41.86 MJ/kg.
m
=
bp
ip
ip =
bp
m
=
3200
0.9
= 3555.6 kW
ip = P
m
A.L.n
3555.6
8
= P
mi
×
× 0.4
2
4
× 0.54 ×
6.67
2
P
mi
=
3555.6 × 4 × 2
8 × × 0.4
2
× 0.54 × 6.67
= 1963.9 kN/m
2
= 19.63 bar
Brake thermal efficiency =
brake power
kg fuel/s × CV
=
3200
660
3600
× 41.86 × 10
3
= 0.417 = 41.7%
Example 2.4.10
A 6-cylinder 4-stroke internal combustion engine is run on
test and the following data was noted:
Compression ratio = 8.2:1 Speed = 3700 rpm
Brake torque = 0.204 kN.m Bore = 90 mm
Fuel consumption = 26 kg/h Stroke = 110 mm
Calorific value of fuel = 42 MJ/kg
Indicated mean effective pressure = 7.82 bar
Calculate:
(a) the mechanical efficiency;
(b) the brake thermal efficiency;
(c) the brake specific fuel consumption.
50 Thermodynamics
ip = P
mi
A.L.n × number of cylinders
= 782 × ×
0.09
2
4
× 0.11 ×
3700
120
× 6 = 101.2 kW
bp = T. = 0.204 ×
3700 × 2
60
=79kW
m
=
bp
ip
=
79
101.2
= 0.781 = 78.1%
b
=
bp
kg fuel/s × CV
=
79
26
3600
× 42 × 10
3
= 0.26 = 26%
Brake specific fuel consumption =
kg fuel/h
brake power
=
26
79
= 0.329 kg/kWh
Volumetric efficiency
The volumetric efficiency of an engine – or a reciprocating compressor
– is a measure of the effectiveness of the engine in ‘breathing in’ a fresh
supply of air.
Under perfect circumstances, when the piston starts to move from top
dead centre down the cylinder, fresh air is immediately drawn in.
However, above the piston at TDC there is a residual pressure which
remains in the cylinder until the piston has moved down the cylinder a
sufficient distance to relieve it and create a pressure slightly below
atmospheric. Only then will a fresh charge of air be drawn in.
A further difficulty is the heating of the air in the hot inlet manifold,
which also reduces the mass of air entering the cylinder.
The ratio of the swept volume of the engine to the volume of air
actually drawn in is called the volumetric efficiency,
v
.
v
=
volume of charge induced at reference temperature and pressure
piston swept volume
The reference temperature and pressure are usually the inlet conditions.
Example 2.4.11
A 4-stroke, 6 cylinder engine has a fuel consumption of 26 kg/
h and an air/fuel ratio of 21:1. The engine operates at
3700 rpm and has a bore of 90 mm, stroke 110 mm. Calculate
the volumetric efficiency referred to the inlet conditions of
1 bar, 15°C. R = 287 J/kgK.
Thermodynamics 51
Using the characteristic gas equation, p
1
V
1
= m.R.T
1
Volume of air induced/minute
=
m.R.T
1
p
1
=
(26 × 21)
60
× 287 × (15 + 273)
1 × 10
5
= 7.52 m
3
/min
Swept volume =
× 0.09
2
4
× 0.11 = 7 × 10
–4
m
3
/rev
=7×10
–4
×
3700
2
× 6 = 7.76 m
3
/min
v
=
volume induced at reference
swept volume
=
7.52
7.76
= 0.97 = 97%
If, given a volume, you need to change it to a different set of
conditions, use can be made of
p
1
V
1
T
1
=
p
2
V
2
T
2
Case study
Marine diesels
Diesel engines are produced by many manufacturers, in a range
of power outputs, for very many applications.
The largest diesel engines are to be found in ships, and these
operate on the 2-stroke cycle, which makes them quite unusual.
The piston is bolted to a piston rod which at its lower end attaches
to a crosshead running in vertical guides, i.e. a crosshead
bearing. A connecting rod then transmits the thrust to the crank to
turn the crankshaft. The arrangement is the same as on old triple
expansion steam engine, from which they were derived. They
have the further peculiarity of being able to run in both directions
by movement of the camshaft. This provides astern movement
without the expense of what would be a very large gearbox.
These very large engines are the first choice for most merchant
ships because of their economy and ability to operate on low
quality fuel. A typical installation on a container ship, for instance,
would be a 6-cylinder turbocharged engine producing 20 000 kW
at a speed of about 100 rpm. The engine is connected directly to
a fixed-pitch propeller.
Most diesel engines are now turbocharged. Exhaust gas from
the engine drives a gas turbine connected to a fan compressor
52 Thermodynamics
which forces air into the cylinder at a raised pressure. This has the
main advantage of charging the cylinder with a greater mass of air
(the mass is proportional to the pressure, from pV = m.R.T),
thereby allowing more fuel to be burned, so for the same size
cylinder more power can be produced. An added advantage in the
case of a 2-stroke engine is that by pressurizing the air into the
cylinder, the exhaust gas is more effectively removed or ‘scav-
enged’ before the next cycle begins
One of the main problems with large slow-speed engines is the
headroom necessary to accommodate them, and in a vessel such
as a car ferry, they are not usually fitted because they would limit
car deck space. Instead, medium-speed engines are used which
are 4-stroke and are of the more usual trunk-piston configuration,
the same as a car engine and almost all other engines too.
One of the latest engines, developed for fast ferries, has the
following particulars:
Power output 8200 kW
Operating cycle 4-stroke
Number of cylinders 20, in ‘V’ configuration
Bore 265 mm
Stroke 315 mm
Operating speed 1150 rpm
Dimensions 7.4 m long × 1.9 m wide × 3.3 m high
Weight 43 tonnes (43 000 kg)
Mean effective pressure 24.6 bar
Specific fuel consumption 195 kg/kWh
Time between overhauls 24 000 hours
The engine has a single large turbocharger at one end. Clearly,
this is a sizeable engine, and typically a large ferry would need
two or three of them. Most cruise ships also have these ‘medium-
speed’ diesel engines.
Many manufacturers produce a single engine design in which
the number of cylinders in the complete engine can be varied to
suit the required output. This simplifies spares and maintenance
requirements and means that the engine builder can tailor an
engine of a standard design to meet different requirements.
The details below illustrate this for an engine type now in
production. Note the number of variations which can be obtained
and therefore the range of power outputs available:
Operating cycle 2-stroke
Bore 350 mm
Stroke 1400 mm
Number of cylinders 4, 5, 6, 7, 8, 9, 10, 11 or 12
Power output 2900–8900 kW
Mean effective pressure 19 bar
Fuel consumption 180 g/kWh
Thermodynamics 53
Review exercise problems 2.4.2
(1) An indicator diagram taken from one cylinder of a 6-cylinder
2-stroke engine has an area of 2850 mm
2
and length 75 mm
when running at 2 rev/s. The indicator spring rate is
1 mm = 0.2 bar. Given that the cylinder bore is 550 mm and
the stroke is 850 mm, calculate the indicated power of the
engine, assuming each cylinder develops the same power.
(2) A 6-cylinder, 4-stroke diesel engine has a bore of 150 mm
and a stroke of 120 mm. The indicated mean effective
pressure is 9 bar, the engine runs at 300 rpm, and the
mechanical efficiency is 0.85. Calculate the indicated power
and the brake power.
(3) A single cylinder 4-stroke engine is attached to a dynamome-
ter which provides a braking load of 362 N. The radius at
which the brake acts is 800 mm. If at this load the engine has
a speed of 318 rpm, find the brake power.
(4) A single cylinder 4-stroke oil engine has a cylinder diameter
of 180 mm and stroke 300 mm. During a test, the following
results were recorded,
Area of indicator = 500 mm
2
Brake load radius = 780 mm
Length of indicator card = 70 mm Engine speed = 5 rev/s
Card scale (spring rate), Fuel consumption = 3.2 kg/h
1 mm = 0.8 bar Calorific value of
Brake load = 354 N fuel = 43.5 MJ/kg
Calculate:
(a) the indicated power;
(b) the brake power;
(c) the brake thermal efficiency.
(5) A 3-cylinder, 4-stroke engine has a bore of 76 mm and a
stroke of 125 mm. It develops 12 kW at the output shaft when
running at 1500 rpm. If the mechanical efficiency is 85% and
it burns 3.2 kg of oil per hour of calorific value 42 000 kJ/kg,
find the indicated mean effective pressure, assuming all
cylinders produce the same power, and the brake thermal
efficiency.
(6) A 4-cylinder, 4-stroke engine of 78 mm bore and 105 mm
stroke develops an indicated power of 47.5 kW at 4400 rpm.
The air/fuel ratio is 21 kg air/kg fuel, the fuel consumption is
13.6 kg/h and the calorific value of the fuel is 41.8 MJ/kg.
Calculate for the engine:
(a) the indicated mean effective pressure;
(b) the indicated thermal efficiency;
(c) the volumetric efficiency referred to inlet conditions of
1 bar, 15°C.
R = 287 J/kgK
(7) A 6-cylinder, 4-stroke diesel engine has a bore of 210 mm
and a stroke of 315 mm. At 750 rpm, the brake mean
effective pressure is 4.89 bar and the specific brake fuel
consumption is 0.195 kg/kWh. The air to fuel mass flow ratio
is 28 to 1 and the atmospheric conditions are 0.95 bar, 17°C.
Calculate the volumetric efficiency.
54 Thermodynamics
(8) (a) Derive an expression for the brake thermal efficiency of
an engine.
(b) If an engine has an indicated power of 45 kW and a
mechanical efficiency of 85%, determine its brake
thermal efficiency if it consumes 0.156 kg/min of fuel of
calorific value 42 MJ/kg.
2.5 The steady
flow energy
equation (SFEE)
In machinery such as turbines, boilers and nozzles, there is flow of the
working fluid at a constant rate into and out of the system. This is also
true of the internal combustion engine if we place the system boundary
outside the cylinders to encompass the inlet and outlet valves.
In this chapter, we look at cases of steady flow and apply appropriate
expressions, beginning by looking at all the elements involved in the
steady flow process and then calculating values of work done and heat
energy transferred. We are then in a position to find power and
efficiency. Also in this chapter, we look at the effect of change of
entropy during a steady flow process.
Figure 2.5.1 represents a steady flow system. To arrive at the steady
flow energy equation, we need to include all the energies involved.
These are:
᭹ Kinetic energy
᭹ Potential energy
᭹ Internal energy
᭹ Work energy
᭹ Heat energy
Kinetic energy (due to motion), potential energy (due to height above a
datum), and internal energy (the intrinsic energy contained by a fluid
because of its temperature), are well known, and we also know that
work can be done and heat energy transferred to or from the system.
In order to enter and leave the system, the fluid must do work on the
system and on the surroundings. That is, in order to enter the system, the
fluid outside must expend energy to push in, and in order to leave the
system the fluid inside must expend energy to push out.
This is calculated by multiplying the pressure by the volume flow rate
of fluid entering the system and leaving the system, but instead of using
volume flow rate in m
3
/s, it is convenient to use specific volume, i.e. the
volume which 1 kg of the fluid occupies, and multiply this by the mass
flow rate of the fluid in kg/s. This is so we can bracket quantities and
multiply them all by a mass flow rate.
Hence,
Volume flow rate = mass flow rate × specific volume
=
m
3
kg
×
kg
s
=
m
3
s
=
˙
m.v
Figure 2.5.1 Steady flow
system
Thermodynamics 55
Pressure × volume flow rate =
N
m
2
×
m
3
s
=
N.m
s
=
joules
s
=W=
˙
m.p.v
We can now say that the total energy entering the system is the same as
the total energy leaving the system, and produce an equation, assuming
Q is supplied to the fluid and W is done by the fluid, and remembering
that in this case, Q and W are per second,
Q +
˙
m
u
1
+ z
1
g +
c
2
1
2
+
˙
mp
1
v
1
= W +
˙
m
u
2
+ z
2
g +
c
2
2
2
+ ˙mp
2
v
2
The u, z and c terms represent the internal, potential and kinetic energies
respectively.
Q – W =
˙
m
΄
(u
2
+ p
2
v
2
) – (u
1
+ p
1
v
1
) +
c
2
2
– c
2
1
2
+ (z
2
g – z
1
g)
΅
writing
h
1
=(u
1
+ p
1
v
1
), and h
2
=(u
2
+ p
2
v
2
)
and neglecting potential energy terms,
Q – W =
˙
m
΄
(h
2
– h
1
) +
c
2
2
– c
2
1
2
΅
This is the form of the steady flow energy equation which is suitable for
most cases.
Where:
Q = rate of heat energy transfer to or from the system, kJ/s = (kW)
W = rate of work energy transfer to or from the system, kJ/s = (kW)
˙
m = mass flow rate of the fluid
kg
s
h = specific enthalpy
kJ
kg
c = velocity of fluid
m
s
.
Note that in this case, Q and W are per second.
Putting in the units,
J
s
=
΄
kg
s
J
kg
+
m
2
s
2
΅
=
΄
J
s
+
kg.m
2
s.s
2
΅
=
΄
J
s
+
kg.m
s
2
m
s
΅
=
΄
J
s
+
N.m
s
΅
=
J
s
Note: 1 newton =
1 kg.m
s
2
, from force = mass × acceleration.
56 Thermodynamics
Enthalpy
We have given the symbol h, specific enthalpy, for the sum of the
internal energy u, and the product of pressure and volume, pv, i.e.
h = u + pv
h is the specific enthalpy of the fluid, a property which is found in tables
of properties, e.g. for steam and refrigerants, and can be thought of as
a figure for the ‘total energy’ of a fluid.
For a perfect gas, the specific enthalpy change is calculated using,
h
2
– h
1
= c
p
.(T
2
– T
1
)
Example 2.5.1
Gas enters a turbine with a velocity of 15 m/s at a rate of
4500 kg/h and is discharged with a velocity of 180 m/s. If the
turbine loses 20 kJ to the surroundings for every kg of gas
flow, calculate the power developed if the enthalpy drop is
420 kJ/kg. Figure 2.5.2 represents the turbine.
Q – W = m
΄
(h
2
– h
1
) +
c
2
2
– c
2
1
2
΅
Mass flow of gas =
4500
3600
= 1.25 kg/s
(–20 000 × 1.25) – W = 1.25
΄
–420 000 +
180
2
– 15
2
2
΅
–25 000 – W = –525 000 + 20 109
–W = –525 000 + 20 109 + 25 000 = –497 981 J
W = 480 kW
Example 2.5.2
Air is delivered to a diffuser at 2 bar, 170°C. The air velocity
is reduced from 300 m/s at inlet to 50 m/s at outlet. Assuming
adiabatic flow, find the air pressure at diffuser outlet.
c
p
= 1005 J/kgK
␥ = 1.4
See Figure 2.5.3.
Key points
᭹ Heat energy is rejected
and is therefore negative.
᭹ There is an enthalpy drop
through the turbine, so
this is also negative.
᭹ Quantities have been
changed to joules so that
velocities can be entered
in m/s.
Figure 2.5.2 Example 2.5.1
Figure 2.5.3 Example 2.5.2
Thermodynamics 57
Q – W = m
΄
(h
2
– h
1
) +
c
2
2
– c
2
1
2
΅
0 – 0=m
΄
(h
2
– h
1
) +
50
2
– 300
2
2
΅
–(h
2
– h
1
)=
50
2
– 300
2
2
= –43 750
h
1
– h
2
= c
p
(T
1
– T
2
)=–43 750 (from ␦h = m.c
p
␦T)
1005(170 – T
2
)=–43 750, T
2
= 213.5°C
T
2
T
1
=
p
2
p
1
␥–1
␥
,
213.5 + 273
170 + 273
=
p
2
2
1.4–1
1.4
,
486.5
443
=
p
2
2
0.286
, p
2
= 2.78 bar
Applications of the SFEE
In each case we will begin by writing down the SFEE. We can then take
out non-relevant properties.
Steam or gas turbine
Q – W =
˙
m
΄
(h
2
– h
1
) +
c
2
2
– c
2
1
2
΅
Usually, we can neglect the heat loss from the turbine because the fluid
flows through very quickly, giving insufficient time for heat energy
transfer to occur. Also, because the inlet and outlet velocities are similar,
the kinetic energy term can be neglected.
This leaves us with an extremely useful equation,
–W =
˙
m(h
2
– h
1
)
This is written as,
W =
˙
m(h
1
– h
2
)
in order to give a positive value of work when point 1 is turbine inlet.
For a steam turbine, the values of h are obtained from steam tables.
For a gas turbine, the enthalpy difference is obtained from,
˙
m(h
1
– h
2
)=
˙
m.c
p
(T
1
– T
2
)
This expression is true for any process.
Key points
᭹ A diffuser has no moving
parts, so there is no work
done, and because the
flow is assumed to be
adiabatic, there is no heat
energy transfer.
᭹ A diffuser is the opposite
of a nozzle, it being diver-
gent, producing a pres-
sure rise between inlet
and exit.
᭹ To find the final pressure,
we have made use of an
expression we have used
so far only in non-flow
processes, and applied it
across the inlet and exit
points in this steady flow
system.
58 Thermodynamics
Putting in units,
˙
m(h
1
– h
2
)=
kg
s
×
kJ
kg
=
kJ
s
=kW
˙
m.c
p
(T
1
– T
2
)=
kg
s
×
kJ
kg.K
× K=
kJ
s
=kW
Example 2.5.3
A steam turbine receives steam with an enthalpy of 3467 kJ/
kg. At the outlet from the turbine, the enthalpy of the steam is
2570 kJ/kg. If the mass flow rate of steam is 2 kg/s, find the
power of the turbine.
W =
˙
m(h
1
– h
2
) = 2(3476 – 2570) = 1812 kW
Example 2.5.4
The temperature of the gas entering a turbine is 750°C. If the
gas leaves the turbine at a temperature of 500°C, and the
mass flow rate of the gas is 3.5 kg/s, calculate the power
developed by the turbine.
c
p
= 980 J/kgK
W =
˙
m.c
p
(T
1
– T
2
) = 3.5 × 980 × (750 – 500)
= 857 500 J = 857.5 kJ
Compressor
The same argument concerning heat energy loss and fluid velocity
applies to the compressor. We are thinking here of the rotary, or axial
compressor, since for a reciprocating compressor we are more likely to
be considering the non-flow processes occurring in the cylinders.
The SFEE becomes
–W =(h
2
– h
1
)
Example 2.5.5
An axial flow gas compressor takes in gas with a specific
enthalpy of 200 kJ/kg, and discharges it to a receiver with a
specific enthalpy of 1500 kJ/kg. If the mass flow rate of the
gas is 5 kg/s, find the power required.
–W =
˙
m(h
2
– h
1
) = 5(1500 – 200) = 6500 kW
Key point
Power input is negative
because work is done on the
system.
Thermodynamics 59
Boiler
Q – W =
˙
m
΄
(h
2
– h
1
) +
c
2
2
– c
2
1
2
΅
A boiler does no work (there are no moving parts), and velocities into
and out of the boiler are low. The SFEE can therefore be written,
Q =
˙
m(h
2
– h
1
)
Example 2.5.6
A boiler receives feedwater with an enthalpy of 505 kJ/kg and
produces steam with an enthalpy of 2676 kJ/kg. Neglecting
losses, find the heat energy supplied to the boiler if the mass
flow rate is 2 kg/s.
Q =
˙
m(h
2
– h
1
) = 2(2676 – 505) = 4342 kW
Condenser
The condenser cools the vapour – steam or refrigerant – to produce a
liquid, usually by passing the vapour over tubes circulated with a cooler
liquid, or air. As in the case of the boiler, there are no moving parts, and
velocities are low.
The SFEE becomes,
Q =
˙
m(h
2
– h
1
).
Throttle
A throttle is used in steam plant for pressure reduction, for example in
a steam reducing valve to lower high pressure steam coming from a
boiler to make it suitable for heating purposes. Throttling involves
passing the steam through a restricting orifice, or a partially open valve,
thereby introducing friction to reduce the pressure.
There is very little time for heat energy transfer, velocities before and
after the orifice are similar, and there is no work done.
The SFEE becomes,
0=m(h
2
– h
1
)
hence,
h
2
= h
1
᭹ The enthalpy before and after throttling is the same. This is made
use of in the separating and throttling calorimeter which we look at
in the steam section.
Nozzle
Nozzles are used in gas and steam turbines, and in many other
applications to increase fluid velocity.
Key point
h
2
will be smaller than h
1
,
giving a negative Q, indicat-
ing heat energy given out by
the system.
60 Thermodynamics
Because fluid velocity is high, we can assume that no heat energy
transfer takes place through the nozzle, and there is no work done
because there are no moving parts.
The SFEE becomes,
0=
˙
m
΄
(h
2
– h
1
) +
c
2
2
– c
2
1
2
΅
If we assume a negligible inlet velocity, which is often the case, we can
transpose to give,
(h
1
– h
2
)=
c
2
2
2
c
2
=
ͱ
සසසසසස
2(h
1
– h
2
)
This is an expression for the velocity of the fluid leaving the nozzle.
Putting in units,
m
s
=
ͱ
ස
J
kg
=
ͱ
සස
N.m
kg
=
ͱසසස
kg.m.m
s
2
.kg
=
ͱ
ස
m
2
s
2
=
m
s
Example 2.5.7
Air enters a nozzle at 400°C with negligible velocity at a rate
of 1.2 kg/s. At the exit from the nozzle, the temperature is
110°C. Find the velocity at the nozzle exit and the nozzle exit
area if the specific volume of the air at the exit is 1.3 m
3
/kg.
c
p
= 1005 J/kgK
Figure 2.5.4 shows the nozzle.
c =
ͱ
සසසසසස
2(h
1
– h
2
)=
ͱසසසසසසසසස
2.c
p
(T
1
– T
2
)
=
ͱ
සසසසසසසසසසසස
2 × 1005(400 – 110) = 763.5 m/s
Volume flow rate = velocity × area
Area =
volume flow
velocity
=
mass flow × specific volume
velocity
=
1.2 × 1.3
763.5
= 0.002 m
2
Further use is made of the SFEE in the chapter on steam.
Figure 2.5.4 Example 2.5.7
Thermodynamics 61
Problems 2.5.1
(1) A steam turbine receives steam with a specific enthalpy of
3117 kJ/kg at a rate of 5 kg/s. At the turbine outlet, the
specific enthalpy of the steam is 2851 kJ/kg. Find the turbine
power in kW.
(2) A gas turbine develops 500 kW when the mass flow through
the turbine is 4 kg/s. Neglecting heat energy loss from the
turbine and gas velocity changes, determine the specific
enthalpy drop through the turbine.
(3) Gas enters a nozzle with negligible velocity and discharges
at 100 m/s. Determine the enthalpy drop through the
nozzle.
(4) A fluid flows through a turbine at the rate of 30 kg/min. Across
the turbine the specific enthalpy drop of the fluid is 580 kJ/kg
and the turbine loses 2500 kJ/min from the turbine casing.
Find the power produced neglecting velocity changes.
(5) An air compressor takes in air at 20°C and discharges it at
35°C when the gas flow rate is 2 kg/s. Find the power
absorbed by the compressor if it loses 50 kJ/min to the
surroundings.
c
p
= 1005 J/kgK
(6) Gas enters a nozzle with a velocity of 200 m/s, temperature
50°C. At the outlet from the nozzle, the gas temperature is
30°C. Determine the exit velocity of the gas, assuming no
heat energy losses.
C
p
= 950 J/kgK
(7) A nozzle receives steam with enthalpy 2900 kJ/kg at the rate
of 10 kg/min, and at the outlet from the nozzle the velocity is
1050 m/s. If the inlet steam velocity is zero and there are no
heat losses, find the specific enthalpy of the steam at the exit
and the outlet area of the nozzle if at this point the specific
volume of the steam is 20 m
3
/kg.
(8) A steam turbine receives steam with a velocity of 28 m/s,
specific enthalpy 3000 kJ/kg at a rate of 3500 kg per hour.
The steam leaves the turbine with a specific enthalpy of
2200 kJ/kg at 180 m/s. Calculate the turbine output, neglect-
ing losses.
Isentropic efficiency
A complication is introduced when finding the enthalpy after a process
if we consider change of entropy, s. So far we have mentioned entropy
only in saying that a reversible adiabatic process is isentropic, i.e. no
change in entropy. Since a process can be neither reversible nor
adiabatic, we can never have a process in which there is no change of
entropy; the entropy after the process is always greater than at the start
of the process.
Entropy can be defined as that property such that if we plot it against
absolute temperature, the area under the process curve is the heat energy
transferred.
62 Thermodynamics
From this,
␦s =
␦Q
T
The units of specific entropy are therefore J/kgK, or, more usually,
kJ/kgK.
From an engineer’s point of view it is sufficient to say at this stage
that the closer to zero change in entropy the process can be, the more
effective the process. For instance, if we have expansion of gas or steam
in a turbine, more of the heat energy is converted into work at the output
shaft if the change in entropy is small.
For a turbine or compressor, the change of entropy is indicated by the
‘isentropic efficiency’. The ideal is 100%, meaning no change in
entropy, but a typical value is 0.8–0.9.
We have already seen that the change in specific enthalpy of a perfect
gas is
␦h = c
p
.␦T
and that, from the SFEE, the power developed in, say, a turbine is
P =
˙
m(h
1
– h
2
)
᭹ Therefore the power produced is proportional to the change in
temperature through the turbine.
Figure 2.5.5 shows T/s axes for a perfect gas with lines of constant
pressure added.
Let us consider point 1 as the inlet condition to a gas turbine. If
expansion through the turbine is isentropic, i.e. no change in entropy,
the temperature drop is
(T
1
– TЈ
2
)
TЈ
2
denotes the isentropic point.
If entropy increases through the turbine, the exit point is at point 2 for
the same outlet pressure, and the temperature drop is
(T
1
– T
2
)
T
2
denotes the exit point if the expansion is not isentropic.
Clearly,
(T
1
– TЈ
2
) is greater than (T
1
– T
2
)
Therefore the work done and the power produced is greatest when the
expansion through the turbine is isentropic.
The ratio
(T
1
– T
2
)
(T
1
– TЈ
2
)
=
T
the isentropic efficiency of the turbine.
Figure 2.5.5 T/s axes for a
perfect gas
Key points
᭹ From the expression it
can be seen that if the
isentropic temperature
drop is known, the actual
temperature drop can be
found simply by multi-
plying by the isentropic
efficiency.
᭹ This is a ratio of tem-
peratures, but if it was
written as a correspond-
ing ratio of enthalpies, the
same answer would
result because, as we
have seen, for a perfect
gas, the enthalpy change
is directly proportional to
the temperature change.
Thermodynamics 63
The gas turbine
Figure 2.5.6 shows a simple open cycle gas turbine plant in which air is
compressed between 1 and 2, fuel is added in the combustion chamber
between 2 and 3 at constant pressure, and expansion of the hot gases
takes place in the turbine between 3 and 4. There are only two pressures
to consider, these are usually expressed as a pressure ratio across which
the turbine operates. These pressures are represented by the constant
pressure lines on the T/s and the p/V diagrams.
The compressor and turbine are on a common shaft, therefore some
of the work produced in the turbine is lost in driving the compressor.
Usually, the mass increase of the gases after the combustion chamber
because of fuel addition is neglected.
Figure 2.5.7 shows the cycle on T/s axes, assuming the compression
and expansion are not isentropic, and showing the isentropic lines as
dotted. Figure 2.5.7 also shows the cycle on p/V axes.
From the SFEE, we can establish the following expressions,
Work done by turbine = W
t
=(h
3
– h
4
)=c
p
(T
3
– T
4
)
Work to compressor = W
c
=(h
2
– h
1
)=c
p
(T
2
– T
1
)
Constant pressure heat addition at combustion chamber
=(h
3
– h
2
)=c
p
(T
3
– T
2
)
Plant efficiency = =
net work
heat energy input
=
W
t
– W
c
Q
cc
=
(h
3
– h
4
) – (h
2
– h
1
)
(h
3
– h
2
)
=
(T
3
– T
4
) – (T
2
– T
1
)
(T
3
– T
2
)
Figure 2.5.6 Simple open
cycle gas turbine
Figure 2.5.7 Gas turbine cycle
on p/V and T/s axes
64 Thermodynamics
Example 2.5.8
In an open cycle gas turbine plant, the pressure ratio is 5:1 and
the maximum cycle temperature is 650°C. The minimum cycle
temperature is 15°C and the isentropic efficiency of both the
turbine and the compressor is 0.86. Calculate the power
output if the mass flow rate through the turbine is 1 kg/s.
c
p
= 1005 kJ/kgK and ␥ = 1.4 for air and combustion gas
See Figure 2.5.8.
First, we find the isentropic temperature after compression.
TЈ
2
T
1
=
p
2
p
1
␥ – 1
␥
,
TЈ
2
(15 + 273)
=
5
1
1.4–1
1.4
,
TЈ
2
= 288 × 5
0.286
= 456.3 K
0.86 =
TЈ
2
– T
1
T
2
– T
1
, 0.86 =
456.3 – 288
T
2
– 288
,
T
2
=
(456.3 – 288)
0.86
+ 288 = 483.7 K
Following the same procedure through the turbine,
TЈ
4
T
3
=
p
4
p
3
␥–1
␥
,
TЈ
4
(650 + 273)
=
1
5
1.4–1
1.4
,
TЈ
4
= 923 × 0.2
0.286
= 582.5 K
T
=
T
3
– T
4
T
3
– TЈ
4
, 0.86 =
923 – T
4
923 – 582.5
,
T
4
= 923 – 0.86(923 – 582.5) = 630.17 K
Turbine power =
˙
m(h
3
– h
4
)=
˙
m.c
p
(T
3
– T
4
)
=1 × 1005 × (923 – 630.17) = 294.3 kW
Compressor power =
˙
m(h
2
– h
1
)=
˙
m.c
p
(T
2
– T
1
)
=1 × 1005 × (483.7 – 288) = 196.7 kW
Net power = turbine power – compressor power
= 294.3 – 196.7 = 97.6 kW
Figure 2.5.8 Example 2.5.8
Thermodynamics 65
Example 2.5.9
The compressor of a gas turbine receives air at a pressure
and temperature of 1.01 bar and 20°C respectively, and
delivers it to the combustion chamber at a pressure and
temperature of 4.04 bar and 200°C respectively. After
constant pressure heating to 680°C, the products of combus-
tion enter the turbine, which has an isentropic efficiency of
0.84. Calculate the compressor isentropic efficiency and the
thermal efficiency of the cycle.
For air, c
p
= 1.005 kJ/kgK, ␥ = 1.4
For combustion gases, c
p
= 1.15 kJ/kgK, ␥ = 1.33
See Figure 2.5.9.
TЈ
2
T
1
=
p
2
p
1
␥–1
␥
, TЈ
2
= 293 ×
4.04
1.01
0.286
, TЈ
2
= 435.4 K
c
=
TЈ
2
– T
1
T
2
– T
1
=
435.4 – 293
473 – 293
= 0.791
W
c
= c
p
(T
2
– T
1
) = 1.005(473 – 293) = 180.9 kJ/kg
TЈ
4
T
3
=
p
4
p
3
␥–1
␥
, TЈ
4
= 953 ×
1.01
4.04
1.33–1
1.33
, TЈ
4
= 676 K
T
= 0.84 =
T
3
– T
4
T
3
– TЈ
4
,=
953 – T
4
953 – 676
T
4
= 953 – 0.84(953 – 676) = 720.3 K
W
T
= c
p
(T
3
– T
4
) = 1.15(953 – 720.3) = 267.6 kJ/kg
Net work = W
T
– W
c
= 267.6 – 180.9 = 86.7 kJ/kg
Heat energy input at combustion chamber
= c
p
(T
3
– T
2
) = 1.005(953 – 473) = 482.4 kJ/kg
Thermal efficiency of plant =
net work
heat energy in
=
86.7
482.4
= 0.18 = 18%
Figure 2.5.9 Example 2.5.9
66 Thermodynamics
Problems 2.5.2
In all cases, sketch the T/s diagram and a line diagram of the plant
with given temperatures and pressures.
(1) In a gas turbine cycle, 4.5 kg/s of air enters a rotary
compressor at a pressure and temperature of 1 bar and 18°C
respectively. It is compressed through a pressure ratio of 5 to
1 with an isentropic efficiency of 0.85 and then heated to a
temperature of 810°C in the combustion chamber. The air is
then expanded in a gas turbine to a pressure of 1 bar with an
isentropic efficiency of 0.88. Calculate the net power output
of the plant and the thermal efficiency. c
p
= 1.006 kJ/kgK
and ␥ = 1.4 for both air and combustion gases.
(2) Air enters an open cycle gas turbine plant with an initial
pressure and temperature of 1 bar and 15°C respectively
and is compressed to a pressure of 6 bar. The combustion
gas enters the turbine at a pressure and temperature of 6 bar
and 727°C respectively and expands in two stages of equal
pressure ratios to the initial pressure. The gases are
reheated at constant pressure between the stages. If the
isentropic efficiency of the compressor is 0.8, and the
isentropic efficiency of the turbine is 0.85, calculate the work
output per kg of air and the cycle efficiency.
(3) An open cycle gas turbine plant operates between pressures
of 6 bar and 1 bar, and air enters the compressor at 20°C at
a rate of 240 kg/min. After the combustion chamber, the gas
temperature is 710°C. Given that the isentropic efficiencies
of compressor and turbine are 0.78 and 0.837 respectively,
calculate the output power and the thermal efficiency of the
plant. For air and combustion gases, c
p
= 1.005 J/kgK,
c
v
= 0.718 J/kgK.
(4) An open cycle gas turbine operates with a minimum
temperature of 18°C, a pressure ratio of 4.5:1, and isentropic
efficiencies of 0.85 for compressor and turbine. The fuel
used has a calorific value of 42 MJ/kg, and the air/fuel ratio in
the combustion chamber is 84 kg air/kg fuel. Calculate the
thermal efficiency of the cycle.
(Note: equate heat addition in combustion chamber to m.c
p
.␦T, to
find T
3
, neglecting mass increase due to fuel addition.)
c
p
= 1005 J/kgK, ␦ = 1.4 for both air and combustion gases.
2.6 Steam
This section requires the use of ‘steam tables’, i.e. tables of steam
properties.
Steam is used extensively in heating and power systems throughout
industry and in power stations nuclear and conventional. It is true to say
that our computers would be of no account without the existence of
steam turbines producing the electricity to power them.
This chapter explains how steam is produced, the terminology used
and how thermodynamic properties can be found and applied to steam
processes and plant. We distinguish between different types of steam,
use property tables, apply the effects of entropy change during a process
and look at steam flow and non-flow processes.