Báo cáo y học: "The impact of study design and diagnostic approach in a large multi-centre ADHD study. Part 1: ADHD symptom patterns" ppsx
Bạn đang xem bản rút gọn của tài liệu. Xem và tải ngay bản đầy đủ của tài liệu tại đây (485.61 KB, 21 trang )
The impact of study design and diagnostic
approach in a large multi-centre ADHD study.
Part 1: ADHD symptom patterns
Müller et al.
Müller et al. BMC Psychiatry 2011, 11:54
(7 April 2011)
RESEARCH ARTICLE Open Access
The impact of study design and diagnostic
approach in a large multi-centre ADHD study.
Part 1: ADHD symptom patterns
Ueli C Müller
1,2*
, Philip Asherson
3
, Tobias Banaschewski
4,12
, Jan K Buitelaar
5
, Richard P Ebstein
6
, Jaques Eisenberg
6
,
Michael Gill
7
, Iris Manor
8
, Ana Miranda
9
, Robert D Oades
10
, Herbert Roeyers
11
, Aribert Rothenberger
12
,
Joseph A Sergeant
13
, Edmund JS Sonuga-Barke
11,14
, Margaret Thompson
14
, Stephen V Faraone
15
and
Hans-Christoph Steinhausen
1,16,17
Abstract
Background: The International Multi-centre ADHD Genetics (IMAGE) project with 11 participating centres from 7
European countries and Israel has collected a large behavioural and genetic database for present and future
research. Behavioural data were collected from 1068 probands with the combined type of attention deficit/
hyperactivity disorder (ADHD-CT) and 1446 ‘unselected’ siblings. The aim was to analyse the IMAGE sample with
respect to demographic features (gender, age, family status, and recruiting centres) and psychopathological
characteristics (diagnostic subtype, symptom frequencies, age at symptom detection, and comorbidities). A
particular focus was on the effects of the study design and the diagnostic procedure on the homogeneity of the
sample in terms of symptom-based beh avioural data, and potential consequences for further analyses based on
these data.
Methods: Diagnosis was based on the Parental Account of Childhood Symptoms (PACS) interview and the DSM-IV
items of the Conners’ teacher questionnaire. Demographics of the full sample and the homogeneity of a
subsample (all probands) were analysed by using robust statistical proce dures which wer e adjusted for unequal
sample sizes and skewed distributions. These procedures included multi-way analyses based on trimmed means
and winsorised variances as well as bootstrapping.
Results: Age and proband/sibling ratios differed between participating centres. There was no significant difference
in the distribution of gender between centres. There was a sig nificant interaction between age and centre for
number of inattentive, but not number of hyperactive symptoms. Higher ADHD symptom frequencies were
reported by parents than teachers. The diagnostic symptoms differed from each other in their frequencies. The
face-to-face interview was more sensitive than the questionn aire. The differentiation between ADHD-CT probands
and unaffected siblings was mainly due to differences in hyperactive/impulsive symptoms.
Conclusions: Despite a symptom-based standardized inclusion procedur e according to DSM-IV criteria with
defined symptom thresholds, centres may differ markedly in probands’ ADH D symptom frequencies. Both the
diagnostic procedure and the multi-centre design influence the behavioural characteristics of a sample and, thus,
may bias statistical analyses, particularly in genetic or neurobehavioral studies.
Keywords: ADHD multi-centre study, sibling design, ADHD, informant effects, centre effects
* Correspondence:
1
Department of Child and Adolescent Psychiatry, University of Zurich,
Switzerland
Full list of author information is available at the end of the article
Müller et al. BMC Psychiatry 2011, 11:54
/>© 2011 Müller et al; licensee BioMed Central Ltd. This is an Open Access article distributed under the terms of the Creative Commons
Attribution License ( which permits unrestricted use, distribution, and reproduction in
any medium, provided the original work is properly cited.
Background
Attention Deficit Hyperactivity Disorder ADHD is char-
acterized by problems in allocating attention, regulat ing
motor activity, and controlling behavioural impulses.
Depending on diagnostic procedures, around 3 to 8 per-
cent of the children worldwide are aff ected by ADHD
[1,2]. According to dominant symptom clusters, three
diagnostic subtypes of ADHD are distinguished: inatten-
tive type (ADHD-IT), hyperactive/impulsive type
(ADHD-HT), and combined type (ADHD-CT) [3].
At least half of the children with ADHD suffer from
one or more comorbid disord ers, of which oppositional
defiant disorder, conduct disorder, anxiety disorders,
and mo od disorders ar e the most common [4-7].
Although symptoms of inattention and, even more
markedly, hyperactivity and impulsivity, decline from
childhood to adolescence [8], ADHD may persist com-
pletely or partially into adulthood and may constitute a
risk factor for mood and anxiety disorders, substance
abuse, learning disabilities, personality disorders, and
impulse control disorders. Furthermore, ADHD may
have a serious impact on education, employment and
social functioning [9-15].
Twin and adoption studies have shown that the mean
heritability of ADHD accounts for about 75% of the var-
iance in symptoms suggesting that genetic factors play
an important role in the aetiology of ADHD [16]. How-
ever, identifying susceptibility genes for ADHD is still
difficult, because ADHD is a complex and heteroge-
neous disorder not only with respect to clinical diagno-
sis and treatment but also in terms of genetic and
environmental causes and their interactions [16,17]. As
a consequence, large samples are needed in order to
have sufficient power for the detection of genetic var-
iants implicated in ADHD [18,19]. Collaboration
between several research centres is a method for
increasing the size of a study sample without increasing
the time of data collection. The International Multicen-
tre ADHD Genetics (IMAGE) project included 11 cen-
tres in 8 countries in the collection of behavioural data
from 1400 European sibling pairs and gene tic data on
the children and their parents. Moreover, the IMAGE
project provides a large database for future research
because cell lines containing DNA from the sample
have been stored and allow
infinite DNA replication for future genetic analyses [20].
Until now, a v ariety of different analyses based on the
IMAGE dataset or parts of it including molecular
genetic studies have been published. These studies
invest igated the g enetic association or linkage to ADHD
[21-32], comorbidities [33-38], intelligence [39], neur op-
sychology [40-42], season of birth [43], parent of origin
effect [44], age of ADHD onset [22], parental expressed
emotion [45], and genetic population differences [46]. A
periodically updated list of IMAGE publications is avail-
able at the IMAGE homepage />. The present contribution presents a comprehensive
description and analysis of the diagnostic profile of
those children who completed the full diagnostic pro-
cess, including the interview, i.e., all 1068 probands of
the IMAGE sample and the 339 siblings who were sus-
pected to have ADHD.
Data were co llect ed from different centres to enlarge
the sample size and. hence, gaining power in statistical
analyses. However, the subsamples of the different cen-
tres may differ from each other in numerous aspects in
spite of standar dized recruiting procedures, leading to a
greater heterogeneity and a loss of statistical power.
Thus, in multi-centre studies like the IMAGE project
one might arrive at a conflict between a gain in statisti-
cal power by enlarging the sample size and a loss of
power due to greater variance of data stemming from
differences between centres.
Thediagnosticproceduremaybeanothersourceof
heterogeneity which is, more difficult to measure and
control in comparison to the variance due to centre dif-
ferences. The IMAGE project used DSM-IV diagnostic
criteria which required probands to a pre-defined symp-
tom threshold along with meeting criteria for age at
onset and impairment [3]. Particularly in genetic ana-
lyses, it is important to account for possible discrepan-
cies between the variation of ADHD symptoms with age
and gender in the population, and a symptom based
diagnostic procedure which is insensitive to these effects
to a large extent. Consequently, children with an identi-
cal diagnostic profile but of different age o r gender may
differ systematically from each other not only with
respect to their deviation from age and gender specific
population means but also by their genetic profile.
The present analyses investigated the individual con-
tribution of each DSM-IV ADHD symptom to the dis-
crimination between probands and unaffected siblings.
It also identified factors influencing the operational deci-
sion on the presence of a single symptom. Furthermore,
there was a specific interest in the analyses of informant
effects (parent vs. teacher ratings) and diagnostic instru-
ment effects (interview vs. questionnaire) on frequencies
of each of the 18 DSM-IVADHD symptoms. To sum-
marize, findings based on the following analyses will be
presented:
- differences in age and sample size across gender,
family status, and centres
- differences in the number of symptoms and d iffer-
ences in the age the first symptom was detected
across gender and diagnostic subtypes
Müller et al. BMC Psychiatry 2011, 11:54
/>Page 2 of 20
- comparison of frequencies of diagnostic subtypes
across centres in the sibling sample
- differences in medication across diagnostic sub-
types and centres
- comparison of centre effects on mean symptom
frequencies across all 18 DSM-IV ADHD symptoms
- informant effects on each of the 18 diagnostic
ADHD symptoms
- differences between interview and questionnaire
ratings on each of the 18 DSM-IV ADHD symptoms
- discriminant diagnostic strength of all ADHD
symptoms
- centre and gender effects on comorbid symptoms
in probands.
A comprehensive analysis of the dimensional beha-
vioural measures of the IMAGE sample, i.e. the ques-
tionnairescoresandtheIQfindingsinthewhole
IMAGE sample of 1068 probands and 1446 unselected
siblings, is provided in a companion paper [47].
Methods
Participants and study protocol
The participating families were r ecruited between April
2003 and April 2007 in 11 European specialist ADHD
centres: Amsterdam (NLD_A), Dublin (IRL_D), Essen
(GER_E), Gent (BEL_G), Göttingen (GER_G), Jerusalem
(ISR_J), London and Southamptom (ENG_L/S), Nijme-
gen (NLD_N), Petah Tiqva (ISR_P), Valencia (ESP_V),
and Zürich (SWI_Z). Approval was obtained by the
Institutional Review Board of SUNY Upstate Medical
University and from ethical review boards within each
country. Informed consent was obtained for t he use of
the samples for analyses related to the genetic investiga-
tion of ADHD. Recruited families had at least one child
with diagnosed or suspected combined type Attention
Deficit-Hyperactivity Disorder (ADHD-CT) as defined
in the DSM-IV manual [3]. This restriction on the com-
bined subtype was chosen due to the genetic focus of
the IMAGE project [19]. Further entry criteria for
assessment were: white Caucasian ethnicity of all partici-
pants, availability of one or more sibling, children
between the a ges of 5 and 17 years, participation of a
minimum of four family members includi ng one parent,
and consent of all persons to give blood samples or buc-
cal swabs for DNA extraction.
Families were excluded from genetic analyses, if either
the proband or the participating sibling had an IQ<70, a
diagnosis of schizophrenia or autism, a neurological dis-
order of the central nervous system or a genetic disor-
der that might mimic ADHD based on bo th history and
clinical assessment. Children with classical or atypical
autism were excluded from the IMAGE project because
some genetic regions are known to be associated both
withautismandADHD[19].Therewasnorulefor
assigning proband status to a certain child of a family
when several children fulfilled criteria for ADHD-CT. In
gene ral, the researchers defined the child with the high-
est probability to fulfil the criteria to be the proband,
and only swapped the roles if the designated proband
did not meet the criteria and, at the same time, a desig-
nated sibling met the criteria.
In the study design of the IMAGE project, the genetic
analyses were based on the comparison between ADHD
probands and their ‘unselected’ siblings. In fact, the sib-
ling group in the genetic analyses should contain chil-
dren with ADHD symptoms of the whole continuum,
except those with an ADHD-Diagnosis [19]. The full
diagnostic procedure, particularly the interview, was,
therefore, applied to the siblings only in case of sus-
pected ADHD, i.e., (a) if they had a clinical diagnosis of
ADHD, (b) if the recruiting clinician suspected ADHD,
(c) if the sibling achieved a T-sc ore of >63 in eithe r the
parents’ or the teachers’ N-subscale (’DSM-IV: total’)of
the Conners’ questionnaire, or (d) if the sibling was tak-
ing stimulant medication. In contrast to the pr oband
group, only the ADHD part of the interview was used
for siblings.
In the present publication and in its companion paper
[47] all 1446 siblings remained in the sample, regardless
of their ADHD diagnosis. However, due to the described
conditions of diagno sis in siblings, all analyses based on
diagnostic data were restricted to the probands and the
339 siblings, who underwent the diagnostic procedure.
Measures
Diagnostic Interview
To assess children’s symptoms more objectively than by
questionnaires, Taylor and associates developed a stan-
dardized, semi-structured interview, the Parental
Account of Childhood Symptom (PACS), which was
used in a slightly adapted version in this study [48-50].
At least one interviewer per participating centre
underwent comprehensive training by a team under the
supervision of Eric Taylor at the London Institute o f
Psychiatry (IoP), including cr oss validation of videotapes
and interviews with parents of ADHD children referred
to the IoP. If additional interviewers were used, each
centre was responsible for their training and supervision.
The interviewers were child psychiatrists or clinical child
psychologists. T he average inter-rater agreement across
all centres was 96.6%, and the mean kappa coefficient
was 0.88 (range 0.71-1.00) [29].
In the PACS interview parents are asked to rate the
behaviour of their child not in terms of deviance from
normality, but rather by describing the behaviour
accordin g to its frequency (’How often does the child
usually leave the seat during mealtimes?’ ) or severity
Müller et al. BMC Psychiatry 2011, 11:54
/>Page 3 of 20
(’What does the child do when in a temper?’). The inter-
viewer then matches the parent’s statement to a scale
with specific categories for each question. The frequency
categories of e.g., ‘ restlessness at mealtimes’ are : (0) no
restlessness, (1) leaving seat once only, (3) leaving seat 2
to 5 times (4) leaving seat > 5 times. The severity cate-
gories of e.g., ‘severity of loss of temper’ , are the follow-
ing: (0) no loss of temper, (1) mild: shouts, waves arms,
stamps feet, (2) marked: throws things, kicks objects, (3)
severe:breaksthings,kicksorhitspeople.ThePACS
consists of four sections: (1) emotional patterns, (2)
activity level and inattentive behaviour, (3) disruptive
behaviour, and (4) comorbid and other problems.
The ADHD-section of the PACS, which was used to
confirm the ADHD combined type diagnosis, covers
ADHD related behaviour in different situations (watch-
ing TV, reading, playing alone, playing with friends,
mealtimes, shopping, family outings, home-task, home-
work). Depending on the situation, the parents have to
rate the frequency or severity of their child’s hyperactiv-
ity-related behaviour (leaving seat, fidgeting, talking,
making noise etc.), inattention-related behaviour (atten-
tion to details, making mistakes, listening to instruc-
tions, following instructions, being distracted,
organising, etc.), and impulsive behaviour (impatience
while waiting, interrupting, etc.). A specific algorithm
combines and weighs t he rated behaviour across situa-
tions finally leading to a dichotomous statement about
thepresenceorabsenceofthecorrespondingDSM-IV
symptom. To check for other diagnostic criteria, such
as, questions about age of symptom detection, parental
perception of syndrome severity, clinically significant
impairment, and problems at school are asked after-
wards with respect to both the inattentive section and
the hyperactivity/impulsivity section. Each major section
ends with questions about the parental coping with the
children’s problems.
Whenever possible, the ADHD section of the PACS
focused on behaviour when the child was not medicated.
To control the influence of medication on the ADHD
section of the PACS, the medication status associated
with th e rated behaviour was recorded in a variable with
five levels: (1) current beh aviour, not under medicati on,
(2) b ehaviour during a one-week-period off medication,
(3) behaviour during intermittent days off medication,
(4) retrospective assessment of behaviour due to con-
stant use of medication, and (5) behaviour while medi-
cated. For further analyses a secondary dichotomous
variable (MED2), with the levels ‘me dicated behaviour’
and ‘unmedicated behaviour ’,wasgeneratedbycollap-
sing the variable levels (1) to (4) of the primary medica-
tion status variable into one category.
The sections dealing with emotional problems (depres-
sion, anxiety) and disruptive behaviour (oppositional
defiant disorder and conduct disorder) in the PACS are
structured similarly to the ADHD-section except that
symptoms are not evaluated across multiple situations.
The fourth section assesses co-morbid disorders (Tour-
ette’s Syndrome, bipolar affective disorder, substance mis-
use disorders, obsessive compu lsive disorder, attachment
disorders, schizophrenia, and ‘other psychiatric disorders)
at a syndrome level except autism spectrum disorders,
which are assessed at a symptom level. Finally, the positive
and neg ative expressed emotions of the interviewed par-
ents are rated by the interviewer.
Questionnaires
The Conners’ ratings scales for parents and teachers
(CPRS-R:L, CTRS-R:L) [51], the Strength and Difficulties
Questionnaires (SDQ, parent and teacher version) [52],
and the Social Communication Questionnaire (SCQ,
parent version) [53] were assessed in all participating
children. Each of the two Conners’ questionnaires
(CPRS-R:L and CTRS-R:L) contains a subset of 18 ques-
tions covering the DSM-IV ADHD symptoms. This sub-
set was used as a symptom checklist in the diagnostic
procedure (see section on abbreviations for a detailed
description of the symptoms and the section on the
diagnostic procedure for the detailed diagnostic algo-
rithm). The N-subscales (’DSM-IV: total’ )ofboththe
CPRS-R:L and CTRS-R:L were used as a screening
instrument for applying the ADHD diagnostic procedure
in the siblings. Similarly, the SCQ was used as a screen-
ing instrument for applying the a utism section of the
PACS in probands and siblings.
The dimensional measures of all Conners’ scales, the
scales of the SDQ and the SCQ, and the IQ measures
are described and analysed in the companion paper [47].
Intelligence assessment
Intelligence (IQ) measures were either a ssessed sepa-
rately, or in combination wit h further neuropsychologi-
cal testing, depending on the participation of each study
centre in the neuropsychological part of the study [41].
Former IQ test results were used instead, if the tests
were not older than one year. Children had to be off sti-
mulant medication for 48 hours before IQ testing.
Diagnostic procedure and criteria
All parent and teacher questionnaires were used in the
complete sa mple. The probands’ behaviour at home was
additionally assessed by the full PACS interview with
their parents , except for the autism section of the inter-
view that was administered to probands and siblings
onl y if their SCQ score was 14 or higher. In contrast to
the prob ands, only the ADHD section of the P ACS was
applied in those siblings who were suspected to have
ADHD according to the criteria described above.
The DSM-IV diagnosis of ADHD was based on the
CTRS-R:L and the PACS interview. A DSM-IV symp-
tomlistwasgeneratedbycombiningtheDSM-IV
Müller et al. BMC Psychiatry 2011, 11:54
/>Page 4 of 20
symptoms from the PACS with the 18 DSM-IV items of
the CTRS-R:L. A symptom was rated as present if either
the diagnostic criterion of the specific PACS algorithm
combining and weighing the responses to the symptom-
related questions was met, or if the corresponding
DSM-IV item of the CTRS-R:L was coded 2 or 3. To
diagnose ADHD-CT among probands, DSM-IV criteria
for both the inattention subtype and the hyperactivity/
impulsivity subtype had to be met, i.e., 6 out of 9 inat-
tention s ymptoms (abbreviated IA1 to IA9), 6 out of 6
hyperactivity symptoms (abbreviated HYP1 to HYP6)
and 3 impulsivity symptoms (abbreviated IM P7 to
IMP9) (see the abbreviati ons section for a detailed
descriptio n of the symptoms and the abbreviations used
hereafter). Additional diagnostic DSM-IV criteria includ-
ing age of symptom on set below the age of 7 years, or
absence of other psychiatric or neurologic disorders
which may cause ADHD symptoms, w ere derived from
the PACS interview. Pervasiveness was fulfilled if at
least 2 symptoms of both the PACS and the CTRS-R:L
were present, or if symptoms were rated as present in 2
or more different situations of the PACS interview. Clin-
ical impairment was inferred by the fact that at least 12
symptoms exceeded the diagnostic threshold, and addi-
tionally was verified in the PACS interview.
The diagnoses of classical or atypical autism leading to
the exclusion of a child from the study were defined by
a specific algorithm based on the interview data of the
PACS autism section.
Statistical procedures
Most of the continuous variables examined were
skewed and the various subsamples had unequal var-
iances and unequal sample sizes. In particular, the
questionnaire data were not only heavily skewed, but
also skewed in opposite directions in probands and
siblings. The assumptions of n ormality and homosce-
dasticity, which should be met for parametric statistical
analysis, were violated for almost all continuous vari-
ables. Simulations have shown that even small devia-
tions from normality can cause strong differences
between the actual and the nominal Type I error and
can result in low power, even with large sample sizes
[54-58]. Therefore, the present investigation applied
statistics that are robust to deviations from normality,
symmetry, and heteroscedasticity.
- The percentile bootstrap procedure trimpb [58,59],
with 2000 boo tstrap samples, was applied to c om-
pute robust confidence intervals (CI’s) for means
and trimmed means in R [60].
- Chi-square-tests [61] were used for the analysis of
two-dimensional contingency tables.
- Hierarchical log-linear analyses with backward
elimination [61] were used for multidimensio nal
contingency tables. As lower order effects in hier-
archical models always are conf ounded with higher
order interactions, only effects of the highest order
will be reported.
- Robust two-way and three-way analyses were cal-
culated in R by applying the procedures t2way and
t3way [57,59] methods for trimmed means with esti-
mates of standard errors and degrees of freedom
adjusted for trimming, unequal variances and
unequal sample sizes. This method provides a test
value (’Q’) which can be used to test null-hypotheses
of main effects and interactions, and adjusted critic al
values (’crit.’) for the 1-alpha quantile of a chi-square
distribution. When these analyses are based on resi-
duals of the dependent variable on age, the t est
value is named ‘QRES’.
- R obust post-hoc pairwise comparisons were com-
puted in R by using the bootstrap procedure lin-
conb6 [62], an expansion of the procedure lincon
[57], which allows unequal variances; 5 99 bootstrap
samples were taken by default; CI’s w ith family-wise
95% coverage probability level were calculated to
control the false positive error rates associated with
performing multiple statistical tests.
- Binary logistic regression analyses [61] were com-
puted when information was measured in terms of
frequencies. This procedure was applied to identify
the contribution of independent variables to group
differences.
- Residuals of a linear regression of target variables
on age were calculated [61] for use in further statis-
tical procedures in order to adjust the results for age
effects.
Results
Sample characteristics
Sample size
After applying all inclusion and exclusion criteria, the
sample consisted of 1068 probands and 1446 siblings,
significantl y differing in size from each other c
2
=57.1, df
= 1, p < .001 (Table 1). Boys and girls were equally dis-
tributed among the siblings (730 boys, 716 girls), but
not among the probands (938 boys, 130 girls), resulting
in a significant gender effect on sample size, c
2
=268.8,
df = 1, p < .001, and a significant gender by proband
status interaction effect on sample size, c
2
=387.7, df =
1, p < .001. The sample sizes of the 11 centres ranged
from 81 to 431 and significantly differed across centres,
c
2
=758.2, df = 10, p < .001. No higher order interaction
effect on sample size including the centre variable was
Müller et al. BMC Psychiatry 2011, 11:54
/>Page 5 of 20
Table 1 Sample size * and Age°, divided by family status, gender, and centre
Probands Siblings All
Male Female All Sig
§
Male Female All Sig
§
Male Female All Sig
§
BEL_G N 27 5 32 36 13 49 63 18 81
Age(m) 10.7 12.2 10.9 11 9.1 10.5 10.9 9.9 10.7
Age(SD) 2.8 1.6 2.7 3.3 3.1 3.3 3.1 3.1 3.1
ENG_L/S N 164 15 179 122 130 252 286 145 431
Age(m) 11.6 12.7 11.6
1+
10.7 11 10.9 11.2 11.2 11
1+
Age(SD) 2.8 2.4 2.7 3.3 3.3 3.3 3 3.2 3.1
ESP_V N 69 5 74 40 35 75 109 40 149
Age(m) 9.4 8.6 9.4
1-, 2-
11.1 11.9 11.5 10 11.5 10.4
Age(SD) 2.4 3.3 2.4 2.8 3 2.9 2.6 3.2 2.9
GER_E N 32 4 36 23 26 49 55 30 85
Age(m) 10.8 10.5 10.7 10.1 11.8 11 10.5 11.6 10.9
Age(SD) 2.9 2.6 2.8 3.8 4.2 4 3.2 4 3.5
GER_G N 76 6 82 54 56 110 130 62 192
Age(m) 10.4 9.7 10.3
1-
10.2 10.3 10.2 10.3 10.2 10.3
Age(SD) 2.3 2.3 2.3 3.2 3.7 3.5 2.7 3.6 3
IRL_D N 85 15 100 70 73 143 155 88 243
Age(m) 11.4 10.5 11.2
2+
10.1 11 10.6 10.8 10.9 10.8
Age(SD) 3.2 2.9 3.2 3.1 3.1 3.1 3.2 3.1 3.2
ISR_J N 52 8 60 27 40 67 79 48 127
Age(m) 10 8.3 9.8
1-, 3-
10.9 10.3 10.5 10.3 9.9 10.2
Age(SD) 2.7 1.2 2.6 3.4 3.3 3.3 2.9 3.2 3
ISR_P N 120 13 133 109 87 196 229 100 329
Age(m) 10.4 11 10.4
1-
11.6 11.4 11.5 11 11.4 11.1
1+
Age(SD) 2.8 3.7 2.9 3.4 3.3 3.4 3.1 3.4 3.2
NLD_A N 135 20 155 106 109 215 241 129 370
Age(m) 11.2 10.7 11.1
2+, 3+
10.4 11.1 10.8 10.8 11 10.9
Age(SD) 2.7 2 2.6 3.4 3.9 3.6 3 3.6 3.2
NLD_G N 135 30 165 116 114 230 251 144 395
Age(m) 11.1 10.4 11
2+,3+
10.9 10.5 10.7 11 10.5 10.8
1+
Age(SD) 2.7 3.5 2.8 3.2 3.5 3.3 2.9 3.5 3.1
SWI_Z N 43 9 52 27 33 60 70 42 112
Age(m) 9.8 9.8 9.8
1-
10 9.3 9.6 9.9 9.4 9.7
1-
Age(SD) 1.7 2.3 1.8 3.9 2.7 3.2 2.7 2.6 2.6
All N 938 130 1068 730 716 1446 1668 846 2514
Age(m) 10.8 10.6 10.8 10.7 10.8 10.8 10.8 10.8 10.8
Age(SD) 2.7 2.9 2.8 3.3 3.5 3.4 3 3.4 3.1
*Significant main effects of status, gender, and centre, and interaction effect of status × gender (see text).
°Significant main effect of centre, and interaction effect of status × centre (see text).
§Significant age differences within each column between pairs with equal number and different sign (e.g. 3+ and 3-).
Müller et al. BMC Psychiatry 2011, 11:54
/>Page 6 of 20
significant, indicating equal gender ratios and equal pro-
band/sibling ratios across centres.
Age
he mean age of the total sample was 1 0.8 years ( SD =
3.1years). A three way analysis of variance including
gender, family status, and centre revealed no main
effects of gender and status on age, but a significant
main effect by centre, Q = 44.9, crit.=20.8, p < .001.
Post hoc pairwise comparisons betw een centres with a
5% family-wise error rate revealed that the children of
SWI_Z were significantly younger than those of three
other centres, namely NLD_G (CI = 0.01-2.22 years),
ISR_P ( CI = 0.16-2.48 years), and ENG_L/S (CI = 0.50-
2.67 years). There was a s ignificant centre by status
interaction effect on age, Q = 34.8, crit.=20.7, p < .001.
On the one hand, non e of the 55 post hoc pairwise
comparisons in the sibling sample were significant
(probability level adjusted for multiple t ests). On the
other hand, t en pairwise comparisons between centres
within the proband s ample differed significantly as indi-
cated by non-overlapping 95% family-wise CI’s between
centres (Figure S1 in Additional file 1). No other inter-
action effects including centre, gender, or status on age
were significant. T his indicates that age difference s
between boys and girls (whether significant or not) were
not dependent on status or centre.
ADHD subtypes, symptom quantity, and age at symptom
detection
Symptom load in probands
The mean number of inattentive symptoms (20%
trimmed mean), based on the PACS interview and the
Conners’ teacher qu estionnaire, was 8.5 in boys and 8.3
in girls, and the mean number of hyperactive/impulsive
symptoms was 8.5 in boys and 8.4 in g irls (see Table 2).
Robust two-way analyses of centre and gender effects on
the (20% trimmed) mean number of ADHD symptoms
were conducted. There were significant gender effects
on the number of inat tentive (Q = 4.85, p = .03), but
not of hyperactive/impulsive symptoms. In addition,
there were highly significant centre effects on inattentive
symptoms (Q = 88.37, p < .001), hyperactive/impulsive
symptoms (Q = 93.53, p < .001), and a significant gen-
der by centre effect for the number of inattention symp-
toms (Q = 103.8, p < .001) but not for the number of
hyperactive/impulsive symptoms.
Because a ge correlated negatively with the number of
hyperactive symptoms (Spearman’ s rho = 124, p <
.001), a similar analysis was calculated based on age-
adjusted number of hyperactive/impulsive symptoms
(residuals). Similar to the analysis of unadjusted number
of symptoms, this analysis revealed significant centre
effects only on number of hyperactive symptoms (Q
RES
= 65.29, p < .001).
Post hoc analyses of the number of symptoms
between centres showed that the mean number of
symptoms was lowest in the SWI_Z subsample both for
inattention (7.9) and hyperactivity-/impulsivity (7.5), and
highest in the GER_G subsample both for inattention
(8.9) and hyperactivity (8.9). Pairwise comparisons of
number of symptoms between centre sub-samples
revealed six centre pairs differing significantly from each
other in the inattention domain and five in the hyperac-
tive/impulsive domain (probability level adjusted for
multiple tests). The graphs in Figure S2 in the Addi-
tional file 2 show the mean symptom numbers at ea ch
centre, all significant pairwise differences (probability
level adjusted for multiple tests), and the gender by cen-
tre interactions. Post hoc analyses of age-adjusted centre
effects on the number of hyperactive symptoms revealed
minor changes in rank order of centres with medium
symptom numbers (ESP_V, ISR_J, NLD_A, GER_E). All
significant paired dif ferences between centres remained
signi ficant, and, additionally, the ce ntre GER_G had sig-
nificantly more symptoms than the centres ISR_J,
IRL_D, and BEL_G. This finding indicates that the
hyperactive/impulsive symptom numbers differed to a
greater extent between centres, when age effects were
removed from the analysis.
Age at symptom detection in probands
The mean age at inattention symp tom detection was 4.2
years in boys and 4.1 years in girls. Similarly, girls were
younger (2.0 years) at first detection of hyperactive/
impulsive symptoms than boys (2.4 years).
No significant gender effec ts were found in a two-way
analysis of centre and gender on the age at symptom
detection. The first inattentive symptom occurrence dif-
fered between centres (Q = 93.73, p < .001) as well as
the first hyperactive/impulsive symptom occurrence (Q
= 58.08, p < .001). A centre by gender interaction signif-
icantly influenced the age at first detection of inattentive
symptoms (Q = 32.1, p = .017), but not of hyperactive/
impulsive symptoms.
Because the age of the probands significantly corre-
lated with the age of first inattentive symptom occur-
rence (Spearman’ s rho = .132, p < .001), a similar
analysis was performed on age-adjusted detection of
inattentive symptoms (residuals). The results of this age
adjusted analysis were similar to the non-adjusted analy-
sis: the centre effect (Q
RES
= 82.66, p < .001) and t he
centre by gender interaction effect (Q
RES
= 28.73, p =
.028) was si gnificant, indicating that the parents’ esti-
mates of the first inattention symptoms differed between
centres, independent of the actual age of the probands,
and that gender effects varied across centres.
Post hoc analyses of centre differences regarding inat-
tention symptom detection (Figure S2 in Additional file
2) showed that the o ccurrence of inattention symptoms
Müller et al. BMC Psychiatry 2011, 11:54
/>Page 7 of 20
Table 2 ADHD subtypes, symptom frequencies and age of symptom onset
Number of symptoms* Age at first symptom detection°
Boys
Inattention Hyperactivity/Impulsivity Inattention Hyperactivity/Impulsivity
Status ADHD subtype N Mean
t
CI
low
CI
up
Range Mean
t
CI
low
CI
up
Range Mean
t
CI
low
CI
up
Range Mean
t
CI
low
CI
up
Range
Siblings No Diagnosis 39 6.28 5.24 7.24 0 - 9 4.60 3.32 5.92 1 - 9 6.20 5.00 7.75 1 - 15 3.50 2.13 5.19 1 - 13
Hyperactive/Impuslive 15 4.33 3.56 5.00 1 - 5 7.89 6.89 8.56 6 - 9 4.75 3.63 5.75 1 - 9 2.89 2.11 3.78 1 - 6
Inattentive 43 7.59 7.11 8.07 6 - 9 3.96 3.41 4.41 1 - 5 4.38 3.85 4.96 1 - 6 3.67 2.90 4.43 0 - 10
Combined 118 8.47 8.21 8.69 6 - 9 8.40 8.17 8.56 6 - 9 4.06 3.63 4.44 1 - 10 2.94 2.49 3.39 1 - 7
All subtypes 215 7.88 7.60 8.13 0 - 9 7.22 6.74 7.60 1 - 9 4.42 4.14 4.70 1 - 15 3.11 2.74 3.46 0 - 13
Probands Combined 938 8.50 8.42 8.58 6 - 9 8.47 8.39 8.55 6 - 9 4.23 4.10 4.35 0 - 12 2.41 2.27 2.55 0 - 11
Girls
Inattention Hyperactivity/Impulsivity Inattention Hyperactivity/Impulsivity
Status ADHD subtype N Mean
t
CI
low
CI
up
Range Mean
t
CI
low
CI
up
Range Mean
t
CI
low
CI
up
Range Mean
t
CI
low
CI
up
Range
Siblings No Diagnosis 40 4.21 3.33 5.17 0 - 9 3.04 2.21 3.83 0 - 9 6.32 5.32 7.63 1 - 16 4.71 2.86 7.29 1 - 15
Hyperactive/Impuslive 11 4.00 2.57 4.71 1 - 5 6.86 6.29 7.57 6 - 9 3.60 2.40 6.80 1 - 11 3.57 2.14 5.00 1 - 6
Inattentive 33 7.38 6.95 7.86 6 - 9 3.24 2.43 3.90 1 - 5 5.26 4.74 5.74 1 - 6 3.40 2.20 4.60 1 - 6
Combined 40 8.33 7.92 8.71 6 - 9 8.38 7.96 8.71 6 - 9 4.13 3.29 4.83 0 - 8 2.42 1.75 3.29 0 - 6
All subtypes 124 6.76 6.22 7.30 0 - 9 5.20 4.50 5.88 0 - 9 4.91 4.49 5.31 0 - 16 3.16 2.53 3.81 0 - 15
Probands Combined 130 8.27 8.04 8.49 6 - 9 8.38 8.13 8.62 6 - 9 4.10 3.75 4.43 0 - 12 1.97 1.64 2.35 0 - 11
All
Inattention Hyperactivity/Impulsivity Inattention Hyperactivity/Impulsivity
Status ADHD subtype N Mean
t
CI
low
CI
up
Range Mean
t
CI
low
CI
up
Range Mean
t
CI
low
CI
up
Range Mean
t
CI
low
CI
up
Range
Siblings No Diagnosis 79 5.27 4.49 5.98 0 - 9 3.63 2.96 4.35 0 - 9 6.19 5.35 7.24 1 - 16 3.93 2.87 5.43 1 - 15
Hyperactive/Impuslive 26 4.19 3.50 4.69 1 - 5 7.38 6.81 8.06 6 - 9 4.31 3.38 5.46 1 - 11 3.13 2.38 3.94 1 - 6
Inattentive 76 7.50 7.13 7.89 6 - 9 3.67 3.17 4.11 1 - 5 4.80 4.36 5.20 1 - 6 3.56 2.85 4.24 0 - 10
Combined 158 8.44 8.23 8.66 6 - 9 8.40 8.19 8.55 6 - 9 4.07 3.73 4.44 0 - 10 2.81 2.41 3.22 0 - 7
All subtypes 339 7.56 7.27 7.79 0 - 9 6.53 6.10 6.92 0 - 9 4.59 4.36 4.82 0 - 16 3.09 2.78 3.41 0 - 15
Probands Combined 1068 8.48 8.39 8.55 6 - 9 8.46 8.38 8.54 6 - 9 4.22 4.10 4.33 0 - 12 2.36 2.23 2.48 0 - 11
* Frequencies are based on the combination of the parental Interview (PACS) and the teacher questionnaire (CTRS).
° As reported by the PACS.
Mean
t
20% trimmed mean.
CI
low
95% confidence interval for trimmed mean (lower end).
CI
up
95% confidence interval for trimmed mean (upper end).
Müller et al. BMC Psychiatry 2011, 11:54
/>Page 8 of 20
was perceived earliest by parents of the NLD_A sample
(3.4 years) and latest by those of the ISR_P sample (5.3
years). Hyperactive/inattentive symptoms were perceived
earliest by the parents of the NLD_G sample (1.6 years),
and latest by those of the ISR_P sample (4.0). Out of 55
post hoc analyses of inattention symptom detection,
there were twelve significant differences between centres
(probability level adjusted for multiple tests). In the
hyperactivity/impulsivity domain there were nine centre
pairs differing significantly from each other. Figure S2 in
Additional file 2 shows the mean symptom detection
ages for all centres and all significant pair differences. In
addition, the significant gender by ce ntre interaction for
inattention symptom detection is illustrated graphically.
Age-adjusted post hoc analyses of centre effects on
age of inattention detection revealed small changes com-
pared t o the analyses based on raw score s: two pairs of
adjacent centres according to rank (BEL_G and ENG_L/
S, and ESP_V and IRL_D) changed their rank position,
and the centre IRL_D no lon ger differed significantly
from centres ISR_J and NLD_G (see Figure S2 in Addi-
tional file 2).
ADHD subtypes in siblings
Interview data were available for 215 ma le and 124
female siblings. T he diagnostic procedure resulted in
158 (47%) of th ese 339 siblin gs having combined type
(ADHD-CT), 76 (22%) having inattentive t ype (ADHD-
IT), 26 (8%) having hyperactive/impulsive type (ADHD-
HT), and 79 (23%) having no ADHD diagnosis (ADHD-
ND). The latter subtype resulted from number of symp-
toms below the diagnostic threshold (see Table 2). The
percentage of boys was 75% among the 158 siblings
with ADHD-CT, 58% among 26 siblings with ADHD-
HT, 57% among 76 siblings with ADHD-IT, and 49%
among the 79 siblings without diagnosis.
There were notable differences in subtype frequencies
across centres. For instance, there was one subsample
(ESP_V) consisting of siblings with ADHD-CT only, two
sub-samples (BEL_G and ISR_J) containing no siblings
with ADHD-HT, and one sample (GER_G) having no
siblings with ADHD-IT (Table S1 and Figure S3 in
Additional files 3 and 4).
A hierarchical loglinear analysis of gender and centre
effects on the subtype frequencies in the sibling sample
resulted in a model that retained main effects and two-
way interactions, but no three-way interactions. The
likelihood ratio of a goodness-of-fit test, c
2
=27.32, df =
30, p = .607, indicated no significant difference between
the predictions of the model and the data. Both two-
way effects including the variable subtype, i.e. gender by
subtype, c
2
=89.25, df = 3, p < .001, and centre by sub-
type, c
2
=88.38, df = 30, p < .001, were significant. Thus,
the subtype frequencies differed between genders and
across centres (see Figure S3 in Additional file 4), but
the gender effects on subtype frequencies did not differ
across centres.
Symptom load in diagnosed siblings (N = 339)
The mean number of inattentive symptoms (20%
trimmed mean), based on the PACS interview and the
Conners’ teacher questionnaire, was highest in the CT
subsample (8.4), followed by IT (7.5), ND (5.3), and HT
(4.2) subsamples. Symptoms of hyperactivity/impu lsivity
were most freq uent in CT (8.4), followed by HT (7.4),
IT (3.7), and ND (3.6). T able 2 shows means and 95%
confidence intervals for the population trimmed means,
divided by family status and gender, and across diagnos-
tic subtypes.
A two-way A NOVA revealed sig nificant gender effects
and subtype effects on symptom numbers for both inat-
tentive and hyperactive/impulsive symptoms, but no
gender by subtype interaction effects. Inattentive symp-
toms were more frequent in male siblings compared to
female siblings (Q = 6.77, p = .012) and differed
between subtypes (Q = 206.6, p < .001). Similarly, male
siblings had more hyperactive /impulsive symptoms than
female siblings (Q = 7.61, p = .008), and the symptom
numbers differed between subtypes (Q = 353.6, p <
.001; see Table 2). Because the siblings’ age correlated
negatively with the number of hyperactive symptoms
(Spearman’s rho = 275, p < .001), the effects of gender
and subtype on age adjusted hyperactive symptom num-
bers (residuals) were additionally calculated. Similar to
the non-adjusted analyses, this analysis revealed signifi-
cant gender effects (Q
RES
= 11.20, p = .002) and subtype
effects (Q
RES
= 438.9, p < .001) on the number of symp-
toms present, with an additional gender by subtype
interaction effect (Q
RES
= 8.89, p = .045).
Age at symptom detection in siblings
The parents mean retrospective estimat e of the siblings’
age ( 20% trimmed mean) when symptom s were present
for the first t ime was lowest in siblings with ADHD-CT
(inattention: 4.1 years, hyperactivity/impulsivity: 2.8
years) and highest in children without an ADHD diag-
nosis (inattention: 6.2 years, hyperactivity/impulsivity:
3.9 years; Table 2).
In two-way analyses, the first occurrence of ADHD-
DSM-IV symptoms in these 339 siblings did not differ
between boys and girls, neither for inattentive nor for
hyperactive/impulsive symptoms. A subtype effect on
the age of symptom detection was present with regard
to inattentive symptoms (Q = 18.9, p = .002) but not
with regard to hyperactive symptoms; gender by subtype
interaction effects on age at detection were not signifi-
cant in both symptom groups of the sibling sample.
Because the r eported age of inattention symptom detec-
tion correlated with the age of the siblings (Spearman’s
rho = .211, p < .001), the same analysis was calculated
based on age adjusted first occurrence of inattentive
Müller et al. BMC Psychiatry 2011, 11:54
/>Page 9 of 20
symptoms. Similar to the original analysis, only the main
effect of subtype was significant (Q
RES
= 13.8, p = .009).
Medication status in the PACS interview
For 1400 children , information about stimulant medica-
tion during the period rated by their parents was avail-
able: 434 (31.0%; boys: girls ratio = 2.4:1) were
permanently off medication, 186 (13.3%; 6.8:1) were off
medication for one week, 446 (31.8%; 7.0:1) were off
medication on intermittent days, 202 (14.4%; 6.8:1) were
rated retrospectively due to constant use of medication,
and 132 (9.4%; 7.8:1) were rated during a period of per-
manent medication. I n summary, the interview data of
1268 (90.6%; 4.4:1) children was based on unmedicated
periods, while it was based on medicated periods for
132 (9.4%; 7.8:1) children.
The percentage of children rated under medication
differed between ADHD subtypes. It was highest (10%)
for ADHD-CT, followed by ADHD-ND (8.2%), ADHD-
IT (3.9%), and ADHD-HT (0%). A total of 10.2% of the
1151 boys, but only 6% of the 249 girls were rated
under medication. The percentage of children rated
under medication also differed between c entres. There
were four centres with low percentages, namely ESP_V
(0%), ISR_J (1.5%), ISR-P (2.1%), NLD_A (1.7); three
centres with medium percentages, namely BEL_G
(4.1%), GER_G (5.0%), IRL_D (3.0%); two centres with
high percentages, namely GER_E (7.3%) and SWI_Z
(7.6%), and two centres with percentages clearly above
average, namely ENG_L/S (12.7%) and NLD_G (35%).
A statistical analysis using a hierarchical loglinear
model including the dich otomized medications status
(MED2; see methods section), the diagnostic subtype,
family status, and gender resulted in a final model that
retained only main effects and two-way interactions, but
no three- and four-way interactions. The likelihood ratio
for this model (c
2
=8.374, df = 15, p = .908) did not indi-
cate a significant dif ference between the model and the
data. The gender by status interaction effect on MED2,
(c
2
=6.72, df = 1, p = .010) was the only significant effect
when including the variable MED2 after the backward
elimination procedure stopped. To break down this
effect, chi-square tests on status and MED2 variables
were performed separately for boys and girls. For boys,
there was no significant association between family sta-
tus and medication status, c
2
= .027, df = 1, p = .87,
whereas for girl s this association was significant, c
2
=7.6,
df = 1, p = .006. In terms of odds ratios, male probands
were 1.04 times more likely to be medicated than male
siblings, whereas female probands were 6.5 times more
likely to be medicated than female siblings.
When centre was entered into the model (likelihood
ratio: c
2
=92.61, df = 275, p = 1.000), only main effects
and two-way interactions remained significant. The only
significant two-way effect on MED2 after backwa rd
eli mination was again for gende r by statu s (c
p
2
=5.86, df
= 1, p = .015) indicating that medication did not vary
across centres. Thus, the significant centre by medica-
tion effect can be ignored because it was con founded
with the significant higher order effect of gender by sta-
tus by MED2 due to th e hierarchical character of the
model.
Diagnostic symptoms in the probands’ sample
Effects of informant and diagnostic instruments on
diagnostic symptom frequencies
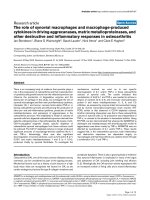
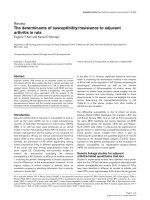
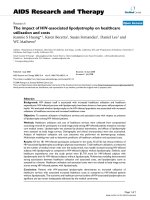
Frequencies of diagnostic symptoms in the proband
sample, divided by gender and source of information are
displayed in Figure 1. Beside the two sources used for
the diagnostic procedure, namely, the parental interview
(PACS) and the teacher questionnaire (CTRS), there
were also symptom ratings available from the parents’
questionnaire (CPRS).
The parent interview ratings (PACS) and the teacher
questionnaire ratings (CTRS) contributed to the ADHD
diagnosis. In boys and girls, all symptom frequencies
were higher in the PACS compared to the CTRS, except
for symptom IA2 (29% lower in boys and 28% lower in
girls;seeFigure1).ThePACSratingsforinattentive
symptoms in boys were on average 11% higher than the
CTRS ratings (15% higher, when IA2 was excluded).
Ratings for inattentive symptoms in girls were on aver-
age 20% higher in the PACS compared to the CTRS
(23% higher, when IA2 was excluded). Hyperactive/
impulsive symptoms in boys were rated 22% higher in
the PACS compared to the CTRS; in girls these ratings
were rated 33% higher on average. All 18 symptoms
had, on average, 17% higher frequencies in the PACS
than in the CTRS in boys and 27% higher frequencies in
girls. These numbers were 20% and 30%, respectively,
when IA2 was excluded.
To calculate the ‘ pure’ informant effect, teacher
(CTRS) and parent ( CPRS) questionnaires were com-
pared . All symptoms were more frequent when rated by
parents than by teachers, both in boys and girls. The
mean difference across inattentive symptoms was 14%
in boys and 20% in girls; across hyperactive/impulsive
symptoms the differences were 14% in boys and 22% in
girls.
A comparison of the two parental sources, i.e. PACS
and CPRS, reflecting the effect of the diagnostic instru-
men t reveale d smaller effects across all symptoms com-
pared to the differences which included different
informan ts. The symptoms were equal or more frequent
when recorded in the interview in 12/18 symptoms in
boys (differences from 0% to 32%) and in 13/18 symp-
toms in girls (0% to 41%). The remaining symptoms
with higher frequencies in the CPRS compared to the
Müller et al. BMC Psychiatry 2011, 11:54
/>Page 10 of 20
PACS were IA2 (38% in Boys, 37% in girl s), IA3 (5%,
1%), IA4 (13%, 11%), IA9 (4% only in boys), HYP5 (9%,
9%) , and IMP6 (9%, 4%), Mean differences across all 18
symptoms were 3% in boys and 6% in girls, both indi-
cating higher frequencies in the interview compared to
the questionnaire. When the outlier symptom IA2 was
excluded from the calculation, these differences w ere
larger in boys (5%) and in girls (8%).
When all t hree sources were entered in a non-para-
metric analysis of variance, there was a significant effect
of the source on symptom fre quency in each of the
symptoms in the whole sample ( Friedman c
2
between
37.5 and 688.4, df = 2, all p < .001), when calculated
separately in girls (c
2
between 11.5 and 106.5, df = 2, all
p < .001), and in boys (c
2
between 27.6 and 582.6, df =
2, all p < .001). Pair-wise statistical parent vs. teacher
comparisons (Wilcoxon test), i.e. 18 comparisons PACS
vs. CTRS and 18 comparisons CPRS vs CTRS, revealed
highly significant results for all parents vs. teacher com-
parisons(allp<.001,exceptp=.002forIMP8 in the
CTRS vs. CPRS comparison). The pair-wise comparisons
of instruments reflecting the parents view (PACS vs.
CPRS) were not significant for three symptoms (IA7,
IA9,andHY P4 ), significant in t wo comparisons ( IA3,p
= .006; IA6, p = .043), and highly significant (p < .001)
in the remaining 13 comparisons.
To evaluate gender and centre effects on symptom
frequencies simultaneously, hierarchical log-linear ana-
lyses were performed for each symptom and separately
for all three sources, i.e., PACS, CPRS, and CTRS. These
analyses revealed no significant g ender effects for all
symptoms, but there were significant centre effects for
all symptoms except in three inattention symptoms
(IA5, IA8,andIA9), as assessed by the PACS interview.
Slightly different effects resu lted in symptoms that were
obtained from the parent questionnaire (CPRS). All cen-
tre effects were highly significant (p < .001), except for
IMP7 (p = .023), but no gender effects were significant
except for HYP3 (p = .047, more frequen t in boys) and
for HYP6 (p = .001, more frequent in girls).
In contrast to these two parent ratings, teacher
assessed symptom frequencies (CTRS) were higher in
100%
Hyperactivity
/
ImpulsivityInattention
80%
90%
60%
70%
40%
50%
10%
20%
30%
PACS CPRS CTRS
Boys
Girls
10%
e
ntion
d
etails
s
taining
ention
t
ening and
d
erstanding
l
owing
t
ructions
g
anizing tasks
uctancee
b
egin
o
sing
n
gs
t
racted
r
getful
g
eting
a
ving seat
n
ning about
d
climbing
f
iculties in
e
t activities
ng on the go
k
ing
rting out
f
iculties in
iting its turn
e
rrupting /
u
ding
IA1 IA2 IA3 IA4 IA5 IA6 IA7 IA8 IA9
HYP1 HYP2 HYP3 HYP4 HYP5 HYP6 IMP7 IMP8 IMP9
A
tt
e
to
d
Su
s
Att
Lis
t
un
d
Fol
l
Ins
t
Or
g
Rel
to
b
Lo
o
thi
n
Dis
t
Fo
r
Fid
g
Le
a
Ru
n
an
d
Dif
f
qui
e
Bei
Tal
k
Blu
Dif
f
Wa
Int
e
intr
u
Figure 1 Frequencies of ADHD symptoms in probands, assessed by parents (PACS, CPRS) and teachers (CTRS). Notes: All 1068 probands
had an ADHD-CT diagnosis. Abbreviations: PACS: Parental Account of Clinical Symptoms, CPRS: Conners’ Parent Rating Scales, CTRS: Conners’
Teacher Rating Scales.
Müller et al. BMC Psychiatry 2011, 11:54
/>Page 11 of 20
Table 3 Sorted ADHD symptom frequencies in probands, divided by centre
Probands
(N = 1068)
Controls
(N = 79)°
Logistic
regression §
SWI_Z BEL_G IRL_D NLD_G ISR_P GER_E NLD_A ESP_V ISR_J ENG_L/S GER_G All centres c
p
2
p All centres T
w
#
p
Inattention
IA8 Distracted 100.0 100.0 100.0 100.0 99.2 100.0 100.0 100.0 100.0 99.4 100.0 99.8 4.8 n.s. 87.3 0.000 .988
IA1 Attention to details 100.0 100.0 98.0 98.8 100.0 100.0 99.4 100.0 100.0 99.4 100.0 99.4 8.0 n.s. 69.6 3.809 .051
IA5 Organising tasks 92.3 100.0 93.0 97.0 97.7 100.0 97.4 100.0 98.3 96.6 98.8 97.1 17.0 n.s. 58.2 5.336 .021
IA6 Reluctance to begin 94.2 84.4 93.0 86.1 94.7 94.4 96.1 95.9 93.3 95.5 100.0 93.6 29.4 ** 60.8 0.219 .640
IA3 Listening 94.2 96.9 89.0 81.2 99.2 97.2 96.1 98.6 100.0 86.0 98.8 92.4 74.3 *** 49.4 6.718 .010
IA4 Following instructions 75.0 71.9 89.0 80.0 92.5 80.6 92.9 87.8 96.7 91.6 90.2 88.0 36.7 *** 51.9 0.151 .698
IA2 Sustaining attention 78.8 90.6 89.0 91.5 79.7 83.3 90.3 78.4 88.3 86.6 100.0 87.5 41.5 *** 44.3 0.746 .388
IA7 Losing things 71.2 71.9 82.0 77.6 78.2 88.9 85.8 90.5 81.7 88.8 89.0 83.1 24.5 ** 45.6 0.603 .437
IA9 Forgetful 80.8 84.4 80.0 79.4 77.4 86.1 84.5 82.4 80.0 83.8 86.6 81.9 6.2 n.s. 46.8 0.172 .678
Mean (inattention) 87.4 88.9 90.3 87.9 91.0 92.3 93.6 92.6 93.1 92.0 95.9 91.4 26.9 57.1 1.973
Hyperactivity Impuslivity
IMP9 Interrupting/intruding 96.2 100.0 100.0 100.0 98.5 100.0 100.0 100.0 98.3 99.4 98.8 99.3 13.3 n.s. 77.2 1.766 .184
HYP1 Fidgeting 98.1 88.5 96.0 98.8 96.2 100.0 99.4 98.6 98.3 98.9 100.0 98.4 12.0 n.s. 44.3 7.215 .007
HYP3 Running about/climbing 84.6 87.5 93.0 93.3 97.7 91.7 96.1 93.2 98.3 96.6 100.0 94.9 26.7 ** 34.2 10.569 .001
HYP5 Being ‘on the go’ 80.8 78.1 85.0 97.0 91.7 94.4 95.5 91.9 95.0 96.6 98.8 93.2 41.2 *** 32.9 7.956 .005
IMP8 Difficulties waiting turn 92.3 96.9 92.0 97.0 88.7 94.4 92.9 87.8 90.0 88.3 98.8 92.2 23.9 ** 40.5 3.856 .050
HYP6 Talking 82.7 93.8 95.0 95.2 86.5 91.7 88.4 97.3 86.7 93.3 97.6 91.9 26.8 ** 58.2 1.641 .200
HYP2 Leaving seat 80.8 78.1 90.0 89.1 84.2 83.3 89.7 86.5 98.3 90.5 98.8 89.0 31.4 ** 36.7 2.798 .094
IMP7 Blurting out 75.0 87.5 85.0 82.4 90.2 83.3 78.7 87.8 76.7 82.1 86.6 83.2 14.5 n.s. 45.6 0.920 .338
HYP4 Quiet activities 59.6 68.8 73.0 80.0 73.7 80.6 69.7 79.7 81.7 89.4 93.9 78.5 50.6 *** 27.8 1.129 .288
Mean (hyperactivity/impulsivity) 83.3 86.6 89.9 92.5 89.7 91.0 90.0 91.4 91.5 92.8 97.0 91.2 91.4 44.16 4.205
Overall Mean 85.4 87.7 90.1 90.2 90.4 91.7 91.8 92.0 92.3 92.4 96.5 91.3 36.9 50.63 3.09
Notes: For abbreviations of sites see methods section; sites in ascending order (overall mean); symptoms in descending order (All sites) within subtypes.
c
p
2
Partial chi-square of hierarchical logliniear analysis.
*** p < .001 ** p < .01 * p < .05 n.s. p ≥ .05.
° Diagnosed siblings without ADHD diangosis (ADHD-NT).
§
R
2
= .272 (Cox & Snell), .689 (Nagelkerke). Model X
2
(18) = 363.6, p < .001.
#
T
w
= Wald statistics (b/S.E.
b
)
2
.
Müller et al. BMC Psychiatry 2011, 11:54
/>Page 12 of 20
boys than in girls for 11 of the 18 symptoms, i.e. all but
IA2, IA4, IA5, IA9, HYP4, HYP6,andIMP7). All these
significant differences reflected higher frequencies in
boys. The centre effects, however, were all significant
and were similar to the effects found for the parent rat-
ings. (Detailed statistical resultsarenotreportedhere,
but available on req uest. For deta iled statistics reporting
differences in symptom frequencies between centres, see
the next 25 section on combined symptom frequencies,
which were relevant for the diagnostic procedure).
Symptom frequencies based on the combination of PACS
and CTRS
The following analyses are based on the combined
symptom presence (see methods section for the diagnos-
tic algorithm). Because the diagnosis was based on the
combination of the parental interview (PACS) and the
teacher Conners’ questionnaire (CTRS), i.e., a symptom
was counted as present when it was present either in
the PACS or the CTRS.
The frequencies of comb ined symptoms in t he pro-
band sample stratified by centres are presented in Table
3. The overall mean symptom frequency across all cen-
tres and all sympt oms was 91.3%. Symptom frequencies
across all centres ranged from 81.9% to 99.8% for inat-
tentive symptoms, and from 78.5% to 99.3% for hyperac-
tive/impulsive symptoms. The SWI_Z centre had the
lowest total frequency across all symptoms (85.4%),
across inattentive symptoms (87.4%) and across hyperac-
tive/inattentive symptoms (83.3%). In contrast, the
GER_G centre had the highest frequencies across all
symptoms (96.5%), across inattentive symptoms (95.9%)
and across hyperactive symptoms (97.0%). For five inat-
tention symptoms and six hyperactive/impulsive symp-
toms there w as a significant centre effect (not adjusted
for multiple tests).
In the c omparable control group (ADHD-ND sibling
group, N = 79), the overall mean symptom frequency was
50.6% across all symptoms, 57.1% across inattentive
symptoms, and 44.2% across hyperactive/impulsive
symptoms. The frequencies in the control sample did not
differ between centres due to small sample size (Table S1
in Additio nal file 3). In summary, the symptom frequen-
cies in the ADHD-ND group were smaller when com-
pared to the proband group. However, the mean
frequency difference between inattention and hyperactiv-
ity/impulsivity was clearly larger (12.9%) in the control
sample compared to the proband sample (0.2%).
A binary logistic regression analysis in which the pro-
band sample (N = 1068) was compared to the control
sample (ADHD-ND; N = 79) showed that hype ractive/
impulsive symptoms contributed more (mean Wald test,
T
w
=4.25) to the discrimination between probands
and unaffected siblings than inattentive symptoms
(mean T
w
=1.97). Among the symptoms discriminating
significantly, ‘running about’ (HPY3; T
w
=10.57) was the
symptom that discriminated most strongly, followed by
‘ being on the go’ (HYP5; T
w
=7.96), ‘fidgeting’ (HYP1;
T
w
=7.22), ‘listening’ (IA3; T
w
=6.72), ‘organizing tasks’
(IA5 ; T
w
=5.24), ‘ difficulties waiting turn’ (IMP8;
T
w
=3.86), and ‘attention to details’ (IA1; T
w
=3.81). See
Table 3 for detailed results.
Comorbid symptoms in probands
The most frequent comorbid disorders in probands
were oppositional defiant disorder (ODD; 64%), cond uct
disorder (CD; 24%), anxiety disorders (ANX; 44%), and
mood disorders (MOOD; 15%) (see Table 4).
A hierarchical log-linear analysis of cell differences
with regard to gender and comorbid condition revealed
centre effects for all four conditions and a gender effect
for mood disorders.
The final model for ODD retained all main effects and
interactions. Partial associations were significant for
ODD by centre, c
p
2
=51.8, df = 10, p < .001, but not for
ODD by gender. ODD rates ranged from 48.1% up to
81.0% across centres. The final model for CD retained
the gender effect and the centre by CD interaction
effect. Partial associations were significant for CD by
centre, c
p
2
=73.8, df = 10, p < .001, but not for CD by
gender. CD rates in centres ranged from 10.8% to
45.3%. The final model for ANX retained the gender
effect and the centre by ANX interaction effect. Partial
associations were significant for ANX by centre,
c
p
2
=66.4, SD = 10, p < .001, but not for ANX by gender.
ANX rates in centres ranged from 25% to 65.8%. The
final model for MOOD retained the two interaction
effects of gender by MOOD and centre by MOOD. Par-
tial associations were significant for MOOD by centre,
c
p
2
=59.7, SD = 10, p < .001, and for MOOD by gender,
c
p
2
=4.2, df = 1, p = .041, indicating that MOOD differed
between centres (range 5.4% to 32.9%) and that a higher
proportion of girls (21.5%) compared to boys (14.5%)
were affected.
The frequencies of remaining conditions in the proband
sample were assessed only at syndrome level and were
clearly less prevalent. Obsessive compulsive disorder was
possibly present in 35 boys (3.7%) and 4 girls (3.1%), Tour-
ette’s syndrome was possibly present in 22 boys (2.3%) and
3 girls (2.3%), substance abuse was possibly present in 19
boys (2%) and 1 girl (0.8%), psychosis was possibly present
in 8 boys (0.9%) and 2 girls (1.5%), bipolar affective disor-
der was possibly present in 4 boys (0.4%) and 3 girls
(2.3%), and reactive attachment disorder was possibly pre-
sent in 4 boys (0.4%) and 1 girl (0.8%).
Discussion
The present paper deals with the analysis of behavioural
data of the International Multi-centre ADHD Genetics
Müller et al. BMC Psychiatry 2011, 11:54
/>Page 13 of 20
(IMAGE) project. The main focus is on the impact of
the multi-centre design and the diagnostic procedure on
the homogeneity of the data. Aggregating data from sev-
eral recruiting centres is an important research strategy
in order to enlarge sample sizes and, thus, to increase
statistical power which is needed for generalising results,
i.e., for achieving a needed level of significance.
The sample size is essential particularly in genetic
linkage analyses of complex traits like ADHD w hen
searching for markers contributing only to a small
extent to the ris k of ADHD [19]. While statistical power
can be enlarged by increasing the sample size, it may be
also reduced by factors influencing sample homogen eity
by introducing uncontrolled or uncontrollable variance.
The following discussion of the results will mainly focus
on issues of sample homogeneity.
Despite the identical inclusion criteria (in terms of the
numbers of ADHD symptoms) for children of all ages,
we found a negative correlation between age and the
mean number of hyperactive symptoms in the probands
sample: older probands had lower numbers of symptoms
than younger probands. At first sight, this could be
interpreted as decreasing disease severity with age in
our sample.
The interpretation of this age effect, however, must
take into account the interplay between populati on
characteristics and the diagnostic procedure. Previous
studies have shown that age is an important factor mod-
erating the symptoms of ADHD, resulting in a general
symptom decline [8]. This is clearly underlined by nor-
mative sample data used in the IMAGE project, e.g., th e
CTRS [63]: a six year old girl having a score of thirteen
on the CTRS DSM-IV hyperactivity scale deviates two
standard deviations from the mean (T = 70), whereas a
sixteen years old girl having the same score deviates
twice as much, i.e. four standard deviations, from the
mean (T = 90). Age effects in inattentive scores of the
normative sample are less pronounced, but in the same
direction. Thus, many adolescents probably had more
hyperactive/impulsive or inattentive symptoms when
they were younger.
These age effects ha ve two important consequences in
terms of disease severity: First, adolescents may deviate
to a stronger extent from the normative mean in
Table 4 Comorbidities in the probands sample (divided by centre and gender)
Sites°
BEL_G ENG_L/S ESP_V GER_E GER_G IRL_D ISR_J ISR_P NLD_A NLD_G SWI_Z Total
Oppositional Defiant Disorder*
Boys 18/9/0
66.7%
131/29/4
79.9%
37/32/0
53.6%
24/8/0
75.0%
57/19/0
75.0%
57/27/1
67.1%
37/15/0
71.2%
74/46/0
61.7%
83/52/0
61.5%
73/60/1
54.5%
19/19/5
44.2%
610/316/11
65.1%
Girls 5/0/0
100%
14/1/0
93.3%
3/2/0
60.0%
2/2/0
50.0%
4/2/0
66.7%
8/7/0
53.3%
6/1/1
75.0%
4/9/0
30.8%
6/14/0
30.0%
17/12/1
56.7%
6/3/0
66.7%
75/53/2
57.5%
All 23/9/0
71.9%
145/30/4
81.0%
40/34/0
54.1%
26/10
72.2%
61/21/0
74.4%
65/34/1
65.0%
43/16/1
71.7%
78/55/0
58.6%
89/66/0
57.4%
90/72/2
54.9%
25/22/5
48.1%
685/369/13
64.2%
Conduct disorder*
Boys 8/19/0
29.6%
73/87/4
44.5%
8/61/0
11.6%
14/18/0
43.8%
21/55/0
27.6%
22/62/1
25.9%
5/47/0
9.6%
22/98/0
18.3%
34/101/0
25.2%
24/109/1
17.9%
5/32/6
11.6%
236/689/12
25.2%
Girls 2/3/0
40.0%
8/7/0
53.3%
0/5/0
0.0%
1/3/0
25.0%
2/4/0
33.3%
2/13/0
13.3%
2/5/1
25.0%
0/13/0
0.0%
3/17/0
15.0%
3/26/1
10.0%
1/8/0
11.1%
24/104/2
18.5%
All 10/22/0
31.3%
81/94/4
45.3%
8/66/0
10.8%
15/21/0
41.7%
23/59/0
28.0%
24/75/1
24.0%
7/52/1
11.7%
22/111/0
16.5%
37/118/0
22.4%
27/135/2
16.5%
6/40/0
11.5%
260/793/1
4
24.4%
Anxiety disorders*
Boys 12/15/0
44.4%
78/80/6
47.6%
22/47/0
31.9%
12/20/0
37.5%
34/42/0
44.7%
25/58/2
29.4%
12/40/0
23.1%
43/77/0
35.8%
89/46/0
65.9%
53/80/1
39.6%
25/14/4
58.1%
405/519/13
43.2%
Girls 2/3/0
40.0%
12/3/0
80.0%
1/4/0
20.0%
1/3/0
25.0%
3/3/0
50.0%
4/11/0
26.7%
3/4/1
37.5%
7/6/0
53.8%
13/7/0
65.0%
16/13/1
53.3%
5/4/0
55.6%
67/61/2
51.5%
All 14/18/0
43.8%
90/83/6
50.3%
23/51/0
31.3%
13/23/0
36.1%
37/45/0
45.1%
29/69/2
29.0%
15/44/1
25.0%
50/83/0
37.6%
102/53/0
65.8%
69/93/2
42.1%
30/18/4
57.7%
472/580/1
5
44.2%
Mood disorders*
Boys 3/24/0
11.1%
30/129/5
18.3%
4/65/0
5.8%
1/31/0
3.1%
6/70/0
7.9%
10/73/2
11.8%
5/47/0
9.6%
13/107/0
10.8%
45/90/0
33.3%
16/117/1
11.9%
3/36/4
7.0%
136/789/12
14.5%
Girls 1/4/0
20.0%
8/7/0
53.3%
0/5/5
0.0%
0/4/0
0.0%
1/5/0
16.7%
2/13/0
13.3%
2/5/1
25.0%
1/12/0
7.7%
6/14/0
30.0%
7/22/1
23.3%
0/9/0
0.0%
28/100/2
21.5%
All 4/28/0
12.5%
38/136/5
21.2%
4/70/0
5.4%
1/35/0
2.8%
7/75/0
8.5%
12/86/2
12.0%
7/52/1
11.7%
14/119/0
10.5%
51/104/0
32.9%
23/139/2
14.0%
3/45/4
5.8%
164/889/14
15.4%
* Numbers in cells indicate: “possible diagnosis"/"no diagnosis"/"n.a."; percentage of “possible diagnosis”.
° For abbreviations see text.
Müller et al. BMC Psychiatry 2011, 11:54
/>Page 14 of 20
compa rison to young children with the same number of
ADHD s ymptoms present. Secondly, some evidence for
genotype differences in groups differing in age but not
in the number of ADHD symptoms can be derived.
Therefore, if ADHD is seen as a quantitative trait, a
probabilistic positive association may be assumed
between the degree a phenotype (e.g. measured by
dimensional questionnaire scores) deviates from the
population mean and the number of alleles present,
which are associated with the trait [19,64]. If a sample
of individuals with an identical number of ADHD symp-
toms, but of different age, is virtually retraced to the age
of five years, the mean number of ADHD symptoms in
the older individuals would probably become smaller
due to the negative correlation between age and symp-
toms in the population. In this virtual sample, as the
quantitative trait hypothesis states, individuals with
lower symptom numbers, i.e. a less deviating phenotype,
have a lower probability of carrying an allele associated
with the trait [64]. Because this is true for all suscept-
ibility genes, it may be argued that individuals with
fewer symptoms have a lower overall probability of car-
rying alleles associated with ADHD than individuals
with more symptoms, irrespective of genetic interactions
and environmental factors. As a final consequence, ado-
lescents of our proband sample may have a higher
genetic risk for ADHD than young probands with the
same number of ADHD symptoms.
This implicit age effect inferred from epidemiological
studies and a normative sample was moderated by the
(small) negative correlation between age and the num-
ber of hyperactivity symptoms in our sample. As a con-
sequence of these two features, one has to assume that,
on the one hand, adolescents in our proband sample dif-
fered on average to a smaller extent from young chil-
dren than inferred from the normative sample. On the
other hand, individual differences between a dolescents
and y oung children with an identical number of symp-
toms remained. There fore, we must conclude t hat the
disease severity in terms of the deviation from normality
increased with age, and that this effect was not repre-
sented in the number of ADHD symptoms present.
We found no age differences between boys and girls
in the proband sample. But among the 11 centres there
were ten significant pairwise differences in mean age
ranging from 1.4 to 2.6 years, with effect sizes between
0.9 and 0 .5. As a consequence, one would expect that
centres with rather young probands, e.g. ESP_V, would
have a relatively lower mean number of hyperactive
symptoms, indicated by a lower rank after age correc-
tion, and vice versa (see Figure S2 in the Additional file
2). In fact, the change of rank position in only two cen-
tres (ESP_V and GER_E) was consistent with this
hypothesis regarding the direction of rank change.
However, the mean number of hyperactivity symptoms
in these two centres was almost identical, so that the
centre effects on hyperactive symptoms were moderated
only marginally by age, probably at least partly due to
the restricted r ange of symptom numbers in pro bands.
Again, the effect of age differences between centres on
hyperactive symptom number differences between ce n-
tres was smaller t han expected due to the moderating
effect of declining hyperactive symptom numbers with
age in our proband sample.
Gender was an additional source of heterogeneity with
respect to ADHD symptoms and the comorbid condi-
tions which are usually more frequent in boys [65].
Again, the normative sample underlying the DSM-IV
scores of the CTRS [63] illustrates the differences attri-
butable to gender: a T-score of 70 in the DSM-IV inat-
tention s cale is associated with a raw score of 16 in six
year old boys, but with a raw score of only 8 in girls of
the same age; in the DSM-IV hyperactivity/impulsivity
scale the analogue scores are 18 in boys but only 10 in
girls.
The proband sample of the present study had a homo-
geneous gender structure due to an absence of age dif-
ferences between boys and girls and equal gender ratios
across centres. Consequently, we can exclude that centre
effects or gender e ffects on dependent variables were
confounded by age effects.
The investigation of gender effects in the probands
revealed no direct effects in most of the variables asso-
ciated with the diagnostic procedure (i.e., the number of
hyperactive symptoms, the age at inattention and hyper-
activity detection, medication, all PACS ADHD symp-
toms, sixteen out of eighteen CPRS symptoms, and
three of the four comprehensively assessed comorbid-
ities, namely CD, ODD, and ANX). Exceptions were
higher frequencies of inattentive symptoms (PACS and
CTRS combined) in boys compared to girls and higher
frequenciesinboysfortwothirdsoftheADHDsymp-
toms in the CTRS.
These differences were consistent with a meta-analysis
reporting higher ADHD symptoms in boys compared to
girls [65]. Concordant with gender d ifferences in the
normative sample, we conclude that girls in our proband
sample deviated to a greater extent from normality than
boys, even though the girls’ symptom counts were simi-
lar or slightly lower than those of the boys - and that
the use of equal symptom criteria in boy s and girls
introduced heterogeneity into the probands sample.
The multi-centre design is another possible source of
sample heterogeneity. Analyses of the proband sample
showed that centre effects played a more important role
than age or gender effects. The c entres differed signifi-
cantly in age, in both inattentive and hyperactive/impul-
sive symptom numbers, in age of detection of both
Müller et al. BMC Psychiatry 2011, 11:54
/>Page 15 of 20
inattentive and hyperactive/impulsive symptoms, in fif-
teen out of eighteen ADHD symptoms in the PACS
interview, in seventeen out of eighteen ADHD symp-
toms in the CPRS, in all ADHD symptoms in the CTRS,
in five out of nine combined (PACS and CTRS) inatten-
tive, and six out of nine combined hyperactive/impulsive
symptoms, and in all comprehensively assessed comor-
bid conditions (CD, ODD, ANX, and MOOD).
Even if we would assume that centres did not differ
with respect to genetic, socio-cultural, and methodologi-
cal aspects, differences in gender and age ratios be tween
centres, combined with differing sample sizes, could
enhance the sample variance and introduce additional
het eroge neity due to variab les that were associated with
gender or age. Such indirect effects were, however,
either absent in the proband sample (gender), or only
played a minor role with respect to ADHD symptoms
(age), as discussed a bove. Consequently, we must
assume that other factors caused the differences in psy-
chopathology measures betw een centres (e.g. genotype
differences [46], socio-cultural population differences,
regional demographic factors, or specific health care
structures leading to specific recruiting strategies). Not
at least, different implicit normative backgrounds asso-
ciated with sociocultural factors may have led to differ-
ent ratings of objectively identical behaviour.
The hypothesis of a genotypic north-south factor
[46] had no evident phenotypic equivalent in the pro-
bands with respect to symptom numbers, age of symp-
tom detection, and frequencies of individual diagnostic
symptoms. Centre differences in any of these variables
did not build recognizable geographic patterns and
neighbouring centres did not cluster more than distant
centres did. Even national clusters were not recognisa-
ble to an extent that would justify dividing our sample
into units of countries instead of centres. For example,
thereweresomeconsiderableandsignificantagedif-
ferences (adjusted for multiple testing) between the
two centres from both Germany and Israel, within-
country-differences in the mea n number of inatte ntive
symptoms in Israel and the Netherlands, differences in
the mean number of hyperactive symptoms (Nether-
lands, Israel, Germany), and also for age a t symptom
detection (Israel).
In summary, there were notable differences between
centres in ADHD and co morbid symptoms. Although
the variations of ADHD symptoms across centres
remained within the diagnostic boundaries of ADHD-
CT, we conclude that the significant centre differences
result in a broader phenotypic range compared to a
hypothetical sample of the same size with a single
recruiting centre only. In particular with respect to
genetic analyses and analyses of endophenotypes, power
is, on the one hand, increased by expanding the sample
size but, on the other hand, decreased by using a multi-
centre recruiting strategy. Choosing a single-centre
strategy, even if more time is needed for recruiting, is
probably still the favourite strategy with respect to sta-
tistical power.
We investigated the differential influence of diagnostic
symptoms in the diagnostic process. The higher discri-
minatory weights of hyperactive symptoms compared to
inattentive symptoms in a binary logistic regression indi-
cate that only few and predominantly hyperactive symp-
toms were needed to discriminate between probands
and controls. Concordant with other findings, this result
challenges the diagnostic system of t he DSM-IV weigh-
ing a ll symptoms equally in an additive algo rithm
[66-68]. Interpretations going beyond this general state-
ment, however, are neither appropriate nor intended
due to methodological restrictions of the present study.
For exam ple, the 79 siblings of the control sample were
part of those 339 siblings, who underwent the full diag-
nostic procedure due to suspected ADHD. Even if the y
did not reach the diagnostic threshold, many of them
probably were subclinical cases, as indicated by a mean
ADHD-symptom frequency of 51%, which corresponded
to 9 positive symptoms out of 18 on average.
To investigate informant effects and instrument
effects, we compared the two diagnostic sources PACS
and CTRS and compared them to a third source, the
CPRS, which was not implemented in the diagnostic
procedure, but was used for screening. We found higher
symptom frequencies in the parents’ ratings compared
to the teachers’ ratings in the proband sample, indepen-
dent of whether the CPRS or the PACS was compared
totheCTRS.Thesefindingsareinaccordancewith
known contrasts often seen in parent ratings that result
from the direct comparison between two children and
lead to a relative overestimation of the probands’ symp-
toms compared to the siblings’ symptoms [69,70]. In
addition, medication may play a role, because some of
the children were medicated continuously at school, but
not at home.
Within the parents’ ratings, the interview led to higher
frequencies for 13/18 symptoms than the questionnaire.
This higher sensitivity of the PACS for 2/3 of the symp-
toms may be a consequence of the more objective diag-
nostic conceptualization of the PACS, which assesses
symptoms to a lesser extent by an implicit deviance rat-
ing, as the questionnaire does, but rather by asking how
frequent and how intensive a symptom occurs. In con-
trast to this general tendency, the ability to sustain
attention (IA2) is recorded much more frequently by
the CPRS (84% in boys, 79% in girls) than by the PACS
(46%, 42%). A comparison between symptoms and
between the three diagnostic sources suggests that the
sensitivity of the PACS is too weak for this symptom.
Müller et al. BMC Psychiatry 2011, 11:54
/>Page 16 of 20
The higher general sensitivity of the interview compared
to the questionnaire, however, does not imply a lack in
the utility of questionnaires as scre ening instruments. In
general, the cut-off criteria of screening instruments
were set f ar below the diagnostic threshold (we used a
T-score of 63), so that all subjects, who reach the diag-
nostic threshold of the interview, but not of the ques-
tionnaire, were positively screened in all cases.
Informant and contrast effects were analysed and dis-
cussed on the basis of continuous data in the second
part of this contribution, which concentrates on ques-
tionnaire scores [47].
Some further comments on the diagnostic procedure
with respect to heterogeneity in the proband sample
should be made. The diagnostic procedure of the
IMAGE study used a teachers’ questionnaire (CTRS)
and a parental interview (PACS) in combination , by
counting a symptom as present if it was present either
in the CT RS or in the PACS. To prevent diagnoses
based on a single informant only, at least two of the
symptoms had to be present in both settings. This algo-
rithm allows children to be positively diagnosed, even if
their symptoms level is below the diagnostic threshold
at home, at school, and even in both settings. This effect
becomes evident when the frequencies of combined
(PACS or CTRS) diagnostic symptoms (Table 3) is com-
pared to the frequencies of each source alone (Figure 1).
Whereas the most infre quent symptom occurs in about
80% of the probands when PACS and CTRS are com-
bined, the lowest frequencies in PACS alone (<50%),
CPRS alone (<60%), and CTRS alone (<40%) are clearly
lower. The a pplied procedure may have excluded chil-
dren without pervasive problems, but, on the other
hand, also broadened the variety of symptom patterns in
the proband sample and included some cases classified
as subclinical in one or both settings. If we assume that
some genetic variants interact differentially with the
environmental conditions (home or school), the applied
diagnostic algorithm classifying symptoms independently
of their environmental condition and the type of infor-
mant may have introduced an uncontrolled variance in
the phenotype.
Finally, some comments should be made co ncerning
the sibling sample of the present study. The sample of
339 diagnosed siblings was heterogeneous in various
ways. The subtypes differed across centres and between
genders. There were, in particular, higher rates of
ADHD-CT in boys than in girls. The mean number of
both inattentive a nd hyperactive/impulsive symptoms
differed between gender (higher frequencies in boys)
and between centres. Differences in implementing the
criteria for conducting the sibling interview (e.g. ‘clinical
suspicion of ADHD’) may have introduced a bias leading
to the large differences in subtype frequencies across
centres. Additionally, differences in personnel resources,
in combinatio n with the declared purpose of the sibling
interview (excluding ADHD cases in the sibling sample),
may have introduced a centre bias. For these rea sons,
we do not further discuss the findings on the selected
siblings but refer to th e second part of this contribution
dealing with analyses of the complete sample of 1446
siblings based on questionnaire data [47].
Conclusion
The p resent IMAGE project used a multi-centre design
in order to reach an acceptable power for detecting
genetic variants involved in ADHD. The multi-centre
design may have led to additional heterogeneity in the
sample, as demonstrated by the present contribution.
Additionally, a diagnostic procedure invariant to age,
gender, and informant, as used in the IMAGE study,
may have enhanced the heterogeneity in the proband
sample. Our data do not allow us to define an optimal
trade-off between sample size and sample homogeneit y.
In conclusion, we recommend that genetic analyses be
either statistically adjusted for the known sources of var-
iance (age, gender, centres) or that they be stratified by
sources of heterogeneity. Removal of outliers or using
robust statistics might also enhance statistical power.
Additional material
Additional file 1: Figure S1. Mean age of centre subsamples in
ascending order, and significant post hoc pairwise comparisons.
Additional file 2: Figure S2. Trimmed means of symptom numbers and
age at symptom onset in probands (N = 1068).
Additional file 3: Table S1. Diagnostic subtypes in the siblings sample.
Additional file 4: Figure S3. Subtype frequencies in the siblings sample
across centres and gender.
Abbreviations
DSM-IV criteria for ADHD: IA1 Often fails to give close attention to details or
makes careless mistakes in schoolwork, work, or other activities; IA2 Often
has difficulty sustaining attention in tasks or play activities; IA3 Often does
not seem to listen when spoken to directly; IA4 Often does not follow
through on instructions and fails to finish schoolwork, chores, or duties in
the workplace (not due to oppositional behavior or failure to understand
instructions); IA5 Often has difficulty organizing tasks and activities; IA6 Often
avoids, dislikes, or is reluctant to engage in tasks that require sustained
mental effort (such as schoolwork or homework); IA7 Often loses things
necessary for tasks or activities (eg, toys, school assignments, pencils, books,
or tools); IA8 Is often easily distracted by extraneous stimuli; IA9 Is often
forgetful in daily activities; HYP1 Often fidgets with hands or feet or squirms
in seat; HYP2 Often leaves seat in classroom or in other situations in which
remaining seated is expected; HYP3 Often runs about or climbs excessively
in situations in which it is inappropriate (in adolescents or adults, may be
limited to subjective feelings of restlessness); HYP4 Often has difficulty
playing or engaging in leisure activities quietly; HYP5 Is often ‘on the go’ or
often acts as if ‘driven by a motor’; HYP6 Often talks excessively; IMP7 Often
blurts out answers before questions have been completed; IMP8 Often has
difficulty awaiting turn; IMP9 Often interrupts or intrudes on others (eg, butts
into conversations or games)
Müller et al. BMC Psychiatry 2011, 11:54
/>Page 17 of 20
Acknowledgements
The IMAGE project is a multi-site, international effort supported by NIH
grants R01MH62873 and R01MH081803 to S.V. Faraone. The IMAGE site
Principal Investigators are Philip Asherson, Tobias Banaschewski, Jan
Buitelaar, Richard P. Ebstein, Stephen V. Faraone, Michael Gill, Ana Miranda,
Fernando Mulas, Robert D. Oades, Herbert Roeyers, Aribert Rothenberger,
Joseph Sergeant, Edmund Sonuga-Barke, and Hans-Christoph Steinhausen.
Senior coinvestigators are Margaret Thompson, Pak Sham, Peter McGuffin,
Robert Plomin, Ian Craig and Eric Taylor. Chief Investigators at each site are
Rafaela Marco, Nanda Rommelse, Wai Chen, Henrik Uebel, Hanna
Christiansen, Ueli C. Müller, Cathelijne Buschgens, Barbara Franke, Lamprini
Psychogiou. We thank all the families who kindly participated in this
research. The authors are very grateful to Rand R. Wilcox, University of
California at Los Angeles, for his statistical advice and support.
Author details
1
Department of Child and Adolescent Psychiatry, University of Zurich,
Switzerland.
2
Hochschule für Heilpädagogik, Zurich, Switzerland.
3
MRC Social
Genetic Developmental and Psychiatry Centre, Institute of Psychiatry,
London, UK.
4
Department of Child and Adolescent Psychiatry and
Psychotherapy, Central Institute of Mental Health, J 5, Mannheim, Germany.
5
Department of Psychiatry, Radboud University Nijmegen Medical Center,
Nijmegen, The Netherlands.
6
Department of Psychology, Hebrew University,
Jerusalem, Israel.
7
Department of Psychiatry, School of Medicine, Trinity
College Dublin, Dublin, Ireland.
8
Geha MHC, Petach-Tikva, Israel.
9
Department
of Developmental and Educational Psychology, University of Valencia,
Valencia, Spain.
10
Clinic for Child and Adole scent Psychiatry and
Psychotherapy, University of Duisburg-Essen, Essen, Germany.
11
Department
of Experimental Clinical and Health Psychology, Ghent University, Ghent,
Belgium.
12
Department of Child and Adolescent Psychiatry, University of
Göttingen, Göttingen, Germany.
13
Department of Clinical Neuropsychology,
Vrije Universiteit, Amsterdam, The Netherlands.
14
School of Psychology,
University of Southampton, Southampton, UK.
15
Departments of Psychiatry
and of Neuroscience and Physiology, SUNY Upstate Medical University,
Syracuse, NY, USA.
16
Aalborg Psychiatric Hospital, Aarhus University Hospital,
Aalborg, Denmark.
17
Clinical Psychology and Epidemiology, Institute of
Psychology, University of Basel, Basel, Switzerland.
Authors’ contributions
UCM and HCS jointly planned the analyses and drafted the manuscript with
UCM performing all the statistical analyses. All other authors were principle
investigators at the various centres and SVF was overall principle investigator
of the IMAGE study. All authors commented on the manuscript and
approved the final draft.
Competing interests
PA has consulted with, received education grants from or spoken at
sponsored meetings for Shire, Janssen-Cilag, Eli-Lilly and Flynn Pharma. JB
has been in the past 3 years a consultant to/member of advisory board of/
and/or speaker for Janssen Cilag BV, Eli Lilly, Bristol-Myer Squibb, Organon/
Shering Plough, UCB, Shire, Medice, Servier, and Servier. TB served in an
advisory or consultancy role for Bristol-Myers Squibb, Desitin, Lilly, Medice,
Novartis, Pfizer, Shire, UCB and Viforpharma. He received conference
attendance support or received speaker’s fee by Lilly, Janssen McNeil,
Medice, Novartis, Shire, UCB. He received unrestricted grants for organizing a
CME conference by Lilly, Janssen McNeil, Medice, Novartis, Shire, UCB. He is/
has been involved in clinical trials conducted by Lilly, Shire and Novartis. The
present work is unrelated to the above grants and relationships. SVF has, in
the past year received consulting fees and has been on Advisory Boards for
Eli Lilly, Ortho-McNeil and Shire Development and has received research
support from Eli Lilly, Pfizer, Shire and the National Institutes of Health. In
previous years, SVF has received consulting fees or has been on Advisory
Boards or has been a speaker for the following sources: Shire, McNeil,
Janssen, Novartis, Pfizer and Eli Lilly. In previous years he has received
research support from Eli Lilly, Shire, Pfizer and the National Institutes of
Health. RDO received support from Janssen and UCB during this period. HR
has served as an advisor to Shire and received research support from Shire
and Lilly and conference attendance support from Lilly.
The present study is unrelated to these relationships. AR declares the
following competing interests: Advisory Board and Speakers Bureau: Lilly,
Shire, Medice, Novartis; Research Support: Shire, German Research Society,
Schwaabe; Travel Support: Shire; Educational Grant: Shire. JS declares the
following competing interests: Advisory Board: Lilly, Shire, Research Grant(s)
Lilly, Speaker’s Fee: Shire, Lilly, Janssen-Cillag. ESB declares the following
competing interests: Recent speaker board: Shire, UCB Pharma. Current &
recent consultancy: UCB Pharma, Shire. Current & recent research support:
Janssen Cilag, Shire, Qbtech, Flynn Pharma. Advisory Board: Shire, Flynn
Pharma, UCB Pharma, Astra Zeneca. Conference support: Shire. HCS has
served as an advisor and/or speaker to the following companies: Janssen-
Cilag, Eli Lilly, Medice, Novartis, Shire, and UCB. MT has served as an advisor,
speaker and had research grants from the following companies: Janssen-
Cilag, Eli Lilly, Shire, and UCB. All other authors declare no competing
interests to disclose.
Received: 13 May 2010 Accepted: 7 April 2011 Published: 7 April 2011
References
1. Polanczyk G, de Lima MS, Horta BL, Biederman J, Rohde LA: The worldwide
prevalence of ADHD: a systematic review and metaregression analysis.
[see comment]. American Journal of Psychiatry 2007, 164(6):942-948.
2. Rohde LA, Szobot C, Polanczyk G, Schmitz M, Martins S, Tramontina S:
Attention-deficit/hyperactivity disorder in a diverse culture: do research
and clinical findings support the notion of a cultural construct for the
disorder? Biological Psychiatry 2005, 57(11):1436-1441.
3. American Psychiatric Association: Diagnostic and Statistical Manual of
Mental Disorders, 4th Edition. Washington DC: American Psychiatric
Association; 1994.
4. Biederman J, Faraone S, Lapey K: Comorbidity of Diagnosis in Attention-
Deficit Hyperactivity Disorder. Child & Adolescent Psychiatric Clinics of North
America 1992, 1(2):335-360.
5. Spencer T: ADHD and comorbidity in childhood. Journal of Clinical
Psychiatry 2006, 8:27-31.
6. Willcutt EG, Pennington BF, Chhabildas NA, Friedman MC, Alexander J:
Psychiatric comorbidity associated with DSM-IV ADHD in a nonreferred
sample of twins. Journal of the American Academy of Child & Adolescent
Psychiatry 1999, 38(11):1355-1362.
7. Gillberg C, Gillberg IC, Rasmussen P, Kadesjo B, Soderstrom H, Rastam M,
Johnson M, Rothenberger A, Niklasson L: Co-existing disorders in ADHD –
implications for diagnosis and intervention. European Child & Adolescent
Psychiatry 2004, 13(Suppl 1):I80-92.
8. Faraone SV, Biederman J, Mick E: The age-dependent decline of attention
deficit hyperactivity disorder: a meta-analysis of follow-up studies.
Psychological Medicine 2006, 36(2):159-165.
9. Barkley RA, Fischer M, Smallish L, Fletcher K: The persistence of attention-
deficit/hyperactivity disorder into young adulthood as a function of
reporting source and definition of disorder. Journal of Abnormal
Psychology 2002, 111(2):279-289.
10. Kessler RC, Adler LA, Barkley R, Biederman J, Conners CK, Faraone SV,
Greenhill LL, Jaeger S, Secnik K, Spencer T, et al: Patterns and predictors of
attention-deficit/hyperactivity disorder persistence into adulthood:
results from the national comorbidity survey replication. Biological
Psychiatry 2005, 57(11):1442-1451.
11. Fischer M, Barkley RA, Smallish L, Fletcher K: Young adult follow-up of
hyperactive children: self-reported psychiatric disorders, comorbidity,
and the role of childhood conduct problems and teen CD.[erratum
appears in J Abnorm Child Psychol. 2003 Oct;31(5):563]. Journal of
Abnormal Child Psychology 2002, 30(5):463-475.
12. Fayyad J, De Graaf R, Kessler R, Alonso J, Angermeyer M, Demyttenaere K,
De Girolamo G, Haro JM, Karam EG, Lara C, et al: Cross-national prevalence
and correlates of adult attention-deficit hyperactivity disorder. British
Journal of Psychiatry 2007, 190:402-409.
13. Barkley RA: Major life activity and health outcomes associated with
attention-deficit/hyperactivity disorder.
Journal of Clinical Psychiatry 2002,
63(Suppl
12):10-15.
14. Biederman J, Faraone SV, Spencer TJ, Mick E, Monuteaux MC, Aleardi M:
Functional impairments in adults with self-reports of diagnosed ADHD:
A controlled study of 1001 adults in the community. Journal of Clinical
Psychiatry 2006, 67(4):524-540.
15. Biederman J, Faraone SV, Spencer T, Wilens T, Norman D, Lapey KA, Mick E,
Lehman BK, Doyle A: Patterns of psychiatric comorbidity, cognition, and
psychosocial functioning in adults with attention deficit hyperactivity
disorder. American Journal of Psychiatry 1993, 150(12):1792-1798.
Müller et al. BMC Psychiatry 2011, 11:54
/>Page 18 of 20
16. Faraone SV, Perlis RH, Doyle AE, Smoller JW, Goralnick JJ, Holmgren MA,
Sklar P: Molecular genetics of attention-deficit/hyperactivity disorder.
Biological Psychiatry 2005, 57(11):1313-1323.
17. Asherson P, Kuntsi J, Taylor E: Unravelling the complexity of attention-
deficit hyperactivity disorder: a behavioural genomic approach. British
Journal of Psychiatry 2005, 187:103-105.
18. Spencer T, Biederman J, Mick E: Attention-deficit/hyperactivity disorder:
diagnosis, lifespan, comorbidities, and neurobiology. J Pediatr Psychol
2007, 32(6):631-642.
19. Asherson P, IMAGE Consortium: Attention-Deficit Hyperactivity Disorder in
the post-genomic era. European Child & Adolescent Psychiatry 2004, 13(1).
20. Faraone SV, Asherson P: The Molecular Genetics of ADHD: A View From
the IMAGE Project. Psychiatric Times 2005, XXII(9):21-23.
21. Lasky-Su J, Banaschewski T, Buitelaar J, Franke B, Brookes K, Sonuga-Barke E,
Ebstein R, Eisenberg J, Gill M, Manor I, et al: Partial Replication of a DRD4
Association in ADHD Individuals Using a Statistically Derived
Quantitative Trait for ADHD in a Family-Based Association Test. Biological
Psychiatry 2007, 62(9):985-990.
22. Lasky-Su J, Anney RJL, Neale BM, Franke B, Zhou K, Maller JB, Vasquez AA,
Chen W, Asherson P, Buitelaar J, et al: Genome-wide association scan of
the time to onset of attention deficit hyperactivity disorder. Part B,
Neuropsychiatric Genetics: the Official Publication of the International
Society of Psychiatric Genetics. American Journal of Medical Genetics 2008,
147B(8):1355-1358.
23. Neale BM, Lasky-Su J, Anney R, Franke B, Zhou K, Maller JB, Vasquez AA,
Asherson P, Chen W, Banaschewski T, et al: Genome-wide association scan
of attention deficit hyperactivity disorder. Part B, Neuropsychiatric
Genetics: the Official Publication of the International Society of
Psychiatric Genetics. American Journal of Medical Genetics 2008,
147B(8):1337-1344.
24. Xu X, Hawi Z, Brookes KJ, Anney R, Bellgrove M, Franke B, Barry E, Chen W,
Kuntsi J, Banaschewski T, et al: Replication of a rare protective allele in
the noradrenaline transporter gene and ADHD. Am J Med Genet B
Neuropsychiatr Genet 2008, 147B(8):1564-1567.
25. Zhou K, Asherson P, Sham P, Franke B, Anney RJ, Buitelaar J, Ebstein R,
Gill M, Brookes K, Buschgens C, et al: Linkage to chromosome 1p36 for
attention-deficit/hyperactivity disorder traits in school and home
settings. Biol Psychiatry 2008, 64(7):571-576.
26. Asherson P, Brookes K, Franke B, Chen W, Gill M, Ebstein RP, Buitelaar J,
Banaschewski T, Sonuga-Barke E, Eisenberg J, et al: Confirmation that a
specific haplotype of the dopamine transporter gene is associated with
combined-type ADHD.[see comment]. American Journal of Psychiatry 2007,
164(4):674-677.
27. Asherson P, Zhou K, Anney RJL, Franke B, Buitelaar J, Ebstein R, Gill M,
Altink M, Arnold R, Boer F,
et al: A
high-density SNP linkage scan with 142
combined subtype ADHD sib pairs identifies linkage regions on
chromosomes 9 and 16. Molecular Psychiatry 2008, 13(5):514-521.
28. Brookes K, Xu X, Chen W, Zhou K, Neale B, Lowe N, Aneey R, Franke B,
Gill M, Ebstein R, et al: The analysis of 51 genes in DSM-IV combined
type attention deficit hyperactivity disorder: association signals in DRD4,
DAT1 and 16 other genes. Molecular Psychiatry 2006, 11(10) :934-953.
29. Chen W, Zhou K, Sham P, Franke B, Kuntsi J, Campbell D, Fleischman K,
Knight J, Andreou P, Arnold R, et al: DSM-IV combined type ADHD shows
familial association with sibling trait scores: a sampling strategy for QTL
linkage. Am J Med Genet B Neuropsychiatr Genet 2008, 147B(8):1450-1460.
30. Neale BM, Medland S, Ripke S, Anney RJL, Asherson P, Buitelaar J, Franke B,
Gill M, Kent L, Holmans P, et al: Case-control genome-wide association
study of attention-deficit/hyperactivity disorder. Journal of the American
Academy of Child & Adolescent Psychiatry 2010, 49(9):906-920.
31. Neale BM, Medland SE, Ripke S, Asherson P, Franke B, Lesch K-P,
Faraone SV, Nguyen TT, et al: Meta-analysis of genome-wide association
studies of attention-deficit/hyperactivity disorder. Journal of the American
Academy of Child & Adolescent Psychiatry 2010, 49(9):884-897.
32. Nijmeijer JS, Arias V, squez A, Rommelse NNJ, Altink ME, Anney RJL,
Asherson P, Banaschewski T, Buschgens CJM, et al: Identifying loci for the
overlap between attention-deficit/hyperactivity disorder and autism
spectrum disorder using a genome-wide QTL linkage approach. Journal
of the American Academy of Child & Adolescent Psychiatry 2010,
49(7):675-685.
33. Anney RJ, Lasky-Su J, O’Dushlaine C, Kenny E, Neale BM, Mulligan A,
Franke B, Zhou K, Chen W, Christiansen H, et al: Conduct disorder and
ADHD: evaluation of conduct problems as a categorical and quantitative
trait in the international multicentre ADHD genetics study. Am J Med
Genet B Neuropsychiatr Genet 2008, 147B(8):1369-1378.
34. Christiansen H, Chen W, Oades RD, Asherson P, Taylor EA, Lasky-Su J,
Zhou K, Banaschewski T, Buschgens C, Franke B, et al: Co-transmission of
conduct problems with attention-deficit/hyperactivity disorder: familial
evidence for a distinct disorder. Journal of Neural Transmission 2008,
115(2):163-175.
35. Mulligan A, Anney RJL, O’Regan M, Chen W, Butler L, Fitzgerald M,
Buitelaar J, Steinhausen H-C, Rothenberger A, Minderaa R, et al: Autism
symptoms in Attention-Deficit/Hyperactivity Disorder: a familial trait
which correlates with conduct, oppositional defiant, language and
motor disorders. Journal of Autism & Developmental Disorders 2009,
39(2):197-209.
36. Oades RD, Lasky-Su J, Christiansen H, Faraone SV, Sonuga-Barke EJ,
Banaschewski
T, Chen W, Anney RJ, Buitelaar JK, Ebstein RP, et al: The
influence of serotonin- and other genes on impulsive behavioral
aggression and cognitive impulsivity in children with attention-deficit/
hyperactivity disorder (ADHD): Findings from a family-based association
test (FBAT) analysis. Behav Brain Funct 2008, 4:48.
37. Zhou K, Chen W, Buitelaar J, Banaschewski T, Oades RD, Franke B, Sonuga-
Barke E, Ebstein R, Eisenberg J, Gill M, et al: Genetic heterogeneity in
ADHD: DAT1 gene only affects probands without CD. Am J Med Genet B
Neuropsychiatr Genet 2008, 147B(8):1481-1487.
38. Sobanski E, Banaschewski T, Asherson P, Buitelaar J, Chen W, Franke B,
Holtmann M, Krumm B, Sergeant J, Sonuga-Barke E, et al: Emotional lability
in children and adolescents with attention deficit/hyperactivity disorder
(ADHD): clinical correlates and familial prevalence. Journal of Child
Psychology & Psychiatry & Allied Disciplines 2010, 51(8):915-923.
39. Sonuga-Barke EJ, Brookes KJ, Buitelaar J, Anney R, Bitsakou P, Baeyens D,
Buschgens C, Chen W, Christiansen H, Eisenberg J, et al: Intelligence in
DSM-IV combined type attention-deficit/hyperactivity disorder is not
predicted by either dopamine receptor/transporter genes or other
previously identified risk alleles for attention-deficit/hyperactivity
disorder. Part B, Neuropsychiatric Genetics: the Official Publication of
the International Society of Psychiatric Genetics. American Journal of
Medical Genetics 2008, 147B(5) :670.
40. Marco R, Miranda A, Schlotz W, Melia A, Mulligan A, Muller U, Andreou P,
Butler L, Christiansen H, Gabriels I, et al: Delay and reward choice in
ADHD: an experimental test of the role of delay aversion.
Neuropsychology 2009, 23(3):367-380.
41. Andreou P, Neale BM, Chen W, Christiansen H, Gabriels I, Heise A, Meidad S,
Muller UC, Uebel H, Banaschewski T, et al: Reaction time performance in
ADHD: improvement under fast-incentive condition and familial effects.
Psychol Med 2007, 37(12):1703-1715.
42. Kuntsi J, Wood AC, Rijsdijk F, Johnson KA, Andreou P, Albrecht B, Arias-
Vasquez A, Buitelaar JK, McLoughlin G, Rommelse NNJ, et al: Separation of
cognitive impairments in attention-deficit/hyperactivity disorder into 2
familial factors. Archives of General Psychiatry 2010, 67(11):1159-1167.
43. Brookes KJ, Neale B, Xu X, Thapar A, Gill M, Langley K, Hawi Z, Mill J,
Taylor E, Franke B, et al: Differential dopamine receptor D4 allele
association with ADHD dependent of proband season of birth. Part B,
Neuropsychiatric Genetics: the Official Publication of the International
Society of Psychiatric Genetics. American Journal of Medical Genetics 2008,
147B(1):94-99.
44. Anney RJL, Hawi Z, Sheehan K, Mulligan A, Pinto C, Brookes KJ, Xu X,
Zhou K, Franke B, Buitelaar J, et al: Parent of origin effects in attention/
deficit hyperactivity disorder (ADHD): analysis of data from the
international multicenter ADHD genetics (IMAGE) program. Part B,
Neuropsychiatric Genetics: the Official Publication of the International
Society of Psychiatric Genetics. American Journal of Medical Genetics 2008,
147B(8):1495-1500.
45. Sonuga-Barke EJ, Lasky-Su J, Neale BM, Oades R, Chen W, Franke B,
Buitelaar J, Banaschewski T, Ebstein R, Gill M, et al: Does parental
expressed emotion moderate genetic effects in ADHD? An exploration
using a genome wide association scan. Am J Med Genet B Neuropsychiatr
Genet 2008, 147B(8):1359-1368.
46.
Neale BM, Sham PC, Purcell S, Banaschewski T, Buitelaar J, Franke B,
Sonuga-Barke E, Ebstein R, Eisenberg J, Mulligan A, et al: Population
differences in the International Multi-Centre ADHD Gene Project. Genetic
Epidemiology 2008, 32(2):98-107.
Müller et al. BMC Psychiatry 2011, 11:54
/>Page 19 of 20
47. Müller UC, Asherson P, Banaschewski T, Buitelaar J, Ebstein R, Eisenberg J,
Gill M, Manor I, Miranda A, Oades RD, et al: The impact of study design
and diagnostic approach in a large multi-centre ADHD study. Part 2:
Dimensional measures of psychopathology and intelligence. BMC
Psychiatry 2011, 11:55.
48. Taylor E, Everitt B, Thorley G, Schachar R, Rutter M, Wieselberg M: Conduct
disorder and hyperactivity: II. A cluster analytic approach to the
identification of a behavioural syndrome. British Journal of Psychiatry 1986,
149:768-777.
49. Taylor E, Schachar R, Thorley G, Wieselberg HM, Everitt B, Rutter M: Which
boys respond to stimulant medication? A controlled trial of
methylphenidate in boys with disruptive behaviour. Psychological
Medicine 1987, 17(1):121-143.
50. Taylor E, Schachar R, Thorley G, Wieselberg M: Conduct disorder and
hyperactivity: I. Separation of hyperactivity and antisocial conduct in
British child psychiatric patients. British Journal of Psychiatry 1986,
149:760-767.
51. Conners CK: Conners’ Parent Rating Scale - Revised (L)/Conners’ Teacher
Rating Scale - Revised (L). New York: Multi-Health Systems Inc; 1997.
52. Goodman R: The Strengths and Difficulties Questionnaire: a research
note. Journal of Child Psychology & Psychiatry & Allied Disciplines 1997,
38(5):581-586.
53. Rutter M, Bailey A, Berument S, Lecouteur A, Lord C, Pickles A: Social
Communication Questionnaire (SCQ). Los Angeles, CA: Western
Psychological Services; 2003.
54. Algina J, Keselman HJ, Penfield RD: An alternative to Cohen’s
standardized mean difference effect size: a robust parameter and
confidence interval in the two independent groups case. Psychological
Methods 2005, 10(3):317-328.
55. Keselman HJ, Algina J, Lix LM, Wilcox RR, Deering KN: A generally robust
approach for testing hypotheses and setting confidence intervals for
effect sizes. Psychological Methods 2008, 13(2):110-129.
56. Keselman HJ, Wilcox RR, Lix LM, Algina J, Fradette K: Adaptive robust
estimation and testing. British Journal of Mathematical & Statistical
Psychology 2007, 60(Pt 2):267-293.
57. Wilcox RR: Introduction to Robust Estimation and Hypothesis Testing.
London: Elsevier Academic Press;, 2 2005.
58. Wilcox RR: Applying Contemporary Statistical Techniques. London:
Elsevier Academic Press; 2003.
59. Wilcox RR: R functions [online resource]. 2009 [ />~rwilcox/].
60. R Development core Team: R: A Language and Environment for Statistical
Computing. Vienna, Austria: R Foundation for Statistical Computing; 2008.
61. SPSS Inc: SPSS Statistics, Rel. 17.0.1. Chicago: SPSS Inc; 2008.
62. Wilcox RR: Personal communication. 2009.
63. Conners CK: Conners Rating Scales-Revised: Technical Manual. North
Tonawanda, NY: Multi-Health Systems Inc; 2003.
64. Griffiths AJF, Wessler SR, Lewontin RC, Gelbart WM, Suzuki DT, Miller JH:
Introduction to Genetc Analyses. New York: Freeman;, 8 2005.
65. Gaub M, Carlson CL: Gender differences in ADHD: a meta-analysis and
critical review.[erratum appears in J Am Acad Child Adolesc Psychiatry
1997 Dec;36(12):1783]. Journal of the American Academy of Child &
Adolescent Psychiatry 1997, 36(8):1036-1045.
66. Hurtig T, Ebeling H, Taanila A, Miettunen J, Smalley SL, McGough JJ, Loo SK,
Jarvelin M-R, Moilanen IK: ADHD symptoms and subtypes: relationship
between childhood and adolescent symptoms. Journal of the American
Academy of Child & Adolescent Psychiatry 2007, 46(12):1605-1613.
67. Barkley RA, Murphy KR, Fischer M: ADHD in Adults: What the Science Tells
Us. New York: Guilford Press; 2008.
68. Lahey BB, Applegate B, McBurnett K, Biederman J, Greenhill L, Hynd GW,
Barkley RA, Newcorn J, Jensen P, Richters J, et al: DSM-IV field trials for
attention deficit hyperactivity disorder in children and adolescents.
American Journal of Psychiatry 1994, 151(11):1673-1685.
69. Biederman J, Faraone SV, Milberger S, Doyle A: Diagnoses of attention-
deficit hyperactivity disorder from parent reports predict diagnoses
based on teacher reports. Journal of the American Academy of Child &
Adolescent Psychiatry 1993, 32(2):315-317.
70. Hardy KK, Kollins SH, Murray DW, Riddle MA, Greenhill L, Cunningham C,
Abikoff HB, McCracken JT, Vitiello B, Davies M, et al: Factor structure of
parent- and teacher-rated attention-deficit/hyperactivity disorder
symptoms in the Preschoolers with Attention-Deficit/Hyperactivity
Disorder Treatment Study (PATS). Journal of Child & Adolescent
Psychopharmacology 2007, 17(5):621-634.
Pre-publication history
The pre-publication history for this paper can be accessed here:
/>doi:10.1186/1471-244X-11-54
Cite this article as: Müller et al.: The impact of study design and
diagnostic approach in a large multi-centre ADHD study. Part 1: ADHD
symptom patterns. BMC Psychiatry 2011 11:54.
Submit your next manuscript to BioMed Central
and take full advantage of:
• Convenient online submission
• Thorough peer review
• No space constraints or color figure charges
• Immediate publication on acceptance
• Inclusion in PubMed, CAS, Scopus and Google Scholar
• Research which is freely available for redistribution
Submit your manuscript at
www.biomedcentral.com/submit
Müller et al. BMC Psychiatry 2011, 11:54
/>Page 20 of 20