Báo cáo y học: " Risk of malnutrition is associated with mental health symptoms in community living elderly men and women: The Tromsø Study" pdf
Bạn đang xem bản rút gọn của tài liệu. Xem và tải ngay bản đầy đủ của tài liệu tại đây (281.37 KB, 8 trang )
RESEARCH ARTICLE Open Access
Risk of malnutrition is associated with mental
health symptoms in community living elderly
men and women: The Tromsø Study
Jan-Magnus Kvamme
1,2*
, Ole Grønli
3
, Jon Florholmen
2,4
and Bjarne K Jacobsen
1
Abstract
Background: Little research has been done on the rela tionship between malnutrition and mental health in
community living elderly individuals. In the present study, we aimed to assess the associations between mental
health (particularly anxiety and depression) and both the risk of malnutrition and body mass index (BMI, kg/m
2
)in
a large sample of elderly men and women from Tromsø, Norway.
Methods: In a cross-sectional survey, with 1558 men and 1553 women aged 65 to 87 years, the risk of
malnutrition was assessed by the Malnutrition Universal Screening Tool (’MUST’), and mental health was measured
by the Symptoms Check List 10 (SCL-10). BMI was categorised into six groups (< 20.0, 20.0-22.4, 22.5-24.9, 25.0-27.4,
27.5-29.9, ≥ 30.0 kg/m
2
).
Results: The risk of malnutrition (combining medium and high risk) was found in 5.6% of the men and 8.6% of the
women. Significant mental health symptoms were reported by 3.9% of the men and 9.1% of the women. In a
model adjusted for age, marital status, smoking and education, significant mental health symptoms (SCL-10 score
≥ 1.85) were positively associated with the risk of malnutrition (odds ratio 3.9 [95% CI 1.7-8.6] in men and 2.5 [95%
CI 1.3-4.9] in women), the association was positive also for subthreshold mental health symptoms. For individuals
with BMI < 20.0 the adjusted odds ratio for significant mental health symptoms was 2.0 [95% CI 1.0-4.0].
Conclusions: Impaired mental health was strongly associated with the risk of malnutrition in community living
elderly men and women and this association was also significant for subthreshold mental health symptoms.
Background
Mental health problems are among the most prevalent
conditions in elderly people. Anxiety and depression,
often seen as co-morbid conditions with overlapping
symptoms [1], are the two most frequent mental health
disorders [2]. Malnutrition is also relatively common in
elderly individuals and may be associate d with mental
health, particularly depression [3].
While several studies have found mental disorders t o
be a risk factor for involuntary weight loss/malnutri-
tion in geriatric inpatients and outpatients [4], little
population-based research has bee n done on the rela-
tionship between risk of malnutrition and mental
health in this age group. A study from Sweden found
depressive symptoms to predict malnutrition in com-
munity living elderly [5], whereas a German study of
nursing home residents found no significant difference
in the mean malnutrition score between residents with
and without depression [6]. Furthermore, studies of
the relationship between body mass index (BMI) and
depressive symptoms in elderly individuals have
yielded conflicting results. In a study from the US,
depression in men was found to be inversely associated
with body weight [7]. A later study of a multiethnic
elderly population found an increased risk of depres-
sion with increasing BMI, but the most adverse impact
of obesity on depression was found in African Ameri-
cans [8]. Neither of these studies examined t he lower
BMI categories i n more detail.
In the current study, we therefore aimed to investi-
gate the associations between mental health and both
the risk of malnutrition and BMI in a large sample of
* Correspondence:
1
Department of Community Medicine, Faculty of Health Sciences, University
of Tromsø, N-9037 Tromsø, Norway
Full list of author information is available at the end of the article
Kvamme et al. BMC Psychiatry 2011, 11:112
/>© 2011 Kvamme et al; licensee BioMed Central Ltd. This is an Open Access article distributed under the terms of the Creative
Commons Attribution License (http://creat ivecommons.org/licenses/by/2.0), which permits unrest ricted use, distribution, and
reproduction in any medium, provided the original work is properly cited.
community-living elderly men and women. We
hypothesised that there is a positive relationship
between impaired mental health and risk of malnutri-
tion and low BMI.
Methods
Study population
Bet ween October 2007 and December 2008, adult inha-
bitants of the community of Tromsø were invited to
participate in a health survey known as the Tromsø
Study. In the current analysis, we included data from
participants aged 65 to 87 years. All 6098 men and
women in this age group were invited, and 4017 (65.9%)
completed the survey. Height or weight was not mea-
sured in 21 persons and information about weight loss
that was required for the determination of malnutrition
was missing in 413 persons; in addition, 472 persons
omitted data related to smoking, education or mental
health symptoms. Therefore, 1558 men and 1553
women (51.0% of the invited individ uals) were included
intheanalysis.Themeanageoftheparticipants
included in the study sample was lower than that of the
non-attending persons, and the mean age was also lower
than that of the participants not included in the study
sample because of missing values. The BMI of the
included participants was not significantly different from
that of the non-included participants.
Each participant provided written informed consent,
andthesurveywasapprovedbytheRegionalBoardof
Research Ethics.
Measures
Nutritional screening tool and body mass index
The participants had their weight (kg) and height (cm)
measured to the near est decimal. During these measure-
ments, they were in light clothing and did not wear
shoes. BMI was calculated as the weight divided by the
square of height (kg/m
2
). In a self-administrated ques-
tionnaire, the participants were ask ed for any involun-
tary weight loss during the last six months (and if so,
weight loss in kg). Weight loss was grouped as follows:
below 5%, between 5% and 10% or above 10% of their
pre-weight-loss body weight.
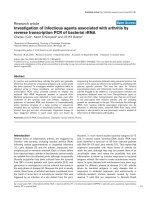
Based on the BMI and the extent of weight loss, each
subject was categorised into low, medium or high risk
of malnutritio n according to the Malnutrition Universal
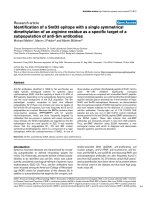
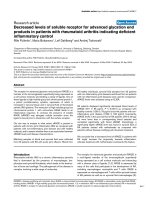
Screen ing Tool (’MUST’) (Figure 1). The ‘MUST’ tool is
the nutritional screening instrument recommended by
the European Society for Clinical Nutrition and Metabo-
lism (ESPEN) for use in the community [9]. Two other
nutritional screening tools have been recommended by
the ESPEN, the Nutrition Risk Screening 2002 (NRS
2002) and the Mini Nutritional Assessment (MNA).
NRS 2002 is mainly intended for use in hospitals. The
MNA is constructed to be used by heath care profes-
sionals and not for self-administration. Co nsequently,
the MNA is difficult to use in larger epidemiological
studies.
The ‘MUST’ tool was originally developed by the Brit-
ish Society of Parenteral and Enteral Nutrition http://
www.bapen.org.uk. It includes an acute disease
072+3,'&+5.+3, +)*+3,
!
(1#4+'/4+3#%54'-8+ #/&
4*'2'*#3$''/02+3-+,'-840
$'/0/542+4+0/#-+/4#,'(02
S
"
,).
$'3'
!*'#-/542+4+0/"/+6'23#- %2''/+/)!00-+32'120&5%'&*'2'7+4*4*',+/&1'2.+33+0/0(
2+4+3*330%+#4+0/(02#2'/4'2#-#/&/4'2#-542+4+0/02(524*'2+/(02.#4+0/0/" !#/&
.#/#)'.'/4)5+&'-+/'33''777$#1'/02)5,
Figure 1 The malnutrition universal screening tool (’MUST’) is composed of a BMI score, a weight-loss score and an acute illness
component. The risk of malnutrition can be assessed based on the sum of these scores.
Kvamme et al. BMC Psychiatry 2011, 11:112
/>Page 2 of 8
component with no nutritional intake for > 5 days,
which normally necessitates hospitalisation [10]. Because
participation in this study required the ability to inde-
pendently visit a research centre, the acute diseases
component was set to zero. The weight loss question
was slightly modified to state a time span of the “last 6
months” , but this encompasses the time span of “the
past 3-6 months”, as stated in the original ‘MUST’ too l.
In Tables 1 and 2, all three risk categories of malnutri-
tion are described, whereas the medium and high risk
categories are combined in the analyses in Figure 2.
BMI was divided into six categories in order to
include the World Health Organization definitions of
overweight (25.0-29.9 kg/m
2
)andobesity(≥ 30 kg/m
2
)
[11] in addition to the underweight category (< 20 kg/
m
2
) [9]. We further subdivided the categories between
20 kg/m
2
and 30 kg/m
2
to describe in more detail the
lower-normal weight (20.0-22.4 kg/m
2
,22.5-24.9kg/m
2
)
andoverweightindividuals (25.0-27.4 kg/m
2
, 27.5-29.9
kg/m
2
).
Assessment of mental health symptoms
Mental health status was assessed by the Hopkins Symp-
toms Check List-10 (SCL-10), which has been widely
used in epidemiological studies. The SCL-10 is a self-
administrated instrument that mainly explores
symptoms of anxie ty and depression [12]. The ten items
of the SCL-10 were p art of the questionnaire that was
included in the invitation to the survey. The question-
naire was completed by participants at home and
handed in at the study centre.
The SCL-10 questions explored the presence and
severity of the following ten symptoms during the pre-
ceding week: (1) “ Sudden fear without apparent reason”,
(2) “Afraid or worried”,(3)“Faintness or d izziness” ,(4)
“ Tense or upset” ,(5)“Easily blaming yourself “ ,(6)
“ Sleeplessness” ,(7)“ Depressed or sad” ,(8)“ Feeling
worthless” ,(9)“ Feelingthateverythingisastruggle” ,
and (10) “ Feeling hopelessness with regard to the
future”.
Each question was rated on a four-point scale ranging
from 1 (not at all) to 4 (extremely). Missing values were
replaced by the sample mean value for each item, but
questionnaires with three or more missing values were
excluded from the analyses. The average SCL-10 score
was calculated according to Strand et al [12] by dividing
the total score by the total number of items (score ran-
ging between 1.0 and 4.0). A higher score value indi-
cated more symptoms. We found an acceptable degree
of internal consistency for the scale in this sample
(Cronbach’s alpha 0.84).
Table 1 Baseline characteristics of participating elderly men and women, The Tromsø Study (2007-2008)
Men (n = 1558) Women (n = 1553) p-value
Age in years, Mean (SD) 71.2 (5.3) 72.0 (5.6) < 0.001
a
Currently married, % (n) 75.6 (1178) 51.4 (798) < 0.001
b
Lower education, % (n) 33.2 (517) 52.9 (822) < 0.001
b
Smoking, % (n)
Never smoked 24.4 (380) 47.8 (743) < 0.001
b
Previous smokers 60.6 (944) 38.2 (593)
Current smokers 15.0 (234) 14.0 (217)
Alcohol
d
more than once a month, % (n) 57.1 (878) 39.6 (605) < 0.005
b
BMI (kg/m
2
) Mean (SD) 27.0 (3.6) 27.0 (4.5) 0.69
a
Risk of malnutrition, % (n)
Low 94.3 (1470) 91.4 (1419) 0.005
b
Medium 3.5 (55) 5.5 (85)
High 2.1 (33) 3.2 (49)
SCL-10 score Median (interquartile range) 1.10 (1.00-1.30) 1.20 (1.07-1.44) < 0.001
c
SCL-10 score ≥ 1.85, % (n) 3.9 (61) 9.1 (142) < 0.001
b
a
t-test,
b
chi-square test,
c
Mann-Whitney U test,
d
n is 1538 men and 1526 women (alcohol).
Table 2 The SCL-10 score
a
according to risk categories of malnutrition in elderly men and women, The Tromsø Study
(2007-2008)
Men (n = 1558) Women (n = 1553)
Risk of malnutrition n SCL-10 score p-value
b
n SCL-10 score p-value
b
Low 1470 1.10 (1.0-1.30) 1419 1.20 (1.05-1.40)
Medium 55 1.13 (1.10-1.40) < 0.001 85 1.30 (1.10-1.65) < 0.001
High 33 1.36 (1.05-1.56) 49 1.40 (1.13-1.70)
a
Median (IQ range),
b
Kruskal Wallis test.
Kvamme et al. BMC Psychiatry 2011, 11:112
/>Page 3 of 8
The SCL-10 is an abbreviated version of the 25-item
Hopkins Symptoms Checklis t (SCL-25) [13], which has
been validated in different age categories, including
elderly individuals [14]. The SCL-25 was designed to
predict both anxiety and depression but was found to
predict depression better than anxiety disorders in a
population-based study [15]. The shorter SCL-10 ver-
sion correlated highly with the SCL-25 version (r =
0.97) in a population-based Norwegian study that also
included elderly individuals [12]. Depending on the cut-
off limits used, the literature indicates that 50-60% of
cases detected with these instruments are individuals
who actually qualify for a diagnosis of mental disorders
based on clinical interviews [12].
An SCL-10 score of 1.85 has been proposed as the
cut-off for predicting diagnosed mental disorders [12],
and score values of ≥ 1.85 in the current study were
referred to as significant symptoms. To assess the impact
of score values below this cut-off, we subdivided the
SCL-10 scores between 1.01 and 1.84 into a lower score
category (SCL-10 score 1.01 to 1.39) referred to as some
symptoms and a higher score category (SCL-10 score
1.40 to 1.84) referre d to as subthreshold symptoms.The
individuals with no symptoms (SCL-10 score 1.0) consti-
tuted the reference category (Figure 2).
Other variables
Information regarding age and marital status was
obtained from Sta tisti cs, Norway. Details regarding edu-
cational background, household income, smoking habits
and other disease variables were obtained from self-
administrated questionnaires. Household income was
dichotomised into above and below Norwegian Kroner
300 000. Lower education was defined as primary school
only. Alcohol use was relatively infrequent and was
dichotomised into drinking more than once a month
versus a lower consumption. Smoking habits were
divided into three catego ries (never, previous or current
smoking).
Data analysis
The SCL-10 score was analysed a s both a dichotomised
variable and a continuous variable. The score was posi-
tively skewed and we therefore reported the median
SCL-10 values with 25 - 75% interquartile (IQ) range in
Tables 1 and 2. The Mann Whitney U or Kruskal Wallis
test was used to test the differences in SCL-10 score
between the groups. Differences in baseline variables
between men and women were analysed using the Chi-
square test and t-test (Table 1). The associations
between the SCL-10 categories and the risk of malnutri-
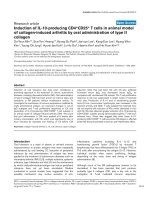
tion were analysed using logistic regression (Figure 2).
The SCL-10 category with no symptoms (1.0) was used
as reference. The odds r atio (OR) estimates were
adjusted for potential confounders (age, marital status,
smoking and education al level). The analysis of the rela-
tionship between the risk of malnutrition and the SCL-
10 score was stratified by gender. The Chi-square test
and logistic regression (tabl e 3) were used to analyse the
""
# "$"&
""
#'!$ #
#'!$ #
%$"# #'!$ #
$#'!$ #
#'!$ #
#'!$ #
%$"# #'!$ #
$#'!$ #
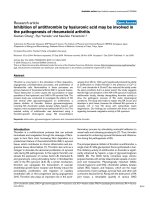
Figure 2 Odds ratio for the association between mental health problems (in four categories) and the risk of malnutrition (combining
medium and high risk) in 1558 elderly men and 1553 elderly women, The Tromsø Study.
a
Adjusted for age, smoking, marital status and
educational level.
Kvamme et al. BMC Psychiatry 2011, 11:112
/>Page 4 of 8
relationship between the six BMI categories and the
proportion of t he participants with an SCL-10 sco re ≥
1.85. In the regression analysis, the BMI category with
the highest number of part icipants was used as refer-
ence. Data from men and women were pooled in this
analysis due to the low expected numbers in some BMI
groups in sex-stratified analyses.
Two sided p-values < 0.05 were considered statistically
significant. The analyses were performed using SPSS sta-
tistical software version 17.0 (SPSS inc., Chicago, Illinois,
USA).
Results
Baseline characteristics of the 1558 men and 1553 women
included in the analyses are shown in Table 1. The mean
age was 71.2 years in men and 72.0 years in women. Com-
pared to men, women were more likely to be single and
have a lower level of education, and a smaller proportion
had a history of smoking. Mean BMI was 27.0 kg/m
2
in
both genders. Risk of malnutrition (combining medium
and high risk) was found in 7.1% (222/3112) of the partici-
pants, which included 5.6% (88/1558) of men and 8.6%
(134/1553) of women. The SCL-10 score was higher in
women (median 1.20) than in men (median 1.10) (p <
0.001) and was higher in persons aged ≥ 75 years old than
in persons aged 65 to 74 years old, which indicates more
symptoms of anxiety and depression in women and in the
oldest participants. Significant mental health problems
(SCL-10 score ≥ 1.85) were found in 3.9% (61/1558) of
men and 9.1% (142/1553) of women.
Mental health and the risk of malnutrition
The SCL-10 score was significantly associated with an
increased risk of malnutrition in both men and women
(Table 2). The results suggest a relatively stronger rela-
tionship between the risk of malnutrition and the med-
ian SCL-10 score in men than in women.
In men who were at risk of malnutrition (combining
medium and high risk), 11.4% (1 0/88) had significant
SCL-10 symptoms; the corresponding percentage in
women was 16.4% (22/134). In Figure 2, the strength of
the associations between the SCL-10 score categories
and t he risk of malnutrition is further explored using a
logistic regression analysis. In both men and women,
significant SCL-10 symptoms were strongly associated
with the risk of malnutrition; the odds ratio was 3.9
(95% CI 1.7-8.6) in men and 2.5 (95% CI 1.3-4.9) in
women. Also, for the subthreshold symptoms (SCL-10
score 1.40 to 1.84), a statisti cally significant association
with the risk of malnutrition was found. A test for linear
trends across the SCL-10 score categories was statisti-
cally significant for bo th genders (p < 0.001 in men and
p = 0.01 in women). However, the difference between
the genders with regard to the strength of the relation-
ship (Figure 2) was not statistically significant (p =0.4).
The odds ratio estimates were adjusted for age, marital
status, smoking habits and educational level. Individuals
reporting no SCL-10 symptoms (score 1) constituted the
reference category.
In three separate sets of analyses, we also adjust ed for
the impact of alcohol use (more or less frequent than
once a month), chronic somatic diseases (history of can-
cer, heart attack or stroke) or household economy.
However, none of these three variables had a significant
impact on the relationship between the SCL-10 score
and the risk of malnutrition (data not shown).
Mental health and BMI
We also assessed the relationship between various BMI
categories and the proportion of individuals (men and
women) with significant SCL-10 symptoms (SCL-10
score ≥ 1.85). The highest proportion with significant
SCL-10 symptoms ( 15.2%, 12/79) was found in partici-
pants with BMI < 20.0 kg/m
2
(Table 3). In obese partici-
pants (BMI ≥ 30.0 kg/m
2
) the corresponding proportion
was not significantly increased. A chi-square test for the
model was statistically significant (p = 0.03).
The strength of the associations between the BMI
categories and a SCL-10 score ≥ 1.85 is further explored
using a logistic regression analysis (Table 3). The multi-
variable adjusted odds ratio estimate for the lowest BMI
category (< 20.0 kg/m
2
) was 2.0 (95% CI 1.0-4.0) com-
pared to the reference category of BMI 25-27.4 kg/m
2
.
Discussion
In this study, we found that mental health symptoms
were strongly associated with the risk of malnutrition in
elderly individuals. Both the risk of malnutrition and
mental health symptoms were more prevalent in women
than in men. To our knowledge, this is the largest popu-
lation-based study that explored the relationship
Table 3 The proportion of subjects with SCL-10 score ≥
1.85 and odds ratio (95% confidence interval) for the
association between SCL-10 score ≥ 1.85 and BMI in
elderly men and women
b
, The Tromsø study (2007-2008)
BMI
categories
SCL-10 score ≥ 1.85
% (proportions)
OR (95% CI) for SCL-10 score ≥
1.85
Adjusted for
age and sex
Multivariable
adjusted
a
< 20.0 15.2 (12/79) 2.3 (1.1-4.5) 2.0 (1.0-4.0)
20.0-22.4 5.2 (16/308) 0.8 (0.4-1.4) 0.8 (0.4-1.4)
22.5-24.9 6.7 (42/631) 1.1 (0.7-1.8) 1.1 (0.7-1.7)
25.0-27.4 5.6 (45/803) 1.0 Reference 1.0 Reference
27.5-29.9 6.5 (42/646) 1.1 (0.7-1.8) 1.1 (0.7-1.7)
≥ 30.0 7.1 (46/644) 1.2 (0.8-1.8) 1.2 (0.8-1.9)
a
Adjusted for sex, age, educational level, marital status and smoking status,
b
n = 3111.
Kvamme et al. BMC Psychiatry 2011, 11:112
/>Page 5 of 8
between the risk of malnutrition and mental health in
elderly individuals.
Some previous studies in this a rea have utilised the
Geriatric Depression Scale(GDS)andtheMiniNutri-
tional Assessment (MNA) instrument for the assessment
of the relationship between depression and malnutrition.
A Swedish study of 579 community-living elderly people
found that depressive symptoms were p redictive of mal-
nutrition [5]; this was observed to a larger extent in
men than in women. The relationship between depres-
sionandmalnutritioninnursinghomeresidentswas
investigated in a G erman study, and no differences was
found in the mean MNA score between subjects who
had depression and those who did not. However, a mod-
est association was demonstrated between malnutrition
and depression in a regression analysis [ 6]. A study of
267 community-living elderly in Brazil [16] showed a
positive relationship between malnutrition and
depression.
We believe the ‘MUST’ tool used in the curren t study
has an advantage over the MNA with regards to the
associations explored. The MNA has been validated in a
number of studies of elderly individuals, but it includes
information about both neuropsychological problems
and psychological stress [17]. A positive correlation
between the MNA risk score and the symptoms of
depression could therefore be anticipated. The ‘MUST’
tool does not include any component that explores
mental health. This is the first study to use either the
‘MUST’ tool or the SCL-10 the assessment of the rela-
tionship between risk of malnutrition and mental health.
Increased risk of malnutrition (combining medium
and high risk) was found in 7.1% of the individuals in
the current sample. In previous studies of community-
living elderly individuals, prevalence rates for the risk of
malnu trition varied from 2.5% to 21% [18-21]. This var-
iation in prevalence may reflect the use of different cri-
teria both to define malnutrition and differences in
sample selections.
In accordance with former studies on adult and
elderly individuals, we found that women had more
mental health symptoms than men [22]. This gender
difference is not fully understood but may to some
extent be explained by an underreporting of depre ssive
symptoms by male individuals [23].
Mental health may be assessed by both a categorical
approach, which considers diagnoses that are based on a
distinct cut-off, and a dimensional approach, which con-
siders symptoms along a continuum. The latter
approach also takes into account subthreshold symp-
toms of anxiety and depression, which may also
adverselyaffectdailylife[24,25].Thepresentstudy
revealed statistically significant associations using both a
categorical and a more dimensional approach.
Somatic diseases, especially stroke, myocardial infarc-
tion and cancer, represent risk factors for depressive
symptoms in elderly individuals [26]. Somatic diseases
may also increase the risk of malnutrition [21]. How-
ever, adjusting for the history of t hese three i mportant
somatic diseases did not affect the conclusions of the
current study.
Individuals with BMI < 20.0 kg/m
2
had a two to three
times higher prevalence of significant mental health
symptoms (table 3) and the corresponding adjusted OR
was 2.0 and of b orderline significance (p = 0.06) (table
3). Obesity (BMI >30.0) was not associated with more
mental health symptoms. Previous st udies have reported
both a decreased [7] and an increased risk [8] of depres-
sion in obese e lderly individuals. However, the lower
BMI categories were not specifically examined in these
two studies.
The Tromsø study included participants from both
urban and rural areas although the majority live in the
city centre. Our results may not be generalised to all
other elderly po pulations as both living co nditions and
health care organisation differ between countries. How-
ever, we believe that it is likely that si milar relationships
are present in other sim ilar community living elderly
Western populations.
As discussed above, this study has several strengths as
well as some potential limitations. First, the SCL-10 cap-
turessymptomsofbothanxietyanddepression,
although depression is more influential in the relation-
ship with nutritional status. However, considerable over-
lap exists between anxiety and depression, which often
appear as co-morbid disorders [1,27].
Second, eating disorders were not assessed in this
study. In a recent review of eating d isorders in the
elderly, depression was described as the most important
co morbid condition. However, the prevalence of eating
disorders is low in the elderly population [28].
Third, the study sample that exhibited valid values for
theSCL-10-scoreandthe‘ MUST’ score represented
52% of the target population. Thus, selection bias may
be a concern. However, it is likely that the elderly men
and women who did not complete the survey or omitted
key information were frailer, more cognitive impaired
and more prone to both malnutrition and impaired
mental health than the persons who were included in
the study sample.
Fourth, by using 1.85 as the cut-o ff for t he SCL-10
score yielded significant mental health problems o f 4.2%
in men and 9.8% in women, which may be an underesti-
mation. In elderly people, the prevalence of major
depression is 1 to 4%, the prevalence o f minor depres-
sion is 4 to 13% [26] and the prevalence of anxiety is
3.2% to 14.2% [29]. The cut-off of 1.85 for th e SCL-10
score was adopted from previous studies that describe
Kvamme et al. BMC Psychiatry 2011, 11:112
/>Page 6 of 8
the SCL-10 [12] and has not been compared to clinical
diagnostic interviews in community-living elderly men
or women. However, the main purpose of the current
study was not to describe the prevalence of mental
health problems but to determine the relationship
between impaired mental health and nutritional status.
Fifth, there was no screening of cognitive decline in
this study. Mild cognitive impairment can be present a
long time before dementia is identified and this might
be associated with malnutrition and symptoms of anxi-
ety and depression. However, participants had to both
independently visit a research centre and accomplish a
detailed self administrated questionnaire. This reduces
the risk of cognitive impairment among participants
included in the study population.
The current study also demonstrated a significant
association between subthreshold mental health symp-
toms and the risk of malnutrition. Several reports have
described other adverse health effects that are related to
subthreshold mental health symptoms in elderly indivi-
duals [30,31]. The cut-off for the SCL-10 used in the
current study identified 13.6% of men and 22.4% of
women with subthreshold symptoms. This corresponds
well with the 20.2% of older women identified with sub-
threshold depression in a recent study that used the
Center for Epidemiological Studies Scale for Depressio n
(CES-D) [32].
The cross-sectional design hampers conclusions about
the directionality of the associations. The most impor-
tant is probably the influence of depression on appetite
and food intake. This can lead to weight loss and
increase the risk of malnutrition. In the Diagnostic and
Statistical Manual of Mental Disorders [33], both weight
gain and weight loss are among the diagnostic criteria
for depression. In contrast, malnutrition may also be
associated with micronutrient deficiencies that adversel y
affect mental health. Inadequate intake of nutrients and
energy may lead to deficiency of folic acid, thiamine or
cobalamin [34] which mightworsenmentalhealth
symptoms. A recent study that evaluated the impact of
weight change alone in elderly people found that weight
loss predicted an increase in depressive symptoms [35].
Hence, a bidirection al relationship be tween the risk of
malnutrition and mental health symptoms may be pre-
sent and result in a vicious circle over time in affected
individuals.
Conclusions
Impaired mental health was strongly associated with
the risk of malnutrition in community living elderly
men and women and this association was also signifi-
cant for subthreshold mental health symptoms. For
the clinical practitioner, our results on the one hand
highlight the need for nutritional screening of elderly
people presenting with mental health symptoms. Both
in somatic and psychiatric settings, nutrition have
often been neglected [3,36]. Screening for malnutri-
tion can easily be performed by the use of instruments
like the ‘ MUST’ tool. On the other hand, mental
health symptoms should also be included in the
assessment of elderly people who are at risk of
malnutrition.
Conflict of interests
The authors declare that they have no conflicts of
interests.
Abbreviations
BMI: Body Mass Index; IQ: interquartile; MUST: Malnutrition Universal
Screening Tool; OR: odds ratio; SCL-10: Symptoms Check List 10.
Acknowledgements
The present study was supported by a grant from the Northern Norway
Regional Health Authority (Centre for Research of the Elderly). The Tromsø 6
study was conducted by The University of Tromsø, Department of
Community Medicine.
Author details
1
Department of Community Medicine, Faculty of Health Sciences, University
of Tromsø, N-9037 Tromsø, Norway.
2
Department of Gastroenterology,
University Hospital North Norway, N-9037 Tromsø, Norway.
3
Department of
Geriatric Psychiatry, University Hospital North Norway, N-9037 Tromsø,
Norway.
4
Laboratory of Gastroenterology and Nutrition, Institute of Clinical
Medicine, University of Tromsø, N-9037 Tromsø, Norway.
Authors’ contributions
JMK, JF, OG and BKJ were responsible for the initial design of the study. JMK
did the analyses and wrote the first draft of the paper. BKJ contributed to
the analyses, interpretation of the results and the review of the drafts. All
authors contributed to the interpretation of the data and review of the
manuscript for important intellectual content. All authors read and approved
the final manuscript.
Received: 28 January 2011 Accepted: 17 July 2011
Published: 17 July 2011
References
1. Lowe B, Spitzer RL, Williams JB, Mussell M, Schellberg D, Kroenke K:
Depression, anxiety and somatization in primary care: syndrome overlap
and functional impairment. Gen Hosp Psychiatry 2008, 30:191-199.
2. Djernes JK: Prevalence and predictors of depression in populations of
elderly: a review. Acta Psychiatr Scand 2006, 113:372-387.
3. Bhat RS, Chiu E, Jeste DV: Nutrition and geriatric psychiatry: a neglected
field. Curr Opin Psychiatry 2005, 18:609-614.
4. Wallace JI: Malnutrition and Enteral/Parenteral Alimentation. In Hazzard’s
Geriatric Medicine and Gerontology Six edition. Edited by: Halter JBea. New
York: McGrawHill; 2009:469-481.
5. Johansson Y, Bachrach-Lindström M, Carstensen J, Ek AC: Malnutrition in a
home-living older population: prevalence, incidence and risk factors. A
prospective study. J Clin Nurs 2009, 18:1354-1364.
6. Smoliner C, Norman K, Wagner KH, Hartig W, Lochs H, Pirlich M:
Malnutrition and depression in the institutionalised elderly. Br J Nutr
2009, 102:1663-1667.
7. Palinkas LA, Wingard DL, Barrett-Connor E: Depressive symptoms in
overweight and obese older adults: a test of the “jolly fat” hypothesis. J
Psychosom Res 1996, 40:59-66.
8. Sachs-Ericsson N, Burns AB, Gordon KH, Eckel LA, Wonderlich SA,
Crosby RD, Blazer DG: Body mass index and depressive symptoms in
older adults: the moderating roles of race, sex, and socioeconomic
status. Am J Geriatr Psychiatry 2007, 15:815-825.
Kvamme et al. BMC Psychiatry 2011, 11:112
/>Page 7 of 8
9. Kondrup J, Allison SP, Elia M, Vellas B, Plauth M: ESPEN guidelines for
nutrition screening 2002. Clin Nutr 2003, 22:415-421.
10. Elia M: The “MUST” Report Nutritional screening of adults: a multidisciplinary
responsibility Malnutrition Advisory Group/The British Association for
Parenteral and Enteral Nutrition; Worcs, UK; 2003.
11. Obesity: preventing and managing the global epidemic. consultation.
World Health Organization Technical Report Series; 2000, 894.
12. Strand BH, Dalgard OS, Tambs K, Rognerud M: Measuring the mental
health status of the Norwegian population: a comparison of the
instruments SCL-25, SCL-10, SCL-5 and MHI-5 (SF-36). Nord J Psychiatry
2003, 57:113-118.
13. Hesbacher PT, Rickels K, Morris RJ, Newman H, Rosenfeld H: Psychiatric
illness in family practice. J Clin Psychiatry 1980, 41:6-10.
14. Fröjdh K, Håkansson A, Karlsson I: The Hopkins Symptom Checklist-25 is a
sensitive case-finder of clinically important depressive states in elderly
people in primary care. Int J Geriatr Psychiatry 2004, 19:386-390.
15. Sandanger I, Moum T, Ingebrigtsen G, Dalgard OS, Sorensen T,
Bruusgaard D: Concordance between symptom screening and diagnostic
procedure: the Hopkins Symptom Checklist-25 and the Composite
International Diagnostic Interview I. Soc Psychiatry Psychiatr Epidemiol
1998, 33:345-354.
16. Cabrera MA, Mesas AE, Garcia AR, de Andrade SM: Malnutrition and
depression among community-dwelling elderly people. J Am Med Dir
Assoc 2007, 8:582-584.
17. Guigoz Y, Vellas B, Garry PJ: Assessing the nutritional status of the elderly:
the Mini Nutritional Assessment as part of the geriatric evaluation. Nutr
Rev 1996, 54:S59-S65.
18. Margetts BM, Thompson RL, Elia M, Jackson AA: Prevalence of risk of
undernutrition is associated with poor health status in older people in
the UK. Eur J Clin Nutr 2003, 57:69-74.
19. Mowe M, Bohmer T, Kindt E: Reduced nutritional status in an elderly
population (> 70 y) is probable before disease and possibly contributes
to the development of disease. Am J Clin Nutr 1994, 59:317-324.
20. Beck AM, Ovesen L, Osler M: The ‘Mini Nutritional Assessment’(MNA) and
the ‘Determine Your Nutritional Health’Checklist (NSI Checklist) as
predictors of morbidity and mortality in an elderly Danish population. Br
J Nutr 1999, 81:31-36.
21. Stratton RJ, Green CJ, Elia M: Disease-related Malnutrition: an evidence-
based approach to treatment.Edited by: Stratton RJ, Green CJ, Elia M.
Anonymous Oxon: CABI Publishing; 2003:93-155.
22. Cole MG, Dendukuri N: Risk factors for depression among elderly
community subjects: a systematic review and meta-analysis. Am J
Psychiatry 2003, 160:1147-1156.
23. Koenig HG, Blazer DG: Mood Disorders. In Essentials of Geriatric Psychiatry
First edition. Edited by: Blazer DG, Steffens DC, Busse EW. Arlington:
American Psychiatric Publishing; 2007:145-173.
24. Vink D, Aartsen MJ, Schoevers RA: Risk factors for anxiety and depression
in the elderly: a review. J Affect Disord 2008, 106:29-44.
25. Goldberg D: Plato versus Aristotle: categorical and dimensional models
for common mental disorders. Compr Psychiatry 2000, 41:8-13.
26. Alexopoulos GS: Depression in the elderly. The Lancet 2005,
365:1961-1970.
27. Kvaal K, McDougall FA, Brayne C, Matthews FE, Dewey ME, CFAS M: Co-
occurrence of anxiety and depressive disorders in a community sample
of older people: results from the MRC CFAS (Medical Research Council
Cognitive Function and Ageing Study). Int J Geriatr Psychiatry 2008,
23:229-237.
28. Lapid MI, Prom MC, Burton MC, McAlpine DE, Sutor B, Rummans TA: Eating
disorders in the elderly. International Psychogeriatrics 2010, 22:523-536.
29. Wolitzky-Taylor KB, Castriotta N, Lenze EJ, Stanley MA, Craske MG: Anxiety
disorders in older adults: a comprehensive review. Depress Anxiety 2010,
27:190-211.
30. Hybels CF, Blazer DG, Pieper CF: Toward a threshold for subthreshold
depression. Gerontologist 2001, 41:357-365.
31. Lyness JM, Kim JH, Tang W, Tu X, Conwell Y, King DA, Caine ED: The
clinical significance of subsyndromal depression in older primary care
patients. American Journal of Geriatric Psych 2007, 15:214-223.
32. Vahia IV, Meeks TW, Thompson WK, Depp CA, Zisook S, Allison M, Judd LL,
Jeste DV: Subthreshold depression and successful aging in older women.
American Journal of Geriatric Psych 2010, 18:212-220.
33. American Psychiatric Association: Diagnostic and Statistical Manual of Mental
disorders. 4 edition. Washington, DC: American Psychiatric Publishing; 2000,
DSM-IV-TR, (text revision).
34. Harris D, Haboubi N: Malnutrition screening in the elderly population. JR
Soc Med 2005, 98:411-414.
35. Koster A, van Gool CH, Kempen GI, Penninx BW, Lee JS, Rubin SM,
Tylavsky FA, Yaffe K, Newman AB, Harris TB, Pahor M, Ayonayon HN, van
Eijk JT, Kritchevsky SB, Health ABC Study: Late-life depressed mood and
weight change contribute to the risk of each other. Am J Geriatr
Psychiatry 2010, 18:236-244.
36. Mowe M, Bosaeus I, Rasmussen HH, Kondrup J, Unosson M, Irtun O:
Nutritional routines and attitudes among doctors and nurses in
Scandinavia: a questionnaire based survey. Clin Nutr 2006,
25:524-532.
Pre-publication history
The pre-publication history for this paper can be accessed here:
/>doi:10.1186/1471-244X-11-112
Cite this article as: Kvamme et al.: Risk of malnutrition is associated
with mental health symptoms in community living elderly men and
women: The Tromsø Study. BMC Psychiatry 2011 11:112.
Submit your next manuscript to BioMed Central
and take full advantage of:
• Convenient online submission
• Thorough peer review
• No space constraints or color figure charges
• Immediate publication on acceptance
• Inclusion in PubMed, CAS, Scopus and Google Scholar
• Research which is freely available for redistribution
Submit your manuscript at
www.biomedcentral.com/submit
Kvamme et al. BMC Psychiatry 2011, 11:112
/>Page 8 of 8