báo cáo khoa học: " Exploring the black box of quality improvement collaboratives: modelling relations between conditions, applied changes and outcomes" doc
Bạn đang xem bản rút gọn của tài liệu. Xem và tải ngay bản đầy đủ của tài liệu tại đây (645.51 KB, 12 trang )
BioMed Central
Page 1 of 12
(page number not for citation purposes)
Implementation Science
Open Access
Research article
Exploring the black box of quality improvement collaboratives:
modelling relations between conditions, applied changes and
outcomes
Michel LA Dückers*
1
, Peter Spreeuwenberg
1
, Cordula Wagner
1,2
and
Peter P Groenewegen
1,3
Address:
1
NIVEL - Netherlands Institute for Health Services Research, Utrecht, the Netherlands,
2
EMGO Institute for Health and Care Research,
Free University Medical Centre, Amsterdam, the Netherlands and
3
Department of Sociology, Department of Human Geography, Utrecht
University, Utrecht, the Netherlands
Email: Michel LA Dückers* - ; Peter Spreeuwenberg - ; Cordula Wagner - ;
Peter P Groenewegen -
* Corresponding author
Abstract
Introduction: Despite the popularity of quality improvement collaboratives (QICs) in different
healthcare settings, relatively little is known about the implementation process. The objective of
the current study is to learn more about relations between relevant conditions for successful
implementation of QICs, applied changes, perceived successes, and actual outcomes.
Methods: Twenty-four Dutch hospitals participated in a dissemination programme based on
QICs. A questionnaire was sent to 237 leaders of teams who joined 18 different QICs to measure
changes in working methods and activities, overall perceived success, team organisation, and
supportive conditions. Actual outcomes were extracted from a database with team performance
indicator data. Multi-level analyses were conducted to test a number of hypothesised relations
within the cross-classified hierarchical structure in which teams are nested within QICs and
hospitals.
Results: Organisational and external change agent support is related positively to the number of
changed working methods and activities that, if increased, lead to higher perceived success and
indicator outcomes scores. Direct and indirect positive relations between conditions and
perceived success could be confirmed. Relations between conditions and actual outcomes are
weak. Multi-level analyses reveal significant differences in organisational support between hospitals.
The relation between perceived successes and actual outcomes is present at QIC level but not at
team level.
Discussion: Several of the expected relations between conditions, applied changes and outcomes,
and perceived successes could be verified. However, because QICs vary in topic, approach,
complexity, and promised advantages, further research is required: first, to understand why some
QIC innovations fit better within the context of the units where they are implemented; second, to
assess the influence of perceived success and actual outcomes on the further dissemination of
projects over new patient groups.
Published: 17 November 2009
Implementation Science 2009, 4:74 doi:10.1186/1748-5908-4-74
Received: 28 January 2009
Accepted: 17 November 2009
This article is available from: />© 2009 Dückers et al; licensee BioMed Central Ltd.
This is an Open Access article distributed under the terms of the Creative Commons Attribution License ( />),
which permits unrestricted use, distribution, and reproduction in any medium, provided the original work is properly cited.
Implementation Science 2009, 4:74 />Page 2 of 12
(page number not for citation purposes)
Background
In the last decade, many countries have initiated quality
improvement collaboratives (QICs) in healthcare settings.
QICs bring together 'groups of practitioners from different
healthcare organisations to work in a structured way to
improve one aspect of the quality of their service. It
involves them in a series of meetings to learn about best
practices in the area chosen, about quality methods and
change ideas, and to share experiences of making changes
in their own local setting' [1]. Another important feature
of collaboratives is the use of continuous quality improve-
ment methods to realise changes. Continuous quality
improvement is a proactive philosophy of quality man-
agement featuring multi-disciplinary teamwork, team
empowerment, an iterative approach to problem solving,
and ongoing measurement [2,3]. QICs are presented as
'arguably the healthcare delivery industry's most impor-
tant response to quality and safety gaps', representing sub-
stantial investments of time, effort, and funding [4].
Nevertheless, the problem is that despite its popularity,
the evidence for QIC effectiveness is positive but limited
[3-5]. Effects cannot be predicted with great certainty [6].
Therefore researchers urge for more investigation into the
different types of QICs and their effectiveness, as well as
linking QIC practices explicitly to organisational and
change management theory [1,4,7-9]. Or, as stated by Cre-
tin et al., it is important to open the 'black box' of QIC
implementation [3].
The current study intends to contribute to a better under-
standing of the processes and outcomes of QIC imple-
mentation in the context of a change programme for 24
Dutch hospitals based on 18 QICs. This programme a
multi-level quality collaborative is aimed at organisa-
tional development and the dissemination of healthcare
innovations [10]. It is the third pillar of 'Better Faster', a
programme embedded in a broader national policy mix
involving an increase in managed competition and trans-
parency, a new reimbursement system based on standard-
ised output pricing, and an intensified role for public
actors (like the Healthcare Inspectorate), patient repre-
sentatives, and healthcare insurers in monitoring the
quality and safety of care (see Appendix 1) [10-14]. The
multi-level quality collaborative is based on the imple-
mentation of different breakthrough collaboratives in the
areas of patient safety and logistics. The patient safety tar-
gets involve pressure ulcers, medication safety, and post-
operative wound infections. Logistics teams deal with
operating theatre productivity, throughput times, length
of in-hospital stay, and access time for outpatient appoint-
ments (for details see Table 1).
Table 1: Breakthrough collaboratives and external change agents within Better Faster pillar 3
Quality area Breakthrough project Programme targets Planned year-one projects per
hospital
Patient logistics WWW: working without waiting lists Access time for out-patient appointments 2
OT: operating theatre Increasing the productivity of operating
theatres by 30%
1
PRD: process redesign Decreasing the total duration of diagnostics
and treatment by 40 to 90%, reducing
length of in-hospital stay by 30%
2
Patient safety MS: medication safety
PU: pressure ulcers
Decreasing the number of medication
errors by 50%
The percentage of pressure ulcers is lower
than 5%
2
2
POWI: postoperative wound infections Decreasing postoperative wound infections
by 50%
1
Programme hospitals participated for two years in Better Faster pillar 3 (Table 1). During the first year, multi-disciplinary teams in each hospital
implemented the following projects that were to be disseminated further in the following year and afterwards [34].
Overview of the breakthrough projects: targets and planned number per hospital in two years
As well as having organisational support provided by the hospitals, each collaborative was organised and facilitated by a small team of external
change agents: experts and advisors responsible for the general contents of the projects carried out by the teams in the hospitals. While the multi-
level quality collaborative was in its preparation phase, the external change agents served as developers. Their task was to translate promising
change ideas into a more or less generally applicable improvement concept, meeting the prerequisites for successful adoption (e.g., perceived
advantage, low complexity, compatibility [15]). They combined a rapid cycle improvement model with a series of recommended topic related
interventions plus performance indicators to monitor progress. Improvement concepts and best practices were transferred at several team training
meetings. The teams were trained to apply breakthrough methods, requiring the application of plan-do-study-act improvement cycles and the
answering of three questions: 'What are we trying to accomplish?' 'How will we know that a change is an improvement?' and 'What change can we
make that will result in an improvement?'[41,42] The one- or two-day training meetings took place at central locations in the county. The agendas
contained presentations about background information on the project, team instruction sessions and group assignments, and guest speakers with
knowledge about the topic or best practice experience as well as plenary discussion. On average, a delegation of four team members visited four
QIC meetings [34].
Implementation Science 2009, 4:74 />Page 3 of 12
(page number not for citation purposes)
Study objective
This study aims to answer two questions: to what extent
do expected relationships between conditions, applied
changes, and outcomes of QIC-implementation exist; and
can differences in conditions and outcomes be explained
by the fact that the teams belong to different QICs and
hospitals?
Conceptual framework
This study focuses on relations between relevant condi-
tions for successful QIC implementation, on changes in
working methods and activities, and on patient-related
outcomes. In opposite order, the outcomes involve per-
ceived project successes and actual progress made in the
area of patient safety and logistics. Changes in working
methods and activities have to do with all the new or
intensified efforts taken by the teams on behalf of their
project. The literature on the implementation and dissem-
ination of innovations in health service organisations
contains many descriptions of success conditions, linked
to the tasks and responsibilities of the actors involved in
QIC efforts [15,16]. An important assumption behind
QICs as an improvement and spread tool [1] is that
knowledge about best practice is made available to teams
by external change agents. The teams implement this in
their own hospital setting. For this reason, three categories
of conditions can be recognised: the organisation of the
multi-disciplinary teams that join a QIC and transform
the knowledge into action (to avoid confusion, in this
study team organisation and teamwork have the same
meaning); the degree of support these teams receive from
their hospital organisation; and the support given by the
external consultants/change agents who facilitate the QIC
and its meetings [17].
Team organisation
This affects the teams joining a QIC. Cohen and Bailey
defined a team as 'a collection of individuals who are
interdependent in their tasks, who share responsibility for
outcomes, who see themselves and who are seen by others
as an intact social entity embedded in one or more larger
social systems (e.g., business unit or corporation), and
who manage their relationships across organisational
boundaries' [18]. There is a general consensus in the liter-
ature that a team consists of at least two individuals who
have specific roles, perform interdependent tasks, are
adaptable, and share a common goal [19]. To increase
team effectiveness, it is important to establish timely,
open, and accurate communication among team mem-
bers [20]. The notion that QIC teams are responsible and
in charge of project progress [1] is in line with the litera-
ture suggesting that operational decision-making during
implementation processes should be devolved to teams
[21].
Organisational support
Other imperatives for team success are strong organisa-
tional support and integration with organisational key
values [22]. Within QICs, organisational support has to
do with the leadership, support, and active involvement
by top management [21,23,24]. Regular contact is needed
between team and hospital leaders, and the innovation
must match the goals of the management [24]. Øvretveit
et al. state that topics should be of strategic importance to
the organisation [1]. In addition to the presence of neces-
sary means and instruments [25], many of the internal
support tasks are to be executed by the strategic manage-
ment. Executives have to communicate a vision or key val-
ues throughout the organisation [26,27], and must
stimulate the organisation's and employees' willingness
to change [28]. These tasks fall within the priority setting
areas defined by Reeleeder et al.: namely, foster vision, cre-
ate alignment, develop relationships, live values, and
establish processes [29].
External change agent support
The involvement of external change agents, arranging
group meetings for teams of different organisations, is a
typical QIC feature. In Table 1, the role of the external
change agents within the larger programme is described.
Their efforts should contribute to the empowerment and
motivation of teams to implement new working methods
in order to alter a quality aspect of their care delivery.
Team training is a success factor for team-based imple-
mentation [22], and can be more effective than individual
training, especially when the learning is about a complex
technology [30]. External change agents should provide
teams with an applicable model together with appealing
performance expectations [31]. This implies and requires
a gap between a desirable and an actual situation, as well
as outlining the potential added value of the innovation
to the teams [1]. A second prerequisite is that teams join-
ing the QIC need to gain information and skills that are
new to them, otherwise an important argument for join-
ing the QIC is void.
Hypotheses
In an earlier study, a questionnaire was developed and
validated to measure the extent to which these conditions
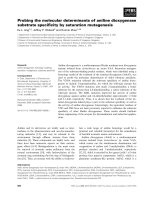
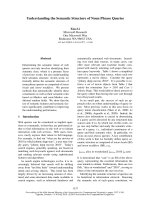
are met [17]. In this article, a model will be tested based
on a number of hypotheses that affect the relation
between conditions, team-initiated changes due to QIC
participation, and two outcome measures (Figure 1).
In the literature, a positive relation is suggested between
the presence of these conditions and successful imple-
mentation of change [15,16,24]. Successful implementa-
tion means that teams manage to adopt new working
methods or to alter existing practices. The 18 QICs within
Implementation Science 2009, 4:74 />Page 4 of 12
(page number not for citation purposes)
the multi-level quality collaborative were aimed at achiev-
ing specific targets in the area of patient safety and patient
logistics. The implementation of the new working meth-
ods and improvement concepts was to be advocated and
supported by the external change agents of the QICs. Pro-
gramme hospitals were expected to provide the necessary
internal support. The teams, moreover, were made
responsible for the progress of the implementation in
their own local hospital setting. Based on the literature
and the tasks and responsibilities of actors within the pro-
gramme in which the QICs are implemented, two hypoth-
eses can be formulated:
Hypothesis A: organisational support, team organisation
and external support have a positive effect on the number
of applied changes by teams.
Hypothesis B: the number of applied changes has a posi-
tive effect on perceived and actual outcomes.
Both hypotheses imply a causal relation. In other
instances, it is more difficult to determine the direction of
an effect. This applies to hypotheses C and D. Because (A)
the number of applied changes is hypothesised to be
influenced by the presence of the right conditions and (B)
an increase in the number of applied changes has a posi-
tive effect on the outcomes, it is logical that (C) the pres-
ence of the conditions is expected to be positively related
to the outcomes of the implementation:
Hypothesis C: a positive relation exists between condi-
tions and outcomes.
A final assumption has to do with the relation between
perceived and actual project outcomes. If an outcome
indicator shows that a project's main topic is improved, a
project leader is more likely to be positive about the suc-
cess of the project. Or conversely, if the team leader has a
tendency to think more positively about the result, this
may have influenced his or her behaviour in such a way
that it actually contributed to a higher level of improve-
ment.
Hypothesis D: a positive relation exists between perceived
and actual outcomes.
Methods
Study population
The total study population consists of 168 teams from 24
hospitals and 18 QICs. Project teams from three hospital
groups started, one group after the other, in October
2004, October 2005, and October 2006, with the imple-
mentation of the six types of QIC projects as described in
Table 1.
Data sources and variables
Two data sources were accessed to gain information on six
variables that were used for the purpose of statistical mod-
elling. The QIC team leaders served as a first data source.
In January 2006, 2007, and 2008, the team leaders
received a questionnaire at the end of the first year of
implementation and were asked to rate the overall success
of their project on a scale from zero (min) to ten (max).
Other questions reflected relevant conditions for success-
ful implementation. Principal component analysis
showed that several of the items measured with the ques-
tionnaire (on a seven-point scale) cluster together into
three constructs, resembling the categories described in
the introduction: organisational support, team organisa-
tion, and external change agent support (for information
Study model: hypothesised relations between conditions, applied changes and outcomesFigure 1
Study model: hypothesised relations between conditions, applied changes and outcomes.
Implementation Science 2009, 4:74 />Page 5 of 12
(page number not for citation purposes)
on the items see the notes under Table 2). Scale reliability,
internal item consistency, and divergent validity were sat-
isfactory [17]. To measure the number of applied changes,
eight activities, relevant for achievement of the project
goal, were selected for each QIC from the QIC instruction
manuals. Team leaders could mark one out of four
options this is something: we do not do, we have already
done, we have intensified/improved since the start of the
project, or completely new. For each team, the number of
applied changes (intensified/improved or new since the
project began) was counted. The applied change rate
ranges from zero (no change) to eight (high number of
changes).
Each QIC served a particular purpose. The external change
agents translated project targets into measurable indica-
tors, and teams had to deliver monitoring data to a central
database. In this study, these monitoring data were used
to model the actual success of the teams. An agreement
was made with the organisation funding the programme
(as well as the independent evaluation, of which the cur-
rent study is a part) that the data collection burden for
participating hospital staff was to be minimised. There-
fore, the central database was the sole source for team per-
formance indicators. Spreadsheet files with team
monitoring data were provided three times by the change
agency approximately six months after the end of the first
implementation year (April to June 2006, 2007, and
2008). These data were used in the analyses that are
described later. Project indicators were: prevalence of
pressure ulcers (pressure ulcers), prevalence of wound
infections (postoperative wound infections), access time
for outpatient appointments in days (waiting lists),
throughput time for diagnostics and treatment in days
(process redesign), and percentage of allocated time actu-
ally used (operating theatre productivity). Three types of
medication-safety projects had their own indicators: per-
centage of unnecessary blood transfusions, intravenous
antibiotics, or patients with a pain score above four. Med-
ication-safety scores were calculated using the first and last
20 patients treated. Pressure ulcers, operating theatre pro-
ductivity, and waiting-list project results were based on
the change between the scores of the first and last two
months. In the case of process redesign and postoperative
wound infections, the project period was compared to an
identical period in the past.
The change percentages in this study were converted into
a three-point scale: (1) at least 10% worse than before, (2)
neutral, and (3) improved by at least 10%. Compared to
goals such as 30%, 40 to 90% and 50% improvement
(Table 1), 10% improvement seems modest. However,
several evaluations revealed that even 10% is unrealistic
for some teams, making a higher threshold too strict
[32,33]. A lower threshold is not an option either, because
then the improvement is no longer substantial. It is
known from research that an average improvement rate of
10% is common [34], particularly if the improvement
strategy e.g., breakthrough is based on feedback [35].
Analyses
Multi-level regression analyses were conducted to answer
the research questions. The main argument behind multi-
level modelling is that social processes often take place
within a layered structure. The assumption that data struc-
tures are purely hierarchical, however, is often an over-
simplification. Entities, such as people or teams, may
belong to more than one grouping, and each grouping can
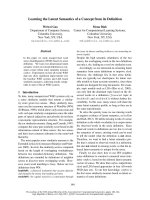
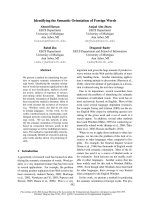
be a source of variation. Each team in the current study
belongs to one of the 18 QICs and to one of the 24 pro-
gramme hospitals. For that reason, a cross-classified
multi-level model is the most accurate model to study the
hypothesised relations between conditions, applied
changes and outcomes (Figure 2).
Table 2: The means, medians, inter-quartile ranges (IQR) and ranges of the six variables
Variable name: N Mean Median IQR Min-Max
External change agent support
1
168 4.56 4.65 1.46 1.50-6.75
Team organisation
2
168 5.27 5.40 1.20 1.60-7.00
Organisational support
3
168 4.60 4.78 1.75 1.40-7.00
Number of applied changes 159 3.73 4.00 2.00 0.00-8.00
Perceived success (overall judgement project leader) 137 6.69 7.00 2.00 1.00-9.00
Actual success (performance indicator) 103 2.28 3.00 2.00 1.00-3.00
1
Items: at collaborative meetings I always gain valuable insights, and external change agents a) provide sufficient support and instruments; b) raise
high expectations about performance and improvement potential; c) make clear from the beginning what the goal of the project is and the best way
to achieve it; Cronbach's alpha: 0.77.
2
Items: good communication and coordination, clear division of tasks, everyone is doing what he or she should do, team is responsible and in
charge of implementation; Cronbach's alpha: 0.84.
3
Items: project is important to strategic management, strategic management supports project actively, hospital gives support needed in the
department(s) to make the project a success, board does everything in its power to increase the willingness to change and pays attention to the
activities of the project team; Cronbach's alpha: 0.91.
Implementation Science 2009, 4:74 />Page 6 of 12
(page number not for citation purposes)
The variance can be separated into three parts: one due to
differences between teams (level one), one due to differ-
ences between QICs (level two), and one due to differ-
ences between hospitals (level three). In the model, the
hypotheses were tested in a three-level cross-classified
structure as depicted in Figure 2. Intercept variances of all
variables were estimated at all three levels. Correlations
between the variables were estimated at level one to begin
with (given the relatively limited sample size), and at
higher levels if the variables belonging to the relations in
Figure 1 differed between QICs or hospitals. Five fixed
effects were included in the model to test the relation
between conditions and applied changes (hypothesis A)
and between applied changes and outcomes (hypothesis
B).
All analyses were performed using MLwiN software ver-
sion 2.02. Estimation method was iterated generalised
least squares (IGLS) [36].
Results
A total of 168 team leaders, belonging to 23 hospitals
(one hospital refused to participate) and 18 QICs, filled
out the questionnaire (71% response rate). Table 2 con-
tains the means, medians, inter-quartile ranges and ranges
of the three conditions, the number of applied changes,
perceived success, and actual outcome. The number of
changed activities was known of 95% of the responding
teams (n = 159), overall grades (perceived success) are
available with regard to 82% of the teams (n = 137), and
61% of the teams were capable and willing to deliver
enough monitoring data to calculate a before and after
measurement (actual outcome) (n = 103). Indicator data
were available of 94% of the operating theatre productiv-
ity teams, 82% of the pressure ulcer teams, 78% of the
waiting list teams, 50% of the wound infection teams,
41% of the medication safety teams, and 36% of the proc-
ess redesign teams.
Team activities and actual outcomes per project type
The information presented in Table 3 serves as back-
ground material. The table shows the number of teams
who changed their activities after the project had begun
and the average number of applied changes per project
type. Pressure ulcer teams mainly applied regular change
of patient position (68%) and performed a risk assess-
ment (64%). Medication safety interventions predomi-
nantly reflect the three sub-topics the teams dealt with:
postoperative pain, blood transfusions, and intravenous
antibiotics (29 to 38%). Operating theatre teams focused
on starting on time (61%). Wound infection teams
reduced the number of door movements and the number
of individuals in the operating theatre (89%). They also
paid attention to a protocol for optimal administering of
antibiotic prophylaxis (61%). Process redesign teams
reduced the number of planning moments, reserved slots
for specific diagnosis (61%), and clarified decision lines
and division of responsibilities (58%). Waiting list teams
blocked agendas for six to eight weeks (72%) and antici-
pated fluctuations (64%). The average number of applied
changes per project type ranged from 2.06 (medication
safety) to 4.4 (working without waiting lists).
As well as the average changes in activities, the percentage
of teams (with data available) experiencing an improve-
ment in the performance indicator by at least 10% also
differs between the six project types. This criterion is met
by 70% of the pressure ulcer teams (reduction of pressure
ulcers), 100% of the medication safety teams, 12% of the
operating theatre teams (use of allocated time), 56% of
the wound infections teams, 83% of the process redesign
teams (throughput times for diagnostics and treatment),
and 46% of the waiting list teams (access time).
Cross-classified data structure: project teams nested in QICs and hospitalsFigure 2
Cross-classified data structure: project teams nested in QICs and hospitals.
Implementation Science 2009, 4:74 />Page 7 of 12
(page number not for citation purposes)
Table 3: Activities per breakthrough project: changes implemented during the project (N = 159)
Intensified or new activities to More actively or new since beginning of project
No. of teams (%)
Reduce pressure ulcers (28 teams)
1. regularly changing patient's position 19 (68%)
2. risk assessment for each patient 18 (64%)
3. patient information brochure on pressure ulcers 16 (57%)
4. compliance to a pressure ulcers protocol 13 (46%)
5. updating the pressure ulcers protocol 12 (43%)
6. occupational and physiotherapy 9 (32%)
7. sufficient anti-pressure ulcers mattresses 6 (21%)
8. specialised pressure ulcer nurse 4 (14%)
Average number of changes (out of eight) applied by pressure ulcer teams 3.5
Improve medication safety (34 teams)
1. clinical lesson in pain reduction 13 (38%)
2. spreading a simple card with 'switch' guidelines 12 (35%)
3. reducing postoperative pain; pain score on linear scale <4 11 (32%)
4. reduce degree of unnecessary intravenous antibiotics 10 (29%)
5. compliance to a medication prescription and administering protocol 8 (24%)
6. apply guideline to reduce unnecessary blood transfusion 6 (18%)
7. fixed medication times 4 (12%)
8. double check of all medication 2 (6%)
Average number of changes (out of eight) applied by medication safety teams 2.0
Optimise operating theatre productivity (18 teams)
1. starting on time 11 (61%)
2. emergency procedures: re-definition of 'emergency' 8 (44%)
2. reallocate extra operating time based on the degree of utilisation 8 (44%)
4. tracking and solving disturbances in the operating theatre programme 7 (39%)
5. planning based on average surgery time 6 (33%)
5. reduce time between operations 6 (33%)
7. maintaining capacity for emergency available in the programme 5 (28%)
8. staff planning based on differences in surgery time of individual clinicians, differences in
anaesthesiologists and assistants, and the experience of the team
2 (11%)
Average number of changes (out of eight) applied by operation theatre teams 2.9
Reduce postoperative wound infections (18 teams)
1. limiting the number of persons in the operating theatre 16 (89%)
1. reducing number of door movements 16 (89%)
3. protocol for optimal administering of antibiotic prophylaxis 11 (61%)
4. participation in national wound infections surveillance network 8 (44%)
5. minimise refreshment of bandages 5 (28%)
6. staff reports (skin) infections and diarrhoea 5 (28%)
7. separate working tablet is used for each patient
(bandages, instruments, gloves, deposit bags, etc; afterwards cleansing with alcohol)
4 (22%)
8. during wound care no beds are made, nor is the ward cleaned 2 (11%)
Average number of changes (out of eight) applied by wound infections teams 3.6
Reduce throughput times (33 teams)
1. reserving slots for specific diagnosis 20 (61%)
1. reducing planning moments 20 (61%)
3. clear decision lines and division of responsibilities 19 (58%)
4. rational planning of demand on expected question 18 (55%)
5. introduction of one-stop shop 16 (48%)
6. admission on day of operation 12 (36%)
6. more flexible staff utilisation 12 (36%)
8. protocol for treatment groups (e.g., physiotherapy or informing patients) 11 (33%)
Average number of changes (out of eight) applied by process redesign teams 3.9
Implementation Science 2009, 4:74 />Page 8 of 12
(page number not for citation purposes)
Statistical modelling
To learn more about the process and outcomes of QIC
implementation, the four hypotheses were tested using
multi-level analyses. In Table 4, the estimated correla-
tions, fixed effects, random effects, and the percentage of
variance at each level are shown.
Hypothesis A concerns the relation between the three con-
ditions and the number of changes teams applied. The
association between organisational support and external
change agent support and the number of applied changes
is confirmed to be significant (p < 0.001). An increase in
organisational support or external change agent support is
accompanied by an increase in the number of applied
changes. The relation between team organisation and the
number of applied changes is insignificant. The multi-
level model reveals that organisational support differs sig-
nificantly between hospitals: 18% of the variance is situ-
ated at hospital level. Hypothesis B concerns the effect of
applied changes on project outcomes. An increase in the
number of applied changes is verified to have a positive
effect on perceived success (p < 0.001) and indicator out-
comes (p < 0.05). Hypothesis C involves the direct rela-
tion between conditions and outcomes. In the case of
organisational support and perceived success, and team
organisation and perceived success, a positive correlation
was found of 0.29 (p < 0.001) and 0.30 (p < 0.001),
respectively. The relation between external change agent
support and perceived success is not significant (p > 0.05),
similar to the relation between the three conditions and
actual outcome (p > 0.05). In addition to these test results,
a two-tailed Sobel Test was conducted to determine
Reduce waiting list (36 teams)
1. block agendas six or eight weeks in advance; cancellation only in case of emergency 26 (72%)
2. anticipate on fluctuations 23 (64%)
3. minimise types of consults 21 (58%)
3. plan patient consults not routinely but in the event of complaints 21 (58%)
5. perform diagnostics in fewer consults 20 (56%)
6. minimise vacations in busy periods 17 (47%)
7. increase the interval for consultations for chronic disorders 17 (47%)
8. plan realistically on the basis on actual consult length 16 (44%)
Average number of changes (out of eight) applied by waiting list teams 4.4
Table 3: Activities per breakthrough project: changes implemented during the project (N = 159) (Continued)
Table 4: Multi-level model: predicted relations between conditions and outcomes (correlations), associations between applied changes
and the conditions and outcomes (fixed effects) and variance components at three levels (random effects)
Organisational
support
Team organisation External support Perceived success Performance
indicator
Correlations
Organisational support -
Team organisation 0.37
c
-
External support 0.25
b
0.21
a
-
Perceived support 0.30
b
0.29
b
0.08 -
Performance indicator -0.19 0.14 -0.05 -0.08 -
Fixed effects Estimate (SE) Estimate (SE) Estimate (SE) Estimate (SE) Estimate (SE)
(Intercept) -0.45 (0.16)
b
-0.11 (0.18) -0.69 (0.17)
c
5.57 (0.31)
c
2.03 (0.21)
c
Applied changes 0.12 (0.04)
c
0.04 (0.04) 0.19 (0.04)
c
0.31 (0.07)
c
0.09 (0.05)
a
Random effects
Intercept variance at: Estimate (SE) Estimate (SE) Estimate (SE) Estimate (SE) Estimate (SE)
- level one (team) 0.69 (0.08)
c
0.86 (0.11)
c
0.75 (0.08)
c
2.01 (0.29)
c
0.62 (0.11)
c
- level two (QIC) 0.00 (0.00) 0.07 (0.06) 0.03 (0.04) 0.42 (0.23)
b
0.15 (0.09)
b
- level three (hospital) 0.15 (0.07)
a
0.06 (0.05) 0.08 (0.06) 0.04 (0.12) 0.00 (0.05)
Percentage of variance
at:
- level one (team) 82% 87% 87% 81% 81%
- level two (QIC) 0% 7% 3% 17% 19%
- level three (hospital) 18% 6% 9% 2% 0%
a
p < 0.05;
b
p < 0.01;
c
p < 0.001
Note: teams are nested in QICs and hospitals (Figure 2)
Implementation Science 2009, 4:74 />Page 9 of 12
(page number not for citation purposes)
whether the relation between the support conditions and
both outcomes is mediated by the number of applied
changes [37]. Partial mediation effects were confirmed in
the case of organisational support and perceived success
(test statistic: 2.77; p < 0.01) and external change agent
support and perceived success (test statistic: 3.45; p <
0.001). The mediation of the relationship between condi-
tions and actual outcome is less significant (p < 0.10). At
team level, hypothesis D, the existence of a positive rela-
tion between perceived success and actual outcome could
not be confirmed (p > 0.05). Perceived successes and
actual outcomes differ significantly between QICs (p <
0.05). By means of an iterative process, the possibility was
explored that the expected hypothesised relation exists at
QIC level. After an estimation of the level-two correlation
between both variables, the relation could be confirmed:
there is a maximal correlation at QIC level (Pearson's r =
1.00; p < 0.05). At this higher group level, perceived suc-
cesses say more about actual outcomes than at the level of
individual teams.
Discussion
In this article, a model was tested to gain a better under-
standing of the QIC black box. The study objective was to
answer two questions.
Question 1: Do expected relationships exist between
conditions, applied changes, and outcomes?
The analysis resulted in several findings, contributing to a
better understanding of the implementation process that
took place in the context of the multi-level quality collab-
orative.
First, when a team leader is more positive about organisa-
tional and external change agent support, this has a posi-
tive effect on the number of intensified or new working
methods applied by the team. Second, a higher number of
applied changes has a positive influence on the degree of
perceived success and actual outcomes. Third, positive
relations between perceived success and organisational
support and team organisation could be confirmed. The
direct connection between actual outcomes and the three
conditions is insignificant. Moreover, the relation
between perceived success and organisational support
and external change support is partly mediated by the
number of applied changes. With regard to the degree of
actual success, a similar mediation effect could be verified
with 90% certainty.
Finally, the association between actual outcome and per-
ceived success is insignificant at team level but strong at
QIC level. The high correlation between perceived and
actual success at QIC level indicates that teams who
joined a QIC, in which the perceived success ratings of
team leaders are high, have also relatively high perform-
ance indicator scores.
Question 2: Are differences in conditions and outcomes
due to nesting in hospitals or to QICs?
The multi-level model adds an important dimension that
would have been overlooked in a single-level approach.
Judgements on external change agent support and team
organisation and actual outcomes do not seem to differ
between hospitals, but organisational support does. Not
one of the conditions differs at QIC level. In the case of
external change support, this is particularly interesting
because this condition represents the core of the QIC.
Apparently, there are no differences in external change
agent support between QICs, while at the same time QICs
do differ in the level of perceived and actual success. Nev-
ertheless, the finding that an increase in external change
agent support is accompanied by an increase in the
number of applied changes confirms the relevance of
external change agents within QICs as a mechanism for
best practice transfer.
Implications
It was mentioned in the introduction that the evidence on
QIC effectiveness is mixed but positive. Mittman
explained how subjective ratings provided by collabora-
tive participants and leaders are subject to unintentional
and unrecognised biases generated by common human
decision and judgment heuristics. In that respect, he
exemplified how a combination of expectation biases and
belief perseverance produces systematic overweighting of
evidence and observations. A priori expectations and
beliefs are confirmed, while evidence that does not sup-
port the effectiveness of the QIC method is under-
weighted or discounted [4]. This study confirms the risk
addressed by Mittman. The overall judgement of an indi-
vidual team leader is confirmed to say little about actual
indicator outcomes and vice versa. This is not necessarily
a bad thing at least as long as the evaluation goal is not
about assessing cost effectiveness or public accountability
of the means invested in QIC programmes. Still, parties
involved in implementing QIC projects should be cau-
tious when it comes to rating and explaining the merits of
their work, especially when monitoring data are not yet
available. This also applies to QIC researchers who use
perceived successes as proxy variables for actual perform-
ance. The overall success judgement apparently represents
something other than monitored progress towards project
goals. Like the actual outcomes, it depends on the number
of applied changes. It is also likely that team leaders base
their success judgement on other accomplishments: for
instance, they notice how patients benefited from the
project or how the team managed to change old routines
and implemented new interventions that are expected to
pay off in the long run.
Implementation Science 2009, 4:74 />Page 10 of 12
(page number not for citation purposes)
The study confirms the association between organisa-
tional and external change agent support and the number
of changes realised by QIC teams. Hospital managers,
project teams, external change agents, and public stake-
holders may benefit from the survey instrument, because
it potentially provides tangible information, applicable
for real-time adjustments or intake procedures.
Researchers are in a situation where relevant questions
remain unanswered. Generally, the advice to adopt hierar-
chical models in future research should be taken as seri-
ously, as are recommendations for more experimental [7],
narrative [15], or action-based research studies [38]. Fur-
ther research is needed to test the effectiveness of QICs as
spread strategy [1] and to assess how external change
agent support influences team organisation, how team
learning within a QIC takes place, and how QICs contrib-
ute to organisational learning. In addition to the black
box of QIC implementation, there is another black box
that needs to be opened: that of sustainability. In the
extensive 'diffusion of innovation' review, Greenhalgh et
al. found many studies addressing adoption, implementa-
tion, and diffusion, but only a limited number of studies
dealing with sustainability [15].
Strengths and weaknesses
The multi-level approach is one of the strengths of this
study. Other strengths are that the conditions were meas-
ured using a validated and reliable instrument, and per-
ceptions were linked to outcome data. The dependence on
data provided by the teams is a limitation. Despite the
high response rate, the use of self-reported perceptions
always involves a risk of overestimation or social desira-
bility. Outcome indicators could be linked to question-
naire data in 61% of all teams in the study sample. It is
very likely that the positive results are overrepresented,
particularly because the absence of monitoring data may
very well be caused by the fact that teams were incapable
of implementing the project (and the required measure-
ments) as planned. In that sense, actual outcomes pre-
sented in this article do not entirely represent the overall
level of success of the programme.
While the vast majority of the projects had a planned
length of one year, operation theatre, process redesign,
and postoperative wound infections were in fact two-year
projects. Because the team questionnaires were adminis-
tered at a fixed moment by the end of the first year, sec-
ond-year data on conditions, perceived success, and
applied changes are unfortunately unavailable. Hence, for
practical reasons, the analyses described in this article are
based entirely on first-year data. A potential limitation is
that the success level of two-year projects was determined
without the project being finished. At first glance, it is rea-
sonable to assume that the improvement rate of those
projects is likely to be more positive after two years. A
recent evaluation, however, illustrates that the level of
improvement has remained the same [39]. An additional
analysis would yield similar results.
Finally, the number of applied changes was modelled
without taking into account the influence of individual
and key interventions or specific combinations. In reality,
some interventions are more time-consuming and com-
plex than others, and some may not even be suited for
application within a collaborative [39].
Summary
By examining 18 QICs, part of a quality improvement
programme for hospitals, several expected relationships
could be verified. Organisational and external change
agent support had a positive influence on the number of
changes applied by QIC teams during the implementa-
tion. The number of applied changes had a positive effect
on perceived success as well as on actual outcomes. By tak-
ing into account the fact that teams are nested in hospitals
and in QICs, it became clear that some hospitals are better
than others in providing organisational support. Project
outcomes differ between QICs. One should be cautious
when accepting perceived successes as a proxy for the
actual success of individual teams.
Competing interests
The authors declare that they have no competing interests.
Authors' contributions
MLAD was responsible for designing the study, acquiring,
analyzing and interpreting the data, and drafting the man-
uscript. PS assisted with the analyses and interpretation of
the data. As research manager of the independent evalua-
tion study of the hospital improvement programme, CW
was responsible for designing the study. CW and PPG
assisted in interpreting the results and revising the manu-
script for intellectual content. All authors have read and
approved the final manuscript.
Appendix 1 - Description of the three pillars of
Better Faster
Pillar 1
The purpose of the first pillar was to create awareness and
provide room for new paradigms by having authoritative
experts from other fields of service delivery and industry
communicate appealing approaches and ideas about how
to deal with issues of safety, logistics, and accountability
in healthcare. Focus was added to national and local dis-
cussions on necessary changes[10].
Pillar 2
Transparency is thought to guide purchasing decisions
and improvement efforts. The second pillar is considered
Implementation Science 2009, 4:74 />Page 11 of 12
(page number not for citation purposes)
an important step in generating comparative data on
healthcare quality. A national set of standardised quality
indicators for hospital care has been developed and main-
tained by the Healthcare Inspectorate [11].
Pillar 3
A national programme to stimulate transparency, effi-
ciency, and quality of care was implemented in three
groups of eight hospitals between 2004 and 2008, cover-
ing approximately a quarter of all hospitals in the Nether-
lands. This multi-level quality collaborative combined
interventions at the bottom and the top of member organ-
isations.
At bottom level, physicians, nursing staff, and managers
were encouraged to participate in quality improvement
collaboratives to continuously improve the quality of
their work by trying out interventions using a break-
through model while being supported by their institution
and by external change agents (Table 1).
At top level, hospital executives participated in a special
collaborative leadership programme (leadership and
organisational development). An internal programme
organisation was established to monitor the progress of
the various programmes. The strategic management was
expected to encourage active staff participation [40] and
to support the implementation and spread of the new
working methods and results. Feedback loops were estab-
lished at unit and process level, part of the learning cycles
during the implementation of the breakthrough model. In
addition, the leadership programme strived explicitly for
realisation of feedback loops at institutional level to pro-
mote the congruence between strategic hospital goals and
the performance at unit level [10].
Acknowledgements
This study was funded by ZonMw, the Netherlands organisation for health
research and development.
References
1. Øvretveit J, Bate P, Cleary P, Cretin S, Gustafson D, McInnes K,
McLeod H, Molfenter T, Plsek P, Robert G: Quality collaboratives:
lessons from research. Quality and Safety in Health Care 2002,
11:345-351.
2. Ferlie EB, Shortell SM: Improving the quality of health care in
the United Kingdom and the United States: a framework for
change. The Milbank Quarterly 2001, 79:281-315.
3. Cretin S, Shortell SM, Keeler EB: An evaluation of collaborative
interventions to improve chronic illness care: framework
and study design. Evaluation Review 2004, 28:28-51.
4. Mittman BS: Creating the evidence base for quality improve-
ment collaboratives. Annals of Internal Medicine 2004,
140:897-901.
5. Øvretveit J: What are the best strategies for ensuring quality
of hospitals. In Health Evidence Network Copenhagen, World Health
Organisation Europe; 2003.
6. Schouten LMT, Hulscher MEJL, Van Everdingen JJE, Huijsman R, Grol
RPTM: Evidence for the impact of quality improvement col-
laboratives: systematic review. British Medical Journal 2008,
336:1491-1494.
7. Landon BE, Wilson IB, McInnes K, Landrum MB, Hirschhorn L,
Marsden PV, Gustafson D, Cleary PD: Effects of a quality
improvement collaborative on the outcome of care of
patients with HIV infection: the EQHIV study. Annals of Internal
Medicine 2004, 140:887-896.
8. Leatherman S: Optimizing quality collaboratives. Quality and
Safety in Health Care 2002, 11:307.
9. Solberg LI: If you've seen one quality improvement collabora-
tive Ann Fam Med 2005, 3:198-199.
10. Dückers M, Makai P, Vos L, Groenewegen P, Wagner C: Longitudi-
nal analysis on the development of hospital quality manage-
ment systems in the Netherlands. International Journal for Quality
in Health Care 2009, 21:330-40.
11. Berg M, Meijerink Y, Gras M, Goossensen A, Schellekens W, Haeck J,
Kallewaard M, Kingma H: Feasibility first: developing public per-
formance indicators on patient safety and clinical effective-
ness for Dutch hospitals.
Health Policy 2005, 75:59-73.
12. Custers T, Arah O, Klazinga N: Is there a business case for qual-
ity in the Netherlands? A critical analysis of the recent
reforms of the health care system. Health Policy 2007,
82:226-239.
13. van de Ven WPMM, Schut FT: Universal mandatory health insur-
ance in the Netherlands: a model for the United States?
Health Affairs 2008, 27(3):771-781.
14. Grinten TED Van der: System revision of Dutch health care: an
analysis of policy reform (in Dutch). Tijdschrift voor Sociale
Geneeskunde 2007, 84:227-233.
15. Greenhalgh T, Robert G, MacFarlane F, Bate P, Kyriakidou O: Diffu-
sion of innovations in service organisations: systematic
review and recommendations. The Milbank Quarterly 2004,
82:581-629.
16. Leggatt S, Dwyer J: Factors supporting high performance in
health care organisations. Melbourne, National Institute of Clin-
ical Studies; 2003.
17. Dückers MLA, Wagner C, Groenewegen PP: Developing and test-
ing an instrument to measure the presence of conditions for
successful implementation of quality improvement collabo-
ratives. BMC Health Services Research 2008, 8:172.
18. Cohen SG, Bailey DE: What makes teams work: group effec-
tiveness research from the shop floor to the executive suite.
Journal of Management 1997, 23:239-290.
19. Salas E, Dickinson TL, Converse SA, Tannenbaum SI: Toward an
understanding of team performance and training. In Teams:
their training and performance Edited by: Swezey RW, Salas E. Ablex
Publishing Corporation, Westport, CT; 1992:3-29.
20. Fried B, Rundall T, Topping S: Groups and teams in health serv-
ice organisations. In Health care management: organisation design
and behaviour Edited by: Shortell S, Kalunzny A. Albany: Delmar;
2000:154-190.
21. Meyers PW, Sivakumar K, Nakata C: Implementation of indus-
trial process innovations: factors, effects, and marketing
implications. Journal of Product Innovations Management 1999,
16:295-311.
22. Mills PD, Weeks WB: Characteristics of successful quality
improvement teams: lessons from five collaborative projects
in the VHA. Joint Commission Journal on Quality and Safety
2004,
30:152-162.
23. Green PL: Improving clinical effectiveness in an integrated
care delivery system. Journal for Healthcare Quality 1998, 20:4-8.
24. Gustafson DH, Sainfort F, Eichler M, Adams L, Bisognano M, Steudel
H: Developing and testing a model to predict outcomes of
organisational change. Health Services Research 2003, 38:751-776.
25. Aubert BA, Hamel G: Adoption of smart cards in the medical
sector: the Canadian experience. Social Science & Medicine 2001,
53:879-894.
26. Weiner BJ, Shortell SM, Alexander J: Promoting clinical involve-
ment in hospital quality improvement efforts: the effects of
top management, board and physician leadership. Health Serv-
ices Research 1997, 32:491-510.
27. Young GJ: Managing organisational transformations: lessons
from the Veterans Health Administration. California Manage-
ment Review 2000, 43:66-83.
28. Parry KW: Enhancing adaptability: leadership strategies to
accommodate change in local government settings. Journal of
Organisational Change Management 1999, 12:134-156.
Publish with Bio Med Central and every
scientist can read your work free of charge
"BioMed Central will be the most significant development for
disseminating the results of biomedical research in our lifetime."
Sir Paul Nurse, Cancer Research UK
Your research papers will be:
available free of charge to the entire biomedical community
peer reviewed and published immediately upon acceptance
cited in PubMed and archived on PubMed Central
yours — you keep the copyright
Submit your manuscript here:
/>BioMedcentral
Implementation Science 2009, 4:74 />Page 12 of 12
(page number not for citation purposes)
29. Reeleeder D, Goel V, Singer PA, Martin DK: Leadership and prior-
ity setting: the perspective of hospital CEOs. Health Policy
2006, 79:24-34.
30. Edmondson AC, Bohmer RM, Pisano GP: Disrupted routines:
team learning and new technology implementation in hospi-
tals. Administrative Science Quarterly 2001, 46:685-716.
31. Sparks JR, Schenk JA: Explaining the effects of transformational
leadership: an investigation of the effects of higher-order
motives in multi-level marketing organisations. Journal of
Organisational Behavior 2001, 22:849-869.
32. Vos L, Dückers M, Wagner C: Evaluation Better Faster pillar 3:
results of an improvement programme for hospitals (in
Dutch). Utrecht: NIVEL; 2008.
33. Dückers MLA: Changing hospital care: evaluation of a multi-
layered organisational development and quality improve-
ment programme. 2009 [ />dissertations/2009-0826-200135/UUindex.html]. Utrecht: NIVEL
34. Grol R, Grimshaw J: From best evidence to best practice: effec-
tive implementation of change in patients' care. Lancet 2003,
362:1170.
35. van der Weijden T, Grol R: Feedback and reminders. In Improving
patient care; the implementation of change in clinical practice Edited by:
Grol R, Wensing M, Eccles M. Edinburgh: Elsevier; 2005:158-172.
36. Snijders TAB, Boskers RJ: Multi-level analysis; an introduction to
basic and advanced multi-level modeling. London: Sage Pub-
lishers; 1999.
37. Sobel ME: Asymptotic intervals for indirect effects in struc-
tural equations models. In Sociological methodology Edited by: Lein-
hart S. San Francisco: Jossey-Bass; 1982:290-312.
38. Øvretveit J: Action evaluation of health programmes and
change: a handbook for a user focused approach. Oxford:
Radcliffe Medical Press; 2002.
39. Vos L, Dückers MLA, Wagner C, Van Merode GG: A breakthrough
collaborative for process redesign: does it work? Conference
abstract, 25th International Society for Quality in Health Care (ISQua),
Copenhagen, October, 19-22, 2008 .
40. Dückers MLA, Stegeman I, Spreeuwenberg P, Wagner C, Sanders K,
Groenewegen PP: Consensus on the leadership of hospital
CEOs and it impact on the participation of physicians in
improvement projects. Health Policy 2009, 91:306-13.
41. Langley GL, Nolan KM, Nolan TW, Norman CL, Provost LP: The
improvement guide: a practical approach to enhancing
organisational performance. San Francisco: Jossey-Bass Publish-
ers; 1996.
42. Berwick DM: Developing and testing changes in delivery of
care. Annals of Internal Medicine 1998, 128:651-656.