Báo cáo y học: " Prevalence of metabolic syndrome in patients with schizophrenia, and metabolic changes after 3 months of treatment with antipsychotics results from a German observational study" doc
Bạn đang xem bản rút gọn của tài liệu. Xem và tải ngay bản đầy đủ của tài liệu tại đây (289.19 KB, 11 trang )
RESEARCH ARTICLE Open Access
Prevalence of metabolic syndrome in patients
with schizophrenia, and metabolic changes after
3 months of treatment with antipsychotics -
results from a German observational study
Susanne Kraemer
1*
, Anette Minarzyk
1
, Thomas Forst
2
, Daniel Kopf
3
and Hans-Peter Hundemer
1
Abstract
Background: This observational study explored the prevalence of metabolic syndrome (MetS) in adult in- and
outpatients with untreated or treated schizophre nia at baseline, and month-3 after initiation or switch of
antipsychotic treatment.
Methods: MetS-prevalence (AHA/NHLB-definition) was assessed and Clopper-Pearson 95% confidence intervals (CIs)
were calculated. Factors associated with MetS were explored through univariate and multivariate logistic
regressions (both visits).
Results: MetS-prevalence was 44.3% (CI 39.8;48. 9) at baseline and 49.6% (CI 45.0;54.2) at month-3. Previously
unmedicated patients showed the lowest baseline MetS-prevalence (24.7%, CI 18.3;32.1). MetS-prevalence was not
significantly different, regardless if patients previously received typical or atypical antipsychotics. Increased MetS-risk
was associated with somatic comorbidity and non-smoking at both visits, and with non-psychiatric co-medication,
male sex, and increased C-reactive protein at month-3.
Conclusions: At baseline, MetS was most prevalent in patients with previous antipsychot ic medication. Limited
metabolic changes were observed 3 months after switch/initiation of antipsychotic therapy.
Trial Registration Number: ClinicalTrials.gov Identifier: n.a.
Background
Several studies have reported increased mortality in
patients with schizophrenia. Besides higher risks for can-
cer, respiratory and cerebrovascular disorders, and of
death from suicide or homicide, the main cause is cardi-
ovascular disease [1-7]. Even before antipsychotic medi-
cation became available in the 1950s, abnormal
responses to insulin and diabetes-like glucose tolerance
curves [8,9] were observed in psychiatric patients. Pla-
nansky and Heilizer [10] reported weight gain already in
1959 in patients treated with chlorpromazine. Thakore
et al. [11] found higher BMI (body mass index), WHR
(waist/hip ratio), and a threefold amount of intra-
abdominal fat (IAF) in untreated schizophrenia patients
compared to healthy controls. Further factors associated
with schizophrenia, like unhealthy diet patterns [12],
smoking [13], lower levels of physical activity and cardi-
ores piratory fitness [14], and poor living conditions cer-
tainly contribute to the finding that these patients,
including those on antipsychotics, may have a higher
risk to develop metabolic syndrome (MetS) than the
general population [1,15,16] . It has been suggested that
changes in metabolic parameters in patients treated with
antipsychotics may, in part, be genetically determined
[17].
MetS is characterized by the coincidence of hyperten-
sion, abdominal ob esity, impaired lipid metabolism
(blood triglycerides, cholesterol) and/or i mpaired blood
glucose regulation. Though the concept of MetS is uni-
versally acc epted, there is still controversy on the exact
* Correspondence:
1
Lilly Deutschland GmbH, Medical Department, 61352 Bad Homburg, Werner
-Reimers-Str. 2-4, Germany
Full list of author information is available at the end of the article
Kraemer et al. BMC Psychiatry 2011, 11:173
/>© 2011 Kraemer et al; licensee BioMed Central Ltd. This is an Open Access article distributed under the terms of the Cr eative Commons
Attribution License (http://creativecom mons.org/licenses/by/2.0), w hich permits unrestricted use, distribution, and repro duction in
any medium, provided the original work is properly cited.
pathophysiology, resulting in differing definitions (e.g. by
the American Heart Association [18], the National Cho-
lesterol Education Program [19], and the International
Diabetes Federation/Word Health Organization [20]).
Nevertheless has the awareness of schizophrenia
patients’ risktodevelopMetSresultedintreatment
guidelines which demand the regular monitoring of rele-
vant physical and laboratory parameters; in several
countries these are meanwhile regarded clinical standard
of care [21,22].
Few data are available so far on the prevalence of
MetS in schizophrenia patients in G ermany. In our
observational study we addressed this gap, assessing the
prevalence of MetS at baseline and month-3 of treat-
ment with different antipsychotic medications as well as
possible predictors for the development of MetS.
Methods
Study design
This was a prospective, 3-month, multi-center, disease-
oriented, observational study conducted in Germany
from September 2006 to April 2008. Eligible were in-
and outpatients (≥ 18 years) diagnosed with schizophre-
nia according to ICD-10 criteria, who either entered the
study untreated and were initiated on antipsychotic
therapy, or were on antipsychotic treatment and need ed
to be switched to a new pri mary medication (initiation/
change of medication at baseline). Additionally, routine
blood samples had to be scheduled for these patients at
baseline and month-3 irrespective of the study. Due to
the observational design, no further clinical in- or exclu-
sion criteria were specified, treatment decisions were
entirely left to the discretion of investigators and
patients.
Thestudywasapprovedbytheresponsibleethical
review board. Written informed consent for the release
of medical data was obtained from all patients according
to local regulations. As the German Society of Psychia-
try, Psychotherapy and Neurology [21] recommends
metabolic screening for all patients with schizophrenia,
referring to the Consensus S tatement of the American
Diabetes Association [23], blood tests are considered
standard of care in schizophrenia treatment in Germany.
Therefore the ethical review board consented that draw-
ing blood samples did not interfere with the observa-
tional design of the study.
Our primary research objective was to assess the pre-
valence of MetS, as defined by the National Cholesterol
Education Program, Adult Treatment Panel III in 2001
(NCEP-ATP III) [19] a nd the American Heart Associa-
tion/National Heart, Lung and Blood Institute in 2005
(AHA/NHLB) [18], in a German cohort of pati ents with
schizophrenia. The details of both definitions are given
in Table 1. As a secondary outcome, we compared
MetS-prevalence at baseli ne and after three months of
treatment with the newly prescribed antipsychotic. A
further objective was the detection of predictors for the
development of the MetS.
Patients were documented at baseline and at month-3.
At baseline, patient demographics and characteristics
were recorded. At both visits, vital and physical para-
meters were collected, and fasting blood samples were
drawn and analyzed. Apart from the blood levels of
high-density lipoprotein (HDL) cholesterol, triglycerides,
and glucose, which were needed to diagnose MetS, we
determined C-reactive protein (CRP) [24,25]) as an addi-
tional indicator of cardiovascular risk, and HbA
1c
(gly-
cated hemoglobin), to assess long term glucose
regulation [26].
Blood samples were analyzed in a central laboratory,
which a pplied test reference ranges (i.e. normal ranges)
as per Table 2.
For assessment of disease severity, the Clinical Global
Impression - Severity scale (CGI-S), which rates the
severity of the pa tient’ s illness on a 7-point scale (1 =
normal to 7 = extremely ill) was used at both visits [27].
Sample size considerations and statistical analysis
The sample size was designed to reach 2.5% precision
for the estimate of MetS prevalence rate - i.e. the 95%
confidence interval bounds within estimated rate ± 2.5%
(
1.96x
ˆ
p(1 −
ˆ
p)
n
=0.02
5
) - and assuming a prevalence
rate around 41%, based on results of the CATIE study
[28]. T his yielded a first est imate of 1486 patients,
further adjusted accounting for 25% of drop outs. We
finally aimed to enroll 1900 patients.
Statistical analyses were performed on two sets: (a) the
full analysis set (FAS), including all patients meeting the
entry criteria, and (b) the complete metabolic data set
(CMD), comprising all patients with a full set of meta-
bolic data for both visits, who did not change their anti-
psychotic treatment during the course of the study.
Primary analyses were conducted on the FAS, with
subgroups formed a ccording to the antipsychotic treat-
ment they received within 6 months
prior to baseline
(Prev-AP = previous antipsychotic treatment cohorts).
The evaluations of the secondary outcomes were per-
formed on the CMD-set, with subgroups formed
according t o the treatment patients received
after base-
line (New-AP = new antipsychotic treatment cohorts).
In both sets, compounds which were less frequently pre-
scribed had to be grouped to reach large enough cohorts
for reasonable statistical evaluation.
Patient demographics and characteristics, physical,
vital and laboratory parameters were described by
Kraemer et al. BMC Psychiatry 2011, 11:173
/>Page 2 of 11
standard summary statistics and used to determine the
presence of MetS at baseline and at month-3.
Clopper-Pearson exact 95% confidence intervals (CI)
relating to MetS pre valence were calculated for both
sets of antipsychotic treatment cohorts (Prev-AP, FAS,
and New-AP, CMD-Set).
TheassociationbetweenthepresenceofMetSand
possible risk factors for its development was analyzed
for each visit separately, through univariate and multi-
variable forward selection logistic models (CMD-set).
Candidate covariates entered in the forward selection
process were not pre-screened based on the results of
univariate analyses, all of them were considered. The
significance level (chi-square score test) for the for-
ward selection process was set to ≤0.1. No interaction
was considered. Odds Ratios (OR) were estimated
together with their asymptotic Wald 95% confidence
interval. For continuous factors ORs relate to an
increase by 1 unit. Tested covariates (both visits)
included: age, sex, time since first symptoms, any con-
comitant somatic diseases (yes/no), any concomitant
non-psychiatric medication at baseline (yes/no), Prev-
AP cohort (reference category: Prev-None), active smo-
ker (yes/no), CGI-S score at baseline, CRP ≥ 3mg/L
(yes/no), and HbA
1c
≥ 6.5% (yes/no).
Results
Patient disposition and baseline characteristics
Only 718 patients could be documented at 162 investi-
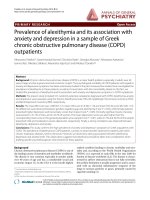
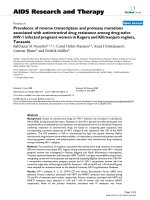
gational sites within the recruitment period. Figure 1
displays the details of patient disposition.
Table 3 shows the distribution of patients in the treat-
ment cohorts.
The age ranged between 18 and 86 years, with upper
and lower quartiles of 36 and 54 years. Women had a
Table 1 Definitions and reference ranges for metabolic syndrome according to NCEP-ATP III and AHA/NHLB
Risk factor Defining measure NCEP-ATP III Defining measure AHA/NHLB
Abdominal obesity
(waist circumference)
Men > 102 cm ≥ 102 cm
Women > 88 cm ≥ 88 cm
Triglycerides ≥ 150 mg/dL ≥ 150 mg/dL or on drug treatment for elevated triglycerides
High density lipoprotein (HDL)
Men < 40 mg/dL < 40 mg/dL or on drug treatment for reduced HDL-cholesterol
Women < 50 mg/dL < 50 mg/dL or on drug treatment for reduced HDL-cholesterol
Blood pressure Systolic ≥ 130 or diastolic ≥ 85 mmHg Systolic ≥ 130 or diastolic ≥ 85 mmHg or on antihypertensive medication
Fasting glucose ≥ 110 mg/dL ≥ 100 mg/dL or on antidiabetic medication
Abbreviations: AHA/NHLB = American Heart Association/National Heart, Lung and Blood Institute; NCEP-ATP III = National Cholesterol Education Program, Adult
Treatment Panel 3rd report
According to both definitions, a diagnosis of metabolic syndrome is established if at least three of the above risk factors are present.
Table 2 Test reference ranges applied for blood samples
Parameter Range
HbA
1c
(%) 4 to 6
Triglycerides (mg/dL) 9 to 150
HDL - Cholesterol (mg/dL) 40 to 150
Glucose (mg/dL) 70 to 115
CRP (mg/L) 0 to 3
Abbreviations: HDL = High density lipoprotein; CRP = C-reactive protein,
HbA
1c
= glycated hemoglobin.
Excluded due to
protocol violation*
76
Early discontinuations
(no reason specified)
120
Full Analysis Set (FAS)
642 (100%)
Completers
Full Analysis Set (FAS)
522 (81.3%)
Complete Metabolic Data Set**
(CMD)
476 (100%)
Patients screened
718
Figure 1 Patient disposition. * Time span between baseline visit
and blood draw > 3 weeks. ** Patients with complete metabolic
data sets for both visits, who did not change antipsychotic
treatment during the course of the study.
Kraemer et al. BMC Psychiatry 2011, 11:173
/>Page 3 of 11
mean age of 47.3 ± 13.1 years, for men it was 43.1 ± 13.1
years. A mean waist circumference of 103.5 ± 16.0 cm for
men, and 95.6 ± 17.5 cm for women indicated overweight
in a considerable proportion of patients. Prev-None was
the only cohort with a mean BMI near to normal range
(25.3 kg/m²). The mean time since first diagnosis was 9
years, ranging from 0 to 51 years. Baseline characteristics
in the overall CMD-set resembled those observed in the
FAS. For details on demographics and baseline character-
istics of both sets of t reatment cohorts, see Table 4 and
Table 5.
In the Prev-None cohort 28.4% of the patients
reported any concomitant disease (Table 6), whereas the
previously treated patients had rates between 29.9%
(Pre-Risp) and 41. 7% (Pre-Comb). Non-psychiatric
comedication was taken by approximately 20% of the
patients, mostly antihypertensives (Table 7).
Table 8 shows the proportions of patients (FAS) with
blood t est values out of the reference range at baseline.
Within the Prev-AP cohorts, the percentages for Prev-
None were at the lower end for all parameters.
MetS at Baseline
For both MetS definitions, NCEP-ATP III and AHA/
NHLB, the differences between the cohorts with pre-
vious antipsychotic treatment were not statistically sig-
nificant (Table 9). However, the Prev-None cohort had a
significantly lower prevalence of MetS compared to any
other Prev-AP cohort according to both definitions,
except Pre-Risp (difference not significant).
Development of MetS between baseline and endpoint at
month-3
In the following, we report results for MetS according to
AHA/NHLB-definition only, as both defi nitions are lar-
gely based on the same pa rameters; only the AHA/
NHLB-definition additionally includes the treatment
with antihypertensives, antidiabetics and lipid lowering
drugs and was therefore regarded the more sensitive
instrument.
At baseline, New-Typ had a significantly higher preva-
lence than New-Olz and New-Risp, but not compared
to the other New-AP cohorts (differences lacked signifi-
cance,seeCIsinTable10).Atmonth-3theMetSpre-
valence had increased from 44.3% to 49.6%; however,
this change was not significant (95% CIs overlapping
substantially). Comparing the New-AP cohorts, observed
changes included minor changes, but none of these
were statistically significant (Table 10).
Table 11 provides an overview on the change of the
particular MetS-factors. Larg e standard deviations indi-
cate a great variability of individual change in both
directions. Looking at the median, however, little to no
change was observed in waist-circumference, blood
pressure,CRP,andHbA
1c.
There was an increase in
median glucose values in all cohorts but New-Risp, and
Table 3 Patient distribution in treatment cohorts, Prev-AP FAS and New-AP CMD-set
Cohorts Prev-AP, FAS (N =
642)
N (%)
Prev-Olz previous olanzapine monotherapy 62 (9.7%)
Prev-Risp previous risperidone monotherapy 67 (10.4%)
Prev-Quet previous quetiapine monotherapy 49 (7.6%)
Prev-Atyp previous other atypical antipsychotic monotherapy (amisulpride, aripiprazoleclozapine, ziprasidone,
paliperidone)
103
(16.0%)
Prev-Typ previous typical antipsychotics 90 (14.0%)
Prev-Comb any previous combination therapy 109
(17.0%)
Prev-None not treated with antipsychotics within6 months prior to study entry 162
(25.2%)
Cohorts New-AP, CMD-set (N =
476)
N (%)
New-Olz new olanzapine monotherapy 206
(43.3%)
New-Risp new risperidone monotherapy 69 (14.5%)
New-Quet new quetiapine monotherapy 33 (6.9%)
New-Atyp new other atypical antipsychotic monotherapy (amisulpride, aripiprazoleclozapine, ziprasidone,
paliperidone)
72 (15.1%)
New-Typ new typical antipsychotic 16 (3.4%)
New-Comb new combination therapy (any combination) 80 (16.8%)
Abbreviations: CMD = complete metabolic data; FAS = full analysis set; New-AP = new antipsychotic treatment cohort; Prev-AP = previous antipsychotic
treatment cohort;
Kraemer et al. BMC Psychiatry 2011, 11:173
/>Page 4 of 11
also in triglycerides with exception of the New-Typ and
New-Comb. A decrease in the median HDL-cholesterol
values was observed in all cohorts.
Factors associated with MetS (NCEP-ATP III -definition)
Factors found significantly associated with the presence
of MetS in the multivariate l ogistic regression (CMD)
were concomitant somatic disease (adjusted OR 4.09, p
< 0.0001) and non-smoking (smoking vs. not, adjusted
OR 0.53, p = 0.0098) at baseline. The same was
observed at month-3, with an adjusted OR of 0.60 (p =
0.049) for smoking versus non-smoking, and a still
negative, though not significant, effect of having any
concomitant somatic disease (adjusted OR 1.83, p =
0.0796). Other factors associated with MetS at month-3
included male sex (female vs. male, OR 0.56, p =
0.0185) , having a CRP ≥ 3 mg/L (adjusted OR of 2.00, p
= 0.006), and receiving non-psychiatric concomitant
medication (adjusted OR of 1.98, p = 0.059). In the
baseline multivariate model the factors CRP ≥3mg/L
and concomitant non-psychiatric medication were elimi-
nated during the multivariable forward selection process,
though they showed significance in the univariate logis-
tic regressions (CRP≥ 3mg/LunadjustedORof1.68
Table 4 Patient Demographics and Baseline Characteristics (Prev-AP cohorts)
Prev-AP*, FAS Age (years) BMI (kg/m²) Waist (cm) SBP (mm/Hg) DBP (mm/Hg) CGI-S score Male Smokers
Prev-Olz Mean 42.9 28.9 103.4 131.1 83.6 3.5 N 36 26
(N = 62) SD 13.9 5.2 17.1 18.0 8.2 1.2 % 58.1 41.9
Prev-Risp Mean 46.0 28.9 103.4 128.2 83.1 4.1 N 38 30
(N = 67) SD 13.2 6.2 17.3 12.7 7.4 1.2 % 56.7 44.8
Prev-Quet Mean 46.2 27.0 100.0 125.9 81.7 3.9 N 24 17
(N = 49) SD 12.1 4.9 18.2 13.5 8.5 1.2 % 49.0 34.7
Prev-Atyp Mean 46.7 28.4 101.1 128.1 81.9 4.0 N 50 43
(N = 103) SD 13.2 5.8 17.2 16.7 9.9 1.2 % 48.5 41.8
Prev-Typ Mean 49.1 28.4 102.1 129.3 84.0 4.0 N 42 43
(N = 90) SD 11.9 5.9 18.7 15.9 9.7 1.2 % 46.7 47.8
Prev-Com Mean 44.5 29.3 103.3 127.0 82.3 3.6 N 58 43
(N = 109) SD 11.6 5.4 14.7 11.3 8.9 1.2 % 53.2 39.5
Prev-None Mean 43.0 25.3 91.3 125.0 80.2 4.2 N 69 61
(N = 162) SD 14.7 4.5 15.1 15.7 9.3 1.0 % 42.6 37.7
Total FAS Mean 45.2 27.8 99.5 127.4 82.1 3.9 N 317 263
(N = 642) SD 13.3 5.6 17.2 15.1 9.1 1.2 % 49.4 41.0
Abbreviations: BMI = body mass index; CGI-S = clinical global impression - severity scale; DBP = diastolic blood pressure; FAS = full analysis set; Prev-AP =
previous antipsychotic treatment cohort; SBP = systolic blood pressure; SD = standard deviation, Waist = waist circumference
Missing values: BMI 1 (Prev-Comb), waist circumference 1 (Prev-Comb), SBP and DBP 1 (Prev-Risp)
* The time period through which the previous antipsychotic medication had been taken ranged from less than a month up to more than a decade.
Table 5 Patient Demographics and Baseline Characteristics (New-AP cohorts)
New-AP, CMD-set Age (years) BMI (kg/m²) Waist (cm) SBP (mm/Hg) DBP (mm/Hg) CGI-S score Male Smokers
New-Olz Mean 46.3 26.6 96.8 126.3 81.6 4.1 N 106 86
(N = 206) SD 13.5 4.7 17.2 15.2 8.8 1.2 % 51.5 41.8
New-Risp Mean 45.6 27.5 98.1 128.4 81.0 4.1 N 30 23
(N = 69) SD 11.6 5.6 15.9 14.0 8.8 0.9 % 43.5 33.3
New-Quet Mean 48.5 28.6 100.7 125.6 82.5 3.5 N 11 13
(N = 33) SD 14.2 4.7 13.5 11.4 7.1 1.3 % 33.3 39.4
New-Atyp Mean 43.7 29.0 103.9 129.1 82.6 3.7 N 38 35
(N = 72) SD 11.0 6.2 17.7 14.2 9.1 1.1 % 52.8 48.6
New-Typ Mean 45.6 32.3 111.3 134.6 84.6 4.1 N 11 3
(N = 16) SD 11.5 7.0 18.8 16.4 7.3 1.5 % 68.8 18.8
New-Com Mean 46.0 29.5 105.0 127.3 83.2 3.7 N 40 32
(N = 08) SD 12.8 5.7 15.9 14.5 9.3 1.3 % 50.0 40.0
Total CMD Mean 45.9 27.9 100.2 127.4 82.1 3.9 N 236 192
(N = 476) SD 12.7 5.5 17.1 14.6 8.8 1.2 % 49.6 40.3
Abbreviations: BMI = body mass index; CGI-S = clinical global impression - severity scale; CMD = complete metabolic data; DBP = diastolic blood pressure; New-
AP = new antipsychotic treatment cohort; SBP = systolic blood pressure; SD = standard deviation, Waist = waist circumference
Kraemer et al. BMC Psychiatry 2011, 11:173
/>Page 5 of 11
[1.11;2.56], p = 0.015, concomitant non-psychiatric med-
ication OR of 3.38 [2.14;5.31], p < 0.0001).
The sex effect did not demonstrate significance in uni-
var iate logistic regression (una djusted OR female versus
male of 0.82, p = 0.28).
An overview of factors associated with the presence of
MetS is given in Table 12.
Discussion
Baseline data showed that the study population com-
prised patients with a wide range of age and duration of
disease. As patients could be either untreated or in need
of a treatment switch, this study possibly included
patients who received antipsychotic medications for
years, but eventually had to be switched due to treat-
ment-emergent adverse events or insufficient efficacy.
The percentages of patients with k nown concomitant
hypertension (16.7%), lipid metabolism disorder (6.7%)
and diabetes (5.6%) appeared moderate compared to num-
bers from German primary care patients (hypertension
31.6%, lipid metabolism disorder 23.4%, diabetes 9.4%)
[29]. However, the vital signs and laboratory data collected
at baseline revealed high blood pressure in 54.8%,
increased triglycerides in 52.5% and increased blood glu-
cose in 14.1% of the patients. This remarkable discrepancy
emphasizes how important the actual monitoring of vital
signs and blood values is in patients with schizophrenia, as
seemingly, a large proportion of these patients were
neither aware of their somatic health status nor adequately
diagnosed and treated for cardiovascular risk factors.
Regarding baseline differences betw een the treatment
groups (Prev-AP and New-AP), only two cohorts con-
trasted perceptibly from the others: One was the small
(N = 16) group of New-Typ. These patients had clini-
cally noticeable high mean values for BMI (32.3 kg/
cm²), waist circumference (111.3 cm) and blood pres-
sure (SBP/DBP 134.6/84.6 mmHG), and 12 of them
(75%) actually met the criteria of MetS (AHA/NHLB).
Though this cohort was too small for reliable statistical
evidence, a possible explanation might be that these
patients were switched/newly initiated on typical anti-
psychotics, because their metabolic and cardiovascular
risk was already evident and these substances were
assumed to have a lower risk of treatment-emergent
metabolic adverse events. Though, in our study, the per-
ception of lower risk of metabolic adverse events
through typical antipsychotics was not supported by the
baseline values found in the Prev-Typ cohort.
The other treatment cohort with noteworthy baseline
values was Prev-None. These previously untreated
patients showed numerically lower mean value s for
BMI, blood pressure, prevalence of somatic
Table 6 Pre-existing concomitant somatic diseases* at baseline (in >5% of the patients, Prev-AP, FAS, N = 642)
Prev-Olz Prev-Risp Prev-Quet Prev-Atyp Prev-Typ Prev-Comb Prev-None FAS, total
N = 62 N = 67 N = 49 N = 103 N = 90 N = 109 N = 162 N = 642
Any n 23 20 15 36 36 45 46 221
% 37.1 29.9 30.6 35.0 40.0 41.7 28.4 34.5
Hypertension n 17 12 5 18 18 19 18 107
% 27.4 17.9 10.2 17.5 20.0 17.6 11.1 16.7
Lipid disorders n 4 7 4 4 7 12 5 43
% 6.5 10.5 8.2 3.9 7.8 11.1 3.1 6.7
Diabetes n 3 2 3 3 8 15 2 36
% 4.8 3.0 6.1 2.9 8.9 13.9 1.2 5.6
Musculoskeletal disorders n 1 4 2 4 6 9 8 34
% 1.6 6.0 4.1 3.9 6.7 8.3 4.9 5.3
Abbreviations: FAS = full analysis set; Prev-AP = previous antipsychotic treatment
*pre-specified in data capturing form: diabetes, lipid metabolism disorder, other endocrine or metabolic disorders, liver disease, hypertension, heart and lung
disease, gastrointestinal disease, urinary retention, hematological disease, thrombophilia or other coagulopathy, musculoskeletal disorders, neurological disorders,
convulsions, kidney disorders, rheumatic disorder, malignant neoplasm/cancer
Table 7 Concomitant non-psychiatric medication at
baseline (FAS, N = 642)
Medication n (%)
None 502 (78.44%)
Statins 12 (1.88%)
Other hypolipidemic drugs 8 (1.25%)
Beta-blockers 62 (9.69%)
Diuretics 24 (3.75%)
Ca-antagonists 10 (1.56%)
ACE-inhibitors 32 (5.00%)
Angiotensin-II-antagonists 2 (0.31%)
Other antihypertensive drugs 22 (3.44%)
Insulins 9 (1.41%)
Oral anti-diabetic drugs 23 (3.59%)
Oral corticosteroids 1 (0.16%)
Corticosteroid inhalants 3 (0.47%)
Abbreviations: ACE-inhibitors = angiotensin-converting enzyme inhibitors; FAS
= full analysis set
Kraemer et al. BMC Psychiatry 2011, 11:173
/>Page 6 of 11
concomitant disease and practically all laboratory para-
meters than any other Prev-AP cohort, but had a com-
paratively higher symptom severity at baseline (mean
CGI-S 4.2).
ApartfromPrev-None,thePrev-APcohortsdidnot
contrast clearly with respect to baseline values; the high-
est percentages of patients with laboratory values out o f
normal range dispersed in different treatment groups for
different parameters (see Table 8). This possibly reflec ts
that changes in metabolic parameters may occur in
patients treated with any antipsychotic medication,
though these may differ in grade and type according to
Table 8 Laboratory test: patients with values out of the laboratory test reference range at baseline (Prev-AP, FAS, N =
642)
Blood-Test Limit* Prev-Olz Prev-Risp Prev-Quet Prev-Atyp Prev-Typ Prev-Comb Prev-None FAS, total
N = 62 N = 67 N = 49 N = 103 N = 90 N = 109 N = 162 N = 642
HbA
1c
≥6% n 5 4 5 6 18 15 9 62
% 8.1 6.0 10.2 5.8 20.0 13.8 5.6 9.7
Glucose ≥115 mg/dL n 5 10 9 16 17 25 8 90
% 8.1 14.9 18.4 15.7 18.9 23.2 4.9 14.1
Triglyceride ≥150 mg/dL n 42 32 28 62 47 66 60 337
% 67.7 47.8 57.1 60.2 52.2 60.6 37.0 52.5
HDL-Cholesterol ≤40 mg/dL n 9 9 10 12 10 12 11 73
% 14.5 13.4 20.4 11.7 11.1 11.0 6.8 11.4
C-reactive protein ≥3 mg/L n 22 31 20 39 35 50 54 251
% 35.5 46.3 40.8 37.9 38.9 45.9 33.3 39.1
Abbreviations: BMI = body mass index; FAS = full analysis set; HbA
1c
= glycated hemoglobin; HDL = high density lipoprotein; Prev-AP = previous antipsychotic
treatment cohort
* cutoffs as specified by laboratory
Table 9 Prevalence of metabolic syndrome according to
NCEP-ATP III and AHA/NHLB definitions by previous
antipsychotic treatment at baseline, Prev-AP, FAS, N =
642
NCEP-ATP III
Cohort N n % 95% CI
Missing 4 0.6 -
Prev-Olz 62 30 48.4 35.5 to 61.4
Prev-Risp 66 25 37.9 26.2 to 50.7
Prev-Quet 49 23 46.9 32.5 to 61.7
Prev-Atyp 102 45 44.1 34.3 to 54.3
Prev-Typ 90 38 42.2 31.9 to 53.1
Prev-Comb 107 52 48.6 38.8 to 58.5
Prev-None 162 34 21.0 15.0 to 28.1
Total 638 247 38.7 34.9 to 42.6
AHA/NHLB
Cohort N n % 95% CI
Missing 4 0.6 -
Prev-Olz 62 30 48.4 35.5 to 61.4
Prev-Risp 66 28 42.4 30.3 to 55.2
Prev-Quet 49 25 51.0 36.3 to 65.6
Prev-Atyp 102 50 49.0 39.0 to 59.1
Prev-Typ 90 39 43.3 32.9 to 54.2
Prev-Comb 107 61 57.0 47.1 to 66.5
Prev-None 162 40 24.7 18.3 to 32.1
Total 638 273 42.8 38.9 to 46.7
Abbreviations: AHA/NHLB = American Heart Association/National Heart, Lung
and Blood Institute
CI = confidence interval, FAS = full analysis set; NCEP-ATP III = National
Cholesterol Education Program, Adult Treatment Panel 3
rd
report; Prev-AP =
previous antipsychotic treatment
Table 10 Prevalence rates of MetS according AHA/NHLB
definition by new antipsychotic treatment, at baseline
and after 3 months, (New-AP, CMD-set, N = 476)
Visit 1 (Baseline)
Cohort N n % 95% CI
New-Olz 206 79 38.4 31.7 to 45.4
New-Risp 69 24 34.8 23.7 to 47.2
New-Quet 33 18 54.6 36.4 to 71.9
New-Atyp 72 34 47.2 35.3 to 59.4
New-Typ 16 12 75.0 47.6 to 92.7
New-Comb 80 44 55.0 43.5 to 66.2
CMD-total 476 211 44.3 39.8 to 48.9
Visit 2 (month-3)
Cohort N n % 95% CI
New-Olz 206 93 45.2 38.2 to 52.2
New-Risp 69 34 49.3 37.0 to 61.6
New-Quet 33 16 48.5 30.8 to 66.5
New-Atyp 72 34 47.2 35.3 to 59.4
New-Typ 16 11 68.8 41.3 to 89.0
New-Comb 80 48 60.0 48.4 to 70.8
CMD-total 476 236 49.6 45.0 to 54.2
Abbreviations: AHA/NHLB = American Heart Association/National Heart, Lung
and Blood Institute
CI = confidence interval, CMD = complete metabolic data; MetS = metabolic
syndrome; NCEP-ATP III = National Cholesterol Education Program, Adult
Treatment Panel 3rd report; New-AP = new antipsychotic treatment
Kraemer et al. BMC Psychiatry 2011, 11:173
/>Page 7 of 11
the properties of the respective substance and the
patients’ individual risk factors.
The prevalence of MetS in the FAS of 42.8% (AHA/
NHLB definition) at baseline was comparable to the
findings from the CATIE study, which reported a base-
line MetS prevalence of 42.7% in an US-American sam-
ple of patients with schizophrenia [28].
The Prev-AP cohorts who had received some previous
antipsychotic treatment showed no statistically signifi-
cant differences in MetS-rates (AHA/NHBL). However,
patients who entered our study untreated (Prev-None)
had a baseline MetS prevalence of 24.7%, which was sig-
nificantly lower than in any other cohort but Prev-Risp
(42.4%, bu t overlapping CI). For comparison, Moebus et
al. [30] reported a Met S prevalence rate of 28.6 ± 0.45%
(AHA/NHLB criteria) in a cross-sectional sample of
33,502 primary care patients in Germany. C onsidering
that Moebus’ patients had a higher mean age than our
study sample (53.0 ± 15.8 years in men and 50.9 ± 16.2
years in women versus 43.1 ± 13.1 and 47.3 ± 13.1
years, respectively, in our study), the prevalence of MetS
in the Prev-None cohort appears to resemble the rates
seen in primary care patients.
Considering the changes in MetS prevalence, the dif-
ferences between baseline and month-3 lacked signifi-
cance for all New-AP groups. Though, looking at the
mean change of the particular MetS -components, a
trend to increase was apparent in lipids, which co uld be
a possible early predictor.
The results from logistic regression models at visit 2
indicate that the factors “increased C RP“, “concomitant
somatic diseases“ ,and“ concomitant non-psychiatric
medication“ increased the odds to develop MetS, while
“female sex“ and “smoking“ decreased them. The fact ors
“concomitant somatic disease“ and “ concomitant non-
psychiatric medication“ are in par t comprised in the
MetS definitons, a nd CRP is an es tablished indicator of
cardiovascular risk [31, 32]. We did not expect, however,
to find that smoking decreased the odds for MetS; this
might possibly be an effect of the appetite reducing
properties of nicotine [33].
Regarding the lower MetS-odds for women, data from
the German general population [34] show w omen to
have a lower incidence of cardiovascular and cerebrovas-
cular events than men up to the age of 64, after which
the respective rates converge (cardiovascular) or even
Table 11 Change of metabolic syndrome components by post-baseline cohort, CMD-set, New-AP cohorts
CMD-set New-Olz New-Risp New-Quet New-Atyp New-Typ New-Com Total
N 206 69 33 72 16 80 476
Waist (cm) Mean 2.2 1.6 -1.4 -0.2 -1.2 0.8 1.1
SD 7.9 5.8 3.5 5.3 4.3 6.0 6.7
Median 1.0 0.0 0.0 0.0 0.0 0.0 0.0
Triglycerides (mkg/dL) Mean -4.1 35.2 23.5 -4.1 -7.3 -8.9 2.6
SD 115.2 98.1 137.0 124.1 78.1 130.7 118.1
Median 8.5 23.0 6.0 4.5 -17.0 -7.5 6.0
HDL (mg/dL) Mean -0.1 -1.8 0.6 -0.8 0.5 0.7 -0.3
SD 9.2 11.1 10.4 8.7 6.0 9.5 9.5
Median -1.0 -1.0 -2.0 -2.0 -0.5 -0.5 -1.0
SBP (mmHg) Mean 1.5 2.8 -2.8 -4.1 1.2 -2.0 -0.1
SD 11.0 14.1 11.8 14.0 8.2 11.1 12.2
Median 0.0 0.0 0.0 0.0 2.0 0.0 0.0
DBP (mmHg) Mean 0.0 0.9 -0.4 -2.4 0.7 -1.3 -0.4
SD 8.1 9.3 9.9 9.2 6.4 8.5 8.6
Median 0.0 0.0 0.0 0.0 0.0 0.0 0.0
Glucose (mg/dL) Mean 0.5 2.6 3.7 2.1 0.6 -4.4 0.4
SD 26.4 30.4 65. 6 37.2 16.1 32.0 33.4
Median 2.0 0.0 4.0 1.5 2.0 0.5 1.0
CRP (mg/L) Mean 0.0 0.7 0.1 0.1 -2.7 -1.5 -0.2
SD 4.6 7.3 1.6 4.8 10.5 8.9 6.1
Median 0.0 0.0 0.0 -0.2 0.0 0.1 0.0
HbA
1c
(%) Mean 0.0 -0.1 -0.1 0.0 -0.1 0.0 0.0
SD 0.3 0.2 1.0 0.4 0.3 0.4 0.4
Median -0.1 -0.1 0.0 0.0 -0.1 0.0 0.0
Abbreviations: CRP = C-reactive protein; CMD = complete metabolic data; DBP = diastolic blood pressure; HbA
1c
= glycated hemoglobin, New-AP = new
antipsychotic treatment cohort; SBP = systolic blood pressure; SD = standard deviation, Waist = waist circumference
Kraemer et al. BMC Psychiatry 2011, 11:173
/>Page 8 of 11
bec ome inverted (cerebrovascular). The review of cardi-
ovascular risk factors in women by Evangelista and
MacLaughlin [35], comprising international data pub-
lished between 1990 and 2008, provided similar results.
Considering the age structure of our study sample (FAS:
mean age 45.2 years, Q1 36 years, Q3 54 years) our
results fit well into the general picture.
They do, however, con tradict the results from the
CATIE study: McEvoy et al. [28] reports MetS-preva-
lences of 36.0% in men and 51.6% in women (fasting
cohort, N = 689); the higher risk for MetS in women
was a universal fi nding in all age groups, races and
ethnicities. However, CATIE was a controlled clinical
trial, so apart from country specific confounders as
behavioral and dietary habits; possible selection bias
might have impacted the results.
Several limitations of this study should be co nsid ered:
As the study did not reach the required sample size, the
analyses were underpowered, and therefore logistic
regression models might have failed to detect all effects
associated with MetS. Furthermore, the observational
period of three months might have been too short to
observe certain changes in metabolic status as e.g. devel-
opment of insulin resistance or the processes leading
Table 12 Factors associated with MetS according to NCEP-ATP III criteria, results from univariate and multivariate
logistic regression, (CMD- set, N = 476)
Univariate logistic regression
Effect, Visit 1
Odds Ratio 95% CI p-Value
Age 1.03 1.02 to 1.05 <.0001
Time since first symptoms (years) 1.02 1.00 to 1.04 0.0399
Concomitant somatic disease: Y vs. N 4.83 3.09 to 7.53 <.0001
Non-psychiatric co-medication: Y vs. N 3.38 2.15 to 5.31 <.0001
Smoking status: Y vs. N 0.61 0.42 to 0.89 0.0107
CRP ≥3 mg/L vs. normal value 1.68 1.11 to 2.56 0.0151
Prev-Comb vs. Prev-None 3.56 1.89 to 6.70 <.0001
Prev-Olz vs. Prev-None 2.91 1.40 to 6.05 0.0043
Prev-Atyp vs. Prev-None 3.27 1.72 to 6.24 0.0003
Prev-Quet vs. Prev-None 3.74 1.73 to 8.09 0.0008
Prev-Risp vs. Prev-None 2.62 1.27 to 5.39 0.0091
Prev-Typ vs. Prev-None 3.07 1.59 to 5.91 0.0008
Effect, Visit 2 Odds Ratio 95% CI p-Value
Age 1.02 1.01 to 1.04 0.0042
Time since first symptoms (years) 1.03 1.01 to 1.04 0.0059
Concomitant somatic disease: Y vs. N No 3.98 2.57 to 6.19 <.0001
Non-psychiatric co-medication: Y vs. N No 2.67 1.71 to 4.16 <.0001
CRP ≥3 mg/L vs. normal value 2.36 1.58 to 3.51 <.0001
Prev-Comb vs. Prev-None 2.63 1.44 to 4.81 0.0017
Prev-Olz vs. Prev-None 2.63 1.30 to 5.33 0.0071
Prev-Atyp vs. Prev-None 2.07 1.11 to 3.85 0.0216
Prev-Quet vs. Prev-None 2.38 1.13 to 5.04 0.0232
Prev-Risp vs. Prev-None 2.16 1.08 to 4.33 0.0292
Prev-Typ vs. Prev-None 2.29 1.22 to 4.29 0.0098
Multivariate logistic regression
Effect, Visit 1
Odds Ratio 95% CI p-Value
Concomitant somatic disease: Y vs. N 4.09 2.37 to 7.06 <.0001
Smoking status: Y vs. N 0.53 0.32 to 0.86 0.0098
Effect, Visit 2 Odds Ratio 95% CI p-Value
CRP ≥3 mg/L vs. normal value 2.00 1.22 to 3.30 0.0062
Non-psychiatric co-medication: Y vs. N No: 1.98 0.98 to 4.04 0.0588
Concomitant somatic disease: Y vs. N No 1.83 0.93 to 3.61 0.0796
Sex: female vs. male 0.56 0.34 to 0.91 0.0185
Smoking status at visit 2: Y vs. N 0.60 0.37 to 1.00 0.0488
Abbreviations: CI = confidence interval; CMD = complete metabolic data; CRP = ; C-reactive protein; MetS = metabolic syndrome; N = No; NCEP-ATP III = National
Cholesterol Education Program, Adult Treatment Panel 3rd report; New-AP = new anti psychotic treatment cohort; Y = Yes
Kraemer et al. BMC Psychiatry 2011, 11:173
/>Page 9 of 11
eventually to increased CRP. Due to the observational
design, treatment cohorts were defined post-hoc,
depending on the actual case numbers treated with each
antipsychotic, and compounds which were less fre-
quently prescribed had to be grouped.
Conclusions
Nevertheless, the MetS-rates found in this German sam-
ple of schizophrenia patients confirm the notion that
MetS-prevalence is higher in patients with schizophrenia
compared to the general population, with rates increas-
ing with the duration of illness [36]. Even though three
mont hs seemin gly were too short to retrieve statistically
sound evidence on all possible risk factors, we observed
an early increase of triglyceride levels. Our results once
more emphasize how important the controlling of the
patients’ metabolic si tuation is in schizophrenia therapy
[37,38] irrespective of antipsychotic medication.
Acknowledgements and Funding
We wish to thank Mrs. Catherine Beal for supporting the statistical analysis,
and Mrs. Birgit Eschweiler, PhD, for drafting the methods and results sections
of this manuscript.
Research was funded by Lilly Deutschland GmbH, Bad Homburg, Germany.
Author details
1
Lilly Deutschland GmbH, Medical Department, 61352 Bad Homburg, Werner
-Reimers-Str. 2-4, Germany.
2
Institute for Clinical Research IKFE, 55116 Mainz,
Parcusstr. 8, Germany.
3
Kath. Marienkrankenhaus GmbH, Geriatrics Clinic,
22087 Hamburg, Alfredstr.9, Germany.
Authors’ contributions
SK supported the conduct of the study and contributed to the data analysis,
interpretation of data and writing of this report.
AM contributed to the data analysis, interpretation of data, and writing of
this report.
HPH, DK and TF contributed to the study design, interpretation of data, and
added scientific input to this report in form of comments. All authors
contributed to and have approved the final manuscript.
Competing interests
Susanne Kraemer, Anette Minarzyk, and Hans-Peter Hundemer are full-time
employees of Lilly Deutschland GmbH. Thomas Forst and Daniel Kopf are
members of an Eli Lilly advisory board and have received research funding
from Eli Lilly.
Received: 28 April 2011 Accepted: 1 November 2011
Published: 1 November 2011
References
1. Harris EC, Barraclough B: Excess mortality of mental disorder. Br J
Psychiatry 1998, 173:11-53.
2. Colton CW, Manderscheid RW: Congruencies in increased mortality rates,
years of potential life lost, and causes of death among public mental
health clients in eight states. Prev Chronic Dis 2006, 3:A42.
3. Tiihonen J, Lönnqvist J, Wahlbeck K, Klaukka T, Niskanen L, Tanskanen A,
Haukka J: 11-year follow-up of mortality in patients with schizophrenia: a
population-based cohort study. (FIN11 study). Lancet 2009,
374(9690):620-627.
4. Douglas IJ, Smeeth L: Exposure to antipsychotics and risk of stroke: self
controlled case series study. BMJ 2008, 337:a1227.
5. Brown S, Inskip H, Barraclough B: Causes of the excess mortality of
schizophrenia. Br J Psychiatry 2000, 177:212-217.
6. Newcomer JW: Antipsychotic medications: metabolic and cardiovascular
risk. J Clin Psychiatry 2007, 68(Suppl 4):8-13.
7. Ray WA, Chung C, Murray KT, Hall K, Stein M: Atypical antipsychitoc drugs
and the risk of sudden cardiac death. N Engl J Med 2009, 360:225-235.
8. Langfeldt G: The insulin tolerance test in mental disorders. Acta Psychiatr
Neurol Scand Suppl 1952, 80:189-199.
9. Kohen D: Diabetes mellitus and schizophrenia: historical perspective. Br J
Psychiatry 2004, 47:S64-S66.
10. Planansky K, Heilizer F: Weight changes in relation to the characteristics
of patients on chlorpromazine. J Clin Exp Psychopathol 1959, 20(1):53-57.
11. Thakore JH, Mann JN, Vlahos I, Martin A, Reznek R: Increased visceral fat
distribution in drug-naive and drug-free patients with schizophrenia. Int
J Obes Relat Metab Disord 2002, 26:137-141.
12. Strassnig M, Brar JS, Ganguli R: Nutritional assessment of patients with
schizophrenia: a preliminary study. Schizophr Bull 2003, 29(2):393-397.
13. Bobes J, Arango C, Garcia-Garcia M, Rejas J: Healthy lifestyle habits and
10-year cardiovascular risk in schizophrenia spectrum disorders: an
analysis of the impact of smoking tobacco in the CLAMORS
schizophrenia cohort. Schizophr Res 2010, 119(1-3):101-109.
14. Vancampfort D, Knapen J, Probst M, van Winkel R, Deckx S, Maurissen K,
Peuskens J, De Hert M: Considering a frame of reference for physical
activity research related to the cardiometabolic risk profile in
schizophrenia. Psychiatry Res 2010,
177(3):271-279.
15.
Gianfrancesco F, White R, Wang RH, Nasrallah HA: Antipsychotic-induced
type 2 diabetes: evidence from a large health plan database. J Clin
Psychopharmacol 2003, 23:328-335.
16. Casey DE: Dyslipidemia and atypical antipsychotic drugs. J Clin Psych
2004, 65(Suppl 18):27-35.
17. van Winkel R, Moons T, Peerbooms O, Rutten B, Peuskens J, Claes S, van
Os J, De Hert M: MTHFR genotype and differential evolution of metabolic
parameters after initiation of a second generation antipsychotic: an
observational study. Int Clin Psychopharmacol 2010, 25(5):270-276.
18. Grundy SM, Cleeman JI, Daniels SR, Donato KA, Eckel RH, Franklin BA,
Gordon DJ, Krauss RM, Savage PJ, Smith SC Jr, Spertus JA, Costa F:
Diagnosis and management of the metabolic syndrome: an American
Heart Association/National Heart, Lung, and Blood Institute Scientific
Statement. Circulation 2005, 112:2735-2752.
19. Expert Panel on Detection, and Treatment of High Blood Cholesterol in
Adults: Executive summary of the third report of the National.
Cholesterol Education Program (NCEP) expert panel on detection,
evaluation, and treatment of high blood cholesterol in adults (Adult
Treatment Panel III). JAMA 2001, 285:2486-2497.
20. Alberti KG, Zimmet P, Shaw J: IDF Epidemiology Task Force Consensus
Group. The metabolic syndrome - a new worldwide definition. Lancet
2005, 366(9491):1059-1062.
21. Deutsche Gesellschaft für Psychiatrie, Psychotherapie und Nervenheilkunde,
(ed): S3-Leitlinie Schizophrenie. Darmstadt, Germany; 2006.
22. NICE (National Collaborating Centre for Mental Health, National Institute of
Clinical Excellence): Schizophrenia: Core interventions in the treatment
and management of Schizophrenia in primary and secondary care.
Clinical Practice Guideline 82. NICE 2009 [ />pdf/CG82FullGuideline.pdf], (accessed 26 Jan 2010).
23. Consensus Statement: Consensus Development Conference on
Antipsychotic Drugs and Obesity and Diabetes. Diabetes Care 2004,
27(2):596-601.
24. Pfützner A, Forst T: High-sensitivity C-reactive protein as cardiovascular
risk marker in patients with diabetes mellitus. Diabetes Technol Ther 2006,
8:28-36.
25. Ryan MC, Collins P, Thakore JH: Impaired fasting glucose tolerance in first-
episode, drug-naive patients with schizophrenia. Am J Psychiatry 2003,
160:284-289.
26. Larsen ML, Høder M: Metabolic evaluation of non-insulin-dependent
diabetes in primary health care - the clinical usefulness of glycated
haemoglobin measurements. Scand J Prim Health Care 1989, 7(3):167-71.
27. Guy W, (ed): ECDEU Assessment Manual for Psychopharmacology.
Publication ADM 76-338 Washington, DC: US Department of Health,
Education and Welfare; 1976, 218-222.
28. McEvoy JP, Meyer JM, Goff DC, Nasrallah HA, Davis SM, Sullivan L,
Meltzer HY, Hsiao J, Scott Stroup T, Lieberman JA: Prevalence of the
metabolic syndrome in patients with schizophrenia: baseline results
from the Clinical Antipsychotic Trials of Intervention Effectiveness
Kraemer et al. BMC Psychiatry 2011, 11:173
/>Page 10 of 11
(CATIE) schizophrenia trial and comparison with national estimates from
NHANES III. Schizophr Res 2005, 80(1):19-32.
29. Gesundheitsberichterstattung des Bundes: Indikator 3.19 des
Indikatorensatzes der GBE der Länder: Häufigste Diagnosen in Praxen
von Allgemeinmedizinerinnen und -medizinern und praktischen
Ärztinnen und Ärzten (in % der Behandlungsfälle) nach Geschlecht,
Rang und Anteil, Nordrhein, ab. 2002 [ />abrechnung. prc_abr_test_logon?p_uid=gast&p_aid =
4711&p_sprache=D&p_knoten=TR200].
30. Moebus S, Hanisch JU, Neuhäuser M, Aidelsburger P, Wasem J, Jöckel KH:
Assessing the prevalence of the Metabolic Syndrome according to NCEP
ATP III in Germany: feasibility and quality aspects of a two step
approach in 1550 randomly selected primary health care practices. Ger
Med Sci 2006, 9:4.
31. Packard RR, Libby P: Inflammation in atherosclerosis: from vascular
biology to biomarker discovery and risk prediction. Clin Chem 2008,
54:24-38.
32. Torres JL, Ridker PM: Clinical use of high sensitivity C-reactive protein for
the prediction of adverse cardiovascular events. Curr Opin Cardiol 2003,
18(6):471-478.
33. Perkins KA, Epstein LH, Stiller RL, Fernstrom MH, Sexton JE, Jacob RG,
Solberg R: Acute effects of nicotine on hunger and caloric intake in
smokers and nonsmokers. Psychopharmacology (Berl) 1991, 103(1):103-109.
34. Gesundheitsberichterstattung des Bundes: Krankheiten/Gesundheits-
probleme.[ />prc_abr_test_logon?p_uid=gast&p_aid =
5813485&p_sprache=D&p_knoten=TR8500].
35. Evangelista O, Mc Laughlin MA: Review of cardiovascular risk factors in
women. Gend Med 2009, 6(Suppl 1):17-36.
36. De Hert M, van Winkel R, Van Eyck D, Hanssens L, Wambers M, Scheen A,
Peuskens J: Prevalence of diabetes, metabolic syndrome and metabolic
abnormalities in schizophrenia over the course of the illness: a cross-
sectional study. Clin Pract Epidemol Ment Health 2006, 2:14.
37. Larsen J, Holdrup M, Christensen B, Sigalin C, Nilsson PM, Kolb S:
Interventions in antipsychotics-treated patients with cardiometabolic risk
factors or metabolic syndrome. Eur Neuropsychopharmacol 2008, 18(Suppl
4):440-441.
38. Bobes J, Arango C, Aranda P, Carmena R, Garcia-Garcia M, Rejas J:
CLAMORS Study Collaborative Group. Cardiovascular and metabolic risk
in outpatients with schizophrenia treated with antipsychotics: results of
the CLAMORS Study. Schizophr Res 2007, 90(1-3):162-173.
Pre-publication history
The pre-publication history for this paper can be accessed here:
/>doi:10.1186/1471-244X-11-173
Cite this article as: Kraemer et al.: Prevalence of metabolic syndrome in
patients with schizophrenia, and metabolic changes after 3 months of
treatment with antipsychotics - results from a German observational
study. BMC Psychiatry 2011 11:173.
Submit your next manuscript to BioMed Central
and take full advantage of:
• Convenient online submission
• Thorough peer review
• No space constraints or color figure charges
• Immediate publication on acceptance
• Inclusion in PubMed, CAS, Scopus and Google Scholar
• Research which is freely available for redistribution
Submit your manuscript at
www.biomedcentral.com/submit
Kraemer et al. BMC Psychiatry 2011, 11:173
/>Page 11 of 11